Back to Journals » OncoTargets and Therapy » Volume 14
Identification of NUTF2 as a Candidate Diagnostic and Prognostic Biomarker Associated with Immune Infiltration in Head and Neck Squamous Cell Carcinoma
Received 18 September 2021
Accepted for publication 10 December 2021
Published 22 December 2021 Volume 2021:14 Pages 5455—5467
DOI https://doi.org/10.2147/OTT.S337469
Checked for plagiarism Yes
Review by Single anonymous peer review
Peer reviewer comments 3
Editor who approved publication: Dr Federico Perche
Rui Zhang,1 Ying Gao2
1Department of Orthodontics, First Hospital of Shanxi Medical University, Shanxi Medical University, Taiyuan, 030001, Shanxi, People’s Republic of China; 2Department of Oral Medicine, First Hospital of Shanxi Medical University, Shanxi Medical University, Taiyuan, 030001, Shanxi, People’s Republic of China
Correspondence: Rui Zhang Tel +8615035687198
Email [email protected]
Background: Head and neck squamous cell carcinoma (HNSC) is one of the most common tumors worldwide. Nuclear transport factor 2 (NUTF2) plays a key role in cell death and immune processes. However, few reports have studied correlations between NUTF2 gene expression and the occurrence and development of HNSC.
Methods: The expression of NUTF2 was analyzed using publicly available databases, including the Cancer Genome Atlas and Human Protein Atlas and Gene Expression Omnibus (GEO) database, which was validated by RT-PCR. We evaluated the functions of NUTF2 with Kaplan–Meier curve, logistic regression were used to study the relationship between clinicopathological features and the expression of NUTF2. Cox regression analyses were used to identify the effects of NUTF2 expression on survival. Gene Ontology and Gene Set Enrichment Analysis were used to explore relevant biological pathways. The relationship between NUTF2 and tumor-infiltrating immune cells was investigated with on-line bioinformatic tools.
Results: NUTF2 was significantly upregulated in HNSC lesions and is associated with tumor size (P < 0.01). Increased expression of NUTF2 was linked to shorter overall and progress-free survival in HNSC. Cox regression analyses revealed that NUTF2 is an independent prognostic factor in HNSC. GSEA analysis demonstrated that NUTF2 negatively regulates several immune pathways. NUTF2 was correlated with the infiltrating levels of B cells and CD8+ T cells and was negatively correlated with diverse immune marker sets in HNSC.
Conclusion: NUTF2 is highly expressed in HNSC and correlates with poor prognosis. Correlation with immune functions suggests that NUTF2 may serve as a biomarker and therapeutic target for HNSC.
Keywords: NUTF2, head and neck squamous cell carcinoma, immune infiltration, prognostic biomarker
Introduction
Head and neck squamous cell carcinoma (HNSC) is the seventh most common cancer in the world, with approximately 880,000 new cases each year. HNSC includes cancers of the hypopharynx, oropharynx, lips, mouth, nasopharynx, nose, tongue and throat.1 Smoking and alcohol consumption are considered to be the most common risk factors, accounting for 75% of HNSC.2 Surgical resection, radiotherapy and chemotherapy are effective methods for the treatment of HNSC in some patients, but the prognosis in many cases of HNSC is still poor, as the 5-year survival rate remains lower than 50%.3 Therefore, there is an urgent need for research into new tumor markers and new therapeutic targets in HNSC.
One molecule with potential importance to HNSC is nuclear transport factor 2 (NUTF2), also known as NTF2, which has been shown to be involved in the progression of a variety of tumor types. NUTF2 interacts with both the small G protein RAN and nucleoporins that contain repeating FxFG motifs in order to promote the nuclear import of various protein clients.4 NUTF2 plays an important role in cell cycle progression and immune and apoptotic responses.5 During the process of nuclear transportation, NUTF2 and FxFG-containing nucleoporins interact to promote the formation of the nuclear pore complex (NPC).6
NUTF2 may be a potential tumor biomarker.7–9 Studies have shown that NUTF2 may play a concentration-dependent but important role in the nuclear size is sensitive to NUTF2 protein levels dependent on Ran binding import of p110 retinoblastoma protein.9 In addition, low expression of NUTF2 affects the size of the nucleus in melanoma cells.7 NUTF2 expression was upregulated in glioma tissues and promoted the proliferation, migration and invasion of glioma cells.8 While the concentration of NUTF2 is important in these cancer types, little is known about the role of NUTF2 in HNSC.
In this study, we analyzed the expression level of NUTF2 in HNSC and investigated its clinical implications based on the Cancer Genome Atlas (TCGA) database10 and Gene Expression Omnibus (GEO) database, we also confirmed the expression patterns with quantitative RT-PCR. We also analyzed the relationship between NUTF2 and clinicopathological characteristics of patients with HNSC and thus the prognostic value of NUTF2 expression in HNSC. We used Gene Ontology (GO) enrichment analyses and Gene Set Enrichment Analyses (GSEA) to explore the correlation of NUTF2 expression with immune pathways. Finally, we performed a preliminary exploration of the degree of correlation of NUTF2 expression with characteristics of the tumor immune microenvironment (TIM) in HNSC patients. The results of this study clarify the important role of NUTF2 in HNSC and show that it may serve as a new target for the diagnosis and treatment of HNSC.
Materials and Methods
Data Acquisition
Data quantifying the expression of NUTF2 mRNA in HNSC, as well as clinical information of the associated HNSC patients, were obtained from the Cancer Genome Atlas (TCGA) databases and the Genomic Data Commons. Files included data from 518 HNSC and 44 adjacent normal tissue samples. We also selected two datasets (GSE4161311 and GSE6585812) containing HNSC tissue and normal samples from the Gene Expression Omnibus (GEO) database.13 The online tool, the Human Protein Atlas (HPA), was used to detect NUTF2 protein expression in HNSC and matched normal tissues. Overall survival (OS) and disease-free survival (DFS) were calculated using Kaplan–Meier curve analyses. Relationships between NUTF2 expression and clinicopathological features were analyzed using logistic regression. Univariate and multivariate analyses were performed using Cox proportional hazard regression model to evaluate whether NUTF2 could be used as an independent prognostic factor for HNSC.
Cell Lines and Human Tissue Samples
HNSC cell lines (Cal-27, SCC-15 and SCC-25) and primary normal human oral keratinocytes (NHOK) were obtained from the Institute of Biochemistry and Cell Biology of the Chinese Academy of Sciences (Shanghai, China). These cells were grown in Roswell Park Memorial Institute-1640 medium (RPMI-1640; Gibco, Waltham, MA, USA) containing 10% fetal bovine serum (FBS, Gibco) and 1% penicillin and streptomycin at 37°C and 5% CO2. Human tumor tissues and their paired adjacent noncancerous samples (n = 19) were collected from First Hospital of Shanxi Medical University (Shanxi, China) from January 2017 to January 2020. The anatomical sites of the enrolled samples included mouth, tongue, nasopharynx, and oropharynx. All samples were from patients who had not been treated with chemotherapy or radiotherapy before surgery. All collection procedures were approved by the Ethics Committee of Shanxi Medical University, and the study was performed in accordance with the World Medical Association Declaration of Helsinki. Written informed consent was obtained from all the patients.
Quantitative RT-PCR
Total RNA was extracted with TRIzol reagent (Invitrogen) according to the manufacturer’s instructions and transcribed into cDNA. The amount of specific cDNA present was determined in real-time PCR assays using a SYBR Green kit (Roche). The primers were as follows: NUTF2 Forward: 5ʹ-CAGCCCCTCGGGTCTCC and Reverse: 5ʹ -AGCTATCTGGAGTGGGCTGA; and GAPDH Forward: 5ʹ-TGGCTTCATAGGTGACTTCCA and Reverse: 5ʹ -AAGGACCTGTCTAGGTTTGATGC.
Western Blot Analysis
Cells were washed with cold PBS and lysed in RIPA buffer in 4°C. Protein Samples (30 mg) were separated on 8% SDS– PAGE gel and transferred to PVDF membranes at (250 mA, 2 h). Membranes were blocked in 5% fat-free milk in TBST for 1 h at room temperature and incubated with appropriate diluted primary antibodies GAPDH (Sungene Biotech, Tianjin, China, KM9002, 1: 5000), NUTF2 (Abcam, ab254146, 1: 1000) were used for staining overnight at 4°C, then washed 10 min three times by cold PBS, and incubated with HRP-conjugated antibody for 1 h at room temperature, washed 10 min three times. The blots were developed in ECL mixture and visualised by Image.
Transfection
NUTF2-siRNA (SC-36105) and non-target siRNA were purchased from Santa Cruz Biotechnology Company. The cells were plated on six-well plates and were transfected using 8 μL of the required siRNA (20 μM) together with 8 μL Lipofectamine 2000 according to the manufacturer’s instructions.
MTT Assay
The anti-proliferative effects of NUTF2 knockdown were determined by MTT assay. Cells were plated onto 24-well plates. At various time points indicated, MTT solution (Promega, Madison, WI) was added onto cells for 2 h, then media were removed, DMSO was used to dissolve the MTT salt, and ODs were measured at 570 nm.
Flow Cytometry
Cell apoptosis was analyzed by flow cytometry. HNSC cellline SCC-25 infected with NUTF2-siRNA, or negative controls were trypsinized and resuspended. Annexin V-APC was added to stain in the dark for 15 min, and the percentage of cellular phase was determined by flow cytometry to evaluate the rate of apoptosis.
Enrichment and GO Function Analyses
The LinkedOmics platform was used to identify genes that are co-expressed with NUTF2in HSNC.14 GO functional analyses were performed with the R package “clusterProfiler” (V3.14.0),15 where values with P values less than 0.05 and false discovery rates less than 0.05 were considered to be statistically significant.
GSEA (version 4.0.3), a Java desk application, was used to determine differences in biological pathways between two groups that were classified relative to the median expression of NUTF2.16 The file h.all.v7.1.symbols.gmt was used as a reference gene set. The result was calculated after 1000 cycles. A series of gene sets were selected based on the standard P value less than 0.05 and false discovery rate less than 0.25.
Immune Score and Stromal Score Analysis
Estimation of STromal and Immune cells in MAlignant Tumor tissues using Expression data (ESTIMATE) is a public source algorithm for predicting and estimating infiltrating immune and stromal cells in tumor tissues based on gene expression profiles.17 In this study, we estimated the stromal scores and immune scores based on specific biomarkers associated with the infiltration of stromal and immune cells in HNSC tumor samples, and we analyzed the relationships between NUTF2 expression and the stromal and immune scores.
Immune Cell Infiltration Analysis
The Tumor IMmune Estimation Resource (TIMER) algorithm is a web portal that permits evaluation of the degree of immune cell infiltration and provides a systematic analysis of immune infiltrates across diverse cancer types.18 We investigated the relationship between NUTF2 expression and the abundance of tumor-infiltrating immune cells, including CD4+ T cells, CD8+ T cells, B cells, neutrophils, dendritic cells and macrophages, in HNSC. Moreover, correlations between NUTF2 expression and tumor-infiltrating immune cell gene markers were also detected via correlation modules.
Statistical Analysis
All analyses were conducted on R software (version 4.0.4). The association between the expression level of NUTF2 in HNSC samples and OS and progression-free survival (PFS) were assessed using a Kaplan–Meier plot. Univariate and multivariate survival analyses were performed using a Cox proportional hazard regression model.
Results
The Expression Profile of NUTF2 in HNSC
The TCGA pan-cancer RNA-seq datasets revealed that NUTF2 was significantly up-regulated in multiple cancers, including head and neck squamous cell carcinoma (HNSC) (Figure 1A and B), bladder urothelial carcinoma (BLCA), breast invasive carcinoma (BRCA), cholangiocarcinoma (CHOL), colon adenocarcinoma (COAD), esophageal carcinoma (ESCA), kidney chromophobe (KICH), kidney renal papillary cell carcinoma (KIRP), liver hepatocellular carcinoma (LIHC), lung adenocarcinoma (LUAD), lung squamous cell carcinoma (LUSC), prostate adenocarcinoma (PRAD), rectum adenocarcinoma (READ), stomach adenocarcinoma (STAD), thyroid carcinoma (THCA), uterine corpus endometrial carcinoma (UCEC) and uterine corpus endometrial carcinoma (UCEC) (Figure 1A). Interestingly, in TCGA datasets, a lower expression of NUTF2 was observed in human papilloma virus-positive tumors than in negative samples (Figure 1A, P < 0.001).
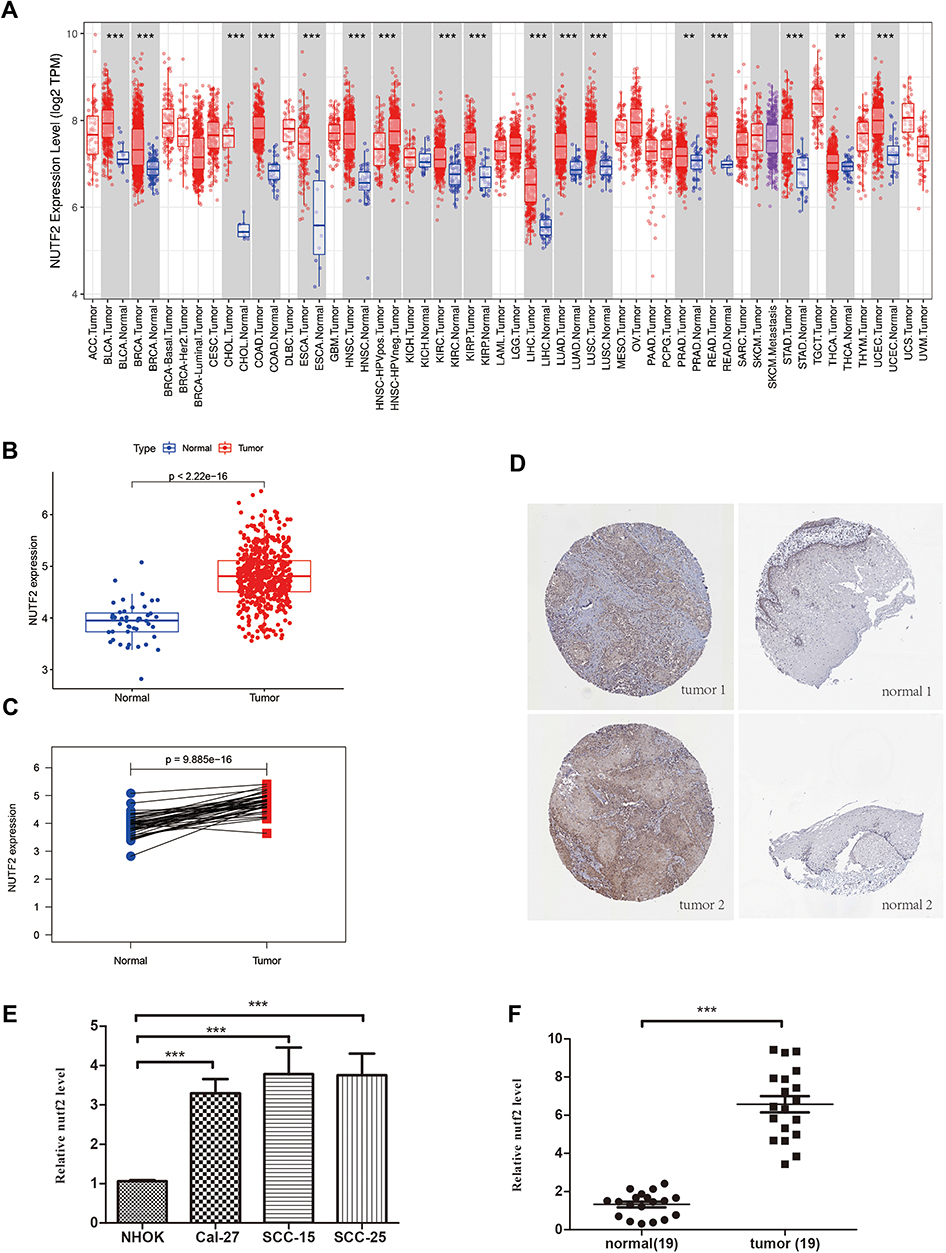 |
Figure 1 The different NUTF2 expression in multiple cancers. (A) The different NUTF2 expression in TCGA Pan-cancer samples including tumor and normal tissues analyzed by TIMER database (“**” indicates a P -value ≤0.01, “***” indicates a P -value ≤0.001). (B) Scatter plot shows the differential expression of NUTF2 gene in HNSC tissues (N = 518) and tumor-adjacent normal tissues (N = 44). (C) Paired plot shows the differential expression of NUTF2 gene in HNSC and tumor-adjacent normal tissues (N = 13) (p<0.001). (D) Expression of NUTF2 proteins in different tumor tissues and paired normal tissues in HNSC by HPA. (E) Expression of NUTF2 mRNA in HNSC cell lines and non-cancerous cell line (F) Expression of NUTF2 mRNA in HNSC tumor samples and adjacent non-cancerous tissues. |
In addition, tumor sections from patients with HNSC demonstrated a higher expression of NUTF2 than paired normal tissues (Figure 1C; P < 0.001). Representative immunohistochemistry images available from HPA also confirm that NUTF2 protein expression is moderately higher in tumor samples than in normal samples (Figure 1D).
In order to further evaluate the expression level of NUTF2 in HNSC tissue, we performed quantitative RT-PCR to compare mRNA levels between a non-cancerous cell line (NHOK) and various HNSC cell lines, including Cal-27, SCC-15 and SCC-25. As shown in Figure 1E, NUTF2 mRNA expression was significantly higher in HNSC cell lines than in NHOK cells (Cal-27 vs NHOK, P = P < 0.001; SCC-15 vs NHOK, P < 0.001; SCC-25 vs NHOK, P < 0.001). We also quantified the expression of NUTF2 mRNA in tumor samples and adjacent non-cancerous tissues from 19 patients with HNSC. The expression of NUTF2 was significantly higher in tumor tissues relative to normal tissues (Figure 1F, P < 0.001). We also performed Western blot analysis to compare protein levels between a non-cancerous cell line (NHOK) and HNSC celllines, its shows that NUTF2 protein expression was significantly higher in HNSC cell lines than in NHOK cells (Figure S1A). We knockdown NUTF2 protein expression by special Si-RNA in SCC-25 cells (Figure S1B) and found that cell proliferation ability were decreased and cell apoptosis rate were increased after transfection (Figure S1C and D).
NUTF2 Overexpression Predicts Poor Prognosis in HNSC
Next, we sought to determine the value of NUTF2 expression levels for the prediction of patient outcomes. Survival analyses were conducted based on survival time (OS and PFS) and expression of NUTF2 mRNA. The Gene Expression Profiling Interactive Analysis (GEPIA)19 website was used to perform a Kaplan–Meier analysis. This analysis demonstrated that in HNSC, a group associated with high expression of NUTF2 was significantly associated with poor OS (P < 0.0001; HR = 1.7) and poor DFS (P = 0.002 HR = 1.7) as compared with a group characterized by low expression (Figure 2A and B).
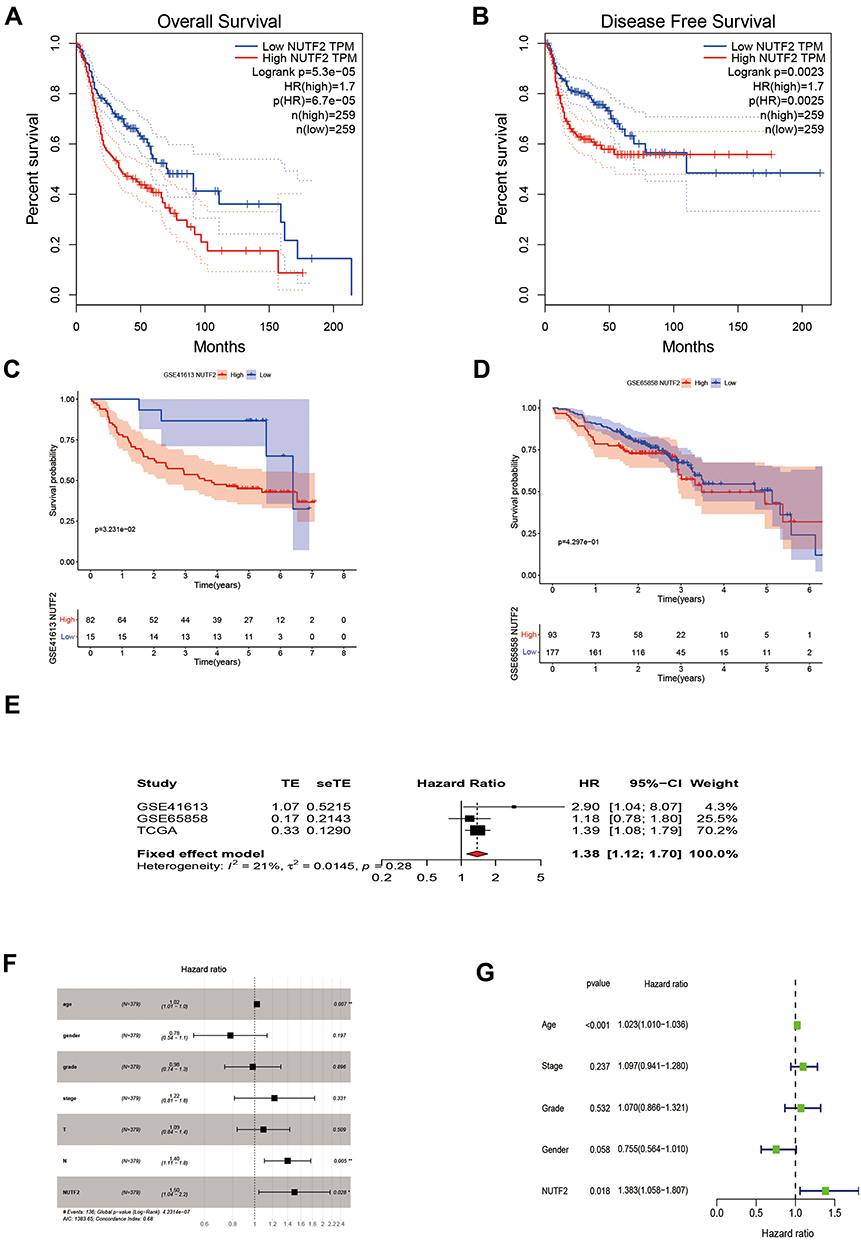 |
Figure 2 The prognostic potential value of NUTF2 in head and neck squamous cell carcinoma (HNSC). (A) Overall survival (OS) and (B) disease-free survival (DFS) of two different expression levels of NUTF2 in HNSC from GEPIA. Overall survival of two different expression levels of NUTF2 in HNSC from Gene Expression Omnibus database (GSE41613 (C) and GSE65858 (D)). (E) Meta-analysis of prognosis in patients with HNSC. Univariate Cox regression analysis (F) and multivariate Cox regression analysis (G) of prognostic potential value of NUTF2 (“*” indicates a P -value ≤0.05, “**” indicates a P -value ≤0.01). |
Further, we downloaded data from the Gene Expression Omnibus database (GSE41613 and GSE65858) to analyze the OS associated with different levels of NUTF2 expression in HNSC tissues. The results were consistent with the analysis from GEPIA that NUTF2-high expression group had poor OS (GEO41613:P = 0.032, HR = 0.346 and GEO65858:P = 0.429, HR = 0.847) in HNSC (Figure 2C and D). A meta-analysis was performed on these results (Figure 2E). Because the I2 value was less than 50% (I2 = 21%) and the value of P was greater than 0.05 (P = 0.28), we chose a fixed effect model. The results of this meta-analysis were visualized using a forest plot and suggest that NUTF2 is indeed a high-risk gene in HNSC (HR = 1.38; 95% CI: 1.12–1.70).
Logistic regression analyses similarly showed that the expression of NUTF2 in HNSC was only correlated with tumor size (T2 vs T1: OR = 0.327, P = 0.031; T3 vs T1: OR = 0.368, P = 0.026; T4 vs T1: OR = 0.310, P = 0.016) and HPV Status (Positive vs Negative: OR = 0.311, P = 0.008), with age (≥65 vs <65: OR = 1.092, P = 0.622), gender (male vs female: OR = 1.154, P = 0.478), clinical stage (stage II vs stage I: OR = 0.969, P = 0.901; stage III vs stage I: OR = 0.927, P = 0.775; stage IV vs stage I: OR = 1.055, P = 0.855), lymph node metastasis (N1+2 vs N0: OR = 0.981, P = 0.947), distant metastasis (M1 vs M0: OR = 0.765, P = 0.986), or Smoking (Smoking vs No Smoking: OR = 1.041, P = 0.848) (Table 1).
 |
Table 1 Relationship Between Clinical Features and NUTF2 Expression in HNSC Patients (Logistic Regression) |
A univariate Cox regression analysis showed that age (HR, 1.02; 95% CI, 1.01–1.0; P = 0.007), lymph node metastasis (HR, 1.40; 95% CI, 1.11–1.80; P = 0.005), and high NUTF2 expression (HR, 1.50; 95% CI, 1.04–2.20; P = 0.028) were important predictors of survival (Figure 2F). A multivariate Cox regression analysis demonstrated that age (HR, 1.023 95% CI, 1.010–1.036; P < 0.001) and high NUTF2 expression (HR, 1.383; 95% CI, 1.058–1.807; P = 0.018) were both independent prognostic factors in HNSC and thus predictors of poor overall survival in HNSC cases (Figure 2G).
The results demonstrate that the expression level of NUTF2 is a factor that can strongly and independently predict OS and DFS of patients with HNSC and holds important value in identifying high-risk HNSC patients.
GO Analysis and GSEA Identifies a NUTF2-Associated Immune Signature
To investigate the underlying mechanisms of the involvement of NUTF2 in HNSC, TCGA databases were accessed through an online portal, LinkedOmics,14 to analyze the genes associated with NUTF2 in HNSC. The resulting volcano map shows that there is a correlation between 6512 significant genes and NUTF2in HNSC as determined by a Pearson test (Figure 3A). Similarly, heat maps show the top 50 genes in HNSC that are negatively and positively correlated with NUTF2 (Figure 3B and C).
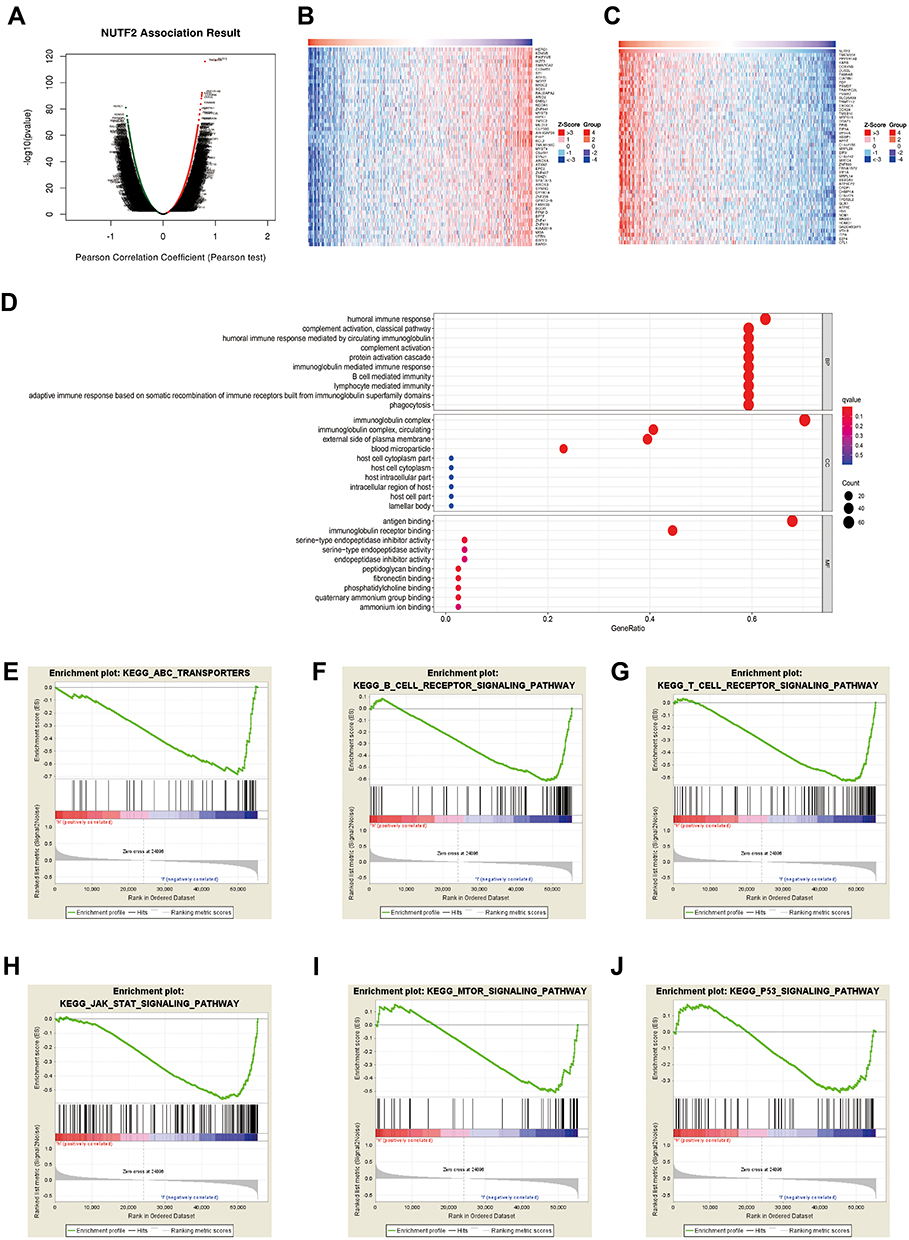 |
Figure 3 The biological process associated with NUTF2 in head and neck squamous cell carcinoma (HNSC). (A) The global NUTF2 significantly correlated genes in the HNSC cohort were identified by LinkedOmics. Heatmaps showing top 50 genes positively (B) and negatively (C) correlated with NUTF2 in HNSC. Red dot, positively correlated gene; blue dot, negatively correlated genes. (D) GO enrichment analysis of significantly NUTF2 related genes GSEA results enriched in NUTF2-high expression group vs NUTF2-low expression group (E–J). |
A GO enrichment analysis predicted the functional roles of target genes on the basis of three aspects, including biological process, cellular component and molecular function. We found that humoral immune response, immunoglobulin mediated immune response, B cell-mediated immune response and lymphocyte-mediated immune response were regulated by NUTF2 in HNSC (Figure 3D). The associated genes were largely related to immunoglobulin complexes, and the gene products were mostly located on the external side of the plasma membrane (Figure 3D). The molecular functions of associated gene products tended to be related to antigen binding and immunoglobulin receptor binding (Figure 3D).
GSEA of the TCGA dataset was performed to further clarify the impact of NUTF2 on immune function in HNSC. Genes associated with decreased expression of NUTF2 were mainly enriched in several immune-related processes and pathways, including the ATP-binding cassette transporter pathway, the T cell receptor signaling pathway,20 the B cell receptor signaling pathway,21 the JAK-STAT signaling pathway,22 the P53 signaling pathway and the Akt-mTOR signaling pathway. These associations demonstrate that NUTF2 is likely to be involved in immunosuppression in HNSC patients (Figure 3E–J).
NUTF2 Expression is Associated with Immune Cell Infiltration in HNSC
In order to assess the immunological role NUTF2 plays in HNSC, we further investigated its association with immune and stromal cell infiltration in HNSC. First, we analyzed the association of immune score, stromal score and NUTF2 expression. The findings indicated that NUTF2 expression has negative correlations with immune score (R = −0.22; P < 0.0001) and stromal score (R = −0.17; P < 0.0001) (Figure 4A and B), which implied that it has a notable impact on levels of infiltration of stromal and immune cells.
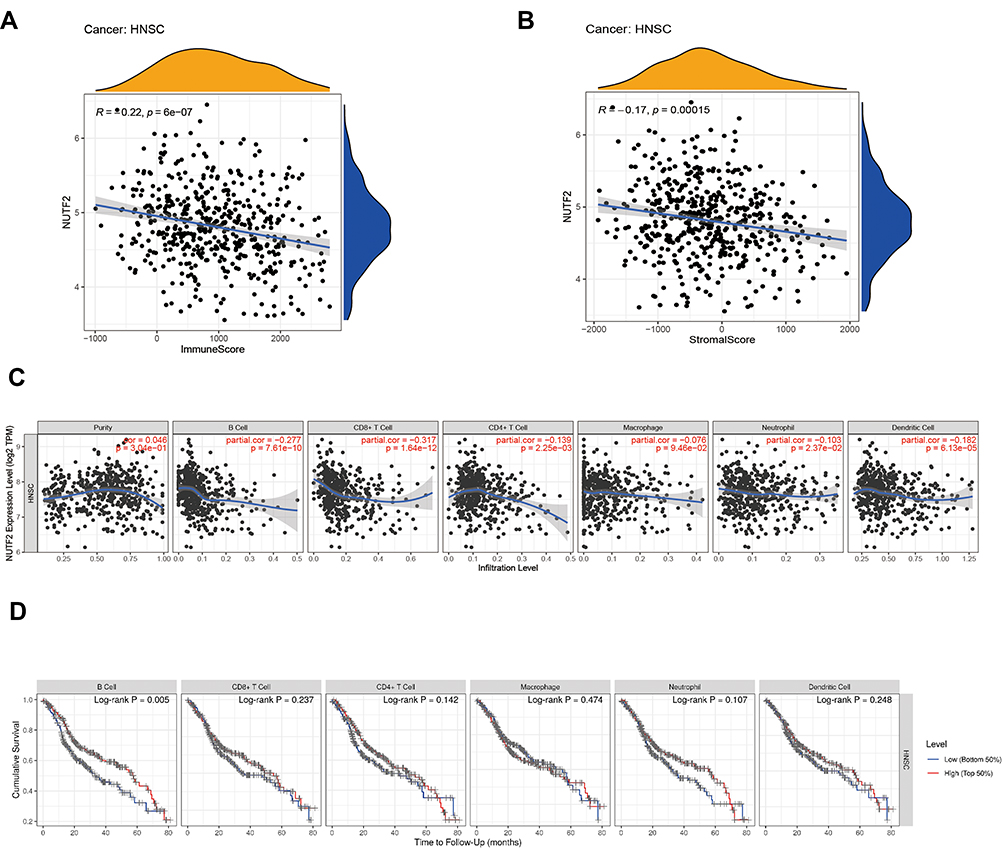 |
Figure 4 The Correlation analysis of immune infiltration with NUTF2 expression in HNSC. Immune score (A) and stromal score (B). The association between NUTF2 expression and tumor infiltration immune cells (C). Overall survival (OS) of different immune cells expression in HNSC (D). |
To better understand the profile of immune infiltration in HNSC, which is associated with NUTF2 expression, we analyzed the correlation between NUTF2 expression and 6 types of immune cells using a Spearman test in the TIMER database. Here, the results showed that NUTF2 expression was negatively correlated with B cells (R = −0.277; P < 0.0001) and CD8+ T cells (R = −0.317; P < 0.0001) (Figure 4C). Interestingly, TIMER also shows that B cells low-expression patients and CD8+ T cells low-expression patients with a poor OS (B cells: P = 0.005, and CD8+ T: P = 0.237) (Figure 4D). These results suggest that NUTF2 may have a potential regulatory role in the polarization of B cells and CD8+ T cells into tumor-associated immune infiltration, which contributes to HNSC.
In order to further study the relationship between NUTF2expression and tumor-infiltrating immune cells in HNSC, we used the TIMER database to detect the immune markers of T cells, CD8 + T cells, B cells, monocytes, neutrophils, natural killer cells, tumor-associated macrophages, M1 and M2 macrophages and dendritic cells in HNSC. In addition, we also analyzed T cells with different functions, such as Th1 cells, Th2 cells, Th17 cells and depleted T cells. The results showed that the expression level of NUTF2 in tumor tissues was closely related to most of the immune marker sets of immune cells (Table 2). Notably, we showed moderate correlations of NUTF2 expression in HNSC with the following antigens: CD8A and CD8B of CD8+ T cells; CD3D, CD3E and CD2 of general T cells; CD19 and CD79A of B cells; NOS2 of M1 macrophages; CCR7 of neutrophils; KIR3DL2 of natural killer cells; and TBX21 of Th1 cells (P < 0.001; 0.40 > correlation value ≥ 0.30). After adjustment for tumor purity, we found that CSF1R of monocytes; IL10 of tumor-associated macrophages; CCR7 of neutrophils; HLA-DPB1 of dendritic cells; and CTLA4 of exhausted T cell showed moderate correlations with NUTF2 expression in HNSC (P < 0.001; 0.40 > correlation value ≥ 0.30).
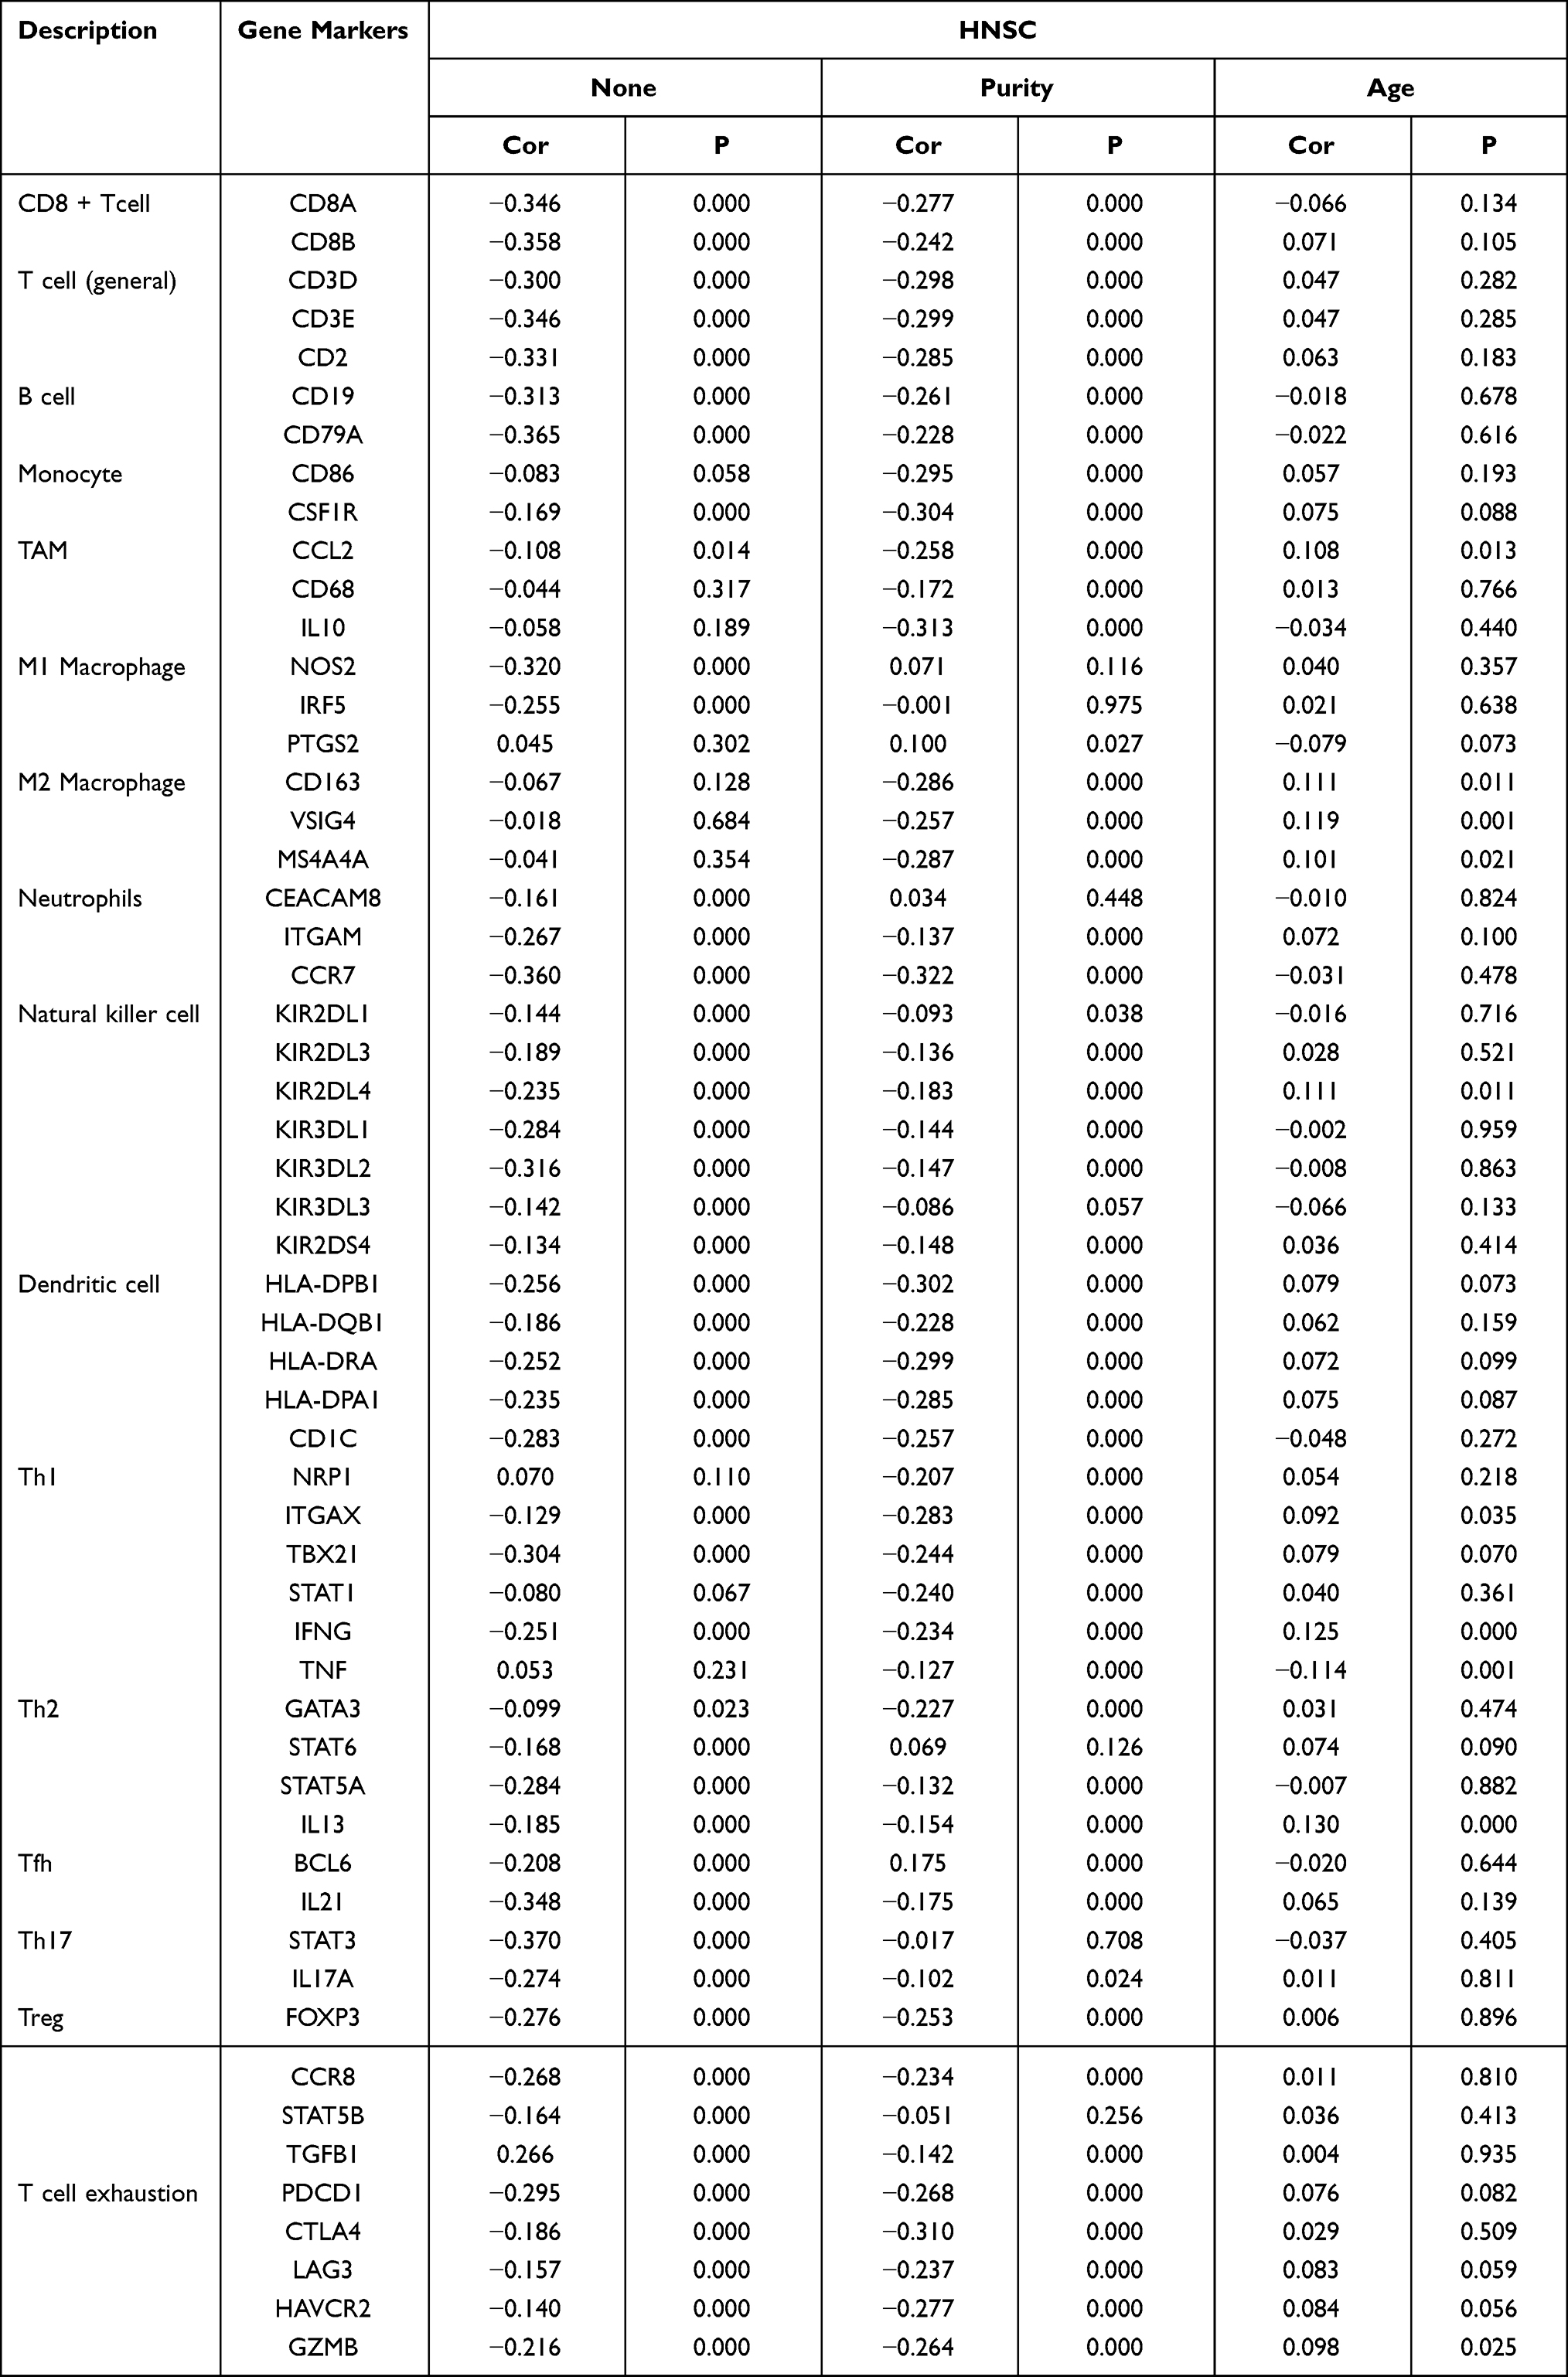 |
Table 2 Correlation Analysis Between NUTF2 and Related Genes and Markers of Immune Cells in TIMER |
Discussion
HNSC is a serious threat to human health because its early symptoms are not obvious, and most HNSC patients have already entered middle or late stages when they are diagnosed. Accordingly, the 5-year survival rate remains less than 50%. Abnormal gene expression may be involved in tumorigenesis and is associated with the prognosis of HNSC patients23–25 and early diagnosis of HNSC is key to improving OS, reducing DFS and reducing the risk of recurrence.26 Therefore, the discovery of potential biomarkers and the elucidation of the molecular mechanism of association will contribute to the early diagnosis and improve prognoses. Unfortunately, the molecular mechanisms leading to the development and progression of HNSC are still unclear.
It has been reported that NUTF2 is important for the nuclear localization of proteins in vivo, and the NUTF2 protein is concentrated near transport sites of the nuclear membrane.27 It is thus a factor involved in nuclear import and export. For example, it has been reported that the Bloom syndrome (BLM) protein enters the nucleus through B1, RAN and NUTF2-dependent pathways. BLM is a member of the DNA helicase family, and it plays important roles in DNA recombination, replication and repair.28 NUTF2 depletion by siRNA disrupts the accumulation of BLM protein in the nucleus.29 Previous studies have shown that the diagnosis and staging of cancer is based on the hierarchical growth of nuclear size,30 and it has been reported that RAN-recycling function of NUTF2 is involved in the regulation of nuclear size.5 The expression of NUTF2 thus may participate in the alteration of the nuclear size in cancer cells.7 However, no previous studies have reported on the diagnostic and prognostic value of NUTF2 in HNSC; therefore, the potential role of NUTF2 in HNSC was the focus of this study.
Here, we analyzed the expression of NUTF2 in HNSC tissue and normal tissue at both the protein and mRNA levels, and we found that the expression of NUTF2 was significantly increased in HNSC tissues compared with normal tissues, and we found that its overexpression was significantly related to tumor size. Tumor size is an important clinical indicator of tumor development, and it is closely related to the degree of malignancy and metastasis. Considering the clinicopathological parameters of TCGA data, high expression of NUTF2 is closely related to progression to the late T stage of HNSC. What is more, high expression of NUTF2 was significantly associated with poor prognosis and poor OS. Additionally, univariate and multivariate Cox analyses also revealed that NUTF2 expression was an independent prognostic factor in HNSC. All of these results suggest that NUTF2 may serve as an oncogene in HNSC.
To further investigate the underlying molecular functions and mechanisms of NUTF2 in HNSC, we performed GO function analysis and GSEA to explore the pathways enriched in HNSC samples with high or low NUTF2 expression. Results showed that several immune responses were significantly regulated by NUTF2 in HNSC, and several immune and inflammatory responses, including the ATP-binding cassette transport pathway, the T cell receptor signaling pathway, the B cell receptor signaling pathway, and the acute myeloid leukemia signaling pathway, were enriched in low NUTF2 phenotypes. These results indicate that NUTF2 is negatively associated with immune-related pathways in HNSC.
The occurrence and mechanisms of tumors are complex and multi-caused, among which immune-related mechanisms play a crucial role in the development of HNSC.31–33 In oncology, immunotherapy is a hot topic at present, which has shown remarkable results in HNSC, for example, pembrolizumab, have been applied to the first-line treatment of metastatic/recurrent HNSC patients.34 However, a large number of HNSC patients have failed to respond to immune checkpoint block (ICB) therapies.35 Thus, it is urgent to identify the appropriate subtypes of HNSC suitable for immune checkpoint therapy to amplify clinical benefit and enhance the antitumor effect.
Notably, NUTF2 is known to be involved in regulating the cell cycle,6 immune responses and apoptosis.36 Nuclear transport is considered to be a potential critical control point of apoptosis signaling cascades,37 and previous studies have shown that excessive NUTF2 can also partially protect cells from apoptosis.38 Inhibition of apoptosis and maintenance of activation of oncogenes may thus represent mechanisms linking NUTF2 expression to HNSC progression.
The tumor immune response is a process in which immune cells infiltrate into tumor tissue and induce apoptosis of tumor cells. In the early stages of cancer development, the body can clear the tumor cells through the immune monitoring function, and the tumor cells can also suppress the immune system through the immune editing function. Tumor cells may even escape the attack of the immune system through a variety of mechanisms. In this study, the results of the coexpression and TIMER analyses indicated that NUTF2 expression was negatively correlated with immune score and stromal score and moderately correlated with the presence of several immune infiltrating cells, such as B cells and CD8 + T cells, which are mainly involved in inflammation. These correlations may suggest potential mechanisms by which NUTF2 regulates immune cell function in HNSC.
In conclusion, NUTF2 may serve as a prognostic biomarker for HNSC and is associated with immune infiltration. It may also be a potential therapeutic target to improve HNSC patient outcomes. Meanwhile, considering that part of the analytical results of this study were obtained through mining sequencing data, there are several limitations of our work. First of all, HNSC consists of various types of cancers derived from different anatomic sites, such as pharynx, oral cavity, tongue and larynx. They have similar histological properties but also have different prognoses and responses to treatment due to anatomic differences. This study was mainly focused on the data available through TCGA; the submitted HNSC-related data of TCGA are mostly comprised of cancers of the oral cavity and tongue. Secondly, the association between NUTF2 and tumor-infiltrating immune cells in HNSC was acquired via cancer database and bioinformatics analyses. In future studies, then, further in vitro and in situ studies are needed to confirm the relationships between NUTF2 and immunosuppression in HNSC. Finally, clinical samples in this study were relatively small, and we will enroll more patients for future analyses to confirm the value of NUTF2 expression in the diagnosis and prognosis of HNSC.
Conclusion
We demonstrated that high NUTF2 expression was related to poor OS and DFS in HNSC. We also reported that NUTF2 expression was moderately higher in HNSC tumor samples than in normal samples, and bioinformatics analysis shows that NUTF2 is negatively associated with immune-related pathways in HNSC. Thus, we believe that NUTF2 could be a potential prognostic biomarker in HNSC patients. This is the first comprehensive analysis to explore the prognostic value of NUTF2 in HNSC and elaborate on its potential mechanism of action in HNSC.
Disclosure
The authors report no conflicts of interest in this work.
References
1. Chow LQM, Longo DL. Head and neck cancer. N Engl J Med. 2020;382(1):60–72. doi:10.1056/NEJMra1715715
2. Hashibe M, Brennan P, Benhamou S, et al. Alcohol drinking in never users of tobacco, cigarette smoking in never drinkers, and the risk of head and neck cancer: pooled analysis in the International head and neck cancer epidemiology consortium. J Natl Cancer Inst. 2007;99(10):777–789. doi:10.1093/jnci/djk179
3. Gonzalez-Arriagada WA, Lozano-Burgos C, Zuniga-Moreta R, Gonzalez-Diaz P, Coletta RD. Clinicopathological significance of chemokine receptor (CCR1, CCR3, CCR4, CCR5, CCR7 and CXCR4) expression in head and neck squamous cell carcinomas. J Oral Pathol Med. 2018;47(8):755–763. doi:10.1111/jop.12736
4. Chafe SC, Pierce JB, Mangroo D. Nuclear-cytoplasmic trafficking of NTF2, the nuclear import receptor for the RanGTPase, is subjected to regulation. PLoS One. 2012;7(8):e42501. doi:10.1371/journal.pone.0042501
5. Morrison J, Yang JC, Stewart M, Neuhaus D. Solution NMR study of the interaction between NTF2 and nucleoporin FxFG repeats. J Mol Biol. 2003;333(3):587–603. doi:10.1016/j.jmb.2003.08.050
6. Makhnevych T, Lusk CP, Anderson AM, Aitchison JD, Wozniak RW. Cell cycle regulated transport controlled by alterations in the nuclear pore complex. Cell. 2003;115(7):813–823. doi:10.1016/S0092-8674(03)00986-3
7. Vukovic LD, Jevtic P, Zhang Z, Stohr BA, Levy DL. Nuclear size is sensitive to NTF2 protein levels in a manner dependent on Ran binding. J Cell Sci. 2016;129(6):1115–1127. doi:10.1242/jcs.181263
8. Du Q, Liu J, Tian D, et al. Long noncoding RNA LINC00173 promotes NUTF2 expression through sponging miR-765 and facilitates tumorigenesis in glioma. Cancer Manag Res. 2020;12:7211–7217. doi:10.2147/CMAR.S262279
9. Hu W, Kemp BE, Jans DA. Kinetic properties of nuclear transport conferred by the retinoblastoma (Rb) NLS. J Cell Biochem. 2005;95(4):782–793. doi:10.1002/jcb.20439
10. Cline MS, Craft B, Swatloski T, et al. Exploring TCGA pan-cancer data at the UCSC cancer genomics browser. Sci Rep. 2013;3(1):2652. doi:10.1038/srep02652
11. Lohavanichbutr P, Mendez E, Holsinger FC, et al. A 13-gene signature prognostic of HPV-negative OSCC: discovery and external validation. Clin Cancer Res. 2013;19(5):1197–1203. doi:10.1158/1078-0432.CCR-12-2647
12. Wichmann G, Rosolowski M, Krohn K, et al. The role of HPV RNA transcription, immune response-related gene expression and disruptive TP53 mutations in diagnostic and prognostic profiling of head and neck cancer. Int J Cancer. 2015;137(12):2846–2857. doi:10.1002/ijc.29649
13. Edgar R, Domrachev M, Lash AE. Gene expression omnibus: NCBI gene expression and hybridization array data repository. Nucleic Acids Res. 2002;30(1):207–210. doi:10.1093/nar/30.1.207
14. Vasaikar SV, Straub P, Wang J, Zhang B. LinkedOmics: analyzing multi-omics data within and across 32 cancer types. Nucleic Acids Res. 2018;46(D1):D956–D963. doi:10.1093/nar/gkx1090
15. Yu G, Wang LG, Han Y, He QY. ClusterProfiler: an R package for comparing biological themes among gene clusters. OMICS. 2012;16(5):284–287. doi:10.1089/omi.2011.0118
16. Subramanian A, Tamayo P, Mootha VK, et al. Gene set enrichment analysis: a knowledge-based approach for interpreting genome-wide expression profiles. Proc Natl Acad Sci U S A. 2005;102(43):15545–15550. doi:10.1073/pnas.0506580102
17. Yoshihara K, Shahmoradgoli M, Martinez E, et al. Inferring tumour purity and stromal and immune cell admixture from expression data. Nat Commun. 2013;4:2612. doi:10.1038/ncomms3612
18. Li T, Fan J, Wang B, et al. TIMER: a web server for comprehensive analysis of tumor-infiltrating immune cells. Cancer Res. 2017;77(21):e108–e110. doi:10.1158/0008-5472.CAN-17-0307
19. Tang Z, Li C, Kang B, Gao G, Li C, Zhang Z. GEPIA: a web server for cancer and normal gene expression profiling and interactive analyses. Nucleic Acids Res. 2017;45(W1):W98–W102. doi:10.1093/nar/gkx247
20. Alcover A, Alarcon B, Di Bartolo V. Cell biology of T cell receptor expression and regulation. Annu Rev Immunol. 2018;36:103–125. doi:10.1146/annurev-immunol-042617-053429
21. Tanaka S, Baba Y. B cell receptor signaling. Adv Exp Med Biol. 2020;1254:23–36.
22. Murray PJ. The JAK-STAT signaling pathway: input and output integration. J Immunol. 2007;178(5):2623–2629.
23. Amenabar JM, Da Silva BM, Punyadeera C. Salivary protein biomarkers for head and neck cancer. Expert Rev Mol Diagn. 2020;20(3):305–313. doi:10.1080/14737159.2020.1722102
24. Bakhtiar SM, Ali A, Barh D. Epigenetics in head and neck cancer. Methods Mol Biol. 2015;1238:751–769.
25. Nemunaitis J, Nemunaitis J, Eisele DW. Head and neck cancer: response to p53-based therapeutics. Head Neck. 2011;33(1):131–134. doi:10.1002/hed.21364
26. Arantes L, De Carvalho AC, Melendez ME, Lopes Carvalho A. Serum, plasma and saliva biomarkers for head and neck cancer. Expert Rev Mol Diagn. 2018;18(1):85–112. doi:10.1080/14737159.2017.1404906
27. Corbett AH, Silver PA. The NTF2 gene encodes an essential, highly conserved protein that functions in nuclear transport in vivo. J Biol Chem. 1996;271(31):18477–18484. doi:10.1074/jbc.271.31.18477
28. Gratia M, Rodero MP, Conrad C, et al. Bloom syndrome protein restrains innate immune sensing of micronuclei by cGAS. J Exp Med. 2019;216(5):1199–1213. doi:10.1084/jem.20181329
29. Duan Z, Zhao J, Xu H, et al. Characterization of the nuclear import pathway for BLM protein. Arch Biochem Biophys. 2017;634:57–68. doi:10.1016/j.abb.2017.09.019
30. Jevtic P, Edens LJ, Vukovic LD, Levy DL. Sizing and shaping the nucleus: mechanisms and significance. Curr Opin Cell Biol. 2014;28:16–27. doi:10.1016/j.ceb.2014.01.003
31. Marur S, Forastiere AA. Head and neck cancer: changing epidemiology, diagnosis, and treatment. Mayo Clin Proc. 2008;83(4):489–501. doi:10.4065/83.4.489
32. Ferris RL. Immunology and Immunotherapy of head and neck cancer. J Clin Oncol. 2015;33(29):3293–3304. doi:10.1200/JCO.2015.61.1509
33. Gavrielatou N, Doumas S, Economopoulou P, Foukas PG, Psyrri A. Biomarkers for immunotherapy response in head and neck cancer. Cancer Treat Rev. 2020;84:101977. doi:10.1016/j.ctrv.2020.101977
34. Burtness B, Harrington KJ, Greil R, et al. Pembrolizumab alone or with chemotherapy versus cetuximab with chemotherapy for recurrent or metastatic squamous cell carcinoma of the head and neck (KEYNOTE-048): a randomised, open-label, Phase 3 study. Lancet. 2019;394(10212):1915–1928. doi:10.1016/S0140-6736(19)32591-7
35. Bann DV, Deschler DG, Goyal N. Novel immunotherapeutic approaches for head and neck squamous cell carcinoma. Cancers. 2016;8(10):87. doi:10.3390/cancers8100087
36. Normann SJ. Macrophage infiltration and tumor progression. Cancer Metastasis Rev. 1985;4(4):277–291. doi:10.1007/BF00048093
37. Wurzer G, Mosgoeller W, Chabicovsky M, Cerni C, Wesierska-Gadek J. Nuclear Ras: unexpected subcellular distribution of oncogenic forms. J Cell Biochem Suppl. 2001;Suppl 36:1–11. doi:10.1002/jcb.1070
38. Ferrando-May E. Nucleocytoplasmic transport in apoptosis. Cell Death Differ. 2005;12(10):1263–1276. doi:10.1038/sj.cdd.4401626
 © 2021 The Author(s). This work is published and licensed by Dove Medical Press Limited. The
full terms of this license are available at https://www.dovepress.com/terms
and incorporate the Creative Commons Attribution
- Non Commercial (unported, 3.0) License.
By accessing the work you hereby accept the Terms. Non-commercial uses of the work are permitted
without any further permission from Dove Medical Press Limited, provided the work is properly
attributed. For permission for commercial use of this work, please see paragraphs 4.2 and 5 of our Terms.
© 2021 The Author(s). This work is published and licensed by Dove Medical Press Limited. The
full terms of this license are available at https://www.dovepress.com/terms
and incorporate the Creative Commons Attribution
- Non Commercial (unported, 3.0) License.
By accessing the work you hereby accept the Terms. Non-commercial uses of the work are permitted
without any further permission from Dove Medical Press Limited, provided the work is properly
attributed. For permission for commercial use of this work, please see paragraphs 4.2 and 5 of our Terms.