")
Back to Journals » Journal of Inflammation Research » Volume 16
Identification of Hub Genes in the Pathogenesis of Bronchiolitis Obliterans via Bioinformatic Analysis and Experimental Verification
Authors Wu Z, Chen X , Zhang K, Liu Z, Zhang H, Zheng Z , Zhang X, Chen Y, Peng Y, Li H, Huang K, Tang S, Zhao L, Chen D
Received 19 May 2023
Accepted for publication 26 July 2023
Published 8 August 2023 Volume 2023:16 Pages 3303—3317
DOI https://doi.org/10.2147/JIR.S419845
Checked for plagiarism Yes
Review by Single anonymous peer review
Peer reviewer comments 2
Editor who approved publication: Dr Adam D Bachstetter
Zhongji Wu,1,* Xiaowen Chen,1,* Kangkang Zhang,1 Zhenwei Liu,1 Haidi Zhang,1 Zhaocong Zheng,2 Xiaodie Zhang,2 Yubiao Chen,3 Yinghui Peng,1 Hui Li,1 Kaiyin Huang,1 Sixiang Tang,1 Li Zhao,1 Dehui Chen1
1The First Affiliated Hospital of Guangzhou Medical University, Guangzhou, 510000, People’s Republic of China; 2Guangzhou Medical University, Guangzhou, 510000, People’s Republic of China; 3State Key Laboratory of Respiratory Diseases, Guangzhou, 510000, People’s Republic of China
*These authors contributed equally to this work
Correspondence: Dehui Chen, 151 Yanjiang West Road, Yuexiu District, Guangzhou City, Guangdong Province, 510000, People’s Republic of China, Tel +86 13922732810, Email [email protected]
Background: Bronchiolitis obliterans (BO) is a chronic disease that can arise as a complication of severe childhood pneumonia and can also impact the long-term survival of patients after lung transplantation. However, the precise molecular mechanism underlying BO remains unclear. We aimed to identify BO-associated hub genes and their molecular mechanisms.
Methods: BO-associated transcriptome datasets (GSE52761, GSE137169, and GSE94557) were downloaded from the Gene Expression Omnibus (GEO) database to identify differentially expressed genes (DEGs). Additional bioinformatics analyses, such as Gene Ontology (GO), Kyoto Encyclopedia of Genes and Genomes (KEGG), and Protein-Protein Interaction (PPI) analyses, were performed to determine functional roles and DEG-associated regulatory networks. Prediction of hub genes using the 12 algorithms available in the Cytohubba plugin of Cytoscape software was also performed. Verification was performed using the BO mouse model.
Results: Our results revealed 57 DEGs associated with BO, of which 18 were down-regulated and 39 were up-regulated. The Cytohubba plugin data further narrowed down the 57 DEGs into 9 prominent hub genes (CCR2, CD1D, GM2A, TFEC, MPEG1, CTSS, GPNMB, BIRC2, and CTSZ). Genes such as CCR2, TFEC, MPEG1, CTSS, and CTSZ were dysregulated in 2,3-butanedione-induced BO mice, whereas TFEC, CTSS, and CTSZ were dysregulated in nitric acid-induced BO mouse models.
Conclusion: Our study identified and validated four novel BO biomarkers, which may allow further investigation into the development of distinct BO diagnostic markers and novel therapeutic avenues.
Keywords: bronchiolitis obliterans, biomarkers, pathways, transcriptome, therapeutic targets
Introduction
Bronchiolitis obliterans (BO) is a chronic pulmonary disease characterized by irreversible narrowing of the small airways, which leads to reduced long-term survival after lung transplantation.1,2 It is also a common complication in children diagnosed with severe adenovirus pneumonia.3 While certain diagnosis and treatments were available for BO patients, significant challenges were still present for patients complete recovery, hence the poor prognosis for BO patients. Therefore, efforts to understand the underlying molecular mechanisms of BO may be crucial to provide a significant breakthrough in developing better treatments for patients with BO.
With the current advancements in information technology, data from pooled biological samples can be easily accessed through bioinformatics approaches. Bioinformatics is an interdisciplinary field that combines life sciences and computer science to analyze genomic, transcriptomic, proteomic, metabolomic, and other sequencing data that may reveal the underlying biological significance of a particular gene or regulatory pathways.4 Previous studies that rely on transcriptomic data analysis using bioinformatics approaches have also succeeded in yielding promising results, specifically by exploring BO molecular mechanisms.5–7 However, identification and verification of distinct molecular markers are still lacking, primarily because of limitations such as small sample sizes, inadequate transcriptome data analysis, and the absence of verification processes.
To address these limitations, multiple BO-related transcriptomic datasets were integrated from the Gene Expression Omnibus (GEO) database. We sought to explore the underlying molecular mechanisms of BO and subsequently identify potential biomarkers by employing strategies that incorporate bioinformatic analysis from multiple facets. Our study also utilized two distinct BO experimental mouse models that were commonly constructed to generate diseased mouse models.8,9 Total RNA was then extracted, and expression levels for our target genes of interest were examined in hopes to provide clues for the identification of biomarkers that are effective for the early detection of BO. Our study could, in turn, fill the current gaps in knowledge, which may be crucial for the understanding of BO pathogenesis and progression.
Materials and Methods
Animals
Male C57 mice (6–8 weeks old, weighing 18–22 g) were obtained from the Southern Medical University Animal Center (Guangzhou, China) and housed in an specific pathogen free (SPF) environment provided with water and food ad libitum. The ethics protocols for the mouse models were approved by The First Affiliated Hospital of Guangzhou Medical University Institutional Ethics Committee (Ethics number: 20230018).
Nitric Acid-Induced Bronchiolitis Obliterans Mice
Nitric acid-induced bronchiolitis obliterans mouse models were established in accordance with previously published studies in the field.8 Briefly, in which mice were anesthetized and immobilized on a mouse tracheal intubation table Subsequently, a 24G intravenous indwelling needle was inserted from the mouth through the trachea. Mice were dripped 1uL/g 0.5% nitric acid. 21 d after nitric acid instillation, BO-affected mice were established. The treatment was performed for 21 consecutive days. Upon completion of the treatment, the mice were euthanized using isoflurane overdose, followed by cervical dislocation. Prior to harvesting, the lungs were flushed with 3 mL phosphate-buffered saline (PBS) via the right ventricle. The lung samples were collected and snap-frozen in liquid nitrogen until further processing. Adequate amounts of lung samples from each mouse were used for the protein analysis and RNA quantification. In addition, parts of fresh lung samples were also soaked in 4% paraformaldehyde for biochemical analyses, such as hematoxylin and eosin (H&E) staining and Masson staining.
2,3-Butanedione-Induced Bronchiolitis Obliterans Mice
2,3-butanedione-induced bronchiolitis obliterans mouse models were performed in accordance with previously published studies in the field.9 Tracheal dropping and sampling were as above. 2,3-butanedione was titrated at a concentration of 30% for titration of 0.333 µL/g. Mice were euthanized by cervical dislocation following isoflurane overdose 14 days after 2,3-butanedione instillation.
BO Expression Profile Dataset Selection and Outlier Sample Exclusion
We searched for BO gene expression profile data in the GEO database (https://www.ncbi.nlm.nih.gov/geo/) and screened the identified datasets according to the inclusion and exclusion criteria. The inclusion criteria were as follows: (1) inclusion of three or more pairs of samples from the BO and normal groups, (2) the dataset type was expression profiling by array or RNA profiling by array, and (3) the sample type was lung, bronchial, or blood. Three BO datasets were retrieved from the GEO database. The information on the three datasets is presented in Table 1. Sample clustering was performed using the clust script (method = average) in the R package. Outliers were identified based on their position in the clustering tree and subsequently removed from the datasets for further analysis. The bioinformatic analysis process for this study was performed according to the workflow depicted in Figure 1.
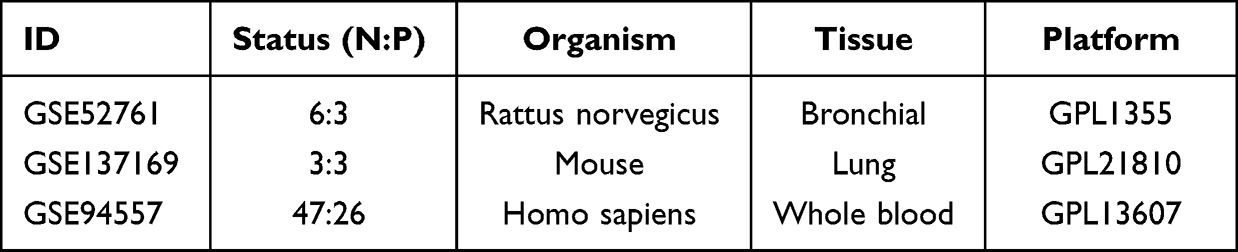 |
Table 1 Data Resource |
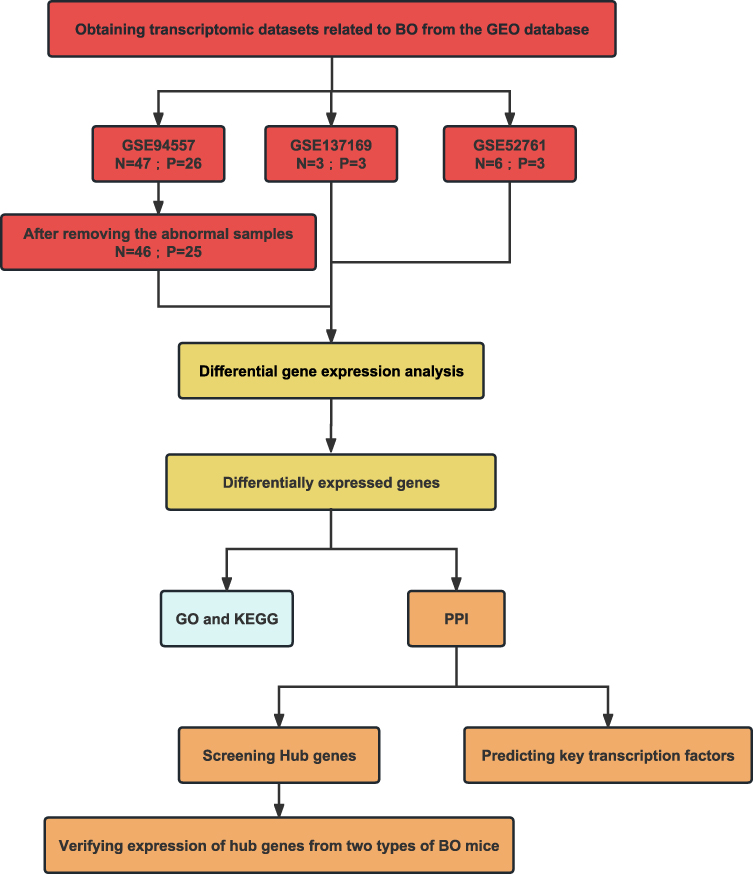 |
Figure 1 The flowchart of the analysis process. |
Data Processing and Differentially Expressed Genes Identification
First, we transformed the matrix data into log2 values for data reduction; then, we utilized the R software package Limma (version 3.40.6) for data normalization and differential analysis.10 The criteria for identifying differentially expressed genes (DEGs) in the GSE52761 and GSE137169 datasets were |log2 Fold Change|>0.5 and p < 0.05. The criteria for identifying DEGs in the GSE94557 dataset were |log2 Fold Change|>0.2 and p < 0.05. The intersection of up-regulated and down-regulated DEGs in the three datasets is known as the final DEGs. These DEGs were used for functional enrichment analysis and the construction of a protein-protein interaction (PPI) network in subsequent analyses. Volcano maps and Venn diagrams were generated using Sangerbox 3.0 (http://sangerbox.com/).11
Enrichment Pathway Analysis of DEGs
Gene ontology (GO) analysis is an effective method for annotating genes and identifying characteristic biological attributes, including biological processes (BP), molecular functions (MF), and cellular components (CC).12 The Kyoto Encyclopedia of Genes and Genomes (KEGG) database offers a thorough collection of data on protein interaction networks and bio-interpretation of genomic sequences.13 In our study, GO and KEGG analysis of DEGs were completed by the “clusterProfiler” package.14 For all the cases, we recorded top 5 significant items in the BP, CC, and MF and top 5 significant pathways in the KEGG analysis.
PPI Network Analysis
PPI network analysis of DEGs was performed using the online STRING website (https://string-db.org/).15 Then, use Cytoscape software to visualize the PPI network.16 The screening condition for constructing the PPI network was a combined score > 0.4.
Identifying Hub Genes
The Cytohubba plugin, available in Cytoscape software, offers 12 importance ranking algorithms (Maximum Neighborhood Component (MNC), Density of Maximum Neighborhood Component (DMNC), Maximal Clique Centrality (MCC), Degree, Edge Percolated Component (EPC), BottleNeck, Eccentricity, Closeness, Radiality, Betweenness, Stress, ClusteringCoefficent) that can assign an importance score to each node, respectively.17 In this study, we utilized the PPI network and calculated the importance score for each gene using 12 algorithms of the CytoHubba plugin. The top 15 genes were then selected for each algorithm. The criterion for hub gene selection was set as the gene appearing in a minimum of 8 algorithm results. Subsequently, we constructed a new PPI network for hub genes to facilitate visualization of their connections.
Construction of Transcription Factor-DEGs Network
To further explore the regulatory function of the DEGs, we submitted the DEGs to ChIP-X Enrichment Analysis 3 (ChEA3) platform for transcription factor (TF) prediction.18 DEGs-associated TFs were ranked by mean rank score. Finally, TFs with scores ≤10 were selected as key predicted TFs.
Enrichment Pathway Analysis of Hub Genes
We performed functional enrichment analysis of hub genes using KEGG analysis, which were completed by the “clusterProfiler” package.
Validation of Hub Genes in BO Mice
Quantitative reverse transcription–polymerase chain reaction (qRT-PCR) was used to quantify hub gene expression. The primer sequences for hub genes and housekeeping gene Gapdh are shown in Table 2. Lung tissues were collected from BO mice. The cycle threshold (CT) data were determined and the mean CT was determined from triplicate PCRs. Relative gene expression was calculated using equation 2–ΔCT.
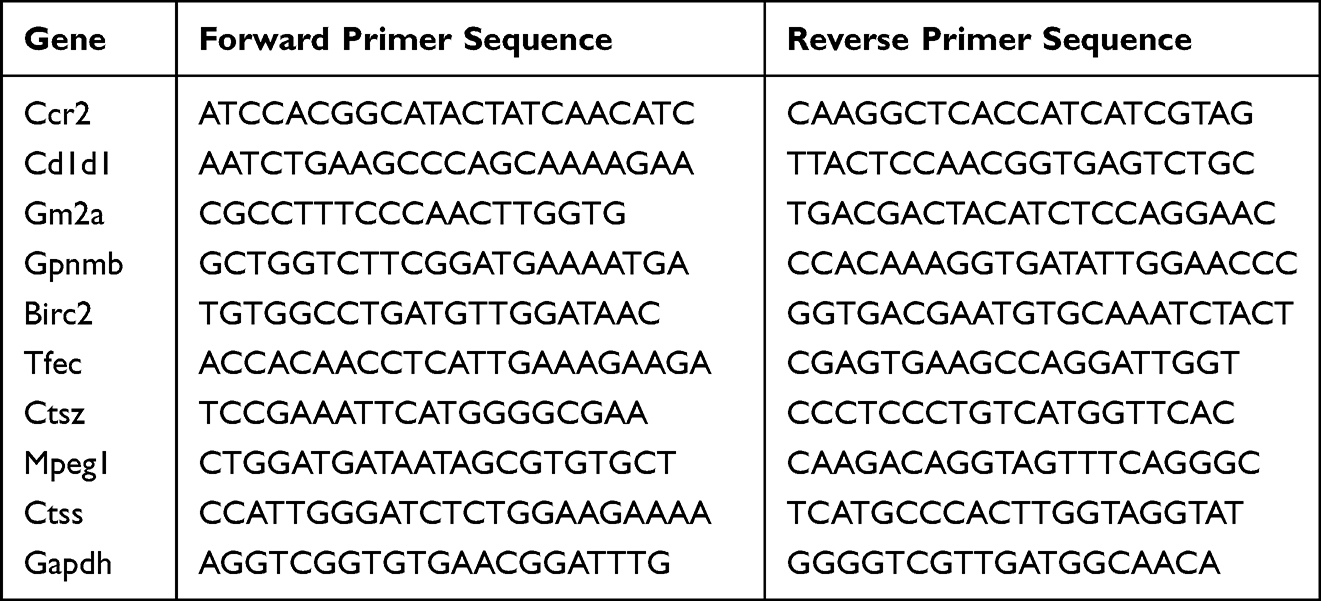 |
Table 2 PCR Primers |
Statistical Analysis
All data processing and analyses were performed using R software and GraphPad Prism. Quantitative data are presented as mean ± SEM, and Student’s t-test was used for comparisons between two groups. Statistical significance was set at p < 0.05.
Results
Source of the Datasets
In this study, we performed a comprehensive analysis of BO-related RNA sequencing datasets obtained from the GEO database. We selected three datasets that met our research criteria and obtained the raw data. The datasets were named GSE52761, GSE137169, and GSE94557 and involved the use of BO models in Wistar rats, in situ lung transplantation in C57 mice, and whole blood transcriptome sequencing in humans after lung transplantation, respectively. The sample size, sequencing organization, and gene annotation platform for each dataset are listed in Table 1. Prior to bioinformatic analysis, we performed a sample stratification clustering analysis on the three BO-related datasets (Figure 2A–C). Two outlier samples were removed from the GSE94557 dataset to increase the robustness and reliability of the results.
 |
Figure 2 Sample clustering of BO datasets. (A) Hierarchical clustering of the 9 samples in the GSE52761. (B) Hierarchical clustering of the 6 samples in the GSE137169. (C) Hierarchical binning of 73 samples in GSE94557, of which GSM2478168 and GSM2478274 were outliers. |
Identification of DEGs in BO
The GSE94557, GSE137169, and GSE52761 datasets were used for the differential gene expression analysis. 1413 differentially expressed genes DEGs were identified in the GSE94557 dataset, consisting of 743 up-regulated and 670 down-regulated genes (Figure 3A). In total, 3906 DEGs were identified in the GSE137169 dataset, with 1758 up-regulated and 2148 down-regulated genes (Figure 3B). Similarly, the GSE52761 dataset yielded 4859 DEGs, with 2624 up-regulated and 2235 down-regulated genes (Figure 3C). We identified 39 intersectionally up-regulated genes (Figure 3D) and 18 intersectionally down-regulated genes (Figure 3E) among the three datasets, which were considered key genes for further analysis.
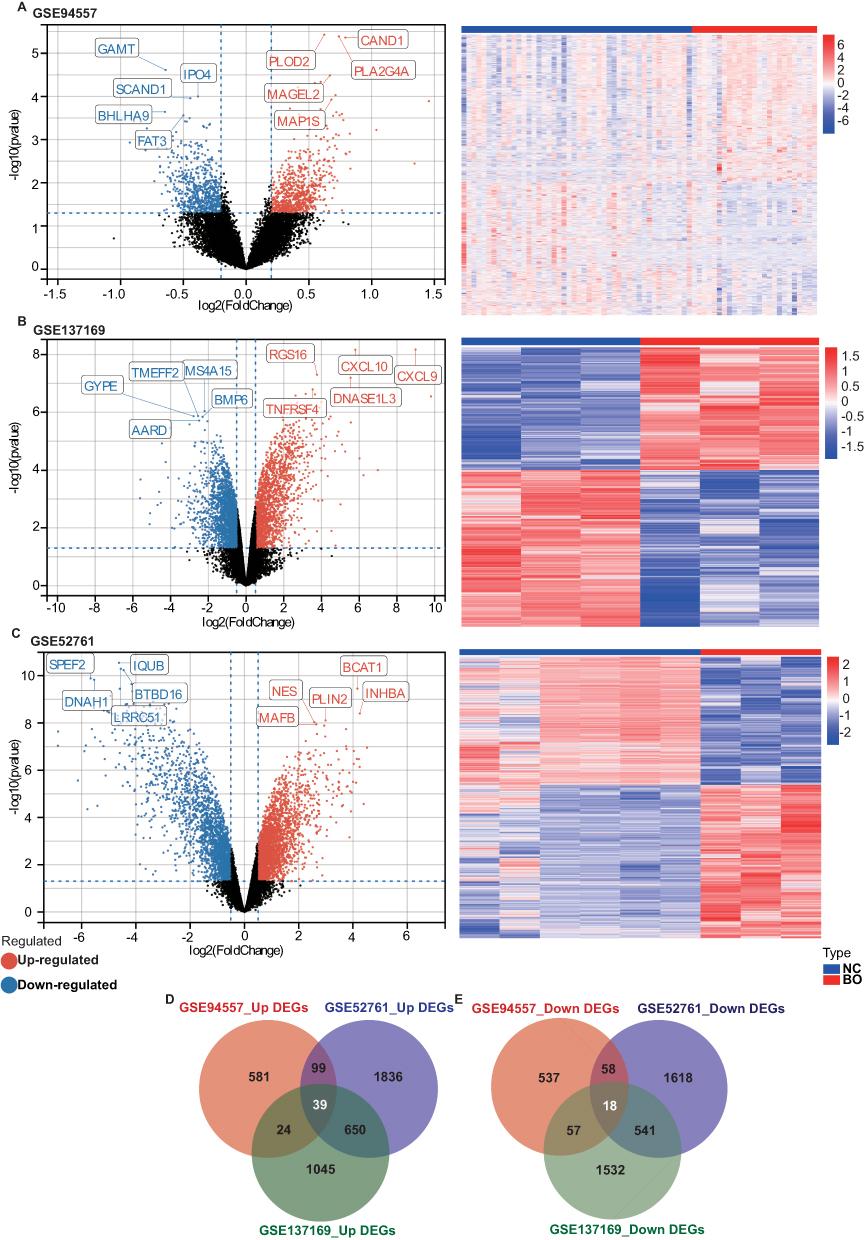 |
Figure 3 Identification of DEGs between the normal group and BO group in the BO datasets. (A) The volcano plots and heat map of DEGs in GSE94557. (B) The volcano plots and heat map of DEGs in GSE137169. (C) The volcano plots and heat map of DEGs in GSE52761. (D and E) Venn diagrams showed the overlaps of numbers of up-regulated (D) and down-regulated (E) DEGs between the three BO datasets. |
GO and KEGG Enrichment Results of DEGs
To better understand the function of overlapping genes, we subjected 57 overlapping genes to GO and KEGG analyses. According to the results of GO analysis, the changes in biological processes (BP) of DEGs were significantly enriched in the “positive regulation of ion transmembrane transporter activity”, “regulation of cation channel activity”, “positive regulation of transporter activity”, “positive regulation of cation channel activity”, and “regulation of cation transmembrane transport”; the changes in cell component (CC) of DEGs were enriched in “endosome lumen”, “spindle midzone”, “ficolin-1-rich granule lumen”, “neuron projection terminus”, and “protein complex involved in cell adhesion”; and the changes in molecular function (MF) were enriched in “activin receptor activity”, “transforming growth factor beta receptor activity”, “activin binding”, “transmembrane receptor protein serine/threonine kinase activity”, and “laminin binding.” (Figure 4A). KEGG pathway analysis revealed that the pathways enriched by dysregulated DEGs include “Lysosome”, “Arrhythmogenic right ventricular cardiomyopathy”, “Hypertrophic cardiomyopathy”, “Dilated cardiomyopathy”, and ‘Apoptosis’ (Figure 4B).
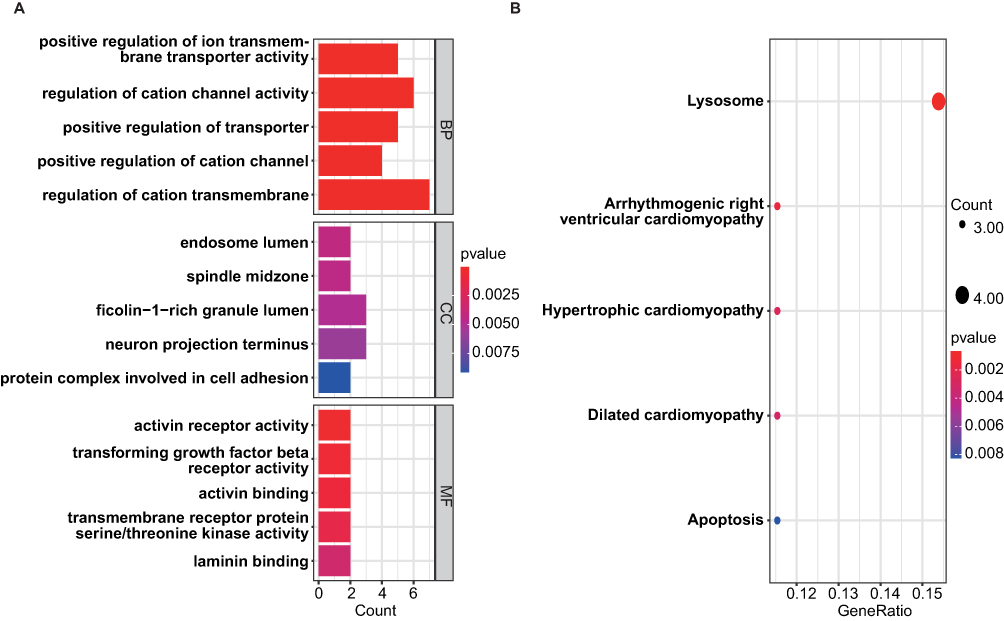 |
Figure 4 GO and KEGG enrichment results of DEGs. (A) The bar graph showed the top 5 significant items in the BP, CC, and MF fractions based on the P values in the GO analysis. (B) The bubble plot showed the top 5 significant pathways based on the P values in the KEGG enrichment analysis. |
Analysis of Protein-Protein Interaction Network and Screening of Hub Genes
After filtering out genes without associations, we constructed a PPI network consisting of 24 nodes and 19 edges (Figure 5A). Among these nodes, four genes (CCR2, CD1D, GM2A, and TFEC) were present in the 12 algorithm results, whereas MPEG1 was identified in the 11 algorithm results. In addition, CTSS, GPNMB, and BIRC2 appeared in nine algorithm results, whereas CTSZ was present in eight algorithm results (Figure 5B). Notably, all the nine hub genes identified in this study were differentially upregulated. Furthermore, the PPI network of the hub genes revealed 10 linkage lines between the nine genes, suggesting a potential close association (Figure 5C).
 |
Figure 5 Constructing PPI network and screening hub genes. (A) PPI network of DEGs. The genes in the red positive triangles are up-regulated differential genes, and those in the blue inverted triangles are down-regulated differential genes. (B) Venn diagram showed the results of 12 types of algorithms to screen out hub genes in DEGs. (C) PPI network of hub genes; (D) key TF-DEGs network. |
Predicted Key TFs of DEGs
Our analysis of DEGs in the chEA3 database showed that TFEC was the most significant transcription factor (score = 10) associated with DEGs. Interestingly, TFEC was predicted to regulate 11 up-regulated DEGs (Figure 5D).
KEGG Enrichment Results of Hub Genes
KEGG pathway analysis showed that the pathways enriched by 9 hub genes include “Lysosome” and ‘Apoptosis’. KEGG pathways are displayed visually (Figure 6).
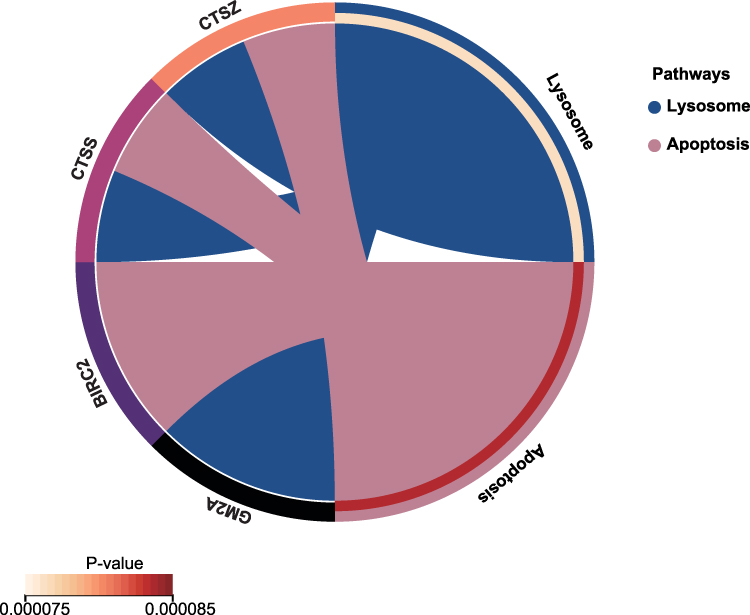 |
Figure 6 KEGG analysis results of hub genes. Circle plots showed the KEGG pathways enriched by the hub genes. |
Validation of 9 Hub Differentially Expressed Genes Expression in BO Mice
HE and Masson’s staining of mouse lung sections showed notable occlusion and deformation in the bronchioles. This study successfully induced pathological changes in BO in the lungs of mice by using 2,3-butanedione (Figure 7A and C) and nitric acid (Figure 7B and D). Subsequently, we compared the expression of the hub genes between the two BO models and their controls. Our results showed that, in the lung tissues of 2,3-butanedione-induced BO mice, there were no significant differences noted in the mRNA expression levels of Birc2, Gpnmb, Gm2a, and Cd1d genes when compared to the control mice (Figure 8A–D). However, we found a significant upregulation of Ccr2, Mpeg1, Ctss, Ctsz, and Tfec genes in the lung tissues of 2,3-butanedione-induced BO mice as compared to the control group (Figure 8E–I). Similarly, In nitric acid-induced BO mice, we observed a significant increase in the mRNA expression levels of Ctss, Ctsz and Tfec genes (Figure 8P–R). However, there was no significant difference in the mRNA expression levels of Birc2, Gpnmb, Gm2a, Cd1d, Ccr2, and Mpeg1 genes in the nitric acid-induced BO mice as compared to the control group (Figure 8J–O).
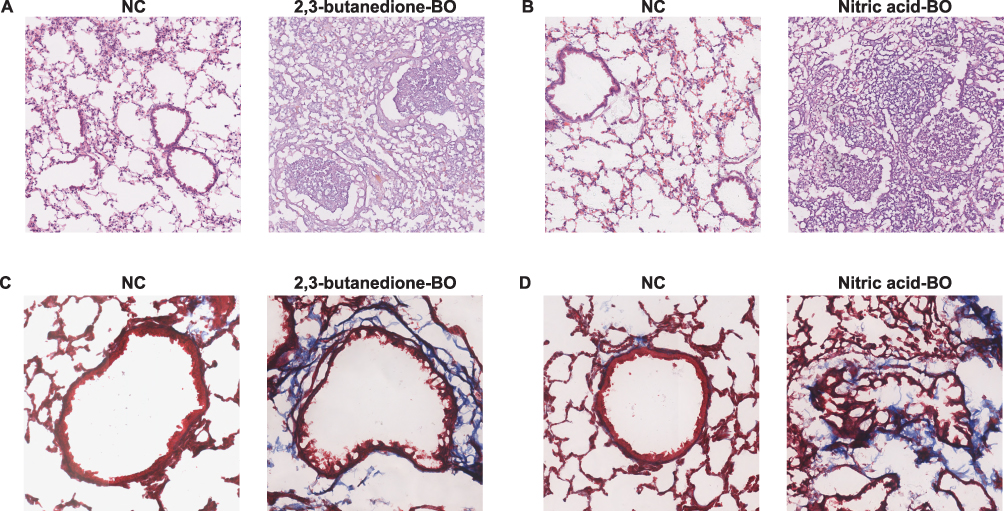 |
Figure 7 Pathological changes in the lungs from BO groups and control groups. (A and B) HE staining showed obvious obstruction in small airways, with significant infiltration of inflammatory cells in the surrounding and luminal areas of affected small airways (4X). (C and D) Mason’s trichrome staining showed more obvious fibrosis changes in the bronchi, with blue staining around the trachea indicating increased deposition of collagen protein and obvious narrowing and deformation of the tube wall (10X). Tissues for (A) and (C) obtained from 2,3-butanedione-induced BO mice and their control group. Tissues for (B) and (D) obtained from nitric acid-induced BO mice and their control group. |
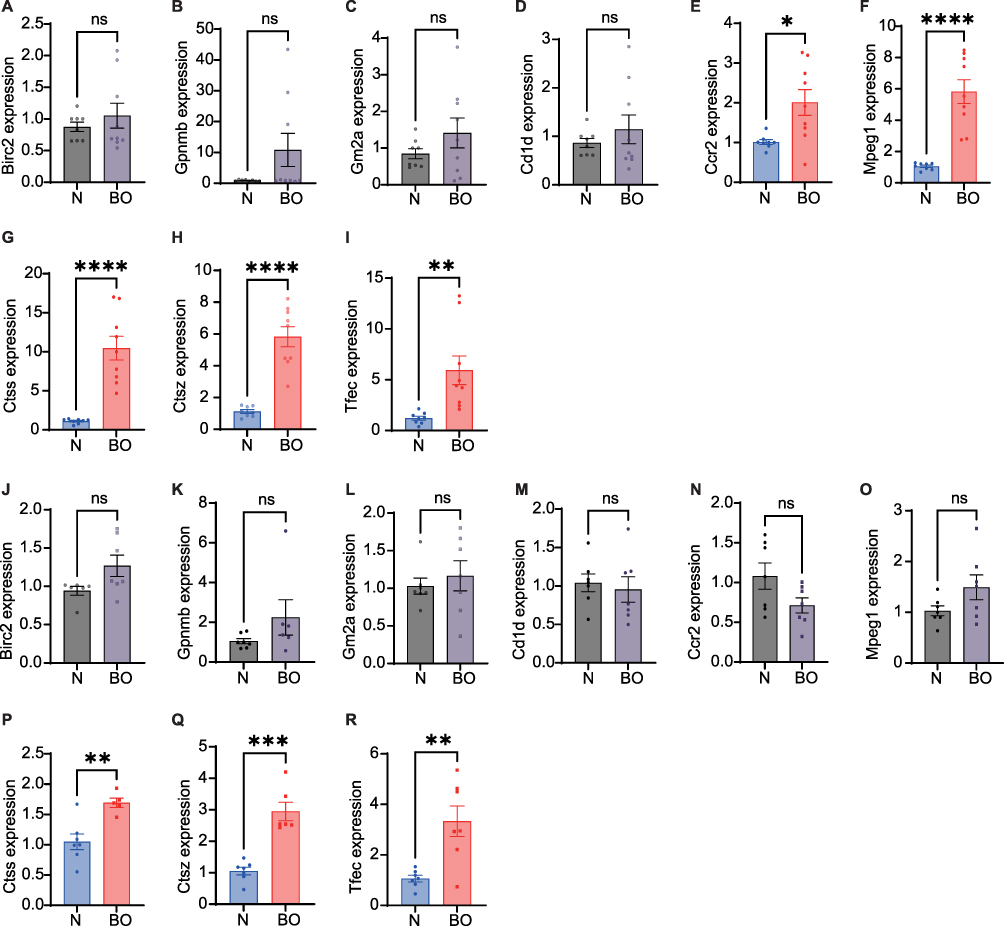 |
Figure 8 Validation of 9 hub genes from two types of BO mice. (A–I) Validation of differential mRNA expression of hub genes between 2,3-butanedione-induced BO mice and normal mice. (J–R) Validation of differential mRNA expression of hub genes between nitric acid-induced BO mice and normal mice. Data shown mean ± SEM. n = 7–9, *p < 0.05, **p < 0.01, ***p < 0.001, ****p < 0.0001. Abbreviation: ns, not significant. |
Discussion
BO is a rare chronic respiratory disease. Its diagnosis has been proven to be clinically challenging due to multiple aspects, such as the non-specific nature of its symptoms and radiographic manifestations, invasive and local nature of lung biopsy, and the current lack of reliable diagnostic biomarkers.19–21 We have been committed to exploring BO-related biomarkers to aid in the accurate diagnosis of BO in clinical settings.22 Our efforts have focused on identifying specific molecular signatures that could serve as reliable indicators of the presence of BO. Hence, by using bioinformatics analysis, our study was able to identify potential novel BO biomarkers, with the aim of providing new diagnostic approaches and therapeutic target avenues, as well as adding to current gaps in knowledge in understanding BO pathogenesis for better treatments.
In this study, BO-related transcriptomic datasets were obtained from the publicly available GEO database. Differential gene analysis was performed, in which we managed to identify a total of 57 BO-related differentially expressed genes. These genes were significantly enriched in the biological processes associated with the regulation of transmembrane cation transport. Consistent with our findings, previous studies have also indicated that the regulation of transmembrane cation transport is a process that is crucial for airway smooth muscle activities, where contraction occurs when intracellular transport of calcium ions is activated.23,24 These differentially expressed genes were also found to be enriched in other biological processes, such as lysosomal, apoptotic, and cardiomyopathy-related pathways, which in turn, may play crucial roles in BO pathogenesis. For example, balanced lysosomal autophagy is essential for cell survival under stress, while dysregulated autophagy activity can lead to increased cell death.25 On the other hand, the inhibition of autophagy has been shown to reduce airway inflammation in asthma,26,27 and the resultant reduced expression levels of autophagy markers in the airway epithelium also attenuated airway fibrosis in asthmatic mice.28 Therefore, it has been suggested that lysosomal autophagy may be involved in BO pathogenesis. Our study also identified apoptosis as an important biological pathway associated with BO. The current understanding in the field has suggested that excessive apoptosis of airway epithelial cells is a major mechanism for airway injury.29 In accordance, previous study has shown that finer bronchial epithelial cells undergo increased apoptosis in BO-afflicted patients than in patients without active BO progression.30 Thus, the regulation of apoptotic pathways in airway epithelial cells may play a substantial role in mitigating the development and progression of BO. Interestingly, our results from this study also suggest a possible link between BO pathogenesis or BO biomarkers and cardiomyopathy, which would potentially further clarify their association and may provide a need for further investigation.
Our verification process also narrowed down hub genes that were deemed essential for BO progression and pathogenesis. Out of the 57 BO-associated DEGs, 9 hub genes (CCR2, CD1D, GM2A, TFEC, MPEG1, CTSS, GPNMB, BIRC2, and CTSZ) were found to be crucial for BO. Sample analysis of lung tissue from BO mice revealed that the mRNA expression of Tfec, Ctsz, Ctss, Mpeg1, and Ccr2 genes differed between the BO and control groups. Increased mRNA expression levels of CCR2 and MPEG1 were found exclusively in 2,3-butanedione induced BO mice, which may partly be attributed to the differences in toxicological pathway activation that underlies BO development between the nitric acid-induced BO mouse model and 2,3-butanedione-induced mouse model. Previous studies have validated our findings on CCR2 expression, where CCR2 is currently used as a biomarker for BO identification.31 Interestingly, no previous studies have reported the functional roles of TFEC, CTSS, CTSZ, and MPEG1 in the BO regulatory network, suggesting that these four DEGs may potentially be novel biomarkers for BO, which requires further investigation.
It is widely recognized that TFEC is a member of the MITF family, which presents itself as a basic helix-loop-helix transcription factor.32 Previous study has shown that TFEC, one of the identified hub gene in this study, played significant roles in promoting the differentiation of M1-type macrophages into M2-type macrophages and the differentiation process will release inflammatory factors that could lead to detrimental effects such as airway inflammation and remodelling.33 Our study further revealed TFEC as a critical transcription factor and potential biomarker for BO. Although different stages of BO may have different macrophage phenotype populations, M1-type macrophages were found to be dominant in the early airway inflammatory phase of BO. Instead, M2-type macrophages had a higher predisposition at the later stages, primarily found to induce airway fibrosis by upregulating TGF-β secretion.34 Albeit it is unclear how much TFEC contributes to the formation of airway fibrosis in BO, and its roles in the promotion of macrophage differentiation may affect BO progression, which requires further investigation.
In addition, the two hub genes identified by CTSS and CTSZ are commonly known as lysosomal cysteine proteases. CTSS was also found to participate in the pathogenesis of several lung diseases, including chronic obstructive pulmonary disease, cystic fibrosis, asthma and pulmonary hypertension.35–39 CTSS exhibits protein hydrolytic activity in a neutral pH environment.35,40 Pharmacological targeted CTSS inhibition has been shown to effectively attenuate pulmonary vascular remodeling, airway inflammation, epithelial cell apoptosis and airway mucus secretion.37,41,42 In this study, for the first time, we had reported that CTSS mRNA was found highly expressed in the lung tissue of BO mice, and this observation correlates positively with the pathogenesis of BO, such as airway inflammation and vascular remodeling. Our findings further suggest that CTSS is a potential therapeutic target for BO treatment. Although evidence of The involvement of CTSZ in BO is lacking, Wang et al43 showed that CTSZ can promote epithelial-mesenchymal transition (EMT) progression and enhance the expression of extracellular matrix remodelling related proteins such as MMP2, MMP3, and MMP9 in hepatocellular carcinoma. Activation of these MMP proteins indirectly suggests that CTSZ has the potential to be recognized as an important BO biomarkers,44,45 since cell migration and matrix remodeling are features associated with BO pathogenesis.46–49 In addition, CTSZ has also been shown to promote the release of interleukin-1β (IL-1β) from NLR family pyrin domain containing 3 (NLRP3) inflammatory vesicles, that further exacerbating the inflammatory response in the lung50 Coincidentally, elevated levels of IL-1β protein expression were also verified in patients afflicted with BO,51 which indirectly suggested the potential roles of CTSZ in BO pathogenesis and progression.
Finally, our study also revealed that Mpeg1, a gene that is highly expressed primarily in macrophages and other phagocytes, encodes a bactericidal pore-forming protein called perforin-2 that activates and promotes the adaptive immune response,52 which is one of the hub genes for BO. To be clear, impaired adaptive immune response was found related to BO pathogenesis.53 Our study had also demonstrated that increased Mpeg1 mRNA expression in the lung tissue of BO mice, thereby providing a basis to establish Mpeg1 significance in BO progression, which can be determined with additional investigative procedures. Consistent with the KEGG results of the DEGs, the hub genes were also found to be significantly enriched in the apoptotic and lysosomal pathways, further suggesting that the modulation of BO regulatory networks occurs preferentially in these pathways. Altogether, our study highlighted the importance of DEGs, specifically the genes that were found to be associated with BO, which in turn may potentially be pharmacologically targeted or utilized as biomarkers in the near future to better identify, mitigate, and treat BO progression upon further investigations.
Conclusion
In conclusion, our study utilized substantial bioinformatics approaches to provide novel insights into BO pathogenesis and progression. Notably, we have identified and validated four novel BO biomarkers, which may provide breakthroughs into the development of diagnostic markers and therapeutic targets for BO through understanding its molecular mechanisms.
Ethics
This study was ethically reviewed, approved, regulated, and supervised by the Institutional Ethics Committee of the First Affiliated Hospital of Guangzhou Medical University (ethics number:20230018). The animal experiments were performed in strict accordance with the welfare and ethical guideline for the use of laboratory animals in China (GB 14925-2001).
Funding
This work was supported by the Guangdong Fund for Basic and Applied Basic Research [grant number 2021A1515220043], the Science and Technology Program of Guangzhou [grant number 202102010276], and the Results and Clinical Transformation Project of the First Affiliated Hospital of Guangzhou Medical University [grant number ZH202111].
Disclosure
The authors report no conflicts of interest in this work.
References
1. Burton CM, Carlsen J, Mortensen J, Andersen CB, Milman N, Iversen M. Long-term survival after lung transplantation depends on development and severity of bronchiolitis obliterans syndrome. J Heart Lung Transplant. 2007;26(7):681–686. doi:10.1016/j.healun.2007.04.004
2. Finlen Copeland CA, Snyder LD, Zaas DW, Turbyfill WJ, Davis WA, Palmer SM. Survival after bronchiolitis obliterans syndrome among bilateral lung transplant recipients. Am J Respir Crit Care Med. 2010;182(6):784–789. doi:10.1164/rccm.201002-0211OC
3. Li L, Woo YY, de Bruyne JA, et al. Epidemiology, clinical presentation and respiratory sequelae of adenovirus pneumonia in children in Kuala Lumpur, Malaysia. PLoS One. 2018;13(10):e0205795. doi:10.1371/journal.pone.0209720
4. Wooller SK, Benstead-Hume G, Chen X, Ali Y, Pearl FMG. Bioinformatics in translational drug discovery. Biosci Rep. 2017;37(4). doi:10.1042/BSR20160180
5. Danger R, Royer PJ, Reboulleau D, et al. Blood gene expression predicts bronchiolitis obliterans syndrome. Front Immunol. 2017;8:1841. doi:10.3389/fimmu.2017.01841
6. Hata A, Suzuki H, Nakajima T, et al. Differential gene analysis during the development of obliterative bronchiolitis in a murine orthotopic lung transplantation model: a comprehensive transcriptome-based analysis. PLoS One. 2020;15(5):e0232884. doi:10.1371/journal.pone.0232884
7. Morgan DL, Merrick BA, Gerrish KE, et al. Gene expression in obliterative bronchiolitis-like lesions in 2,3-pentanedione-exposed rats. PLoS One. 2015;10(2):e0118459. doi:10.1371/journal.pone.0118459
8. Costa CL, Spilborghs GM, Martins MA, Saldiva PH, Mauad T. Nitric acid-induced bronchiolitis in rats mimics childhood Bronchiolitis obliterans. Respiration. 2005;72(6):642–649. doi:10.1159/000087363
9. Wang J, Kim SY, House E, et al. Repetitive diacetyl vapor exposure promotes ubiquitin proteasome stress and precedes bronchiolitis obliterans pathology. Arch Toxicol. 2021;95(7):2469–2483. doi:10.1007/s00204-021-03076-2
10. Ritchie ME, Phipson B, Wu D, et al. limma powers differential expression analyses for RNA-sequencing and microarray studies. Nucleic Acids Res. 2015;43(7):e47. doi:10.1093/nar/gkv007
11. Shen W, Song Z, Zhong X, et al. Sangerbox: a comprehensive, interaction-friendly clinical bioinformatics analysis platform. iMeta. 2022;1(3):e36. doi:10.1002/imt2.36
12. Gene Ontology Consortium. Gene Ontology Consortium: going forward. Nucleic Acids Res. 2015;43:D1049–1056. doi:10.1093/nar/gku1179
13. Kanehisa M, Goto S. KEGG: Kyoto encyclopedia of genes and genomes. Nucleic Acids Res. 2000;28(1):27–30. doi:10.1093/nar/28.1.27
14. Yu G, Wang LG, Han Y, He QY. clusterProfiler: an R package for comparing biological themes among gene clusters. Omics. 2012;16(5):284–287. doi:10.1089/omi.2011.0118
15. Franceschini A, Szklarczyk D, Frankild S, et al. STRING v9.1: protein-protein interaction networks, with increased coverage and integration. Nucleic Acids Res. 2013;41:D808–815. doi:10.1093/nar/gks1094
16. Shannon P, Markiel A, Ozier O, et al. Cytoscape: a software environment for integrated models of biomolecular interaction networks. Genome Res. 2003;13(11):2498–2504. doi:10.1101/gr.1239303
17. Chin CH, Chen SH, Wu HH, Ho CW, Ko MT, Lin CY. cytoHubba: identifying hub objects and sub-networks from complex interactome. BMC Syst Biol. 2014;8(Suppl 4):S11. doi:10.1186/1752-0509-8-S4-S11
18. Keenan AB, Torre D, Lachmann A, et al. ChEA3: transcription factor enrichment analysis by orthogonal omics integration. Nucleic Acids Res. 2019;47(W1):W212–w224. doi:10.1093/nar/gkz446
19. Kramer MR, Stoehr C, Whang JL, et al. The diagnosis of obliterative bronchiolitis after heart-lung and lung transplantation: low yield of transbronchial lung biopsy. J Heart Lung Transplant. 1993;12(4):675–681.
20. Bergeron A, Chevret S, Granata A, et al. Effect of azithromycin on airflow decline-free survival after allogeneic hematopoietic stem cell transplant: the ALLOZITHRO randomized clinical trial. JAMA. 2017;318(6):557–566. doi:10.1001/jama.2017.9938
21. Fennell TR, Morgan DL, Watson SL, Dhungana S, Waidyanatha S. Systemic uptake, albumin and hemoglobin binding of [(14)C]2,3-butanedione administered by intratracheal instillation in male Harlan Sprague Dawley rats and oropharyngeal aspiration in male B6C3F1/N mice. Chem Biol Interact. 2015;227:112–119. doi:10.1016/j.cbi.2014.12.029
22. Chen D, Xie N, Lin Y, et al. Diagnostic value of antineutrophil cytoplasmic antibodies in children with bronchiolitis obliterans. J Thorac Dis. 2016;8(6):1306–1315. doi:10.21037/jtd.2016.05.04
23. Koopmans T, Anaparti V, Castro-Piedras I, et al. Ca2+ handling and sensitivity in airway smooth muscle: emerging concepts for mechanistic understanding and therapeutic targeting. Pulm Pharmacol Ther. 2014;29(2):108–120. doi:10.1016/j.pupt.2014.05.001
24. Zhao P, Liu J, Ming Q, et al. Dandelion extract relaxes mouse airway smooth muscle by blocking VDLCC and NSCC channels. Cell Biosci. 2020;10:125. doi:10.1186/s13578-020-00470-8
25. Allen EA, Baehrecke EH. Autophagy in animal development. Cell Death Differ. 2020;27(3):903–918. doi:10.1038/s41418-020-0497-0
26. Wu Y, Li W, Hu Y, Liu Y, Sun X. Suppression of sirtuin 1 alleviates airway inflammation through mTOR‑mediated autophagy. Mol Med Rep. 2020;22(3):2219–2226. doi:10.3892/mmr.2020.11338
27. Wang J, Zhao Y, Zhang X, et al. Type II alveolar epithelial cell aryl hydrocarbon receptor protects against allergic airway inflammation through controlling cell autophagy. Front Immunol. 2022;13:964575. doi:10.3389/fimmu.2022.964575
28. Liu M, Shan M, Zhang Y, Guo Z. Progranulin protects against airway remodeling through the modulation of autophagy via HMGB1 suppression in house dust mite-induced chronic asthma. J Inflamm Res. 2021;14:3891–3904. doi:10.2147/JIR.S322724
29. Tesfaigzi Y. Roles of apoptosis in airway epithelia. Am J Respir Cell Mol Biol. 2006;34(5):537–547. doi:10.1165/rcmb.2006-0014OC
30. Hansen PR, Holm AM, Svendsen UG, Olsen PS, Andersen CB. Apoptosis and formation of peroxynitrite in the lungs of patients with obliterative bronchiolitis. J Heart Lung Transplant. 2000;19(2):160–166. doi:10.1016/S1053-2498(99)00115-1
31. Belperio JA, Keane MP, Burdick MD, et al. Critical role for the chemokine MCP-1/CCR2 in the pathogenesis of bronchiolitis obliterans syndrome. J Clin Invest. 2001;108(4):547–556. doi:10.1172/JCI200112214
32. Zhao GQ, Zhao Q, Zhou X, Mattei MG, de Crombrugghe B. TFEC, a basic helix-loop-helix protein, forms heterodimers with TFE3 and inhibits TFE3-dependent transcription activation. Mol Cell Biol. 1993;13(8):4505–4512. doi:10.1128/mcb.13.8.4505-4512.1993
33. Wang Y, Zhu J, Zhang L, et al. Role of C/EBP homologous protein and endoplasmic reticulum stress in asthma exacerbation by regulating the IL-4/signal transducer and activator of transcription 6/transcription factor EC/IL-4 receptor α positive feedback loop in M2 macrophages. J Allergy Clin Immunol. 2017;140(6):1550–1561.e1558. doi:10.1016/j.jaci.2017.01.024
34. Kuroi T, Fujii N, Ichimura K, et al. Characterization of localized macrophages in bronchiolitis obliterans after allogeneic hematopoietic cell transplantation. Int J Hematol. 2021;114(6):701–708. doi:10.1007/s12185-021-03214-7
35. Brown R, Nath S, Lora A, et al. Cathepsin S: investigating an old player in lung disease pathogenesis, comorbidities, and potential therapeutics. Respir Res. 2020;21(1):111. doi:10.1186/s12931-020-01381-5
36. Andrault PM, Schamberger AC, Chazeirat T, et al. Cigarette smoke induces overexpression of active human cathepsin S in lungs from current smokers with or without COPD. Am J Physiol Lung Cell Mol Physiol. 2019;317(5):L625–l638. doi:10.1152/ajplung.00061.2019
37. Deschamps K, Cromlish W, Weicker S, et al. Genetic and pharmacological evaluation of cathepsin s in a mouse model of asthma. Am J Respir Cell Mol Biol. 2011;45(1):81–87. doi:10.1165/rcmb.2009-0392OC
38. Vaszar LT, Nishimura T, Storey JD, et al. Longitudinal transcriptional analysis of developing neointimal vascular occlusion and pulmonary hypertension in rats. Physiol Genomics. 2004;17(2):150–156. doi:10.1152/physiolgenomics.00198.2003
39. Weldon S, McNally P, McAuley DF, et al. miR-31 dysregulation in cystic fibrosis airways contributes to increased pulmonary cathepsin S production. Am J Respir Crit Care Med. 2014;190(2):165–174. doi:10.1164/rccm.201311-1986OC
40. Chapman HA, Riese RJ, Shi GP. Emerging roles for cysteine proteases in human biology. Annu Rev Physiol. 1997;59:63–88. doi:10.1146/annurev.physiol.59.1.63
41. Chang CJ, Hsu HC, Ho WJ, et al. Cathepsin S promotes the development of pulmonary arterial hypertension. Am J Physiol Lung Cell Mol Physiol. 2019;317(1):L1–l13. doi:10.1152/ajplung.00530.2018
42. Zheng T, Kang MJ, Crothers K, et al. Role of cathepsin S-dependent epithelial cell apoptosis in IFN-gamma-induced alveolar remodeling and pulmonary emphysema. J Immunol. 2005;174(12):8106–8115. doi:10.4049/jimmunol.174.12.8106
43. Wang J, Chen L, Li Y, Guan XY. Overexpression of cathepsin Z contributes to tumor metastasis by inducing epithelial-mesenchymal transition in hepatocellular carcinoma. PLoS One. 2011;6(9):e24967. doi:10.1371/journal.pone.0024967
44. Banerjee B, Ling KM, Sutanto EN, et al. The airway epithelium is a direct source of matrix degrading enzymes in bronchiolitis obliterans syndrome. J Heart Lung Transplant. 2011;30(10):1175–1185. doi:10.1016/j.healun.2011.06.007
45. Liu X, Yue Z, Yu J, et al. Proteomic characterization reveals that MMP-3 correlates with bronchiolitis obliterans syndrome following allogeneic hematopoietic cell and lung transplantation. Am J Transplant. 2016;16(8):2342–2351. doi:10.1111/ajt.13750
46. Borthwick LA, Parker SM, Brougham KA, et al. Epithelial to mesenchymal transition (EMT) and airway remodelling after human lung transplantation. Thorax. 2009;64(9):770–777. doi:10.1136/thx.2008.104133
47. Konoeda C, Koinuma D, Morishita Y, et al. Epithelial to mesenchymal transition in murine tracheal allotransplantation: an immunohistochemical observation. Transplant Proc. 2013;45(5):1797–1801. doi:10.1016/j.transproceed.2012.11.024
48. Hodge S, Holmes M, Banerjee B, et al. Posttransplant bronchiolitis obliterans syndrome is associated with bronchial epithelial to mesenchymal transition. Am J Transplant. 2009;9(4):727–733. doi:10.1111/j.1600-6143.2009.02558.x
49. Zhang C, Niu Y, Yu L, et al. The role of epithelial-mesenchymal transition in the post-lung transplantation bronchiolitis obliterans. J Cardiothorac Surg. 2017;12(1):119. doi:10.1186/s13019-017-0673-6
50. Campden RI, Warren AL, Greene CJ, et al. Extracellular cathepsin Z signals through the α(5) integrin and augments NLRP3 inflammasome activation. J Biol Chem. 2022;298(1):101459. doi:10.1016/j.jbc.2021.101459
51. Vanaudenaerde BM, De Vleeschauwer SI, Vos R, et al. The role of the IL23/IL17 axis in bronchiolitis obliterans syndrome after lung transplantation. Am J Transplant. 2008;8(9):1911–1920. doi:10.1111/j.1600-6143.2008.02321.x
52. Ebrahimnezhaddarzi S, Bird CH, Allison CC, et al. Mpeg1 is not essential for antibacterial or antiviral immunity, but is implicated in antigen presentation. Immunol Cell Biol. 2022;100(7):529–546. doi:10.1111/imcb.12554
53. Ropponen JO, Syrjälä SO, Krebs R, Nykänen A, Tikkanen JM, Lemström KB. Innate and adaptive immune responses in obliterative airway disease in rat tracheal allografts. J Heart Lung Transplant. 2011;30(6):707–716. doi:10.1016/j.healun.2010.12.011
 © 2023 The Author(s). This work is published and licensed by Dove Medical Press Limited. The full terms of this license are available at https://www.dovepress.com/terms.php and incorporate the Creative Commons Attribution - Non Commercial (unported, v3.0) License.
By accessing the work you hereby accept the Terms. Non-commercial uses of the work are permitted without any further permission from Dove Medical Press Limited, provided the work is properly attributed. For permission for commercial use of this work, please see paragraphs 4.2 and 5 of our Terms.
© 2023 The Author(s). This work is published and licensed by Dove Medical Press Limited. The full terms of this license are available at https://www.dovepress.com/terms.php and incorporate the Creative Commons Attribution - Non Commercial (unported, v3.0) License.
By accessing the work you hereby accept the Terms. Non-commercial uses of the work are permitted without any further permission from Dove Medical Press Limited, provided the work is properly attributed. For permission for commercial use of this work, please see paragraphs 4.2 and 5 of our Terms.