")
Back to Journals » ImmunoTargets and Therapy » Volume 13
Identification of CXC Chemokine Receptor 2 (CXCR2) as a Novel Eosinophils-Independent Diagnostic Biomarker of Pediatric Eosinophilic Esophagitis by Integrated Bioinformatic and Machine-Learning Analysis
Authors Wu J , Duan C, Han C, Hou X
Received 8 September 2023
Accepted for publication 17 January 2024
Published 2 February 2024 Volume 2024:13 Pages 55—74
DOI https://doi.org/10.2147/ITT.S439289
Checked for plagiarism Yes
Review by Single anonymous peer review
Peer reviewer comments 2
Editor who approved publication: Professor Michael Shurin
Junhao Wu,* Caihan Duan,* Chaoqun Han, Xiaohua Hou
Division of Gastroenterology, Union Hospital, Tongji Medical College, Huazhong University of Science and Technology, Wuhan, 430022, People’s Republic of China
*These authors contributed equally to this work
Correspondence: Chaoqun Han; Xiaohua Hou, Division of Gastroenterology, Union Hospital, Tongji Medical College, Huazhong University of Science and Technology, 1277 Jiefang Avenue, Wuhan, Hubei Province, 430022, People’s Republic of China, Email [email protected]; [email protected]
Background: Eosinophilic esophagitis (EoE) is a complex allergic condition frequently accompanied by various atopic comorbidities in children, which significantly affects their life qualities. Therefore, this study aimed to evaluate pivotal molecular markers that may facilitate the diagnosis of EoE in pediatric patients.
Methods: Three available EoE-associated gene expression datasets in children: GSE184182, GSE 197702, GSE55794, along with GSE173895 were downloaded from the GEO database. Differentially expressed genes (DEGs) identified by “limma” were intersected with key module genes identified by weighted gene co-expression network analysis (WGCNA), and the shared genes went through functional enrichment analysis. The protein–protein interaction (PPI) network and the machine learning algorithms: least absolute shrinkage and selection operator (LASSO), random forest (RF), and XGBoost were used to reveal candidate diagnostic markers for EoE. The receiver operating characteristic (ROC) curve showed the efficacy of differential diagnosis of this marker, along with online databases predicting its molecular regulatory network. Finally, we performed gene set enrichment analysis (GSEA) and assessed immune cell infiltration of EoE/control samples by using the CIBERSORT algorithm. The correlations between the key diagnostic biomarker and immune cells were also investigated.
Results: The intersection of 936 DEGs and 1446 key module genes in EoE generated 567 genes, which were primarily enriched in immune regulation. Following the construction of the PPI network and filtration by machine learning, CXCR2 served as a potential diagnostic biomarker of pediatric EoE with a perfect diagnostic efficacy (AUC = ~1.00) in regional tissue/peripheral whole blood samples. Multiple infiltrated immune cells were observed to participate in disrupting the homeostasis of esophageal epithelium to varying degrees.
Conclusion: The immune-correlated CXCR2 gene was proved to be a promising diagnostic indicator for EoE, and dysregulated regulatory T cells (Tregs)/neutrophils might play a crucial role in the pathogenesis of EoE in children.
Keywords: Eosinophilic esophagitis, pediatrics, bioinformatic analysis, machine-learning, potential diagnostic/therapeutic biomarker
Introduction
Eosinophilic esophagitis (EoE) is an immune-mediated disease mainly featured by esophageal eosinophilic infiltration histologically as well as by esophageal dysfunction (ie, dysphagia and gastroesophageal reflux for children and adolescence) clinically.1,2 Current epidemiological evidence demonstrated an increasing incidence and prevalence of EOE among children in developed countries, from 7.3 per 100,000 per year in 1995–2004 to 50.5 per 100,000 across the US for 2009–2011,3,4 and from no cases in 1993–2003 to 42.8 per 100,000 in 2007–2009 according to European cohorts.5,6 The estimated 1/2000 incidence rate was similar to that of pediatric Crohn’s disease.7 An inflammatory phenotype in childhood would progressively develop into a fibro-stenotic situation over time and an average delay of diagnosis of 3–5 years normally found in pediatric patients leads to elevated risk of esophageal stricture,8 for they are neither unaware of the illness nor acceptant to repeated endoscopy inspection burden.9 Moreover, eosinophilia in EoE is frequently patch, and at least four biopsies would be required.7 Therefore, identifying sensitive and specific diagnostic biomarkers for early and accurate EoE diagnosis prior to reaching an irreversible fibrosis stage is important to improving outcomes in the long run.
Previous studies have indicated the involvement of impaired esophageal epithelial barrier functions and abnormal T-helper cell type 2 (Th2)-correlated immune pathways, particularly those involving interleukin (IL)-4/IL-13 signaling.10,11 Besides, it has been shown that EoE has an intimate association with atopy, which, on the one hand, refers to that atopic comorbidities’ rates are higher in EoE patients than in the normal population, with 26%–50% of EoE patients having asthma, 30%–90% having allergic rhinitis, and 19%–55% having atopic dermatitis,12,13 and, on the other hand, refers to the characterized chronic allergen-induced mucosal inflammation and potentiated fibroblast activation.14 Notably, the susceptibility genes of EoE largely overlap with atopic diseases rather than with other prevalent inflammatory/neoplastic gastrointestinal diseases.15
Nowadays, high-throughput sequencing techniques could detect parallel expression levels for thousands of genes in tissues and assist in identifying disease-correlated genes to screen out novel diagnostic or therapeutic biomarkers.16 Utilizing either supervised or unsupervised methods, machine learning algorithms could help dig to find the underlying connections in high-dimensional transcriptomic data,17–19 which has been widely adopted in previous analyses of multiple diseases. Therefore, it is plausible to identify important biomarkers for predicting EoE through bioinformatical and machine-learning analysis. In addition, the emerging role of non-coding RNAs (ncRNAs) in regulating gene expression has been identified and these ncRNAs consist of: [1] long ncRNAs (lncRNAs) as well as [2] short ncRNAs (mainly microRNAs [miRNAs], 18–22 nucleotides).20 Using new-level sequencing methods reported lncRNAs as the most common form of genomic sequences transcription,21 supporting the most widely accepted proposal of competitive endogenous RNA (ceRNA) model that referring to lncRNAs competing with mRNAs for binding with miRNAs.22
To the best of our knowledge, available studies of pediatric EoE mainly concentrated on specific immunological or molecular mechanisms in the blood, and were mainly based on small-scale cohort analysis.9,23 The definite cause of EoE still remains uncertain so far. Several genetic risk loci of EoE (ie, CAPN14, DEX1 and TSLP) have been determined by genome-wide association study (GWAS) or meta-analysis,24–26 while their underlying associations remain an open issue. In the present study, we utilized publicly open datasets from the GEO database, the “Limma” method, the “weighted gene co-expression network analysis” (WGCNA), and machine-learning algorithms to identify pivotal EoE-correlated diagnostic markers, which in combination with immune infiltration analysis and ceRNA regulatory network prediction could, to some extent, facilitate a deeper understanding of potential regulatory molecular mechanisms during the pathogenesis of EoE in children. Furthermore, the Connectivity Map (CMAP) database contained 6100 instances of 1309 small molecule reagents, with each containing gene expression profiles upon intervention of specific reagents.27 We imported 300 genes with the most difference in their expression level (150 upregulated genes and 150 downregulated genes) between the EoE and normal esophageal tissues to the CMAP database to predict promising molecular reagents for EoE treatment, which may inspire future clinical practices.
Materials and Methods
Data Collection and Processing
To acquire EoE-correlated gene expression data, we searched the Gene Expression Omnibus (GEO) Database (https://www.ncbi.nlm.nih.gov/geo/)28 through the keyword: “Eosinophilic esophagitis” [MeSH Terms] AND “Homo sapiens” [porgn: txid9606]. The GSE1841829 and GSE19770229 datasets containing samples from the healthy or diseased children (without any other disease except for EoE) were obtained and we performed the principal component analysis of the GSE184182 dataset to demonstrate their distribution. Their expression matrix was processed following the criteria: [1] Removing empty probes that have no matched gene; [2] Deleting probes that match multiple genes; [3] Selecting the probe with the highest expression level if a gene corresponds to multiple probes; [4] Calculating the median values as the expression level if multiple probes identify the same gene. The log2 transformation was applied for the dataset GSE197702. Subsequently, the GSE184182 dataset functioned as the discovery dataset as well as the GSE197702 dataset worked as the validation dataset. To further evaluate the diagnostic efficacy of identified biomarker, we additionally chosen GSE156651, GSE41687, GSE148381, and GSE55794 datasets, of which the detailed information is listed in Table 1.
 |
Table 1 Detailed Information of Utilized GEO Datasets |
Identification of Differentially Expressed Genes (DEGs)
The “Limma” R package was utilized to identify DEGs between the pediatric EoE group and control group in the discovery dataset,30 based on |log2(Foldchange)| > 1 and adjusted P value < 0.05 (adopting Benjamini and Hochberg’s method to control the false discovery rate). A volcano plot was generated to show DEGs, and a heatmap was drawn to depict the distribution pattern of DEGs via using the “Pheatmap” R package.
Gene Set Enrichment Analysis (GSEA)
GSEA was performed via using the “cluster Profiler” R package,31,32 and the “c2. cp.kegg.v7.4.symbols.gmt” from (https://www.gsea-msigdb.org/gsea/msigdb/index.jsp)33 was utilized as the reference gene set. GSEA was carried out in children either in EoE or healthy states to determine whether the preset gene set was enriched at the top/bottom of the sequencing table and reveal several shared biological signaling pathways. The results were visualized by the “ggplot2” R package.34 P value < 0.05 was statistically significant.
Identification of Hub Modules by WGCNA
The weighted gene co-expression network (WGCNA) is a systematic approach for identifying gene clusters co-expressed by many genes and investigating the correlations within this gene co-expression network.35
First, the median absolute deviation (MAD) of the gene was computed and the 50% of genes with the smallest MAD were cancelled. Then, the DEGs expression matrix was filtered by the goodSamplesGenes functions to diminish unqualified genes and samples. After that, a scale-free co-expression network was constructed. Next, the co-expression similarity-derived “soft” thresholding power (β) was adopted to compute the adjacency, which was transformed into a topological overlap matrix (TOM). The fourth procedure was detecting modules via using hierarchical clustering and a dynamic tree cut function.
Genes with identical expression patterns were divided into modules via average linkage hierarchical clustering, with a TOM-based dissimilarity metric. A minimum gene group at the size of n = 50 was set. Finally, we calculated the module eigengenes dissimilarity and the eigengene network was visualized.
We utilized the “VennDiagram” R package to identify shared genes between DEGs and the above selected hub modules. DEGs with gene significance (GS) larger than 0.2, as well as module membership (MM) larger than 0.8 were designated as hub genes. GS and MM were indications of clinical relevance and a highly connected module.35
Gene Ontology (GO) and Pathway Enrichment Analysis
The ClueGO plug-in of Cytoscape 3.8.2 was used to reveal the interaction network of the “biological processes” enriched by up-regulated and down-regulated DEGs. Those presented GO terms met the threshold of P value < 0.01. GO and Kyoto Encyclopedia of Genes and Genomes (KEGG) analyses were taken via utilizing the “cluster Profiler” R package, with P value < 0.05 statistically significant. GO and functional processes are divided into 3 aspects: biological process (BP), cellular component (CC), and molecular function (MF).36 KEGG as well as Reactome databases were utilized as the source of pathway annotations.36
Construction of protein‒protein Interaction (PPI) Network
The STRING platform (http://string-db.org) was used to analyze the PPI network,37 including 567 DEGs with the MM > 0.8, and GS > 0.2. A minimum required interaction score > 0.4 (the medium confidence) was set as the cut-off criterium, along with “Homo sapiens” as the organism. The MCODE and CytoHubba plug-ins of the Cytoscape 3.8.2 were, respectively, utilized to screen out the core modules. Their default parameters were as follows (for the MCODE plug-in: degree cutoff ≥ 10, node score cutoff ≥ 0.2, K-core ≥ 5, and max depth = 100; for the CytoHubba plug-in: the top 10 nodes chosen by MCC).
Network visualization of core clusters was conducted via utilizing the Cytoscape 3.8.2,38 an open-source software for analyzing and visualizing networks. The above PPI network of proteins encoded by common DEGs depicted how these proteins interacted with each other physically and functionally, on the basis of evidence from observations and verified experimental results including text-mining, experiments, databases, co-expression, neighborhood, gene fusion, and co-occurrence information.39
Identification of Hub Diagnostic Biomarkers by Machine-Learning Algorithms
In order to further select feature genes for inclusion in an optimal diagnostic model, various machine-learning algorithms: random forests (RF), the least absolute shrinkage and selection operator (LASSO), and eXtreme Gradient Boosting (XGBoost) were used to identify important markers of pediatric EoE.40–42 RF is a class of integrated classifiers, which demonstrates a strong predictive power that could build decision-tree forests and prevent overfitting.43,44 We built the RF model and acquired feature genes via using the “randomForest” function of the “randomForest” R package. LASSO logistic regression is a method of penalty regression that can effectively recognize feature genes from high-dimensional data, of which the procedures were finished using the “cv.glmnet” function of the “glmnet” R package, with a minimal lambda regarded as optimal.45 The penalized term was selected using a 10-fold cross-validation method. This technique was reported to be able to evaluate the strongest association with the outcomes among various factors, without being impacted by confounding factors.46 XGBoost is a GBDT-based algorithm that could determine key features according to feature importance ranking and recursive elimination.47 The model of XGBoost was developed by using the “xgboost” R package. These algorithms contained strong power in carrying out a binary classification of data.
The shared gene by all of the three classification models was selected as core diagnostic gene and then used during the following procedures.
The validation dataset for evaluating the usefulness of the selected biomarkers was GSE197702. The method of receiver operating characteristic (ROC) curve was adopted and the area under the curve (AUC) was calculated to measure the diagnostic capability of the model. The closer the value of AUC approximated “1.0”, the better the diagnostic performance of the model. Feature genes with AUC values exceeding 0.7 were regarded to have a relatively good predictive capacity. Moreover, we showed the expression level of feature genes between the EoE group and control group via violin plots.
Immune Cell Infiltration Analysis
Twenty-two types of immune cell matrices were filtered by using the CIBERSORT algorithm (P < 0.05).48 The Spearman correlation was calculated between the diagnostic biomarker and infiltrated immune cells. The “ggplot2” R package illustrates the results of the infiltration abundance of 21 immune cell types in EoE patients in the GSE184182 dataset.
Construction of the lncRNA-miRNA-mRNA Regulatory Network
We predicted miRNAs that regulated the above selected diagnostic biomarkers via intersecting results of the miRWalk database (http://mirwalk.umm.uni-heidelberg.de/),49 miRTarBase database (https://mirtarbase.cuhk.edu.cn/),50 and the GSE55794 dataset to improve the accuracy of prediction. The lncRNA-miRNA-mRNA network was visualized by Cytoscape 3.8.2. The binding lncRNAs of selected miRNAs were predicted using the Encyclopedia of RNA Interactomes (ENCORI) database (http://starbase.sysu.edu.cn/).51
Prediction of the Therapeutic Drugs of Pediatric EoE
The most differentially DEGs’ matrix of pediatric EoE was imported into the CMAP database (https://clue.io/) to predict potential drugs that can reverse this gene expression pattern. The top ten small molecules were acquired by the rank of enrichment scores.
Statistical Analysis
R software version 4.2.1, GraphPad Prism Version 9.4.0 (GraphPad Software, San Diego, CA, USA), and SPSS Version 26.0 (IBM Corporation, Armonk, NY, USA) were used to perform statistical analysis. Using the Student’s t-test, continuous variables were compared between two groups. For correlation analysis, the Spearman correlation was utilized to analyze the relationships between core genes and immune cells. The receiver operating characteristic (ROC) curves, and the area under the curve (AUC) values were computed using the “pROC” R package. The results were presented as mean ± standard deviation (SD). P value < 0.05 was statistically significant.
The study design is illustrated in Figure 1.
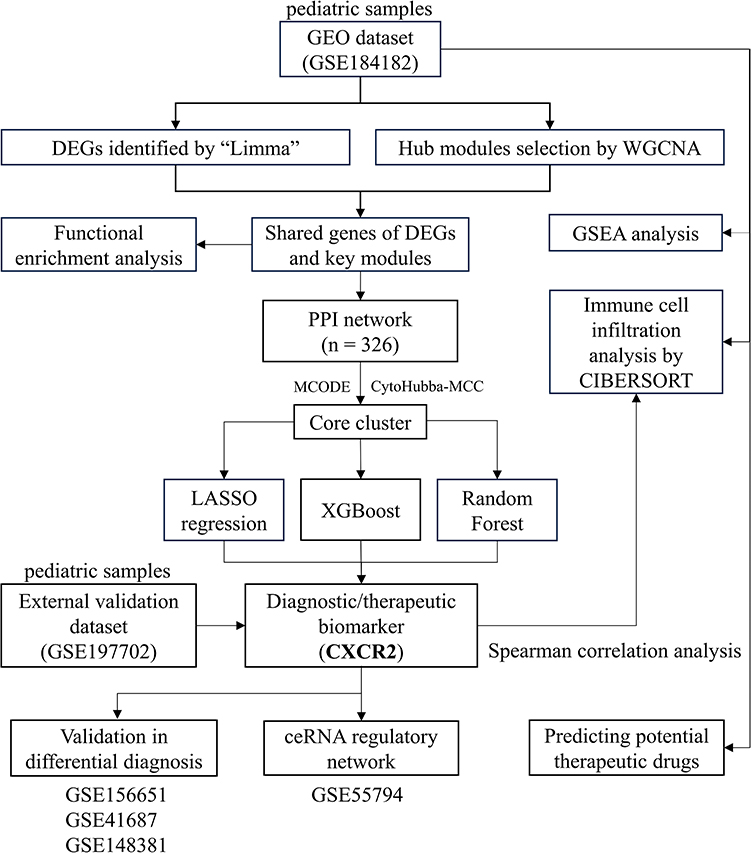 |
Figure 1 Study flowchart. The flowchart showing analysis procedures of this study. The screened-out biomarker CXCR2 is presented in bold font. Abbreviations: GEO, gene expression omnibus; DEGs, differentially expressed genes; WGCNA, weighted gene co-expression network; GSEA, gene set enrichment analysis; PPI, protein–protein interaction; LASSO, the least absolute shrinkage and selection operator; XGBoost, eXtreme Gradient Boosting; CIBERSORT, cell-type identification by estimating relative subsets of RNA transcripts. |
Results
Identifying DEGs in Pediatric EoE-Related Dataset
The principal component analysis (PCA) of the GSE184182 dataset was executed, and each point in the scatter plot represented a sample (Figure 2A). After a differential expression analysis, a total of 936 screened DEGs (including 420 up-regulated and 516 down-regulated genes) between groups were acquired and shown by different colors in a volcano plot (Figure 2B). A heatmap indicated the relative similar distribution pattern of DEGs in the two groups (Figure 2C).
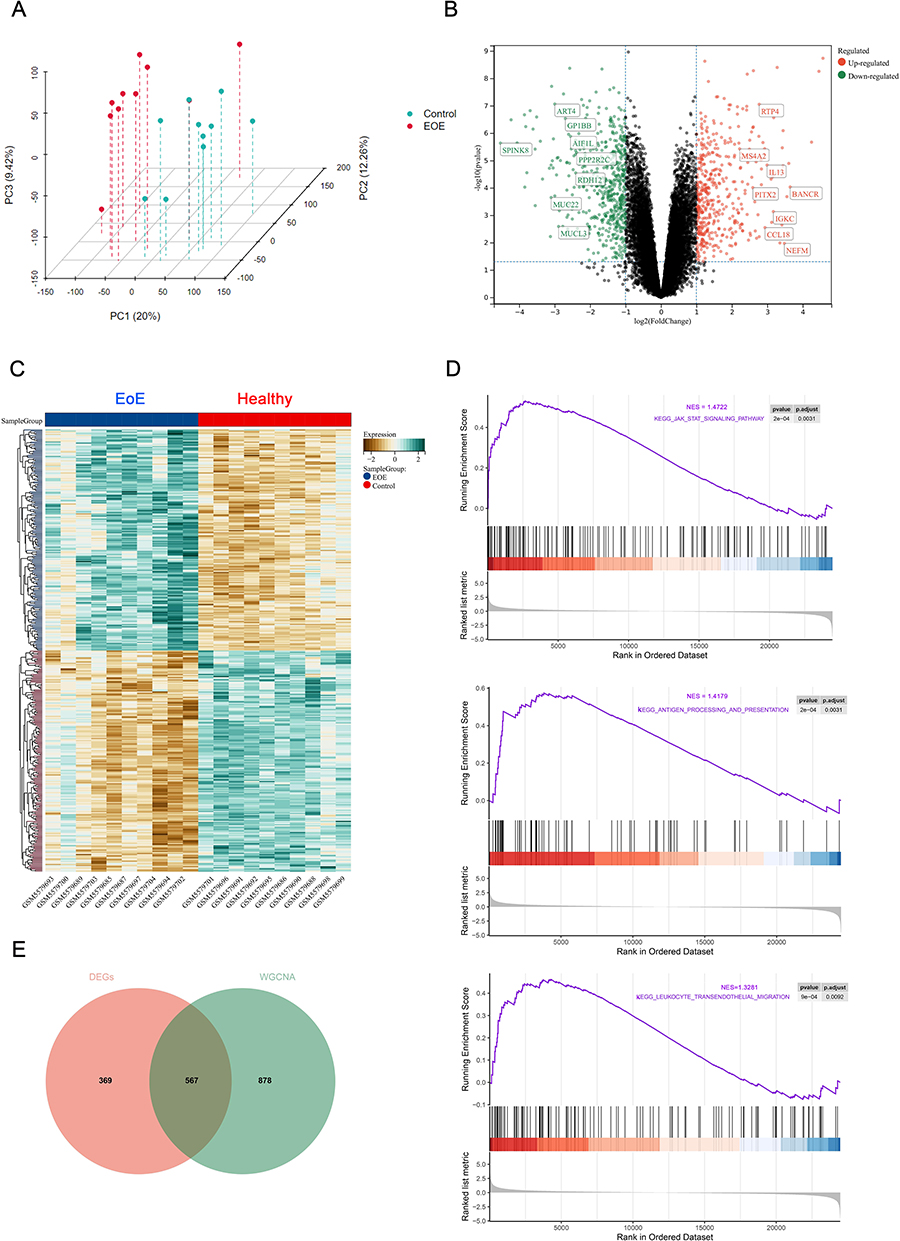 |
Figure 2 Detection of DEGs of the pediatric EoE dataset. (A) 3D PCA analysis of the dataset. (B) A volcano plot depicting the distribution pattern of all genes in the dataset. (C) A heatmap comparing the distribution of the top 50 DEGs in pediatric patients with EoE or controls. (D) The top three KEGG terms of the dataset enriched by GSEA, p adjusted < 0.05. (E) A Venn diagram showing overlapping genes between DEGs and key modules identified by WGCNA. Abbreviations: DEGs, differentially expressed genes; KEGG, Kyoto Encyclopedia of Genes and Genomes;; WGCNA, weighted gene co-expression network; GSEA, gene set enrichment analysis; EoE, eosinophilic esophagitis. |
GSEA results
GSEA was performed on pediatric healthy subjects and patients with EoE to figure out biologically important signaling pathways. The top three terms identified by KEGG analysis of pediatric EoE patients are shown by Figure 2D, which included the “JAK-STAT signaling pathway”, “antigen processing and presentation”, and “leukocyte trans-endothelial migration”. Through using a Venn diagram, 567 genes were overlapped from DEGs and genes of the key modules screened out subsequently (Figure 2E).
WGCNA Analysis and Identification of EoE-Related Hub Gene Modules
WGCNA was applied to identify the most correlated gene modules in the pediatric EoE dataset. The clustering dendrogram (Figure 3A) of samples from EoE and control groups showed no prominent outliers. Based on scale independence of > 0.85, we chose β = 4 as the soft thresholding power to establish a scale-free network, of which the scale independence and average connectivity are exhibited in Figure 3B. According to this power, 17 gene co-expression modules were generated via dynamic branch cut methods for gene dendrograms and exhibited by different colors (Figure 3C). Figure 3D shows the heatmap of eigengene adjacency. Finally, the associations between EoE and its gene co-expression modules were analyzed, of which the “lightyellow” module exhibited the highest positive correlation with pediatric EoE (correlation coefficient = 0.65, P = 2.1*e−3), while the “blue” module had the opposite correlation (correlation coefficient = −0.82, P = 9.0*e-6) (Figure 3E). Both modules were regarded as core modules for subsequent analysis and significant positive correlations between module membership (MM) and gene significance (GS) were observed in both modules for EoE (as for the “lightyellow” module, r = 0.65; for the “blue” module, r = −0.82). Finally, based on the cut-off criteria of (|MM| > 0.8 and |GS| > 0.2), a total of 1446 genes with high connectivity in clinically significant modules were preserved as hub genes for following analysis.
 |
Figure 3 WGCNA analysis of the pediatric EoE dataset. (A) The clustering dendrogram of samples in the discovery dataset (GSE184182) to detect outliers. (B) The soft power plot showing that soft-threshold β = 4 (scale free R2 > 0.85); Analysis of the mean connectivity at various soft-threshold powers and when β = 4. The star symbol (the upper one) labels the value of the minimum soft-threshold power β, when the value of scale free R2 conforming to > 0.85 for the first time (R2 = 0.86, β = 4); The lower one labels the value of the mean connectivity when β = 4. (C) The gene dendrogram generated by average linkage hierarchical clustering. (D) The heatmap of eigengene adjacency. (E) The module–trait relationships. Abbreviations: WGCNA, weighted gene co-expression network; EoE, eosinophilic esophagitis. |
Functional Enrichment Analysis of DEGs and Construction of the PPI Network
We then performed functional enrichment analyses to have a deeper understanding of their biological functions. Through utilizing the ClueGO plug-in of Cytoscape 3.8.2 to analyze enriched biological processes (BP), up-regulated DEGs exhibited involvement in the processes: “regulation of immune effector process”, “positive regulation of leukocyte differentiation”, “myeloid leukocyte migration”, “interferon-gamma mediated signaling pathway”, whereas down-regulated DEGs were highly enriched in “regulation of integrin biosynthetic process” that was closely correlated with esophageal epithelium morphogenesis and homeostasis, as well as “eicosanoid metabolic process” (Figure 4A). Moreover, enriched cellular components (CC) terms were located in “mast cell granule” and “collagen-containing extracellular matrix”, while collected molecular function (MF) terms included “cytokine activity”, “superoxide-generating NADPH oxidase activity”, and “arachidonate 12-lipoxygenase activity” (Figure 4B). Enriched KEGG pathways contained “JAK-STAT signaling pathway”, “NF-kappa B signaling pathway”, “MAPK signaling pathway”, “Th1 and Th2 cell differentiation”, and “arachidonic acid metabol-ism”, and meanwhile the Reactome enrichment analysis showed the enrichment of “IL4 and IL13 signaling pathway”, “biosynthesis of specialized proresolving mediators” and “activation of matrix metalloproteinases” (Figure 4C and D).
 |
Figure 4 Functional enrichment analysis of DEGs. (A) GO enrichment analysis of up-regulated and down-regulated DEGs by the ClueGO plug-in of Cytoscape 3.8.2 in aspects of biological process. The “diamond” symbol in the line connecting the node (the enriched pathways) “regulation of production of molecular mediators of immune response” and node “production of molecular mediators of immune response” indicating the meaning of “REGULATE”. All presented terms meeting P value < 0.01. (B) GO enrichment analysis of cellular component and molecular function. (C) KEGG pathway enrichment analysis. (D) Reactome pathway enrichment analysis. (E) PPI network and hub modules selected by the CytoHubba-MCC and MCODE plug-ins of Cytoscape 3.8.2. Abbreviations: GO, gene ontology; DEGs, differentially expressed genes; PPI, protein‒protein interaction; KEGG, Kyoto encyclopedia of genes and genomes. |
To better identify interactions between such 567 overlapping genes, a PPI network was constructed by the STRING database and it contained 326 nodes (proteins encoded by genes) and 1426 edges (interactions between proteins). Additionally, we utilized the MCODE and CytoHubba plug-in of Cytoscape 3.8.2 to, respectively, screen out the most important modules of the PPI interaction network. The results showed two but the same core clusters of ten nodes screened respectively based on the K-core = 5 and their values of Maximal Clique Centrality (MCC) (Figure 4E). In the GSE184182 and GSE197702 dataset IL13, CCR3, ICAM1, TIMP1, GZMB, CXCL1, and CD86 were up-regulated, while IL18, CXCR2, and ARG1 were reduced. Biological functions of these core genes were significantly enriched in “regulation of type 2 immune response (IL18, CD86, and ARG1)”, “response to dexamethasone (ARG1, TIMP1, and ICAM1)”, “activated T cell proliferation (IL18, ARG1, and TIMP1)”, along with “positive regulation of tyrosine- phosphorylation of STAT protein (IL13, IL18, and TIPM1)” (Figure S1).
Identification of Hub Pediatric EoE Diagnostic Biomarkers by Machine-Learning Algorithms
For the above ten selected genes, three machine-learning algorithms were used to screen out characteristic genes of pediatric EoE. By utilizing the LASSO algorithm, we identified three potential diagnostic biomarkers from statistically significant univariate variables, with Lambda (λ) = 0.17 (Figure 5A). Likewise, we adopted the RF algorithm to select the top genes and displayed them in the descending order of relative relevance (Figure 5B). In addition, we used the XGBoost algorithm to identify the feature marker at the threshold of the turning point (Figure 5C). Such algorithms collectively enriched the CXCR2 gene (Figure 5D), of which the area under the ROC curve (AUC) indicated its well diagnostic performance in both the discovery (AUC = 0.990) and the validation (AUC = 0.986) dataset. The expression level of CXCR2 in EoE samples was lower than that of control samples significantly (Figure 5E). Moreover, the analysis of correlations between these ten genes suggested a significant result, of which CXCR2 had a relatively high absolute value of total scores (Figure 5F), indicating its significant roles.
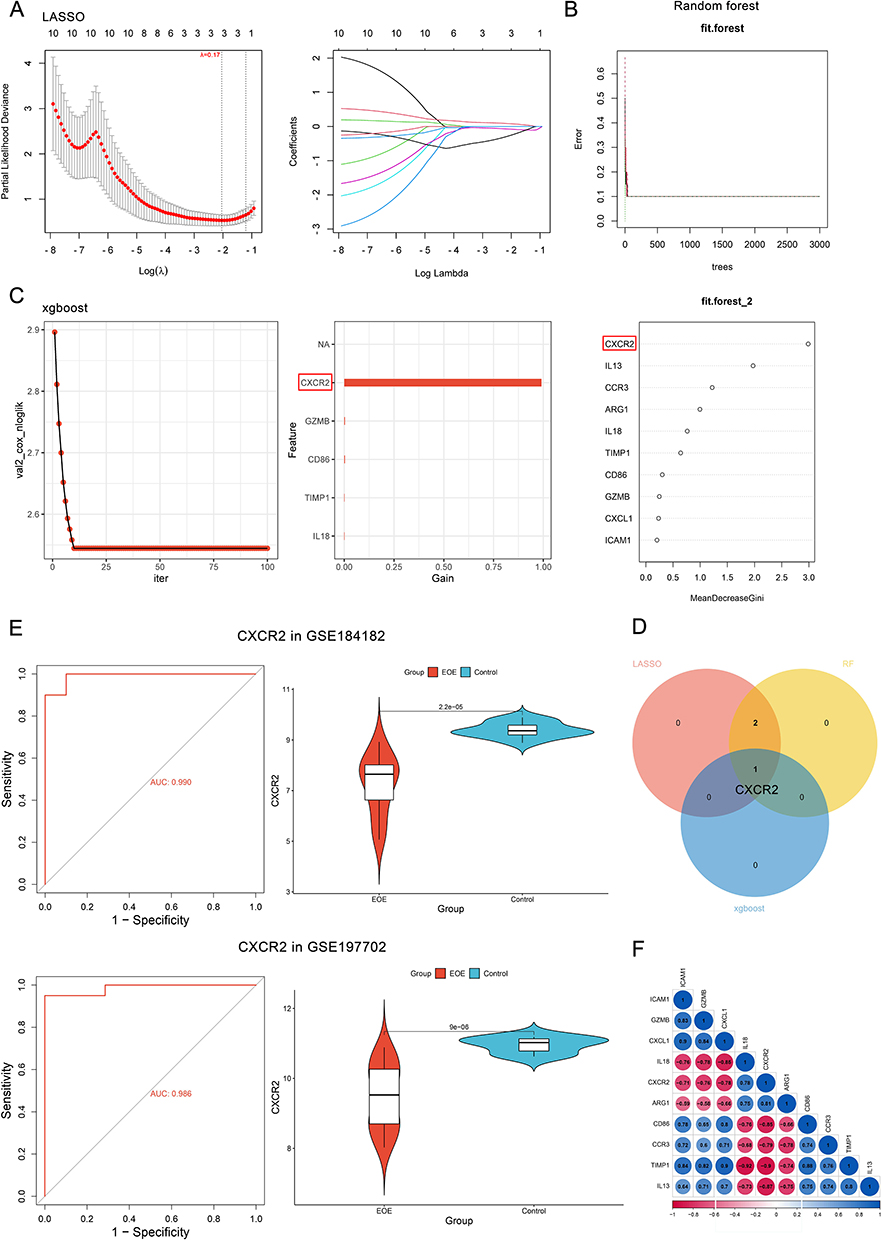 |
Figure 5 Identification of hub diagnostic markers by machine-learning algorithms. (A) LASSO logistic regression algorithm screening out potential diagnostic biomarkers with Lambda (λ) = 0.17; Different colors representing different genes. (B) RF algorithm identifying diagnostic biomarkers. (C) XGBoost identifying diagnostic biomarkers. The CXCR2 labelled by the red square shows the highest feature importance in differentiating by XGBoost machine-learning algorithm. (D) A Venn diagram displaying the intersected diagnostic biomarker of the three algorithms. (E) Violin plots demonstrating the expression level of key marker between the pediatric EoE and control groups in both discovery and validation datasets; ROC curves showing its diagnostic efficacy. (F) Correlations between the ten genes of the selected cluster in the last procedure. Abbreviations: LASSO, least absolute shrinkage and selection operator; RF, random forest; XGBoost, eXtreme Gradient Boosting; ROC, receiver operating characteristic curve; EoE, eosinophilic esophagitis; CXCR2, CXC chemokine receptor 2. |
Immune Cell Infiltration Abundance and Correlation Analysis
Immune infiltration analysis was carried out to clarify the immune-relation of EoE in pediatric patients by the CIBERSORT algorithm. Regarding EoE and control samples, the proportion of 22 types of immune cells was calculated and visualized by Figure 6A. Compared with healthy control samples, children with EoE generally had a higher level of eosinophils, resting mast cells, and Tregs (P < 0.05) (Figure 6B). Moreover, analysis of the correlations between infiltrating immune cells showed that Tregs were positively associated with resting mast cells (r = 0.56) and eosinophils (r = 0.51); resting NK cells had a negative correlation with M2 macrophages (r = −0.49); memory B cells were also negatively associated with M0 macrophages (r = −0.52); gamma delta T cells displayed a negative association with activated dendritic cells (r = −0.50) (Figure 6C). Moreover, correlation analysis indicated significant associations of the expression level of CXCR2 and the abundance of various immune cells, including a negative correlation with Tregs (correlation coefficient = −0.51), and a positive correlation with neutrophils (correlation coefficient = 0.49) via the Spearman method (Figure 6D and E). These immune cells might promote the progression of the immune microenvironment of EoE in children.
 |
Figure 6 Immune cell infiltration analysis. (A) The boxplot showing the relative proportions of 21 types of immune cells calculated by the “CIBERSORT” algorithm in each sample. (B) The boxplot comparing the relative abundance of 21 immune cell types between EoE and healthy groups. “*”, P value < 0.05; “**”, P value < 0.01. (C) The Spearman correlations between immune cell types. (D-E) The Spearman correlations of infiltrating immune cells and the CXCR2 gene. The red boxes in D label the most significant positive correlation coefficient with neutrophils (the upper one) and the most significant negative correlation coefficient with Tregs (the lower one). (F) The diagnostic performance of CXCR2 in blood and esophageal tissue samples in GSE156651 dataset. (G) The diagnostic performance of CXCR2 in differential diagnosis under different pathologies, including GERD and EoE-like esophagitis. Abbreviations: GERD, gastroesophageal reflux disease; EoE, eosinophilic esophagitis; CXCR2, CXC chemokine receptor 2. |
The Differential Diagnosis Efficacy and GSEA Results of CXCR2
The analysis result of whole blood samples in the GSE156651 dataset suggested a moderate diagnostic efficacy of CXCR2 (AUC = 0.750), and the result of tissue samples demonstrated a great performance (AUC = 1.000) (Figure 6F). Besides, the application of CXCR2 as a biomarker of differential diagnosis could be extended to those who have gastroesophageal reflux disease (GERD), which leads to an AUC = 0.944 in GSE41687. In GSE148381, the value for lymphocytic esophagitis = 0.820, for EoE-like esophagitis = 0.908, and for non-specific esophagitis = 0.790 (Figure 6G).
Furthermore, we performed GSEA analysis, and the results suggested that samples expressing lower levels of CXCR2 were highly enriched in inflammatory response: IL2-STAT5 signaling pathway and interferon gamma (IFN-γ) response than those with high expression of CXCR2 (Figure 7A).
 |
Figure 7 The regulatory network of CXCR2. (A) GSEA showing enriched functions in low and high CXCR2-expressing EoE groups. (B)The Venn diagram showing the intersected miRNAs between the GSE55794 dataset, miRWalk database and miRTarBase database. (C) The lncRNA-miRNA-gene (ceRNA) regulatory network of CXCR2. The pink color refers to five lncRNAs (NEAT1, SNHG14, PWAR5, GUSBP11, and XIST) that participate in the regulation of both miRNAs, while the green color refers to those lncRNAs regulating any single miRNA. (D) The expression level of the above selected miRNA (hsa-miR-28-5p and hsa-miR-296-3p) in the GSE55794 dataset obtained from pediatric esophageal tissues. (E) The diagnostic performance of CCL26 upon different situations. (F) The significant inverse correlations between CXCR2 and Th2 inflammatory factors: IL13 and IL5. Abbreviations: EoE, eosinophilic esophagitis; GSEA, gene set enrichment analysis. |
Prediction of the lncRNA-miRNA-CXCR2 mRNA Regulatory Network
To identify potential regulatory mechanisms of CXCR2, its targeted miRNAs were predicted by integrating data from the miRWalk database, the miRTarBase database and the GSE55794 dataset, which in total intersected two unique miRNAs: the up-regulated hsa-miR-28-5p and down-regulated hsa-miR-296-3p in the esophagus of pediatric EoE subjects compared to normal controls (Figure 7B, Table 2). Subsequently, we analyzed potential lncRNAs for these miRNAs in the ENCORI database, and the ceRNA network contained CXCR2, two miRNAs, and fifty-four lncRNAs (Figure 7C). Five lncRNAs: NEAT1, SNHG14, PWAR5, GUSBP11, and XIST participated in the regulation of both miRNAs. The expression levels of hsa-miR-28-5p and hsa-miR-296-3p are shown by Figure 7D. Understanding the role of miRNAs in the gene expression regulatory network may help obtain a novel insight into disease progression and treatment.
 |
Table 2 Predicted Regulatory miRNAs of CXCR2 mRNA in Pediatric EoE Patients |
Prediction of Therapeutic Reagents for Pediatric EoE
Potential therapeutic reagents for EoE therapy were predicted by the CMAP database, and the results suggested that ingenol, homatropine, colforsin, tienilic-acid, scoulerine, vinblastine, mifobate, fulvestrant, parecoxib along with cefotaxime having high potentials (Table 3).
 |
Table 3 Predicted Therapeutic Small Molecules for Pediatric EoE |
Discussion
Deeper understanding of the molecular mechanism of pediatric EoE could contribute to developing novel approaches to alleviate such an atopic disease.52
Among chronic pediatric diseases, EoE leads to one of the lowest qualities of life,53 and up to 10% of patients did not present with canonical endoscopic signs.54 Nowadays, it ranks the second cause of chronic esophagitis after GERD and is prominently refractory to proton pump inhibitors (PPIs) therapy (accounting for 10–30% patients).55 Prior studies identified several biomarkers for EoE diagnosis, including altered eosinophils biomarkers and a single/combination of miRNA(s) from esophagus/blood in distinguishing EoE.56,57 As a member of the eotaxin family of chemokines in EoE, Eotaxin-3 (CCL26) is the most highly induced biomarker in EoE patients in comparison with those healthy individuals;58 However, cohort analysis showed a weaker performance of CCL26 in differentiating non-specific esophagitis (AUC = 0.680), GERD (AUC = 0.567), EoE-like esophagitis (AUC= 0.827), and lymphocytic esophagitis (AUC = 0.760) from EoE. Similarly, the eosinophils-related cytokine receptor IL5RA showed worse performance than CXCR235 (Figure 7E). The AUC value ≥ 0.7 of the ROC suggested the acceptable prediction value of CXCR2.60
A novel molecular diagnostic panel relying on the TaqMan-qPCR-based low-density array system could detect EoE patients via an algorithm of 96 genes; however, it has to combine with pH-impedance testing to distinguish EoE samples from acid-induced pathologies, as the data in detecting GERD samples shows.61 Besides, a recent work reported a failure in searching for available serum miRNAs to differentiate pediatric EoE cases.62 There is still little evidence showing circulating miRNAs in the serum of EoE subjects.62
In addition to the above-mentioned attempts, previous studies aiming at discovering common non-invasive indicators for EoE diagnosis, either failed in population testing,9,63 scarcely tested in children,64–66 or still staged in laboratory (ie, exosomes, esophageal microbiome, or non-targeted metabolomics).67 For example, a panel of 8 cytokines (IL-4, IL-13, IL-5, IL-6, IL-12p70, CD40L, IL-1α, and IL-17) in plasma for identifying EoE has been tested but merely with a 61% sensitivity and 83% specificity.59 Two studies explored dysregulated 15(S)-hydroxyeicosatetraenoic acid, a metabolite elevated by 2.4-fold in the serum of EoE patients, as well as increased plasma urea cycle metabolites (ie, putrescine, N-acetylputrescine, and dimethylarginine) in differentiating affected/normal subjects.68,69 The former index is not tested in children, and PPI use influences urea cycle metabolites.69 As to the microbial components of esophageal mucosa, healthy flora mainly consisted of: Streptococci, while flora in EoE enriched Neisseria, Corynebacterium, and Haemophilus, and downregulated Porphyromonas.67 Furthermore, former attempts testing fractionated exhaled nitric oxide testing (FeNO) and salivary miRNA levels (miR-26b-5p, miR-27b-3p, Let-7i-5p, miR-142-5p, miR-30a-5p, and miR-205-5p), performed not well in differentiating EoE and healthy samples,70,71 with the alliance of the above-mentioned six miRNAs reached a 70% sensitivity and 68% specificity in children despite that miR-205-5p had the largest difference between the EoE and non-EoE groups.71 Other works determined some candidate salivary miRNAs in adults, such as miR-4668-5p, while their efficacy in pediatric samples required evaluation.72 Though greater efforts paid to seeking non-invasive markers of EoE, a robust candidate has not been screened out.73
In the present study, we integrated comprehensive bioinformatical methods to screen out CXCR2 as an independent diagnostic marker of pediatric EoE. ROC curves suggested its great performance in diagnosing EoE using biopsy and the validation result from whole blood samples further supported its value in children as an available and acceptant clinical testing (merely need to extract peripheral blood).74 Moreover, the evidence demonstrating the highly conserved transcriptomic signature of EoE in children subjects across different countries, genders, age, allergic status, and triggers, to some extent, favored the credibility of our conclusion.9,75,76 The fact that EoE and GERD patients shared some similar clinical manifestations (ie, dysphagia, epigastric pain, food impactions, or prominent esophageal eosinophilia infiltration) and diagnosing EoE by the presence of ≥ 15 eos/high power field (x400) in the esophageal tissue biopsy or other eosinophilic biomarkers are not that solid,7 makes this biomarker more important.77 Prior studies have confirmed that pediatric EoE patients showed higher levels of Tregs in their esophageal epithelium than GERD patients and healthy children,78–80 which was in opposite to adult EoE patients that had impaired induction of Tregs.81 Such difference indicated different pathophysiological mechanisms of EoE in adults and children, stressing the importance of investigating the disease in pediatric populations. Notably, CXCR2 is an independent index from eosinophils, as its expression level is negatively associated with Tregs while the number of Tregs shows no significant correlation with that of eosinophils (r = −0.04, P = 0.90).82,83 As a G protein-coupled receptor (GPCR) for cellular signal transduction,84 CXCR2 is scarcely expressed by eosinophils but by other cell types related with chronic inflammation, such as neutrophils, dendritic cells, macrophages, mast cells, endothelial cells, and lymphocytes,85 mainly serving as one key mediator of neutrophils migration.86 Though there is a lack of researches focusing on the role of neutrophils in EoE, currently published literatures validated their unequivocal deficiency in other atopic diseases and roles in eliciting IgG-mediated anaphylaxis in patients with food allergy (one important etiology of EoE).87,88 Lower levels of CXCR2 can be attributed to decreased expression of the receptor by neutrophils,86 potentially induced by overexpressed IFN-γ.89 Recently, it has been observed that neutrophils could produce platelet-activating factors in allergic conditions,88 while platelets interact with neutrophils, monocytes as well as eosinophils via forming platelet-leukocyte complexes.90
Subsequently, the impact of immune cell infiltration on pediatric EoE was studied, and GSEA analysis of whole transcriptomic features of pediatric EoE samples indicated the tendency towards antigen processing and presentation, conferring to food allergens- induced Th2 inflammation of EoE that could be ameliorated by food antigen avoidance.7 This process relied on migrated leukocytes, particularly the activated Th2 lymphocytes, mast cells, basophils, invariant natural killer cells (iNKTs), and eosinophils to their site.7 Functions of important inflammatory mediators, such as IL13, depend on the activation of STAT1 and STAT6 that belong to the enriched JAK-STAT signaling pathway.91 Also, KEGG enrichment analysis recognized this crucial type 2 cytokine signaling pathway.92 Besides, GO analysis of DEGs indicated their enrichment in inflammatory and immune responses. For MF, DEGs were enriched in 12-lipoxygenase (12-LOX) activity. Studies have suggested dysregulated arachidonic acid (AA) metabolism in eosinophilic allergic diseases and that 12-LOX exerted regulatory roles in eosinophilic airway inflammation, along with 15-lipoxygenase.93 Besides, the Reactome enrichment analysis enriched the pathway of biosynthesis of specialized pro-resolving mediators (SPMs) that was carried out by 12-LOX/15-LOX.94 In addition, enriched terms of NF-kappa B family members-mediated signaling in BP corresponded to the NF-kappa B signaling pathway in KEGG, and its members (NFKB1, NFKB2, RELA, REL, and RELB) were identified to be main regulatory TFs in the upper stream of key module genes of the PPI network. Their down stream-modulated IL4 and IL13 signaling could redirect Th1 and Th2 cells polarization towards Th2 cells.92,95 Moreover, we observed that the DEGs got involved in regulating signaling by interleukins, cytokine signaling in immune system, and G protein-coupled receptor signaling pathway, which further strengthened the potentiality of CXCR2 as a diagnostic biomarker for EoE. The correlation heatmap has indicated that CXCR2 had a high (the second highest) sum of correlation coefficients. The correlation analysis also indicated a strong correlation between CXCR2 and type 2 inflammatory signature genes (ie, IL5 and IL13) in the esophageal epithelium (Figure 7F).
Treatment merely targeting at infiltrating eosinophils appeared to be not sufficient, as anti-IL5 monoclonal antibody (mAb) depleting eosinophils did not reduce symptoms or any other chronic inflammatory manifestations in esophagus.96,97 This might suggest that elevated eosinophils were recruited due to Th2 inflammation and not necessary for maintaining such eosinophilic process. Besides, a recent study suggested the utilization of CXCR4 antagonist to protect mice models from such inflammation, which raised the interest whether targeting CXCR2 could achieve a similar effect. Moreover, prediction from the CMAP database indicated potential therapeutic molecules reversing the change trend of pediatric EoE transcriptome.
Finally, an eight-axis ceRNA network consisting of the hub diagnostic marker, two miRNAs, and five lncRNA was built to reveal the regulatory mechanism of CXCR2, in which lncRNAs NEAT1, SNHG14, PWAR5, GUSBP11, and XIST competed with both miRNAs and hence had the potential to be core targets in the treatment of pediatric EoE. miRNA is a small non-coding RNA molecule (containing about 22 nucleotides) mainly functions to inhibit target mRNA translation via binding 3’ untranslated region (UTR).98 LncRNAs act on miRNAs to further regulate mRNA, forming lncRNA/miRNA/mRNA regulatory axis. The hsa-miR-28-5p was involved with immune tolerance regulation of transplanted organs and its upregulation in EoE might lead to reduced expression levels of CXCR299 and therefore serves as a therapeutic target for pediatric EoE. It should be indicated that our conclusions came from previously published datasets. The suggested pathogenic mechanisms of miR-28-5p and CXCR2 related to EoE require validation in cells/animal models in the future.
Limitations
The above results had several limitations: [1] Limited sample size of pediatric EoE patients and a general lack of corresponding clinical data; [2] This study was limited to the transcriptomic level and current findings are awaited to be validated by prospective clinical cohorts or basic experiments; [3] Certain evaluations of the efficacy of CXCR2 in differential diagnosis were performed in adults’ cohort due to a lack of corresponding data of pediatric patients; [4] The efficacy of CXCR2 on differential diagnosis in atopic conditions were not assessed for a lack of data of EoE patients with atopic comorbidities on the same platform; [5] The therapeutic effects of targeting at CXCR2 remain uncertain; [6] The diagnostic/therapeutic efficacy of the miR-28-5p still requires to be investigated; [7] The prognostic value of CXCR2/miR-28-5p is still awaited to be revealed. Therefore, we recommend establishing multi-center, large-scale, prospective pediatric EoE patients’ cohorts to collect tissue samples, preserve clinical data, and follow-up outcomes to further validate our results, as well as exploring more accurate and applicable biomarkers of EoE.
Conclusion
This study applied systematical methodologies to reveal that immune-related gene CXCR2 is a potential diagnostic biomarker of EoE in pediatric patients. In addition, the CIBERSORT algorithm used to explore dysregulated proportions of subtype of immune cells provided novel insights into optimized immunomodulatory therapies against EoE.
Data Sharing Statement
The datasets utilized in this study could be accessed from online repositories GEO, with accession number(s) GSE184182, GSE197702; GSE156651; GSE41687; GSE148381; GSE55794.
Ethics Approval and Informed Consent
This study has been approved by the Institutional Review Board (IRB) of union hospital, Tongji medical college, Huazhong university of science and technology, China; No:2023-0942.
Acknowledgments
Junhao Wu and Caihan Duan are co-first authors for this study. We thanked all authors of our references and the contributors of the uploaded EoE-related datasets in the GEO database.
Funding
This study was supported by the National Natural Science Foundation of China, No. 82170570.
Disclosure
All authors declared that this work was performed without any conflicts of interest.
References
1. Barni S, Arasi S, Mastrorilli C, et al. Pediatric eosinophilic esophagitis: a review for the clinician. Ital J Pediatr. 2021;47(1):230. doi:10.1186/s13052-021-01178-2
2. Dellon ES, Hirano I. Epidemiology and Natural History of Eosinophilic Esophagitis. Gastroenterology. 2018;154(319–332.e3). doi:10.1053/j.gastro.2017.06.067
3. Dellon ES, Jensen ET, Martin CF, et al. Prevalence of eosinophilic esophagitis in the United States. Clin Gastroenterol Hepatol. 2014;12(589–96.e1):589–596.e1. doi:10.1016/j.cgh.2013.09.008
4. Gill R, Durst P, Rewalt M, et al. Eosinophilic esophagitis disease in children from West Virginia: a review of the last decade (1995-2004). Am J Gastroenterol. 2007;102:2281–2285. doi:10.1111/j.1572-0241.2007.01352.x
5. Giriens B, Yan P, Safroneeva E, et al. Escalating incidence of eosinophilic esophagitis in Canton of Vaud, Switzerland, 1993-2013: a population-based study. Allergy. 2015;70:1633–1639. doi:10.1111/all.12733
6. Hruz P, Straumann A, Bussmann C, et al. Escalating incidence of eosinophilic esophagitis: a 20-year prospective, population-based study in Olten County, Switzerland. J Allergy Clin Immunol. 2011;128(1349–1350.e5). doi:10.1016/j.jaci.2011.09.013
7. Cianferoni A, Spergel JM. Eosinophilic Esophagitis and Gastroenteritis. Curr Allergy Asthma Rep. 2015;15(9):58. doi:10.1007/s11882-015-0558-5
8. Schoepfer AM, Safroneeva E, Bussmann C, et al. Delay in diagnosis of eosinophilic esophagitis increases risk for stricture formation in a time-dependent manner. Gastroenterology. 2013;145:1230–6.e1–2. doi:10.1053/j.gastro.2013.08.015
9. Adel-Patient K, Campeotto F, Grauso M, et al. Assessment of local and systemic signature of eosinophilic esophagitis (EoE) in children through multi-omics approaches. Front Immunol. 2023;14:1108895. doi:10.3389/fimmu.2023.1108895
10. Kottyan LC, Rothenberg ME. Genetics of eosinophilic esophagitis. Mucosal Immunol. 2017;10(3):580–588. doi:10.1038/mi.2017.4
11. O’Shea KM, Aceves SS, Dellon ES, et al. Pathophysiology of Eosinophilic Esophagitis. Gastroenterology. 2018;154(2):333–345. doi:10.1053/j.gastro.2017.06.065
12. Krupp NL, Sehra S, Slaven JE, et al. Increased prevalence of airway reactivity in children with eosinophilic esophagitis. Pediatr Pulmonol. 2016;51(5):478–483. doi:10.1002/ppul.23327
13. Ruffner MA, Spergel JM. Eosinophilic Esophagitis in Children. Curr Allergy Asthma Rep. 2017;17(8):54. doi:10.1007/s11882-017-0721-2
14. Aceves SS. Tissue remodeling in patients with eosinophilic esophagitis: what lies beneath the surface? J Allergy Clin Immunol. 2011;128(5):1047–1049. doi:10.1016/j.jaci.2011.09.026
15. Rothenberg ME. Molecular, genetic, and cellular bases for treating eosinophilic esophagitis. Gastroenterology. 2015;148(6):1143–1157. doi:10.1053/j.gastro.2015.02.002
16. Bacchelli C, Williams HJ. Opportunities and technical challenges in next-generation sequencing for diagnosis of rare pediatric diseases. Expert Rev Mol Diagn. 2016;16(10):1073–1082. doi:10.1080/14737159.2016.1222906
17. Choi RY, Coyner AS, Kalpathy-Cramer J, et al. Introduction to Machine Learning, Neural Networks, and Deep Learning. Transl Vis Sci Technol. 2020;9:14. doi:10.1167/tvst.9.2.14
18. Fabris F, Palmer D, de Magalhães JP, et al. Comparing enrichment analysis and machine learning for identifying gene properties that discriminate between gene classes. Brief Bioinform. 2020;21(3):803–814. doi:10.1093/bib/bbz028
19. Sajda P. Machine learning for detection and diagnosis of disease. Annu Rev Biomed Eng. 2006;8(1):537–565. doi:10.1146/annurev.bioeng.8.061505.095802
20. Slack FJ, Chinnaiyan AM. The Role of Non-coding RNAs in Oncology. Cell. 2019;179(5):1033–1055. doi:10.1016/j.cell.2019.10.017
21. Zhang X, Wang W, Zhu W, et al. Mechanisms and Functions of Long Non-Coding RNAs at Multiple Regulatory Levels. Int J Mol Sci;2019. 20. doi:10.3390/ijms21010020
22. Tay Y, Rinn J, Pandolfi PP. The multilayered complexity of ceRNA crosstalk and competition. Nature. 2014;505(7483):344–352. doi:10.1038/nature12986
23. Erwin EA, Jaramillo LM, Smith B, et al. Sex Differences in Blood Transcriptional Profiles and Clinical Phenotypes in Pediatric Patients with Eosinophilic Esophagitis. J Allergy Clin Immunol Pract. 2021;9(3350–3358.e8). doi:10.1016/j.jaip.2021.06.043
24. Sleiman PM, Wang ML, Cianferoni A, et al. GWAS identifies four novel eosinophilic esophagitis loci. Nat Commun. 2014;5:5593. doi:10.1038/ncomms6593
25. Kottyan LC, Trimarchi MP, Lu X, et al. Replication and meta-analyses nominate numerous eosinophilic esophagitis risk genes. J Allergy Clin Immunol. 2021;147(1):255–266. doi:10.1016/j.jaci.2020.10.018
26. Chang X, March M, Mentch F, et al. A genome-wide association meta-analysis identifies new eosinophilic esophagitis loci. J Allergy Clin Immunol. 2022;149(3):988–998. doi:10.1016/j.jaci.2021.08.018
27. Yang K, Dinasarapu AR, Reis ES, et al. CMAP: complement Map Database. Bioinformatics. 2013;29(14):1832–1833. doi:10.1093/bioinformatics/btt269
28. Barrett T, Wilhite SE, Ledoux P, et al. NCBI GEO: archive for functional genomics data sets--update. Nucleic Acids Res. 2013;41:D991–5. doi:10.1093/nar/gks1193
29. Menard-Katcher C, Liu C, Galbraith MD, et al. Fibrostenotic eosinophilic esophagitis phenotype is defined by a proliferative gene signature. Allergy. 2023;78:579–583. doi:10.1111/all.15557
30. Ritchie ME, Phipson B, Wu D, et al. limma powers differential expression analyses for RNA-sequencing and microarray studies. Nucleic Acids Res. 2015;43(7):e47. doi:10.1093/nar/gkv007
31. Yu G, Wang LG, Han Y, et al. clusterProfiler: an R package for comparing biological themes among gene clusters. Omics. 2012;16:284–287. doi:10.1089/omi.2011.0118
32. Subramanian A, Tamayo P, Mootha VK, et al. Gene set enrichment analysis: a knowledge-based approach for interpreting genome-wide expression profiles. Proc Natl Acad Sci U S A. 2005;102(43):15545–15550. doi:10.1073/pnas.0506580102
33. Liberzon A, Subramanian A, Pinchback R, et al. Molecular signatures database (MSigDB) 3.0. Bioinformatics. 2011;27(12):1739–1740. doi:10.1093/bioinformatics/btr260
34. Gustavsson EK, Zhang D, Reynolds RH, et al. ggtranscript: an R package for the visualization and interpretation of transcript isoforms using ggplot2. Bioinformatics. 2022;38:3844–3846. doi:10.1093/bioinformatics/btac409
35. Langfelder P, Horvath S. WGCNA: an R package for weighted correlation network analysis. BMC Bioinf. 2008;9(1):559. doi:10.1186/1471-2105-9-559
36. Morris JH. Gene Ontology Consortium: going forward. Nucleic Acids Res. 2015;43(D1):D1049–56. doi:10.1093/nar/gku1179
37. Szklarczyk D, Franceschini A, Wyder S, et al. STRING v10: protein-protein interaction networks, integrated over the tree of life. Nucleic Acids Res. 2015;43:D447–52. doi:10.1093/nar/gku1003
38. Moni MA, Xu H, Liò P. CytoCom: a Cytoscape app to visualize, query and analyse disease comorbidity networks. Bioinformatics. 2015;31(6):969–971. doi:10.1093/bioinformatics/btu731
39. Szklarczyk D, Morris JH, Cook H, et al. The STRING database in 2017: quality-controlled protein-protein association networks, made broadly accessible. Nucleic Acids Res. 2017;45:D362–d368. doi:10.1093/nar/gkw937
40. Rigatti SJ. Random Forest. J Insur Med. 2017;47:31–39. doi:10.17849/insm-47-01-31-39.1
41. Wang H, Yang F, Luo Z. An experimental study of the intrinsic stability of random forest variable importance measures. BMC Bioinf. 2016;17(1):60. doi:10.1186/s12859-016-0900-5
42. Li Z, Sillanpää MJ. Overview of LASSO-related penalized regression methods for quantitative trait mapping and genomic selection. Theor Appl Genet. 2012;125(3):419–435. doi:10.1007/s00122-012-1892-9
43. Kursa MB. Robustness of Random Forest-based gene selection methods. BMC Bioinf. 2014;15(1):8. doi:10.1186/1471-2105-15-8
44. Byeon H. Can the Random Forests Model Improve the Power to Predict the Intention of the Elderly in a Community to Participate in a Cognitive Health Promotion Program? Iran J Public Health. 2021;50(2):315–324. doi:10.18502/ijph.v50i2.5346
45. Engebretsen S, Bohlin J. Statistical predictions with glmnet. Clin Clin Epigenet. 2019;11(1):123. doi:10.1186/s13148-019-0730-1
46. Tolles J, Meurer WJ. Logistic Regression: relating Patient Characteristics to Outcomes. JAMA. 2016;316(5):533–534. doi:10.1001/jama.2016.7653
47. Wang R, Zhang J, Shan B, et al. XGBoost Machine Learning Algorithm for Prediction of Outcome in Aneurysmal Subarachnoid Hemorrhage. Neuropsychiatr Dis Treat. 2022;18:659–667. doi:10.2147/NDT.S349956
48. Le T, Aronow RA, Kirshtein A, et al. A review of digital cytometry methods: estimating the relative abundance of cell types in a bulk of cells. Brief Bioinform. 2021;22.
49. Dweep H, Sticht C, Pandey P, et al. miRWalk--database: prediction of possible miRNA binding sites by ”walking” the genes of three genomes. J Biomed Inform. 2011;44:839–847. doi:10.1016/j.jbi.2011.05.002
50. Huang HY, Lin YC, Cui S, et al. miRTarBase update 2022: an informative resource for experimentally validated miRNA-target interactions. Nucleic Acids Res. 2022;50:D222–d230. doi:10.1093/nar/gkab1079
51. Li JH, Liu S, Zhou H, et al. starBase v2.0: decoding miRNA-ceRNA, miRNA-ncRNA and protein-RNA interaction networks from large-scale CLIP-Seq data. Nucleic Acids Res. 2014;42:D92–7. doi:10.1093/nar/gkt1248
52. Morris JH. The Gene Ontology (GO) project in 2006. Nucleic Acids Res. 2006;34(90001):D322–6. doi:10.1093/nar/gkj021
53. Ingerski LM, Modi AC, Hood KK, et al. Health-related quality of life across pediatric chronic conditions. J Pediatr. 2010;156(4):639–644. doi:10.1016/j.jpeds.2009.11.008
54. Dellon ES. Diagnostics of eosinophilic esophagitis: clinical, endoscopic, and histologic pitfalls. Dig Dis. 2014;32(1–2):48–53. doi:10.1159/000357009
55. Liacouras CA, Furuta GT, Hirano I, et al. Eosinophilic esophagitis: updated consensus recommendations for children and adults. J Allergy Clin Immunol. 2011;128(1):3–20.e6. doi:10.1016/j.jaci.2011.02.040
56. Zahm AM, Menard-Katcher C, Benitez AJ, et al. Pediatric eosinophilic esophagitis is associated with changes in esophageal microRNAs. Am J Physiol Gastrointest Liver Physiol. 2014;307(8):G803–12. doi:10.1152/ajpgi.00121.2014
57. Sawant DV, Yao W, Wright Z, et al. Serum MicroRNA-21 as a Biomarker for Allergic Inflammatory Disease in Children. Microrna. 2015;4:36–40. doi:10.2174/2211536604666150220232507
58. Hogan SP, Rothenberg ME. Review article: the eosinophil as a therapeutic target in gastrointestinal disease. Aliment Pharmacol Ther. 2004;20(11–12):1231–1240. doi:10.1111/j.1365-2036.2004.02259.x
59. Blanchard C, Stucke EM, Rodriguez-Jimenez B, et al. A striking local esophageal cytokine expression profile in eosinophilic esophagitis. J Allergy Clin Immunol. 2011;127:208–17, 217.e1–7. doi:10.1016/j.jaci.2010.10.039
60. Mandrekar JN. Receiver operating characteristic curve in diagnostic test assessment. J Thorac Oncol. 2010;5(9):1315–1316. doi:10.1097/JTO.0b013e3181ec173d
61. Wen T, Stucke EM, Grotjan TM, et al. Molecular diagnosis of eosinophilic esophagitis by gene expression profiling. Gastroenterology. 2013;145(6):1289–1299. doi:10.1053/j.gastro.2013.08.046
62. Cañas JA, Tabares A, Barbero C, et al. Proton-pump Inhibitor Response Prediction Using Esophageal microRNAs in Children With Eosinophilic Esophagitis. J Pediatr Gastroenterol Nutr. 2020;71(6):755–763. doi:10.1097/MPG.0000000000002957
63. Dellon ES, Rusin S, Gebhart JH, et al. Utility of a Noninvasive Serum Biomarker Panel for Diagnosis and Monitoring of Eosinophilic Esophagitis: a Prospective Study. Am J Gastroenterol. 2015;110(6):821–827. doi:10.1038/ajg.2015.57
64. Dellon ES, Higgins LL, Beitia R, et al. Prospective assessment of serum periostin as a biomarker for diagnosis and monitoring of eosinophilic oesophagitis. Aliment Pharmacol Ther. 2016;44(2):189–197. doi:10.1111/apt.13672
65. Wright BL, Ochkur SI, Olson NS, et al. Normalized serum eosinophil peroxidase levels are inversely correlated with esophageal eosinophilia in eosinophilic esophagitis. Dis Esophagus. 2018;31.
66. Johansson MW, McKernan EM, Fichtinger PS, et al. α(IIb)-Integrin (CD41) associated with blood eosinophils is a potential biomarker for disease activity in eosinophilic esophagitis. J Allergy Clin Immunol. 2020;145:1699–1701. doi:10.1016/j.jaci.2020.01.022
67. Grueso-Navarro E, Navarro P, Laserna-Mendieta EJ, et al. Blood-Based Biomarkers for Eosinophilic Esophagitis and Concomitant Atopic Diseases: a Look into the Potential of Extracellular Vesicles. Int J Mol Sci;2023. 24. doi:10.3390/ijms25010024
68. Bhattacharya B, Carlsten J, Sabo E, et al. Increased expression of eotaxin-3 distinguishes between eosinophilic esophagitis and gastroesophageal reflux disease. Hum Pathol. 2007;38(12):1744–1753. doi:10.1016/j.humpath.2007.05.008
69. Moye LM, Liu Y, Coarfa C, et al. Plasma Urea Cycle Metabolites May Be Useful Biomarkers in Children With Eosinophilic Esophagitis. Front Pediatr. 2018;6:423. doi:10.3389/fped.2018.00423
70. Johnson K, Iyer V, Katzka D, et al. Poor Relationship Between Fractionated Exhaled Nitric Oxide and Disease Activity in Eosinophilic Esophagitis. Dysphagia. 2019;34(1):138–144. doi:10.1007/s00455-018-9925-4
71. Jhaveri PB, Lambert KA, Bogale K, et al. Salivary microRNAs in pediatric eosinophilic esophagitis. Allergy Asthma Proc. 2023;44(2):145–152. doi:10.2500/aap.2023.44.220102
72. Bhardwaj N, Sena M, Ghaffari G, et al. MiR-4668 as a Novel Potential Biomarker for Eosinophilic Esophagitis. Allergy Rhinol Providence. 2020;11:2152656720953378. doi:10.1177/2152656720953378
73. Hines BT, Rank MA, Wright BL, et al. Minimally invasive biomarker studies in eosinophilic esophagitis: a systematic review. Ann Allergy Asthma Immunol. 2018;121(2):218–228. doi:10.1016/j.anai.2018.05.005
74. Lin M, Zhang Y, Niu Z, et al. Transcriptomic responses of peripheral blood cells to coronary artery disease. Biosci Trends. 2018;12(4):354–359. doi:10.5582/bst.2018.01078
75. Blanchard C, Wang N, Stringer KF, et al. Eotaxin-3 and a uniquely conserved gene-expression profile in eosinophilic esophagitis. J Clin Invest. 2006;116:536–547. doi:10.1172/JCI26679
76. Shoda T, Wen T, Aceves SS, et al. Eosinophilic oesophagitis endotype classification by molecular, clinical, and histopathological analyses: a cross-sectional study. Lancet Gastroenterol Hepatol. 2018;3(7):477–488. doi:10.1016/S2468-1253(18)30096-7
77. Spechler SJ, Genta RM, Souza RF. Thoughts on the complex relationship between gastroesophageal reflux disease and eosinophilic esophagitis. Am J Gastroenterol. 2007;102(6):1301–1306. doi:10.1111/j.1572-0241.2007.01179.x
78. Zhang H, Kong H, Zeng X, et al. Subsets of regulatory T cells and their roles in allergy. J Transl Med. 2014;12(1):125. doi:10.1186/1479-5876-12-125
79. Rothenberg ME, Mishra A, Collins MH, et al. Pathogenesis and clinical features of eosinophilic esophagitis. J Allergy Clin Immunol. 2001;108(6):891–894. doi:10.1067/mai.2001.120095
80. Fuentebella J, Patel A, Nguyen T, et al. Increased number of regulatory T cells in children with eosinophilic esophagitis. J Pediatr Gastroenterol Nutr. 2010;51(3):283–289. doi:10.1097/MPG.0b013e3181e0817b
81. Stuck MC, Straumann A, Simon H-U. Relative lack of T regulatory cells in adult eosinophilic esophagitis - no normalization after corticosteroid therapy. Allergy. 2011;66(5):705–707. doi:10.1111/j.1398-9995.2010.02525.x
82. Mousavinasab F, Babaie D, Nilipour Y, et al. Increased number of regulatory T cells in esophageal tissue of patients with eosinophilic esophagitis in comparison to gastro esophageal reflux disease and control groups. Allergol Immunopathol. 2019;47:431–436. doi:10.1016/j.aller.2019.02.005
83. Ayaki M, Manabe N, Nakamura J, et al. A Retrospective Study of the Differences in the Induction of Regulatory T Cells Between Adult Patients with Eosinophilic Esophagitis and Gastroesophageal Reflux Disease. Dig Dis Sci. 2022;67(10):4742–4748. doi:10.1007/s10620-021-07355-x
84. Boppana NB, Devarajan A, Gopal K, et al. Blockade of CXCR2 signalling: a potential therapeutic target for preventing neutrophil-mediated inflammatory diseases. Exp Biol Med (Maywood). 2014;239(5):509–518. doi:10.1177/1535370213520110
85. Petering H, Götze O, Kimmig D, et al. The biologic role of interleukin-8: functional analysis and expression of CXCR1 and CXCR2 on human eosinophils. Blood. 1999;93:694–702. doi:10.1182/blood.V93.2.694
86. Hsieh SC, Wu TH, Tsai CY, et al. Abnormal in vitro CXCR2 modulation and defective cationic ion transporter expression on polymorphonuclear neutrophils responsible for hyporesponsiveness to IL-8 stimulation in patients with active systemic lupus erythematosus. Rheumatology (Oxford). 2008;47:150–157. doi:10.1093/rheumatology/kem320
87. Cianferoni A. Non-IgE-mediated anaphylaxis. J Allergy Clin Immunol. 2021;147:1123–1131. doi:10.1016/j.jaci.2021.02.012
88. Özcan A, Boyman O. Mechanisms regulating neutrophil responses in immunity, allergy, and autoimmunity. Allergy. 2022;77(12):3567–3583. doi:10.1111/all.15505
89. Wang H, Shao Q, Wang J, et al. Decreased CXCR2 expression on circulating monocytes of colorectal cancer impairs recruitment and induces Re-education of tumor-associated macrophages. Cancer Lett. 2022;529:112–125. doi:10.1016/j.canlet.2022.01.004
90. Bartig KA, Lee KE, Mosher DF, et al. Platelet association with leukocytes in active eosinophilic esophagitis. PLoS One. 2021;16(4):e0250521. doi:10.1371/journal.pone.0250521
91. Blanchard C, Mishra A, Saito-Akei H, et al. Inhibition of human interleukin-13-induced respiratory and oesophageal inflammation by anti-human-interleukin-13 antibody (CAT-354). Clin Exp Allergy. 2005;35:1096–1103. doi:10.1111/j.1365-2222.2005.02299.x
92. Haddad EB, Cyr SL, Arima K, et al. Current and Emerging Strategies to Inhibit Type 2 Inflammation in Atopic Dermatitis. Dermatol Ther. 2022;12:1501–1533. doi:10.1007/s13555-022-00737-7
93. Miyata J, Yokokura Y, Moro K, et al. 12/15-Lipoxygenase Regulates IL-33-Induced Eosinophilic Airway Inflammation in Mice. Front Immunol. 2021;12:687192. doi:10.3389/fimmu.2021.687192
94. Singh NK, Rao GN. Emerging role of 12/15-Lipoxygenase (ALOX15) in human pathologies. Prog Lipid Res. 2019;73:28–45. doi:10.1016/j.plipres.2018.11.001
95. Zhu J. T helper 2 (Th2) cell differentiation, type 2 innate lymphoid cell (ILC2) development and regulation of interleukin-4 (IL-4) and IL-13 production. Cytokine. 2015;75(1):14–24. doi:10.1016/j.cyto.2015.05.010
96. Spergel JM, Rothenberg ME, Collins MH, et al. Reslizumab in children and adolescents with eosinophilic esophagitis: results of a double-blind, randomized, placebo-controlled trial. J Allergy Clin Immunol. 2012;129:456–63, 463.e1–3. doi:10.1016/j.jaci.2011.11.044
97. Assa’ad AH, Gupta SK, Collins MH, et al. An antibody against IL-5 reduces numbers of esophageal intraepithelial eosinophils in children with eosinophilic esophagitis. Gastroenterology. 2011;141(5):1593–1604. doi:10.1053/j.gastro.2011.07.044
98. Wilczynska A, Bushell M. The complexity of miRNA-mediated repression. Cell Death Differ. 2015;22(1):22–33. doi:10.1038/cdd.2014.112
99. Paladini SV, Pinto GH, Bueno RH, et al. Identification of Candidate Biomarkers for Transplant Rejection from Transcriptome Data: a Systematic Review. Mol Diagn Ther. 2019;23(4):439–458. doi:10.1007/s40291-019-00397-y
 © 2024 The Author(s). This work is published and licensed by Dove Medical Press Limited. The
full terms of this license are available at https://www.dovepress.com/terms.php
and incorporate the Creative Commons Attribution
- Non Commercial (unported, v3.0) License.
By accessing the work you hereby accept the Terms. Non-commercial uses of the work are permitted
without any further permission from Dove Medical Press Limited, provided the work is properly
attributed. For permission for commercial use of this work, please see paragraphs 4.2 and 5 of our Terms.
© 2024 The Author(s). This work is published and licensed by Dove Medical Press Limited. The
full terms of this license are available at https://www.dovepress.com/terms.php
and incorporate the Creative Commons Attribution
- Non Commercial (unported, v3.0) License.
By accessing the work you hereby accept the Terms. Non-commercial uses of the work are permitted
without any further permission from Dove Medical Press Limited, provided the work is properly
attributed. For permission for commercial use of this work, please see paragraphs 4.2 and 5 of our Terms.