Back to Journals » Journal of Inflammation Research » Volume 16
Identification of Cell-Cell Communications by Single-Cell RNA Sequencing in End Stage Renal Disease Provides New Insights into Immune Cell Heterogeneity
Authors Zhang R, Liu X, Ma Y, Cheng L, Ren Y, Li R
Received 28 June 2023
Accepted for publication 17 October 2023
Published 31 October 2023 Volume 2023:16 Pages 4977—5000
DOI https://doi.org/10.2147/JIR.S424911
Checked for plagiarism Yes
Review by Single anonymous peer review
Peer reviewer comments 2
Editor who approved publication: Dr Tara Strutt
Ruijing Zhang,1– 3 Xinyan Liu,2 Yuehong Ma,1,3 Lijuan Cheng,2 Yi Ren,1,3 Rongshan Li1,3
1Department of Nephrology, The Fifth Hospital of Shanxi Medical University, Taiyuan, People’s Republic of China; 2Department of Nephrology, The Second Hospital of Shanxi Medical University, Taiyuan, People’s Republic of China; 3Department of Nephrology, Shanxi Provincial People’s Hospital, Taiyuan, People’s Republic of China
Correspondence: Rongshan Li, Email [email protected]
Objective: Impaired immune system characterized by low-grade inflammation is closely associated with kidney chronic kidney disease (CKD) progression. To reveal the alterations of the function, component, and intercellular communication of immune cells during the progression of CKD.
Patients and Methods: We conducted a case-control study enrolling regular hemodialysis patients and healthy controls. Clinical data, serum and peripheral blood mononuclear cell (PBMC) samples were collected. Flow cytometry and single-cell RNA sequencing were performed to quantitatively analyze the immune cell subsets and T-cell subsets of PBMCs. scRNA data of GSE140023 containing mouse unilateral ureteral obstruction (UUO) models were analyzed the heterogeneity of immune cells.
Results: Overall reduction in peripheral blood lymphocyte subsets in patients with end-stage renal disease (ESRD) was observed. A higher ratio of Th17/Treg, Th1/Treg, and b-cell/Treg in the ESRD group was associated with a decrease in eGFR, PTH, and ferritin. Among T cell subsets identified by scRNA analysis, Th17 cells were significantly increased in the ESRD and UU0 group. TFH, Th1, and Th2 cells are located at the final stage in the developmental tree, while Treg and memory CD8+ T cells are at the beginning site. Early developmental differentiation of Th17, Th1, and Tfh cells was observed in the ESRD and UUO group. Analysis of intercellular communication between t-cell subpopulations identified two major input and output signaling pathways: the CD40 and macrophage inhibitory factor (MIF) pathways. The MIF signaling pathway primarily mediates intercellular communication among th17 effects, CD8+ t-cell, and Th17-Treg in the ESRD group, the serum level of MIF showed significant upregulation, which was closely related to Th17/Treg cells.
Conclusions: A global immune imbalance was closely associated with the deterioration in renal function and complication development. The MIF signaling pathway mediates Th17/Treg communication and promotes the trans-differentiation of Treg cells to Th17 cells in CKD progression.
Keywords: chronic kidney disease, end-stage renal disease, immune suppression, T cell plasticity, cell- cell communication
Introduction
The prevalence of chronic kidney disease (CKD) has increased rapidly in the last few decades, affecting more than 800 million people worldwide and accelerating cardiovascular disease progression.1 CKD refers to the markers of kidney damage or decreased glomerular filtration rate (GFR) persisting for >3 months according to the Kidney Disease Improving Global Outcomes (KDIGO) guidelines.2 End-stage renal disease (ESRD) is synonymous with stage 5 CKD, defined as GFR < 15 ml/min. It has been reported that impaired immune system characterized by low-grade inflammation is closely associated with kidney progression.3 During CKD progression, this impairment occurs in both innate immunity and adaptive immunity, leading to infections, poor vaccine response, atherosclerosis-associated cardiovascular diseases, etc.4
To date, the potential mechanism underlying immune dysfunction related to CKD has been widely investigated. Oxidative stress, accumulated uremic toxins and inflammatory cytokines, and other endogenous molecules can serve as damage-associated molecular patterns (DAMPs) or pathogen-associated patterns (PAMPs) to activate pattern recognition receptors (PRRs) on innate immune cells, which can regulate the innate immune response and the interaction between antigen-presenting cells (APCs) and adaptive immune cells, reducing tissue damage.5,6
Although an increase in studies has revealed the potential mechanisms underlying immune dysfunction during CKD progression, there are still many significant components that need to be clarified, such as the machinery of T-cell phenotype switching and the plasticity levels of different subsets. In this study, we investigated the immune cell composition, function, and interaction with other cells during the ESRD period, especially CD4+ T-cell plasticity and the involved signaling pathways and mediators, which could be potential therapeutic targets for preventing CKD progression and complications.
Materials and Methods
Ethical Approval and Consent
This study was performed in accordance with the International Ethical Guidelines for Human Research as stated in the Declaration of Helsinki. The medical ethics committee of the Second Hospital of Shanxi Medical University for human studies approved this study (ID: 2023YX (098)). All the participants were issued informed written consent.
Study Design and Clinical Data Collection
In this case‒control study, 14 male and 6 female ESRD patients who underwent standard hemodialysis at the Department of Nephrology, Second Hospital of Shanxi Medical University, were enrolled. Twenty healthy volunteers who were sex- and age-matched to ESRD patients comprised the healthy control group. All the participants were involved between June 1, 2022, and September 1, 2022. ESRD patients were required to meet the following inclusion/exclusion criteria. Inclusion criteria: ESRD patients receiving standard hemodialysis (HD) with arteriovenous fistulas (AVFs) for 5–10 years; the cause of kidney damage was primary kidney disease or diabetic nephropathy; and the discontinuation of corticosteroid and immunosuppression therapy for at least 1 year. Exclusion criteria: infection, tumor (including parenchymal tumor and hematological system tumor), autoimmune disease, acute infection, and other diseases; vaccination for COVID-19, influenza, and other viruses in the past 3 months; and an unwillingness or inability to cooperate due to individual reasons.
Demographic information, clinical and laboratory examination data, and medication history were collected. The basic information and characteristics of these participants are summarized in Table 1. All samples were taken from patients before dialysis.
 |
Table 1 Clinical and Medical Characteristics of Patients with ESRD and Healthy Controls |
Lymphocyte Subset Quantification
Peripheral blood samples were collected before dialysis and processed by flow cytometry after 2 hours. Lymphocyte subset quantification was performed by using a BD multi-test 6-color TBNK reagent kit (BD, 662967, CA, USA). Briefly, 50 µl of fresh anticoagulant blood was labeled with 6-color TBNK cocktails including CD3/CD8/CD45/CD4 antibodies for 15–20 mins. After loading 450μl of lysis buffer, samples were analyzed with BD CANTO II flow cytometry by BD FACS Canto Software for at least 15,000 cells per sample.
CD4+ T-Cell Subset Quantification
Peripheral blood samples were collected into heparin anticoagulant tubes before dialysis. Two hundred microliters of cell culture medium (HyClone, SH30809.01) was added to blood samples in equal volumes. Ten microliters of cell stimulation cocktail (TONBO biosciences, TNB-4975-UL100) diluted 10-fold with cell culture medium was added before a 5-hour incubation at 37 ℃. Then, 100μl of the incubated samples was added into tubes A and B. The CD4+ T-cell subsets were characterized through their corresponding phenotypes of CD markers and cytokines. The following antibodies were used for Th1/Th2/Th17 subsets: APC-conjugated anti-IFNγ, PE-conjugated anti-IL4, PE-conjugated anti-IL17A, and FITC-conjugated anti-CD4.
For Treg subset quantification, an 80μl anticoagulant blood sample was incubated with FITC-conjugated anti-CD4 and APC-conjugated CD25 antibodies for 30 mins at room temperature and vortexed with 1 ml fresh fixation/permeabilization (Thermo Fisher Scientific, 00-5123-43). The samples were incubated with PE-conjugated Foxp3 antibodies for 30 mins, washed with PBS solution and processed for analysis.
Peripheral Blood Mononuclear Cell (PBMC) Isolation and Sample Pooling
Ficoll-Paque density gradient centrifugation was applied for PBMC isolation. Dead cells were removed using a Miltenyi ® Dead Cell Removal Kit (MACS, 130-090-101). Cell viability above 85% was required for scRNA sequencing using a Countess II Automated Cell Counter. The PBMCs were diluted to a concentration of 1*106 cells/mL with sorting buffer. The 20 cellular suspensions from patients and controls were separately pooled with an equal volume.
Data Source and Data Pre-Processing
Single-cell sequencing data from the GEO database, containing four samples of mouse single-cell sequencing data in GSE140023 (control group, UUO2-day model group, UUO7-day model group, and rUUO model group). Of note, each sample contained single-cell suspension of the renal cortex of 3 mice in the same group. UUO model constructed following the methods below: 8-week-old male C57BL/6JOlaHsd mice (Enviago) were laparotomized, the left ureter was separated, and the distal and proximal bladder were ligated twice with 6/0 black woven silk thread. In reversible ureteral obstruction model, silicone rubber tubes were placed around the ureter immediately adjacent to the ligation to prevent overexpansion. After 7 days of obstruction, the ureter was again anastomosed into the bladder and the peritoneum and skin were sutured.
Single Cell Library and Sequencing
Single-cell suspensions were loaded onto 10x Chromium to capture 5000 single cells according to the manufacturer’s instructions for the 10X Genomics Chromium Single-Cell 3’ kit (V3). The following cDNA amplification and library construction steps were performed according to the standard protocol. Libraries were sequenced on an Illumina NovaSeq 6000 sequencing system (paired-end multiplexing run, 150 bp) by LC-Bio Technology Co., Ltd. (Hangzhou, China) at a minimum depth of 20,000 reads per cell.
General Analyses of scRNA-Sequence Data
Single-cell transcriptome analysis was performed for peripheral blood mononuclear cells (PBMCs) from 20 healthy individuals and 20 PT patients. In brief, data were analyzed using “Seurat” v4.1.1 in R.7,8 Genes that were detected in fewer than 10 cells were removed. Regarding cell quality control, cells meeting the following criteria were filtered: 1) the percentage of mitochondrial genes was greater than 5%; 2) the number of feature genes was less than 500; and 3) the number of read counts was less than 1000 or more than 20,000. A two-dimensional uniform manifold approximation and projection (UMAP) plot was used for the visualization of the gene expression similarity among all cells. Differentially expressed genes between clusters were calculated using the Wilcox test, with the prerequisite that genes were expressed in at least 50% of cells in either of the two groups.
Cell Annotation and T-Cell Subset Analysis
In this study, the computational tool “singleR” was used to annotate cell clusters based on comparing annotated reference data with selected marker genes that best differentiate cell phenotypes.9 In addition, manual annotations based on rich biological background knowledge were also performed. Clusters with the same phenotype were combined into a cluster. Subsequently, T cells were extracted individually for reclustering. The annotation of T-cell subsets relied on classic T-cell markers. Trajectory analysis was conducted by Monocle v2.24.1.10
Cell‒Cell Communication Analysis
To study the strength of intercellular communication between different T-cell subtypes and to determine the expression of vital signals and ligand receptors, we applied the R package “CellChat” (version 1.1.3) to all identified T-cell subtypes.11 We also compared the differences in communication strength, signaling, and ligand receptors between normal individual-derived T cells and PT-derived T cells.
Enzyme-Linked Immunosorbent Assay
The macrophage inhibitory factor (MIF) level in the serum was measured by enzyme-linked immunosorbent assay (ELISA) (Beyotime, No: PM715) following the manufacturer’s instructions.
Statistical Analysis
All statistical analyses were conducted using SPSS v23.0 (IBM Corporation, NY, USA). The quantitative variables normally distributed are shown as the mean ± standard deviation (SD), and the categorical variables are shown as frequency and percentages. Significant differences between the groups were tested by the χ2 test or Fisher’s exact test. P < 0.05 was considered statistically significant. Pearson’s correlation analysis was conducted to estimate the association between immune cell alterations and renal function.
Results
The General Characteristics of ESRD Patients Showed Significant Alteration in Both Cell Composition of Peripheral Blood and Serum Component Compared to That of Healthy Controls
The demographic information, clinical and laboratory examination data, and medication history of 20 ESRD patients and healthy controls are shown in Table 1 and Supplementary Data 1.1. The sex and age of the two groups were matched. The average ages were 56.30±12.43 and 58.67±2.57 years, respectively. Fourteen males were included in each group. The primary causes of kidney damage in the ESRD group were primary kidney disease and diabetic nephropathy. Nineteen out of 20 ESRD patients were complicated with hypertension. ESRD patients showed significant anemia, fewer lymphocytes and monocytes, and hypoproteinemia, which were consistent with previous studies.12 Although the number of platelets and neutrophils in ESRD patients was not significantly different (P = 0.28, P = 0.13), ESRD patients showed an observable reduction. As previously reported, uremic toxins and other molecules generated and accumulated during kidney dysfunction could impair the proliferation and differentiation of hematopoietic stem cells and thus result in a global reduction in blood cells.13 Electrolytes also exhibited significant dysregulation during ESRD, such as an upregulation of potassium and phosphorus and a downregulation of sodium, chlorine, and calcium. Of note, despite a significant reduction in serum albumin, the serum assay showed no significant change in ALT or AST in ESRD patients. As the kidney maintains important endocrine function by producing vitamin D and erythropoietin (EPO), we also collected data on serum EPO levels in our research. Compared with healthy controls, ESRD patients showed a significant reduction in EPO, indicating an impairment of the endocrine function of the kidney during ESRD. According to previous studies, iron metabolism dysregulation is related to the prognosis of ESRD patients. Iron overload and impaired iron utilization have been previously identified in CKD patients. Our data also identified insufficient transferrin and total iron-binding capacity as well as upregulated ferritin in ESRD patients’ serum assays.
ESRD Patients Showed a Global Reduction in Cell Counts of Lymphocyte Subsets in Peripheral Blood, Especially That of T Lymphocytes
The composition and absolute number of T and B lymphocyte subsets are important indices to evaluate immune status. As shown in Table 2, although there was no statistically significant difference in the percentage of total T lymphocytes, helper T (Th) cells, and cytotoxic T cells (Ts) in the ESRD group compared with the healthy control group (P=0.12, P=0.68, P=0.16), the absolute counts of these subsets were significantly decreased in the ESRD group, especially that of T lymphocytes. Compared with the healthy control group (1474.41±64.41/µL), the number of total T lymphocytes in ESRD patients decreased significantly (877.84±68.13/µL). Of note, although the percentage of Th cells and cytotoxic T cells showed no significant change, the Th/Ts ratio decreased in the ESRD group, indicating immune dysfunction in ESRD patients. The B lymphocyte percentage of ESRD patients showed a significant reduction compared with that of healthy controls (P =0.00), which may result in vaccine failure during the COVID-19 pandemic and a high HBV infection rate in the CKD population.9 Meanwhile, the number of NK cells in ESRD patients (211.60±21.82 cells/µL) was significantly lower than that in the healthy control group (453.68±75.30 cells/µL), suggesting decreased antitumor and anti-infection abilities in ESRD patients.
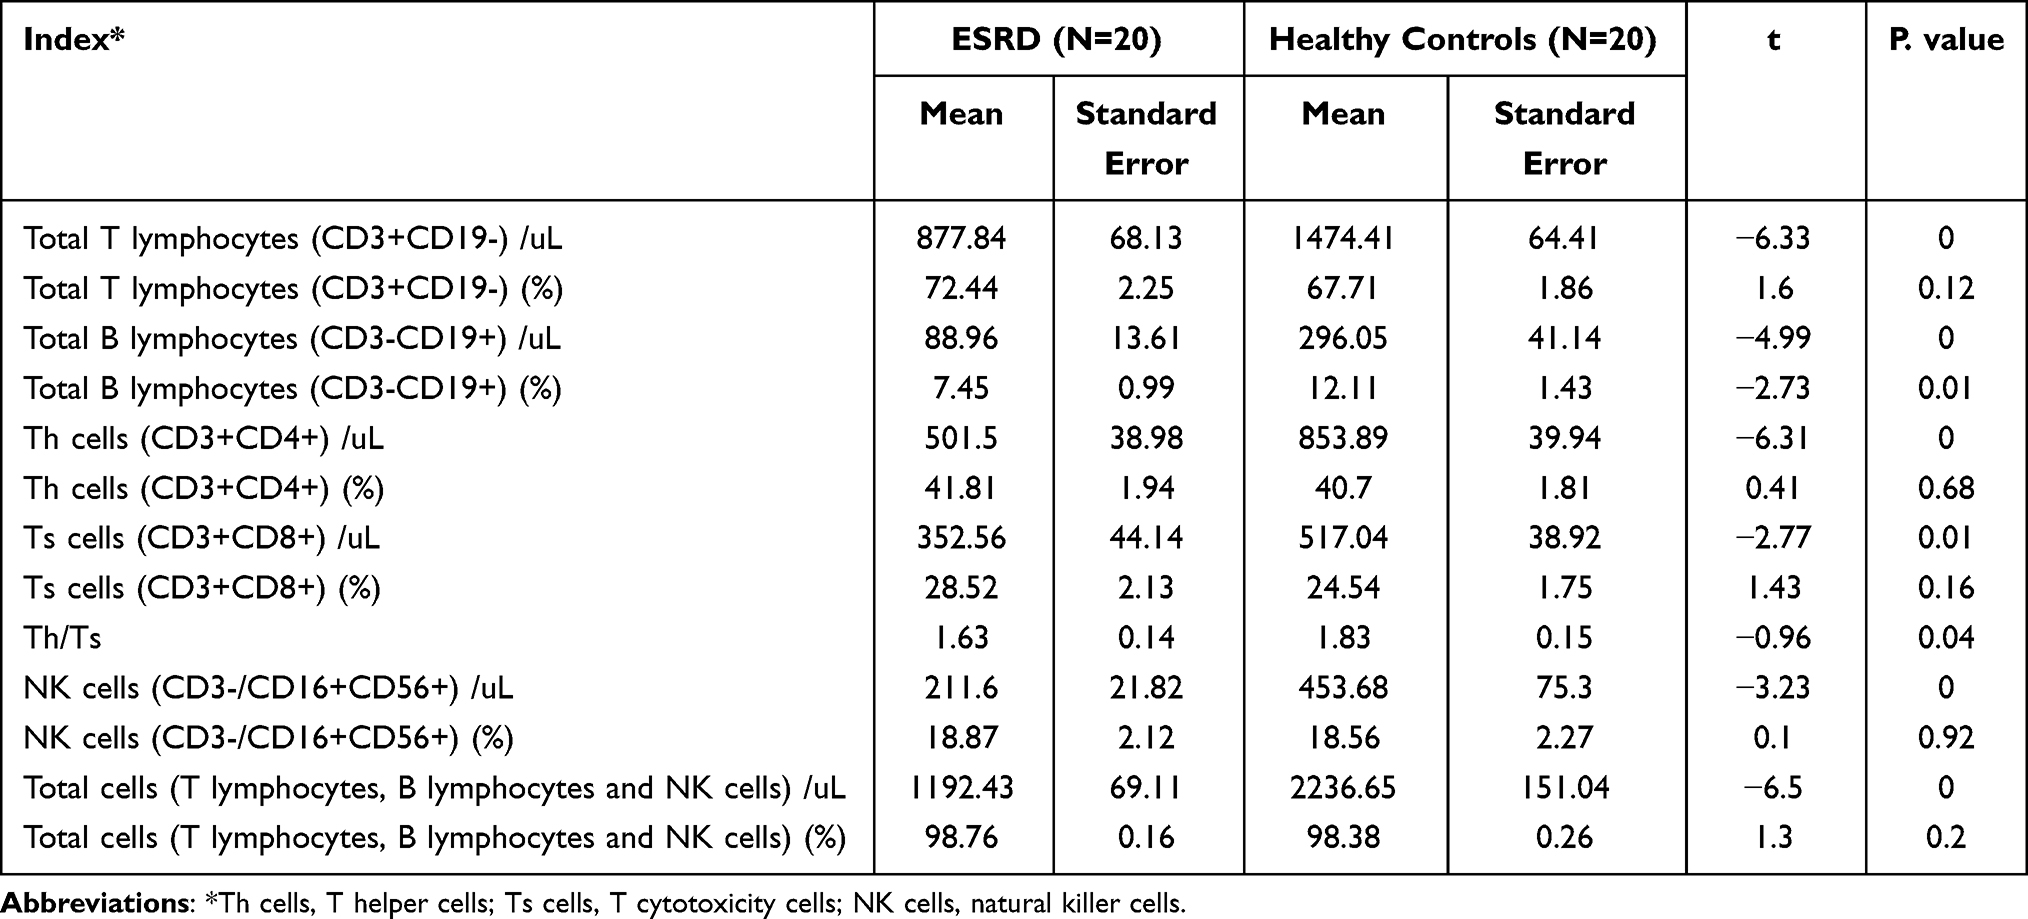 |
Table 2 Lymphocyte Subsets Detection |
The Th17/Treg, Th1/Treg, and B-Cell/Treg Cell Ratios Were Significantly Increased in the ESRD Group, Which May Contribute to the Impairment of Immune Homeostasis During Kidney Dysfunction
Many studies have shown that T-cell-mediated immune imbalance plays an important role in the progression of kidney disease. Our data showed that the absolute T lymphocyte count and Th/Ts cell imbalance were prominent manifestations of peripheral blood immune function imbalance in patients with ESRD. To clarify the distribution and functional status of T-cell subsets in the PBMCs of ESRD patients, the CD4+ T-cell subsets of PBMCs were quantitatively analyzed in the two groups. As shown in Table 3, although there was no significant difference in absolute counts, the percentages of proinflammatory T-cell subsets such as the Th1 subset (20.93±1.74%) and Th17 subset (20.93±1.74%) in ESRD patients were significantly higher than those in the healthy control group. The Th2 subset did not change significantly. Notably, the absolute count (17.30±1.39) and percentage (3.64±0.29%) of the Treg subset, the only subgroup negatively controlling the inflammatory response, were significantly reduced compared with those in the control group (29.48±2.64, 3.86±0.25%). According to our results, the Th17/Treg, Th1/Treg, and B-cell/Treg cell ratios were significantly increased in the ESRD group, suggesting that the inhibitory effect of Treg cells on proinflammatory Th1 and Th17 subgroups and humoral immunity was weakened in ESRD patients.
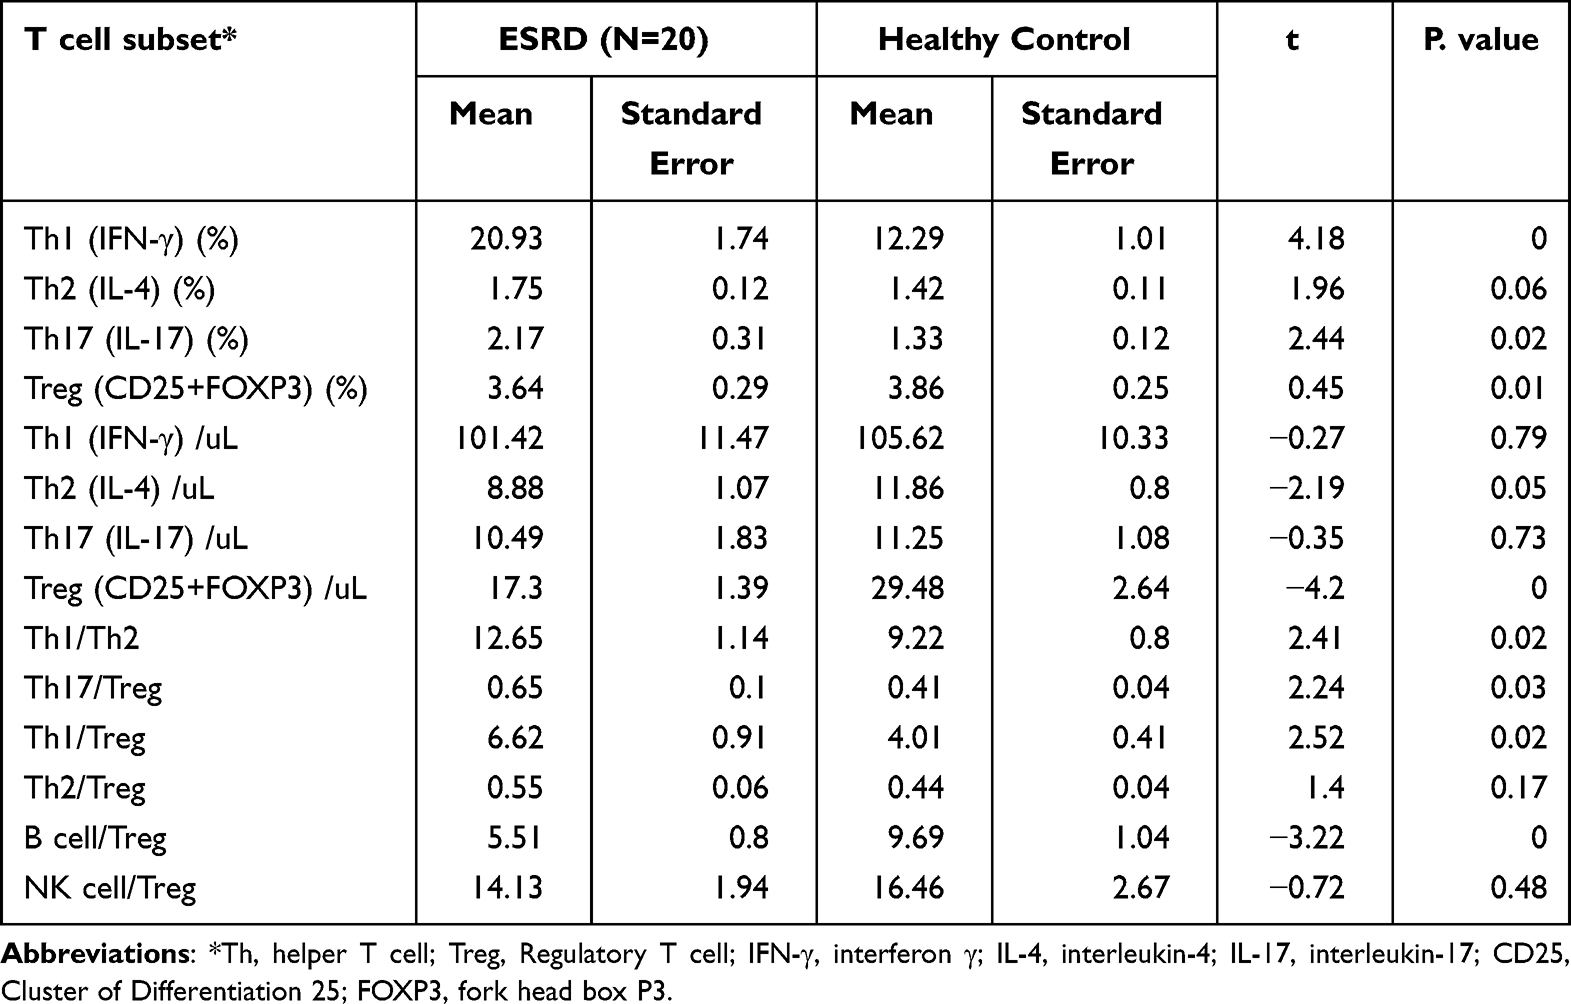 |
Table 3 CD4+T Cell Subsets Detection |
An Imbalance of Immune Cell Subsets in PBMCs Was Closely Associated with Deterioration in Renal Function and Complication Development
To investigate the relationship between renal function deterioration and the alteration of immune cell subset composition and function in PBMCs, especially the Th17/Treg and Th1/Treg ratios, we analyzed the correlation between immune function and immune cell subpopulation and glomerular filtration rate, parathyroid hormone levels and ferritin. Of note, secondary hyperparathyroidism and infection were two of the main complications of ESRD, leading to adverse prognosis. Previous studies identified that PTH and ferritin could partially represent the severity of these two complications. The results in Table 4 indicated that 1) the absolute count of Th2 cells was negatively correlated with eGFR (r = −0.458, p =0.05), while the counts of other immune cells and eGFR were not statistically related; 2) the Th17/Treg ratio was positively correlated with glomerular filtration rate (r = 0.492, p =0.03; r = 0.672, p =0.01); 3) the level of PTH was positively correlated with the absolute count and percentage of Th cells (r = 0.669, p =0.00; r = 0.557, p =0.01); 4) the PTH level was negatively correlated with the absolute count of Treg cells (r = −0.467, p =0.04); 5) ferritin was positively correlated with the total B lymphocyte count (r = 0.582, p =0.03) and the Treg cell count (r = 0.582, p =0.03); and 6) ferritin was positively correlated with the percentage and absolute count of Th1 and Th2 cells.
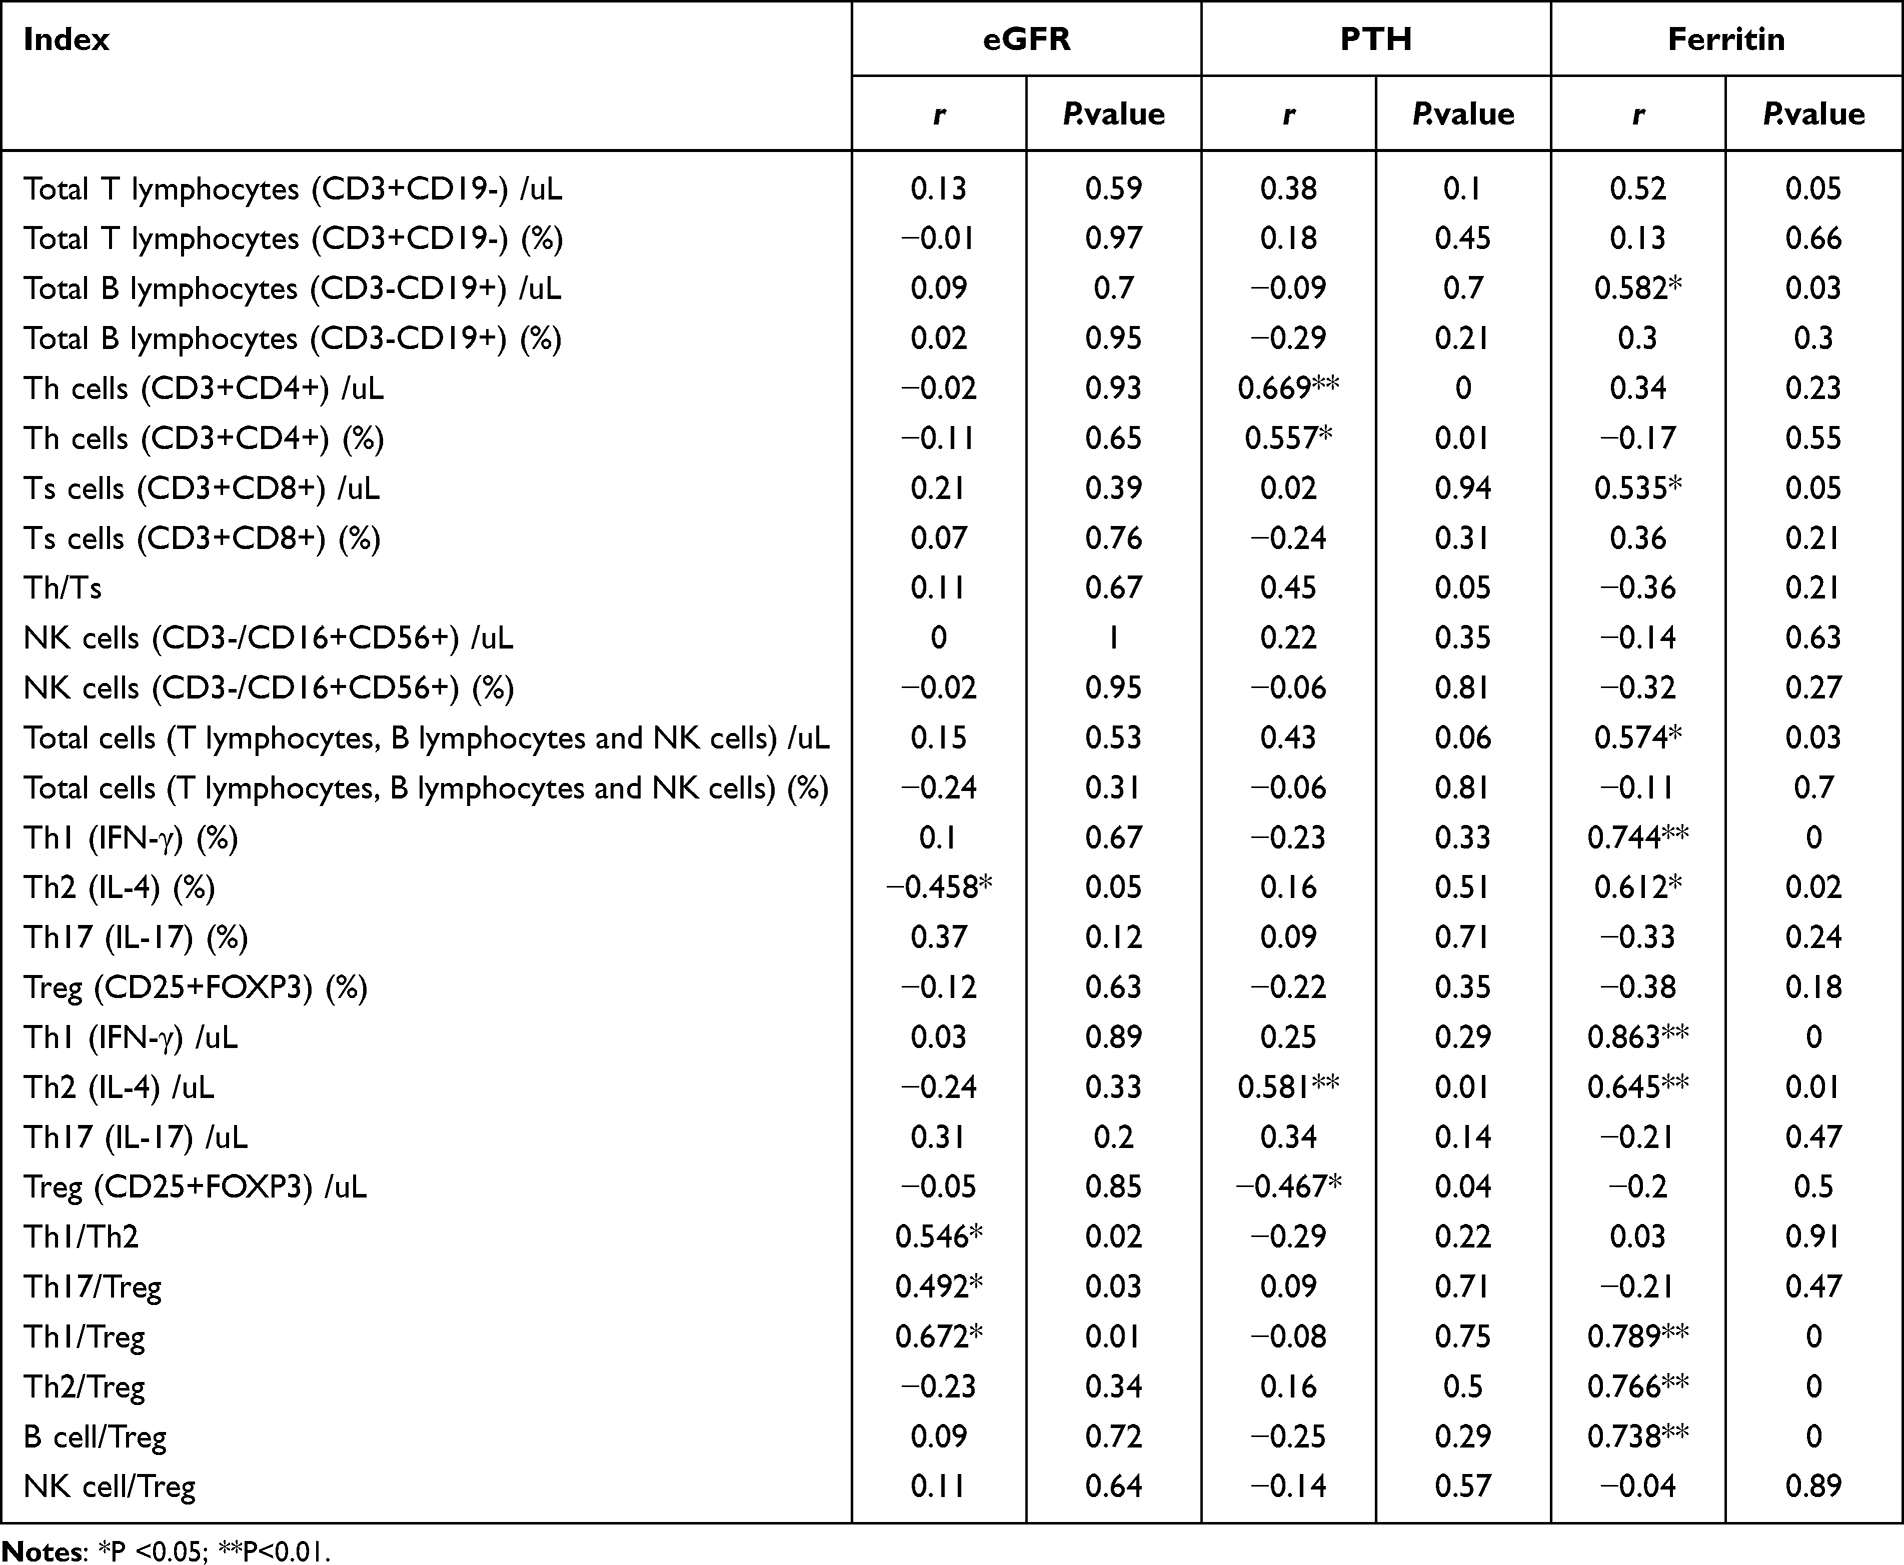 |
Table 4 Correlation Analysis of Immune Cell Imbalance and Kidney Dysfunction |
Among Nine T Cell Subsets Identified by scRNA Analysis, the Proinflammatory T-Cell Subset, Th17 Cells, Were Significantly Increased in the ESRD Group, While Naïve CD4+ and CD8+ T Cells Were Decreased During Kidney Dysfunction
A schematic overview of the single-cell RNA sequencing analysis is shown in Figure 1A. Briefly, PBMCs were extracted from the remaining samples of 20 ESRD patients and 20 healthy controls enrolled in our study. Equal cell counts of each sample were pooled for further analysis in both groups. The two groups of samples obtained 9560 and 10,991 qualified cells, respectively, for analysis. After screening out unqualified cells and genes, a total of 20,551 cells were obtained from the two groups, among which 31,723 genes were obtained from the ESRD patient group (PT) and 31,755 genes were obtained from the healthy control group (NC). By using an unsupervised cluster algorithm (Supplement Figure 1) and marker genes of each group (Supplementary Data 1.2), cells were re-annotated as T cells, monocytes, B cells, NK cells, and multipotent myeloid progenitor cells (CMPs) by “SingleR”, as shown in Figure 1B and C. Successful validation of these clusters was validated by marker genes (Figure 1D). The most abundant cell type in both groups was T cells, while CMP cells had the least number of cells (Supplementary Table 1). As shown in Figure 1E, the percentages of B cells and T cells were significantly lower in ESRD patients than in healthy controls, while the percentages of monocytes and NK cells were increased in ESRD patients, indicating the impairment of both innate and adaptive immunity during kidney dysfunction.
 |
Figure 1 (A) The schematic overview of the sc-RNA sequence of this case-control study. (B and C) Clustering all cells filtrated from our sc-RNA sequence date. Uniform Manifold Approximation and Projection (UMAP) of the aligned gene expression from the ESRD patient group (PT) and normal control (NC), showing the distribution of five major clusters: T cells, monocytes, NK cells, B cells and Common myeloid progenitor cells (CMP) cells. (D) Dot plot of expression and percentage of marker genes of five clusters. (E) The proportion of five clusters in NC and PT. |
Since we identified alterations in the composition and functions of T-cell subsets by flow cytometry, we extracted T cells separately and re-clustered them automatically by “SingleR” into 12 clusters (Figure 2A and B). Subsequently, we identified nine canonical T-cell subsets according to previously reported marker genes (Figure 2E, Supplementary Data 1.3 and Supplementary Table 2), including Th1, Th2, Th17, TFH, Treg, naïve CD4+ T, naïve CD8+ T, effector CD8+ T, and memory CD8+ T cells, as shown in Figure 2C and D. The percentage of each cluster shown in Figure 2D indicated that the proinflammatory T-cell subset, Th17 cells, were significantly increased in the ESRD group, while naïve CD4+ and CD8+ T cells were decreased during kidney dysfunction, indicating the inflammatory microenvironment and the premature aging of the immune system in ESRD.
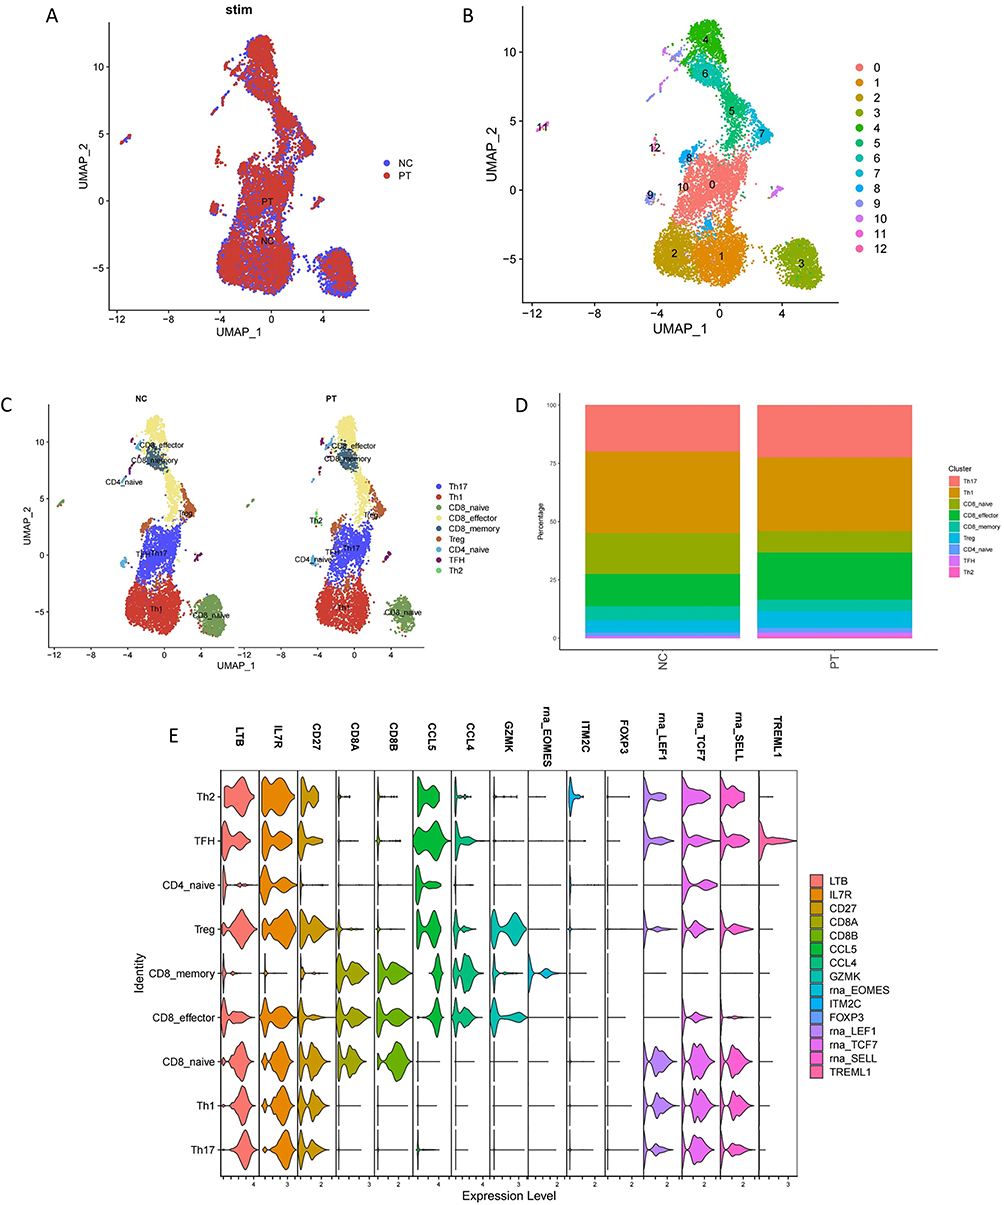 |
Figure 2 (A and B) UMAP of 12 T cell clusters by automatically annotation. (C) Split UMAP of nine canonical T cell subsets based on the expression and proportion of previously reported marker genes. (D) The percentage of nine re-clustered T cell subsets in NC and PT. (E) Violin plot of major marker genes in nine clusters. |
TFH, Th1, and Th2 Cells Were Identified in the End Stage of the Developmental Trajectory, While Treg and Memory CD8+ T Cells Were Identified in the Initiation Stage According to Pseudotime Cell Developmental Trajectory Analysis
T-cell plasticity refers to the capacity of differentiated T cells to polarize to other phenotypes in response to a changed microenvironment or context and obtain characteristics of other subsets.10,14 As T-cell plasticity has been identified by many researchers and has been shown to be closely linked with CKD progression,14 we applied Monocle2 to analyze the pseudotime cell developmental trajectories of nine T cell clusters, as shown in Figure 3A. We identified three developmental states of T cells (Figure 3B) and found that TFH, Th1, and Th2 cells were in the end stage of the development trajectory, while Treg and memory CD8+ T cells were in the initiation stage (Figure 3C). Notably, Th17 cells were found in the middle stage between Treg and Th1 cells, indicating their role in mediating the plasticity of anti-inflammatory to proinflammatory phenotype switching. Then, we compared the developmental trajectory alterations in the ESRD and healthy control groups, as shown in Figure 3D. During the ESRD stage, the development and differentiation of Th17, Th1, and Tfh cells were shown in a relatively earlier stage than that in healthy controls, supporting our hypothesis that T-cell plasticity contributes to CKD progression and Th17 cells may be an important mediator during this process.
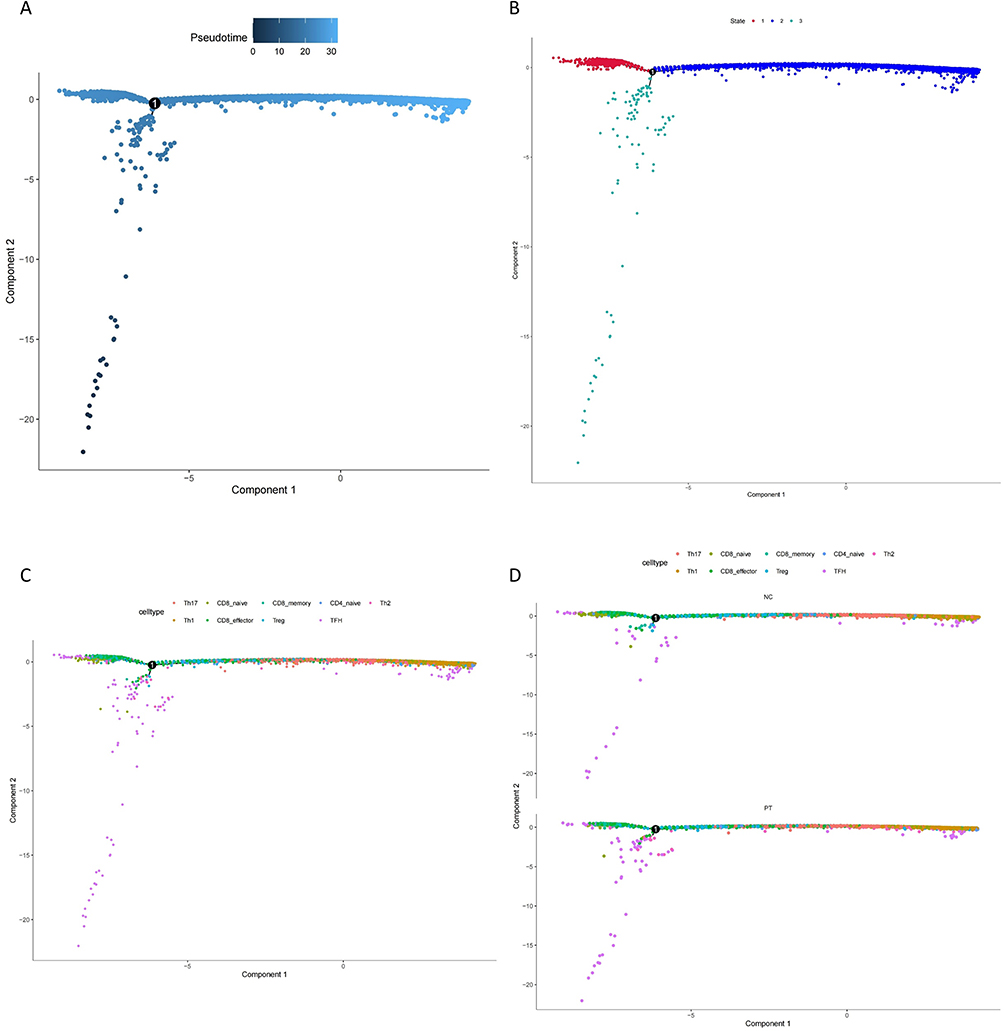 |
Figure 3 (A) The pseudo time cell developmental trajectories of nine T cell clusters. (B) Three development states of T cells. (C) Development state of nine T cell subsets. (D) Development trajectory alteration in PT and NC. Note: Number “1” in the center of each plot stand for the initial stage. |
Intercellular Communication Analysis Among T-Cell Subsets Identified Two Main Incoming and Outgoing Signal Pathways: the CD40 and MIF Signaling Pathways
The intercellular communication of T-cell subsets could facilitate T-cell priming and differentiation, mediating immune tolerance and the effector immune response.11 To construct a panorama of intercellular communication of T-cell subsets in PBMCs, we applied “Cell Chat” to analyze the extracted sc-RNA sequence data of T cells. The overall communication number and weight among nine T-cell clusters are qualified and visualized in Figure 4A and B. We found that Th17 and Treg cells showed the strongest interaction with other clusters. Th1, Th2, and naïve CD4+ T cells showed relatively weak communication. Subsequently, we extracted the communication number of each cluster and found that Th17 cells showed a strong interaction with Treg and CD8+ T cells, while Treg cells interacted with Th17, memory, and effector CD8+ T cells (Figure 4C). To clarify the communication pattern among each cluster and investigate the role of each cell type and signaling pathway, we explored and calculated the possible value of each ligand‒receptor interaction by identifying differentially overexpressed ligands and receptors in each cluster. By assuming that all cells act as secreting cells, outgoing communication patterns were studied. We identified two major patterns incorporating macrophage inhibitory factor (MIF) and CD40 signaling pathways (Figure 4D). Th17 cells were concentrated in Pattern 1, characterized by the CD40 signaling pathway, while naïve CD8+ T cells, effector CD8+ T cells, and Treg cells were concentrated in Pattern 2, characterized by the MIF signaling pathway. When considered as receivers/target cells, Th17 cells, naïve CD8+ T cells, effector CD8+ T cells, and Treg cells were concentrated in Pattern 1, while TFH cells were related to Pattern 2. In brief, we identified MIF and CD40 as two major intercellular communication patterns involved in T-cell communication.
 |
Figure 4 (A) Global intercellular communication among nine T cell subsets based on number of interactions. The line width represents the intensity. (B) Global intercellular communication among nine T cell subsets based on the strength of interaction. (C) The communication intensity from each T cell subsets to other subsets. (D) Two major incoming and outgoing communication patterns identified involved in T cell communication. |
The MIF Signaling Pathway Facilitated Intercellular Communication Between Th17-Treg Interactions in PBMCs
To investigate the specific role in different clusters of MIF and CD40 signaling pathways, we analyzed the detailed information of each pathway. The MIF pathway contained two types of ligand‒receptor pairs: MIF-(CD74+CXCR4) and MIF-(CD74+CD44). According to the calculation based on gene expression, MIF-(CD74+CXCR4) showed a higher contribution to intercellular communication (Figure 5A). The heatmap indicated that Th17 cells and Treg cells were two major senders in the MIF signaling pathway network and that effector CD8+ T cells and Treg cells were important receivers. Of note, Treg cells showed strong activity acting as senders, receivers, mediators, and influencers in the network, indicating a vital role of the MIF pathway in the maintenance of immune tolerance and anti-inflammation. Since Th17 cells are the most important transmitters in the MIF network, we further analyzed the communication strength of the MIF signaling pathway among different T-cell subsets. As shown in Figure 5C, we found that the MIF signaling pathway had strong activity mediating Th17-effector CD8+ T cells and Th17-Treg interactions. In addition, when Treg cells acted as a communication source, the MIF signaling pathway was involved in communication with effector CD8+ T cells and other Treg cells. The hierarchy plot in Figure 5D reveals the interaction strength of two L-R pairs of MIF signaling pathways. Of note, the Th17-Treg interaction through both L-R pairs showed the strongest activity. Briefly, our results showed that the MIF signaling pathway showed the most energetic activity in intercellular communication among T-cell subsets in PBMCs, especially in Th17-Treg interactions.
 |
Figure 5 (A) Two types of ligand-receptor pairs associated MIF signaling pathway contribution to intercellular communication based on gene expression. (B and C) The heatmap of MIF signal network based on the contributions to the cell-cell communication among T cell subsets. (D) The hierarchy of two types of MIF signaling network visualized the interaction strength among T cell subsets. |
Since we identified two patterns involved in cell‒cell communication, including MIF and CD40 signaling pathways, we also applied the same detailed analysis to unravel the potential function of CD40 signaling pathways. As shown in Supplementary Figure 2, the only L-R pair of this pathway was CD40LG-(ITAG2B+ITAGB3), which facilitated only the interaction between Th17 and TFH cells.
The MIF Signaling Pathway Was the Major Pathway That Facilitated Intercellular Communication Between Th17 and Treg Cells in the T-Cell Subset of PBMCs
The panorama of intercellular communication was investigated in our aforementioned analysis. We further clarified the differences in intercellular communication patterns between ESRD patients and healthy controls to explore the potential mechanism between T-cell subset interactions and CKD progression. As shown in Figure 6A, we found that although the number of inferred interactions increased in ESRD patients (PT), the strength of the interaction showed a decreasing trend. Then, we compared the information flow between the ESRD group and healthy controls (Figure 6B and C). In ESRD patient PBMCs, the information flow of interleukin 16 (IL16) and CD40 signaling was significantly stronger than that in healthy controls, and the relative information flow of interleukin 16, CD40, adhesion G protein-coupled receptor E5 (ADGRE5), C-type lectin domain (CLEC), MIF, CD99 and major histocompatibility complex-II (MHC-II) was elevated in ESRD patients, while that of intercellular adhesion molecule (ICAM), MHC-I and lymphocyte protein tyrosine kinase (LCK) was weakened. Among all these upregulated signaling pathways, the MIF signaling pathway showed significant upregulation in ESRD patients (Figure 6D). Combined with our aforementioned development trajectory analysis, the MIF signaling pathway between Th17 and Treg intercellular communication may mediate the plasticity of the two clusters and contribute to disease progression.
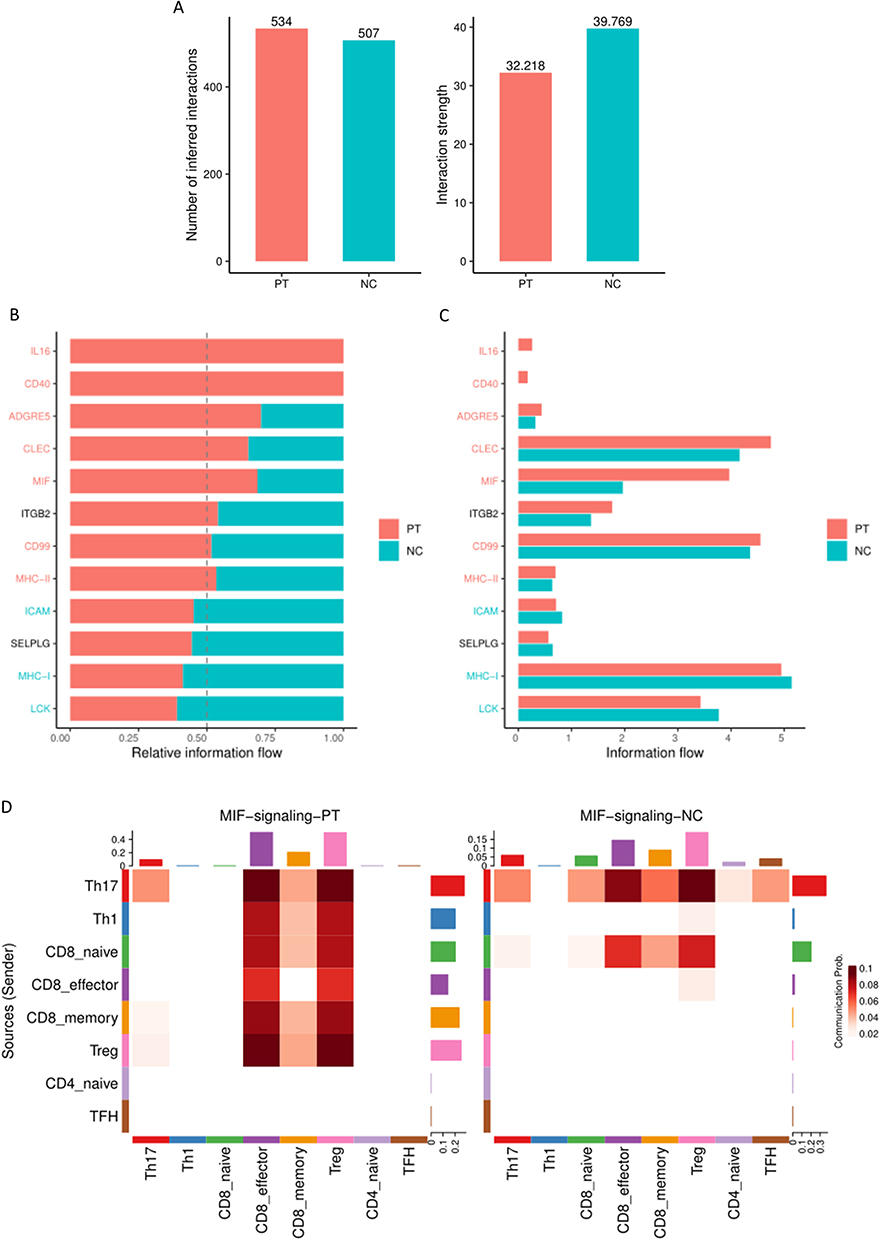 |
Figure 6 (A) The number and strength of inferred interactions increased in patients with ESRD (PT) and healthy control (NC). (B and C) Relative information flow of the significant signaling pathway in patients with ESRD (PT) and healthy control (NC). (D) Sources and targets of MIF signaling pathway. |
Serum Levels of MIF Was Significantly Upregulated in ERSD Group, and Closely Associated with Th17/Treg Imbalance in PBMCs of ESRD Group
Since the MIF signaling pathway has been identified as the main intercellular communication pathway between Th17 and Treg cells, which was one of the most significantly upregulated information flows in patients with ESRD, we further clarified the differences in serum MIF concentration and verified the relationship of MIF and immune cell composition, especially of MIF and the Th7/Treg ratio, in patients with ESRD and healthy controls. Using ELISA, we identified that serum MIF was significantly upregulated (P<0.001) in ESRD patients (1.24±0.25 ng/ml) compared to healthy controls (0.61±0.16 ng/ml) (Figure 7). Further correlation analysis in Table 5 clarified that the absolute counts of Th17 cells and the Th17/Treg ratio were positively correlated with serum level of MIF (r = 0.325, p =0.02; r = 0.503, p =0.01), while the percentage of Treg cells was negatively correlated with it (r = −0.231, p =0.015), indicating that MIF may promote the trans-differentiation of Treg cells to Th17 cells.
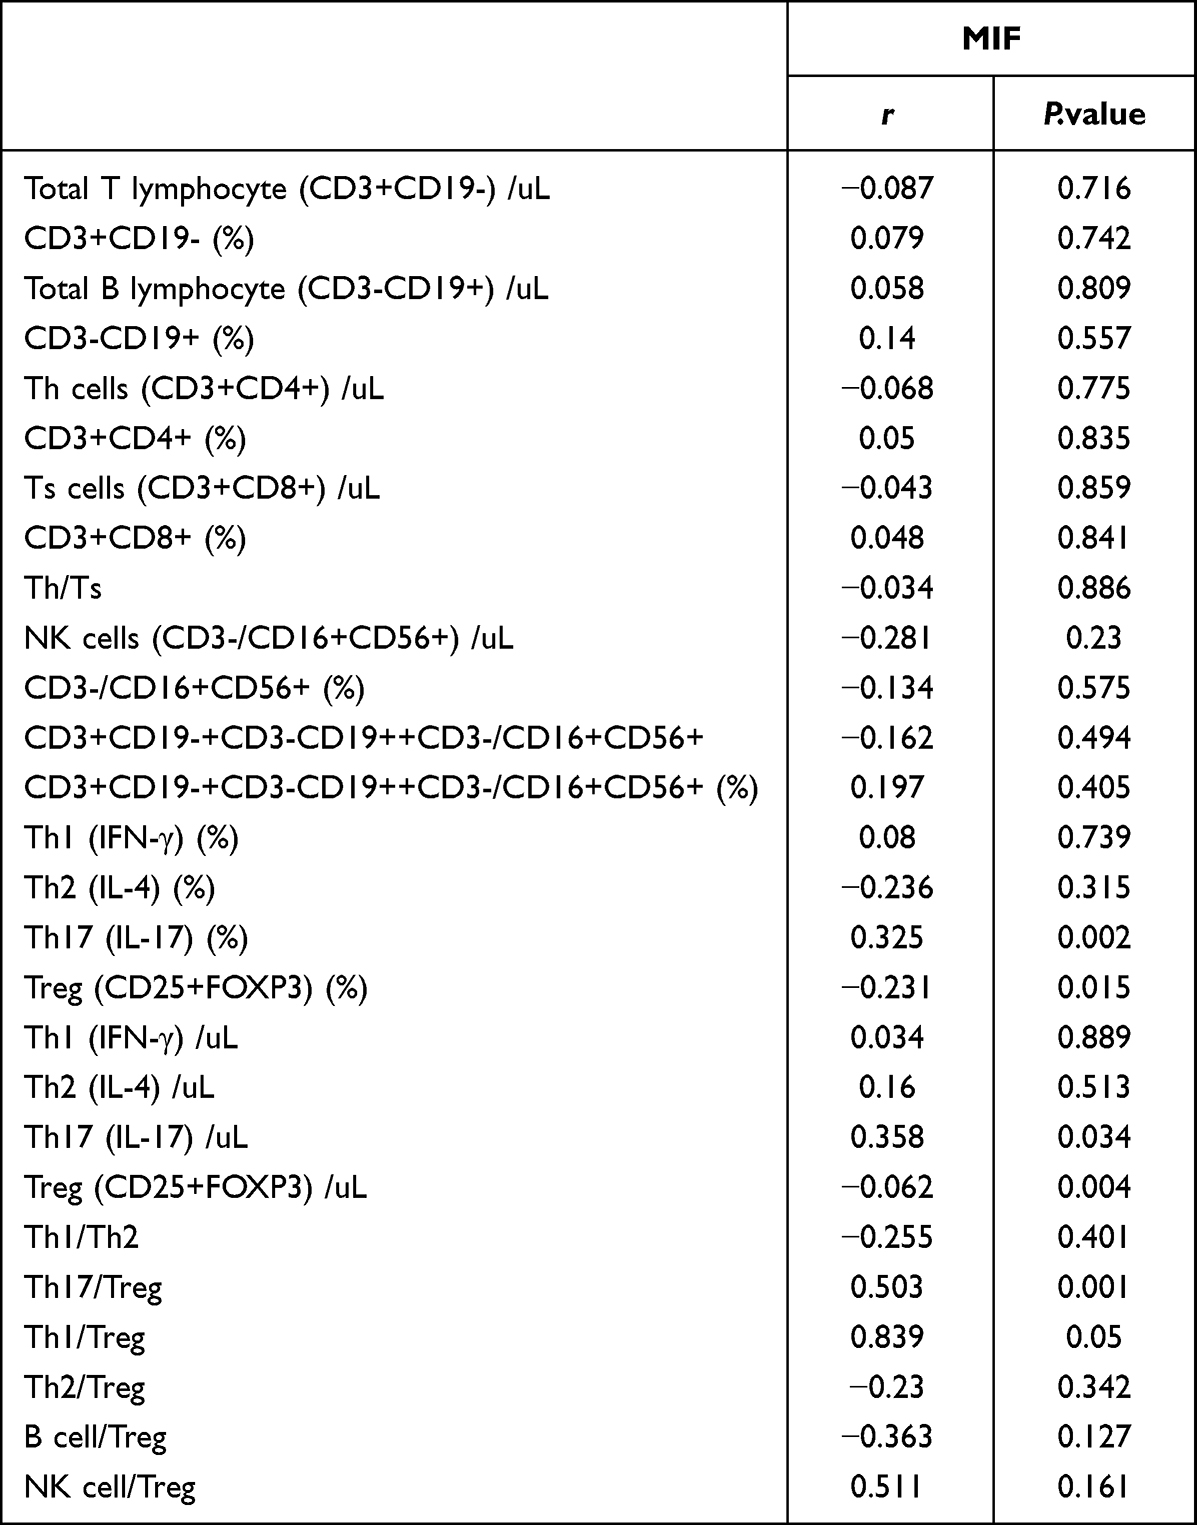 |
Table 5 Correlation Analysis of Serum Level of MIF and Immune Cell Imbalance |
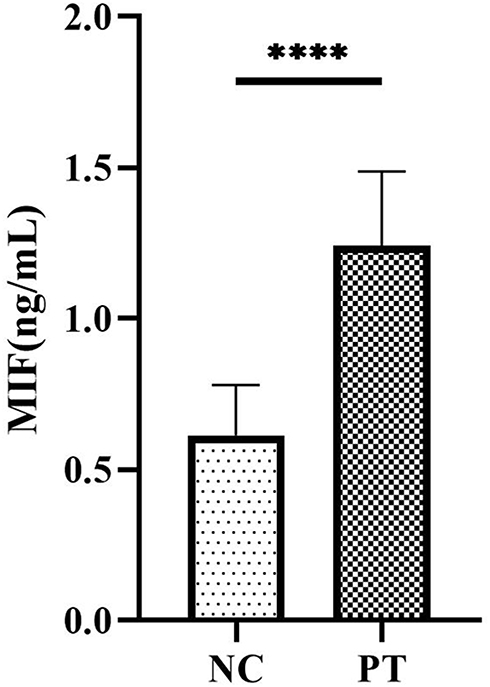 |
Figure 7 Serum level of MIF in NC and PT. (****P < 0.05). |
T Cells Showed Significant Expansion in Kidney Dysfunction and Th17/Treg Ratio Showed Significantly Increased in UUO7 and Decreased in rUUO Group
After screening out unqualified cells and genes, a total of 15,016 cells and 28,692 genes were obtained from the four samples. There were 3491 cells in the rUUO group, 4606 cells in the control group, 2479 cells in the UUO2 group, and 4440 cells in the UUO7 group. Using an unsupervised cluster algorithm and marker genes of each group, Use “SingleR” to annotate the cells as proximal tubule cells, macrophages, Henle loops/distal tubules, T cells, monocytes, endothelial cells, epithelial cells, collecting tubules, fibroblasts, and B cells (Figure 8A and B). After further analysis of the components of cell groups in each group, it was found (Figure 8C) that among all parenchymal cell groups, proximal tubule cells showed a significant alteration, followed by Henle loop/distal tubule cells. Among all immune cells, macrophages showed the most obvious changes followed by T cells. Since macrophages have been analyzed and studied in detail in the original article, we focused on the heterogeneity of T cell subsets in different stages of UUO and reversible UUO models. As shown in Figure 9A, we identified seven T cell subsets, Treg, CD4 memory, CD8 effector, Tfh, Th1, Th17, and CD8 naive T cells, based on the marker genes for each subpopulation. Further analysis showed in Figure 9A and B, the number of T cell subsets in UUO2 and UUO7 groups was significantly increased, which may be related to the proliferation and differentiation of T cells induced by the increase of inflammatory factors in renal dysfunction. Furthermore, the percentage of T cell subsets indicated that compared with the sham and rUUO group, the number of both Th17 and Treg cells in UUO7 group was significantly increased compared with sham and rUUO group indicating the ratio of Th17/Treg may be more meaningful in CKD progression.
 |
Figure 8 (A) Clustering all cells filtrated from GSE140023. UMAP of the aligned gene expression from the four groups. (B) The expression level and expression percentage of marker genes are illustrated on the dot plot. (C) The proportion of cell clusters in four groups. |
 |
Figure 9 (A) Split UMAP of seven canonical T cell subsets based on the expression and proportion of previously reported marker genes. (B) The percentage of seven re-clustered T cell subsets in four groups. (C) The pseudo time cell developmental trajectories of seven T cell clusters. (D) Development trajectory alteration in four groups. Note: Number “1” in the center of each plot stand for the initial stage. |
Inhibition the Transdifferentiating of Treg into Th17 Was an Important Mechanism for Promoting Renal Repair
We applied Monocle2 to analyze the pseudotime cell developmental trajectories of seven T cell clusters similar to what we did in Figure 3. As shown in Figure 9C, we identified three developmental states of T cells (Figure 9C) and found that Th1, Treg, and Th17 were in the end stage of the development trajectory, while naïve CD4+ and CD8+ T cells were in the initiation stage. Notably, Th17 cells were in the end stage following Treg, indicating the plasticity of anti-inflammatory to proinflammatory phenotype switching. It is worth noting that the timelines of each cell subpopulation showed a relatively consistent trajectory of Treg and Th17, suggesting that the mutual transdifferentiation of Treg and Th17 plays an important role in different stages of UUO. Consistent with the result in pseudotime cell developmental trajectory analysis of human PBMCs, which was showed in Figure 9D, in the rUUO group, T cell subsets showed an obvious tendency to differentiate to Treg, while in the UUO7 group, T cell subsets showed an obvious tendency to differentiate to Th17 and Th1. It is suggested that inhibiting the transdifferentiation of Treg into Th17 is an important mechanism to reverse the progression of renal dysfunction and promote renal repair.
MIF-Mediated Signaling Pathway is the Primary Mode of Communication Between Treg and Th17 Cells, Which Was Significantly Enhanced in UUO Model but Significantly Weakened in rUUO Group
Consistent with the results of single-cell sequencing of human PBMCs, MIF is the main communication mode between Th17 and Treg in mouse UUO and rUUO models (Figure 10A). We found that MIF, as a ligand, combined with CD74 +CD44, mediated the signaling pathway of MIF communication in mouse UUO and rUUO models. By analyzing the signal strength among subpopulations in the MIF communication network (Figure 10B), it was found that Treg cells and Th17 could be used as signal transmitters and receivers respectively through the MIF-CD74 +CD44 signaling pathway to conduct intercellular communication, thus affecting their functional status and differentiation, which was consistent with our previous analysis results in PBMCs. In order to further clarify the effect of MIF-mediated intercellular communication on reversing renal fibrosis, we further compared the intercellular communication of T cell subsets in the mouse UUO model and the reversible UUO model at 7 days after modeling (Figure 10C), and found that MIF, C-X-C motif chemokine ligand (CXCL), intracellular adhesion molecule (ICAM), and collagen signaling pathways were significantly enhanced in the UUO group, especially the MIF signaling pathway was significantly increased while interleukin 16 (IL-16), programmed cell death ligand 2 (PDL2), differentiation cluster 226 (CD226), PVR cell adhesion molecule, cadherin 1 (CDH1), cadherin (CDH), and proto-oncogene LCK were significantly elevated in rUUO. Further analysis in Figure 10C showed that in the rUUO group, the MIF pathway was too weak to make corresponding diagrams, while in the UUO7 group the MIF signaling pathway had the strongest effect, suggesting that the MIF signaling pathway can induce Th17/Treg imbalance by mediating Th17/Treg intercellular communication and thus effectively reverse kidney injury.
 |
Figure 10 (A) Global intercellular communication intensity from each T cell subsets to other subsets. (B) The major ligand-receptor pair pattern associated MIF signaling pathway contribution to intercellular communication based on gene expression. (C) The heatmap of MIF signal network based on the contributions to the cell-cell communication among T cell subsets. (D) Relative information flow of the significant signaling pathway in UUO7 and rUUO group. |
Discussion
Recently, increasing evidence has indicated that immune dysfunction is one of the key factors related to CKD initiation and progression, which has been termed secondary immunodeficiency related to kidney disease (SIDKD).15 Immune dysregulation/dysfunction occurs at the early stage of CKD and plays a vital role in the occurrence of complications, such as infections and adverse cardiovascular events. Monitoring immune function regularly is of great significance in evaluating the prognosis of CKD patients and the prevention of complications, which could reduce CKD prevalence and mortality. In our study, we evaluated routine laboratory test results, immune function, and T-cell subset functions in the PBMCs of ESRD patients and healthy controls and conducted single-cell RNA sequencing of PBMCs, aiming to construct a whole picture of the immune system in ESRD. Of note, due to the diversity of the CKD etiology, pathophysiology, and therapeutic regimens in these patients who were not receiving renal replacement therapy, our study recruited patients only receiving long-term hemodialysis with at least a 6-month washout period of immune suppression agents and glucocorticoids.
Innate immunity acts as the first line of defense against foreign pathogens. Innate immune cells, which include monocytes/macrophages, neutrophils, dendritic cells, and NK cells, can sense pathogen-associated molecular patterns from stressed or injured tissues through pattern recognition receptors (PRRs), such as Toll-like receptors (TLRs). By being activated by these PRRs, innate immune cells can recognize pathogen-associated molecular patterns (PAMPs) or damage-associated molecular patterns (DAMPs) and recruit other immune cells to facilitate the immune response, which is of important significance in tissue injury and repair.16 Several studies have shown that endogenous cytokines and chemokines released by injured cells in the kidney could promote oxidative stress and the activation of DAMPs, thus leading to CKD progression.5 Our data also confirmed the decreased number of monocytes, neutrophils, and NK cells in PBMCs from patients with ESRD, indicating the existence of innate immune dysfunction during ESRD. Thus, we and other researchers revealed the impairment of innate immune cell properties, leading to insufficient host defense and decreased capacity to interact with adaptive immune cells.
During the COVID-19 pandemic, a large proportion of vaccine failures occurred in the ESRD population, indicating the dysfunction of adaptive immunity among these patients.17,18 In this study, we also clarified the decreased number and percentage of B cells, which was positively related to the serum ferritin level. Ferritin has been identified as a biomarker of iron overload, inflammation, and malignancy and is thus associated with uremic cardiomyopathy and elevated all-cause mortality.19,20 Other researchers demonstrated that decreased Bcl-2 expression and resistance to B-cell-activating factors in patients on HD contributed to the apoptosis of B cells and the inhibition of B-cell proliferation, leading to the global suppression of humoral immunity.21 Another important finding in our study was the imbalance of B cells/Treg cells in patients with ESRD, indicating that humoral immunity was also dysregulated due to the dysfunction of immune suppression maintained by Treg cells. As another important compartment, T cells also show great changes in both function and composition during kidney dysfunction. The altered antigen presentation of dendritic cells and monocytes/macrophages has been identified to suppress T-cell activation and redirect T-cell differentiation in many studies,22,23 and uremic toxins, shifts in the cytokine/chemokine context and persistent inflammation due to kidney disease could also facilitate and participate in this process.15 T cells, especially Th cells, exhibit significant plasticity, which refers to the capacity to polarize in different directions. Under physiological conditions, naïve CD4+ T cells can differentiate/polarize into several eventually differentiated T helper (Th) subsets under different microenvironments, including Th1, Th2, Th3, Th5, Th9, TFH, TFH-13, Th17, Treg, Th22 and other T-cell subsets, and exert their roles in the immune response.24 However, under some pathophysiological circumstances, these differentiated T-cell subsets can transdifferentiate into other subsets and acquire other phenotypes.24 Among all the T-cell subsets, Th17 and Treg cells have been widely reported to be the most plastic clusters.25,26 A large amount of evidence suggests that an imbalance in the Th17/Treg ratio plays an important role in kidney disease.27,28 Our results indicated that great alterations in both T-cell subset composition and function occurred in CKD progression, especially in the ESRD stage, especially in the upregulated Th17/Treg and Th1/Treg ratios. Our scRNA-sequencing data obtained through trajectory analysis further identified the early occurrence of the trans-differentiation of Treg cells into Th1 and Th17 cells in both PBMCs from patients with ESRD and UUO mouse model. Subsequently, we identified the MIF-(CD74+CXCR4) signaling pathway as the predominant pathway that could facilitate intercellular communication between Th17 and Treg cells. Moreover, the upregulation of serum MIF positively associated with the Th17/Treg ratio also indicated the participation of MIF in accelerating kidney dysfunction progression. Other researchers have revealed that in acute kidney injury, crescent glomerulonephritis, and other kidney diseases, MIF acts as a biomarker of oxidative species and promotes sterile inflammation.29,30
One major limitation of the current study is that a sample size of 20 patients receiving standard hemodialysis (HD) were included in our research, although we applied strict criterions aiming to the possible factor such as different hemodialysis access, immune suppression therapy, non-kidney primary disease, and etc., the sample size was still needed to expanded. Furthermore, carefully designed in vitro and in vivo experimental models are needed to verify the MIF-(CD74+CXCR4) signaling pathway in the trans-differentiation of Treg cells to Th17 cells. Another limitation is that due to the biological incompatibility of the dialysis membrane and anticoagulant administration, patients on HD do not present a complete immune landscape in CKD stage 5. Patients with ESRD on peritoneal dialysis and pre-dialysis patients should also be recruited to help us to achieve a full understanding of immune dysfunction in CKD progression.
Nevertheless, our findings provide novel insights into the complete picture of immune dysfunction and the role of MIF-mediated intercellular communication among T-cell subsets in the pathogenesis of ESRD, novel pathways underlying immune impairment and new targets for future therapeutic interventions for CKD, ESRD, and their related diseases.
Conclusion
A global immune imbalance was closely associated with the deterioration in renal function and complication development. The MIF signaling pathway mediates Th17/Treg communication and promotes the trans-differentiation of Treg cells to Th17 cells in CKD progression, providing a potential therapeutic target for preventing CKD progression.
Data Sharing Statement
Single-cell RNA sequencing data are accessible in Gene Expression Omnibus under the accession number GSE233315. Other data and analytical methods are available from the corresponding authors on reasonable request.
Consent for publication
All authors approved the final manuscript and the submission to this journal.
Ethics Approval and Consent to Participate
This study involving human samples was reviewed and approved by the Second Hospital of Shanxi Medical University (No. 2023098).
Funding
This work was supported by Basic Research Program of Shanxi Province (No. 202103021223438), Scientific Research Program of Health Commission of Shanxi Province (No. 2021066) and Science and Technology Support Project for Overseas Scholars in Shanxi Province (No.2022045).
Disclosure
The authors declare that the research was conducted in the absence of any commercial or financial relationships that could be construed as a potential conflict of interest.
References
1. Kovesdy CP. Epidemiology of chronic kidney disease: an update 2022. Kidney Int. 2022;12(1):7–11. doi:10.1016/j.kisu.2021.11.003.
2. Lameire NH, Levin A, Kellum JA, et al. Harmonizing acute and chronic kidney disease definition and classification: report of a kidney disease: improving Global Outcomes (KDIGO) consensus conference. Kidney Int. 2021;100(3):516–526. doi:10.1016/j.kint.2021.06.028
3. Cobo G, Lindholm B, Stenvinkel P. Chronic inflammation in end-stage renal disease and dialysis. Nephrol Dial Transplant. 2018;33(suppl_3):iii35–iii40. doi:10.1093/ndt/gfy175.
4. Syed-Ahmed M, Narayanan M. Immune dysfunction and risk of infection in chronic kidney disease. Adv Chronic Kidney Dis. 2019;26(1):8–15. doi:10.1053/j.ackd.2019.01.004.
5. Tammaro A, Kers J, Scantlebery AML, Florquin S. Metabolic flexibility and innate immunity in renal ischemia reperfusion injury: the fine balance between adaptive repair and tissue degeneration. Front Immunol. 2020;11:1346. doi:10.3389/fimmu.2020.01346
6. Gong T, Liu L, Jiang W, Zhou R. DAMP-sensing receptors in sterile inflammation and inflammatory diseases. Nat Rev Immunol. 2020;20(2):95–112. doi:10.1038/s41577-019-0215-7.
7. Satija R, Farrell JA, Gennert D, Schier AF, Regev A. Spatial reconstruction of single-cell gene expression data. Nat Biotechnol. 2015;33(5):495–502. doi:10.1038/nbt.3192.
8. Butler A, Hoffman P, Smibert P, Papalexi E, Satija R. Integrating single-cell transcriptomic data across different conditions, technologies, and species. Nat Biotechnol. 2018;36(5):411–420. doi:10.1038/nbt.4096.
9. Hou Y-C, Lu K-C, Kuo K-L. The efficacy of COVID-19 vaccines in chronic kidney disease and kidney transplantation patients: a narrative review. Vaccines. 2021;9(8). doi:10.3390/vaccines9080885
10. Mora JR, von Andrian UH. T-cell homing specificity and plasticity: new concepts and future challenges. Trends Immunol. 2006;27(5):235–243. doi:10.1016/j.it.2006.03.007
11. Uhl LFK, Gérard A. Modes of communication between T cells and relevance for immune responses. Int J Mol Sci. 2020;21(8):2674. doi:10.3390/ijms21082674.
12. Yen CH, Wu IW, Lee CC, et al. The prognostic value of peripheral total and differential leukocyte count in renal progression: a community-based study. PLoS One. 2021;16(10):e0258210. doi:10.1371/journal.pone.0258210
13. Portolés J, Martín L, Broseta JJ, Cases A. Anemia in chronic kidney disease: from pathophysiology and current treatments, to future agents. Front Med. 2021;8:642296. doi:10.3389/fmed.2021.642296
14. DuPage M, Bluestone JA. Harnessing the plasticity of CD4(+) T cells to treat immune-mediated disease. Nat Rev Immunol. 2016;16(3):149–163. doi:10.1038/nri.2015.18.
15. Steiger S, Rossaint J, Zarbock A, Anders HJ. Secondary immunodeficiency related to kidney disease (SIDKD)-definition, unmet need, and mechanisms. J Am Soc Nephrol. 2022;33(2):259–278. doi:10.1681/asn.2021091257.
16. Hato T, Dagher PC. How the innate immune system senses trouble and causes trouble. Clin J Am Soc Nephrol. 2015;10(8):1459–1469. doi:10.2215/cjn.04680514.
17. Fauci AS, Folkers GK. Pandemic preparedness and response: lessons from COVID-19. J Infect Dis. 2023;228(4):422–425. doi:10.1093/infdis/jiad095.
18. Fattizzo B, Rampi N, Barcellini W. Vaccinations in hematological patients in the era of target therapies: lesson learnt from SARS-CoV-2. Blood Rev. 2023;60:101077. doi:10.1016/j.blre.2023.101077
19. Tade G, Hsu HC, Woodiwiss AJ, et al. Uric acid, ferritin, albumin, parathyroid hormone and gamma-glutamyl transferase concentrations are associated with uremic cardiomyopathy characteristics in non-dialysis and dialysis chronic kidney disease patients. Int J Nephrol Renovasc Dis. 2022;15:353–369. doi:10.2147/ijnrd.S389539.
20. McCullough K, Bolisetty S. Ferritins in kidney disease. Semin Nephrol. 2020;40(2):160–172. doi:10.1016/j.semnephrol.2020.01.007.
21. González-Cuadrado C, Caro-Espada PJ, Chivite-Lacaba M, et al. Hemodialysis-associated immune dysregulation in SARS-CoV-2-infected end-stage renal disease patients. Int J Mol Sci. 2023;24(2):1712. doi:10.3390/ijms24021712
22. Yoon JW, Gollapudi S, Pahl MV, Vaziri ND. Naïve and central memory T-cell lymphopenia in end-stage renal disease. Kidney Int. 2006;70(2):371–376. doi:10.1038/sj.ki.5001550.
23. Betjes MG. Uremia-associated ageing of the thymus and adaptive immune responses. Toxins. 2020;12(4):224. doi:10.3390/toxins12040224.
24. Zhu J. T Helper Cell Differentiation, heterogeneity, and plasticity. Cold Spring Harb Perspect Biol. 2018;10(10):a030338. doi:10.1101/cshperspect.a030338.
25. Cerboni S, Gehrmann U, Preite S, Mitra S. Cytokine-regulated Th17 plasticity in human health and diseases. Immunology. 2021;163(1):3–18. doi:10.1111/imm.13280.
26. Saravia J, Chapman NM, Chi H. Helper T cell differentiation. Cell Mol Immunol. 2019;16(7):634–643. doi:10.1038/s41423-019-0220-6.
27. Zhou X, Yao J, Lin J, Liu J, Dong L, Duan M. Th17/regulatory T-cell imbalance and acute kidney injury in patients with sepsis. J Clin Med. 2022;11(14):4027. doi:10.3390/jcm11144027.
28. Luo Y, Guo J, Zhang P, et al. Mesenchymal stem cell protects injured renal tubular epithelial cells by regulating mTOR-mediated Th17/Treg Axis. Front Immunol. 2021;12:684197. doi:10.3389/fimmu.2021.684197.
29. Kang I, Bucala R. The immunobiology of MIF: function, genetics and prospects for precision medicine. Nat Rev Rheumatol. 2019;15(7):427–437. doi:10.1038/s41584-019-0238-2.
30. Bilsborrow JB, Doherty E, Tilstam PV, Bucala R. Macrophage migration inhibitory factor (MIF) as a therapeutic target for rheumatoid arthritis and systemic lupus erythematosus. Expert Opin Ther Targets. 2019;23(9):733–744. doi:10.1080/14728222.2019.1656718.
 © 2023 The Author(s). This work is published and licensed by Dove Medical Press Limited. The
full terms of this license are available at https://www.dovepress.com/terms
and incorporate the Creative Commons Attribution
- Non Commercial (unported, 3.0) License.
By accessing the work you hereby accept the Terms. Non-commercial uses of the work are permitted
without any further permission from Dove Medical Press Limited, provided the work is properly
attributed. For permission for commercial use of this work, please see paragraphs 4.2 and 5 of our Terms.
© 2023 The Author(s). This work is published and licensed by Dove Medical Press Limited. The
full terms of this license are available at https://www.dovepress.com/terms
and incorporate the Creative Commons Attribution
- Non Commercial (unported, 3.0) License.
By accessing the work you hereby accept the Terms. Non-commercial uses of the work are permitted
without any further permission from Dove Medical Press Limited, provided the work is properly
attributed. For permission for commercial use of this work, please see paragraphs 4.2 and 5 of our Terms.