Back to Journals » Cancer Management and Research » Volume 12
Identification of Apolipoprotein E as a Potential Diagnostic Biomarker of Nasopharyngeal Carcinoma
Authors Xue Y, Huang S, Huang J, Li S, Zhang C, Zhou X
Received 21 November 2019
Accepted for publication 20 July 2020
Published 24 September 2020 Volume 2020:12 Pages 8943—8950
DOI https://doi.org/10.2147/CMAR.S239479
Checked for plagiarism Yes
Review by Single anonymous peer review
Peer reviewer comments 3
Editor who approved publication: Dr Sanjeev K. Srivastava
Ying Xue, Shuo Huang, Jing Huang, Shuang Li, Cen Zhang, Xuhong Zhou
The Department of Otorhinolaryngology-Head and Neck Surgery, Zhongnan Hospital, Wuhan University, Wuhan 430071, Hubei, People’s Republic of China
Correspondence: Xuhong Zhou
The Department of Otorhinolaryngology-Head and Neck Surgery, Zhongnan Hospital, Wuhan University, Wuhan 430071, Hubei, People’s Republic of China
Tel/fax +86 27 6781 2553
Email [email protected]
Purpose: Apo-E, a secreted protein, is closely related to the migration and invasion of tumor cells. In this study, we aimed to analyze the expression of Apo-E in nasopharyngeal carcinoma (NPC) patients and cell lines, as well as its effects on NPC cell behavior.
Patients and Methods: Our study included 35 patients with NPC from Zhongnan Hospital. Expression levels of Apo-E in patients with NPC were examined by quantitative reverse transcription-polymerase chain reaction, Western blot, and immunohistochemical (IHC) staining. Receiver operating characteristic (ROC) curves were analyzed using the SPSS 22 software to estimate the sensitivity and specificity of the Apo-E protein in diagnosing NPC. Additionally, the level of Apo-E in NPC cell lines (NP69, 6– 10B, and 5– 8F) was investigated by Western blotting and IHC.
Results: Levels of Apo-E were higher in NPC patients than in controls. Moreover, ROC analysis revealed that increased Apo-E in the serum of NPC patients may act as a potential biomarker for NPC diagnosis (Area under the curve 0.917). Furthermore, similar results were also identified in NPC cancer cell lines. RNA interference technology was used to overexpress the endogenous Apo-E in the NPC cell line 6– 10B. Wound healing and transwell assays indicated that the overexpression of Apo-E increased the number of cell colonies and migration ability, respectively.
Conclusion: In this study, we found that Apo-E was elevated in NPC patients and may act as a potential biomarker for NPC diagnosis. In addition, Apo-E was upregulated in NPC cell lines and promoted cell growth, migration, and invasion.
Keywords: cancer, nasopharynx, secretory glycoprotein, migration, invasion
Introduction
Nasopharyngeal carcinoma (NPC) is one of the most common squamous cell carcinoma derived from the epithelial cells of the nasopharynx. It is highly malignant and is accompanied by local invasion and metastasis at an early stage.1 A unique feature of NPC is its strikingly unusual ethnic and geographic distribution, as the incidence is significantly different in the USA in the white (0.8/100,000 persons per year) and Asian communities (7.6–10.7/100.000 persons per year).2–6 It has been reported that the survival rates of early stage NPC patients reached 75–90%; however, they are less than 50% at the stage of metastasis.7 Many investigations have been used for the detection of NPC such as low dose computed tomography scans. Besides, certain serum biomarkers including serum amyloid A protein, Galectin-1, and BMI-1 are commonly used diagnostic biomarkers in NPC patients.8–12 However, these investigations lacked capability in confirming the degree of malignancy of NPC. Further elucidation of the molecular mechanism underlying the occurrence and metastasis of NPC is essential in the near future.
Exploration of tumor-associated markers has become mainstream for understanding the tumorigenesis and exploring the biomarkers of cancer diagnosis and prognosis.13 Apo-E, a secretory glycoprotein, mediates lipid metabolism by binding with the low-density lipoprotein receptor,14 and this binding activates various signal transduction pathways subsequently.15–17 Thus, Apo-E not only has a function in regulating lipid metabolism but also plays a critical role in cellular biological events including antioxidant effects, immune response, and cell proliferation.18–20 It also participates in a number of signal transduction pathways that regulate cancer cell proliferation and survival. In addition, Apo-E has been implicated in cancer development in epithelial malignancies including ovarian and prostate cancers.21–23
In this study, the expression of Apo-E in both NPC tissue and serum was detected by quantitative reverse transcription-polymerase chain reaction (qRT-PCR), immunohistochemistry (IHC), and Western blotting. Furthermore, the diagnostic value of Apo-E in NPC patients was estimated using the receiver operating characteristic curve (ROC) curve. The level of Apo-E in NPC cell lines was investigated by qRT-PCR, IHC, and Western blotting. In addition, the molecular functions and effect of Apo-E on cell growth and invasion were examined.
Patients and Methods
Tissue Specimens
Cancerous and neighboring noncancerous tissues (from the nasal cavity) were obtained from NPC patients who had not undergone surgical treatment between November 2016 and October 2017 in Zhongnan Hospital, Wuhan University. Samples were fixed with 10% formaldehyde and paraffin-embedded subsequently. Written informed consent was obtained from all patients before the use of the clinical samples.
Patient Serum Samples
We reviewed the medical records of 35 patients who were newly diagnosed with NPC and had been confirmed by biopsy at Zhongnan Hospital (Wuhan, China). All patients were diagnosed and confirmed through a pathological examination, and the specimens were collected before surgery. The serum samples were not treated with protease inhibitors after collection, and all of them were stored at −80°C until analysis. Informed consent was obtained from all patients in this study, and all research protocols were according to the established guidelines of the Institutional Review Board of Zhongnan Hospital, China.
Cell Lines and Culture
NPC cell lines 5–8F (high metastasis), 6–10B (low metastasis), and human immortalized nasopharyngeal epithelial cell line (NP69-SV40T) were purchased from the Shanghai Institute of Cell Biology. All cells were cultured in RPMI-1640 (Gibco/Life Technologies, CA, USA)) supplemented with 10% fetal bovine serum (HyClone Laboratories, Logan, UT, USA), 100 μg/mL penicillin, and 100 μg/mL streptomycin at 37°C in a humidified atmosphere of 5% CO2.
Antibodies and Lectin
The rabbit anti-Apo-E antibody was purchased from Boster (Wuhan, China). The β-actin antibody was purchased from Abcam (Cambridge, MA, USA).
RT-PCR for mRNA Expression Analysis
Total RNA was extracted from NPC tissues and cell lines with TRIzol (Invitrogen), and 900 ng of total RNA was subjected to reverse-transcription by an Advantage Two-Step RT-PCR system (Invitrogen) according to the manufacturer’s instructions. PCR primers used were as follows (sense and antisense, respectively): Apo-E, 5ʹ-GGGACAGGTGGAGAGCC-3ʹ and 5-TTAGCAGATGTCCGAAG-3; and β-actin was amplified as an internal control with the primers 5-GCACTCTTCCAGCCTTCC-3 and 5-GCGCTCAGGAGGAGCAAT-3. qRT-PCR was performed using StepOne Real time-PCR (Applied Biosystems; Thermo Fisher Scientific, Inc.) using a StepOne Real time-PCR instrument (Applied Biosystems; Thermo Fisher Scientifc, Inc), and gene expression of the target mRNA was calculated by the 2−ΔΔCt method. The following real-time PCR parameters were used for all qPCR reactions: initial denaturation at 95°C for 30 s, followed by 40 cycles of 10 s denaturation at 95°C, 30 s of annealing, and extension at 60°C for 1 min. The expression level of each gene was normalized to the level of β-actin gene in the same sample.
Immunohistochemical Staining
NPC tissues were deparaffinized in xylene and then hydrated using a graded series of alcohols to water. Antigen retrieval was performed in a citrate solution (Beyotime Institute of Biotechnology) by heating in a microwave. The tissues were then incubated in 3% H2O2 for 30 min to block endogenous peroxidase activity. After washing with phosphate-buffered saline (PBS), tissue sections were blocked with (10X Tris Buffered Saline with Tween® 20) TBS-T containing 5% bovine serum albumin (BSA) and then incubated with Apo-E overnight at 4°C, followed by incubation with HRP-conjugated secondary antibody for 1 h. Subsequently, tissue sections were stained with 3.3-diaminobenzidine and counterstained with hematoxylin and eosin for visualization. Expression in normal tissue was used as a negative control.
Western and Lectin Blot Analyses
Protein extracted from the tissues or cells was detected using a bicinchoninic acid protein assay kit (Takara Bio, Otsu, Japan). Protein samples were loaded on to the gel of 8% sodium dodecyl sulfate-polyacrylamide gel electrophoresis (SDS–PAGE) and then electro-transferred onto a 0.45 μm PVDF membrane (Millipore, Bedford, MA, USA), which was subsequently blocked in 3% BSA for 1 h at room temperature with TBS containing 0.05% Tween-20 (TBS-T). The membrane was incubated with antibodies or lectin overnight at 4°C, and β-actin was utilized as a loading control. After washing with TBS-T three times, the membrane was incubated with HRP-conjugated goat anti-rabbit IgG diluted with TBS-T for 1 h at room temperature. Finally, the membrane was visualized with Enhanced Chemiluminescence Plus reagent (Beyotime Institute of Biotechnology, Shanghai, China). Densitometric values were normalized to actin levels by the Image J software.
Enzyme-Linked Immunosorbent Assay (ELISA)
The frozen serum samples were kept at 4 °C before use until they were completely defrosted. Apo-E levels were detected using the human Apo-E ELISA kit (R&D), and the analyses were performed in duplicate according to the manufacturer’s instructions. The concentration of Apo-E was visualized at 450 nm using a Multiskan spectrophotometer (Thermo-fisher Scientific, USA), and the absorbance of known concentrations of Apo-E was tested and defined as the standard curve to determine the concentration of Apo-E in NPC patients.
Construction of Vectors and Establishment of Transient Transfection
To overexpress Apo-E, RNA interference was performed, and the CDS region of Apo-E (878 bp) was cloned. The sequences of the primer pairs were as follows: forward, 5-CACCGTGTGCATGCTTTAGCACACATCTGCC-3 and reverse, 5-AAGCGCGCAACGATGTGTGCATCTGTCTTG-3′. Short hairpin RNA (shRNA) specific for Apo-E (Apo-E-shRNA) was obtained from the Gene Pharmaceutical Technology Company (Gene Pharma, Shanghai, China). Transient transfection was performed using Lipofectamine 3000 (Invitrogen; Thermo Fisher Scientific, Inc.) with 5 nM siRNAs at 37°C for 6 h according to the manufacturer’s instructions. Apo-E-overexpressing lentiviral vectors were transfected into the 293T cells with packaging plasmids for preparing the viruses, which were then incubated with 6–10B cells for 24 h. After 24 h of transfection, the culture medium containing 700 mg/mL G418 in the complete medium was used to select stably transfected cells for further studies.
Wound-Healing Assay
6–10B cells (5 × 10⁵ per well) were plated in six-well plates. After cells had grown to over 90% confluence, the cell monolayer was wounded and scraped to ensure the same width at the beginning. A 10 µL sterile pipette tip was used to create a smooth denuded edge. The cells were then cultured in a medium for different amounts of time. After incubation, the culture medium was discarded and the cells were washed twice with PBS. Finally, the migration of the cells to the wounded area was visualized using a microscope (Olympus, CA) and images were analyzed to test the percentage of wound closure.
Transwell Migration Assay
Cell migration was measured using 6.5-mm Transwell chambers with 8-μm pore size (Corning Costar, USA). Apo-E overexpressing and control cells were divided into three groups, and 3 × 10⁴ cells were resuspended in 200 µL of serum-free RPMI-1640 medium and seeded in the upper chambers, while 500 μL of the complete medium was added in the lower chambers. After the cells were cultured for 24 h, the cells in the top chambers were washed with PBS, fixed with 4% paraformaldehyde, and stained with 0.1% crystal violet. Images of the membranes were observed and photographed in three different fields. In addition, cells were randomly counted three times using the Image-Pro Plus 6.0 software.
Statistical Analysis
Intensities of the stained bands were analyzed using the Image Lab software (Bio-Rad Laboratories) and differences were compared using GraphPad Prism version 6. All experiments were carried out in triplicate. Data from Western blotting and RT-PCR were analyzed using the Student’s t-test (two-tailed, unequal variance). Differences were considered significant when P < 0.05. ROC curves were analyzed using the SPSS 22 software to estimate the sensitivity and specificity of Apo-E protein.
Results
Upregulation of Apo-E in NPC Patients
Apo-E is closely related to tumor invasion and metastasis. Therefore, in order to evaluate the level of Apo-E in tissues from NPC patients, PCR, RT-PCR, and IHC were performed. The results showed that the level of Apo-E was upregulated in the NPC tissue compared to the adjacent normal tissue, which was the control (Figure 1AC). Furthermore, the level of Apo-E in the serum of NPC patients was consistent with the results of IHC (Figure 1D, Supplemeantary Figure 1). In summary, the expression of Apo-E in NPC patients was significantly elevated.
 |
Figure 1 Apo-E is up-regulated in NPC patients. (A) PCR using total RNA extracted from the NPC tissue and adjacent normal tissue was carried out to examine the expression levels of Apo-E. (B) Immunohistochemical analysis of the Apo-E level in the NPC tissue and adjacent normal tissue. (C) RT-PCR using total RNA extracted from the NPC tissue and adjacent normal tissue was performed to examine the expression levels of Apo-E. (D) Western blot analysis of Apo-E expression in the serum of healthy and NPC patients. The quantitative data were obtained from three independent experiments. The p values were calculated using the one-tailed unpaired Student’s t-test. Error bars, S.D. **p<0.01. |
Upregulation of Apo-E in NPC Cells
Next, we explored the changes in Apo-E in the NPC cell lines. The 6–10B (low metastasis) and 5–8F (high metastasis) NPC cell lines and the NP69 nasopharyngeal epithelial cell line were selected. Western blot analysis suggested that Apo-E exhibited higher expression in the NPC cell lines compared to the normal control (Figure 2A, Supplementary Figure 2). In addition, this higher expression of Apo-E in NPC cell lines was also reflected at the mRNA level by RT-PCR analysis (Figure 2B). Consequently, the above results clearly indicate that an increased expression of Apo-E was also present in NPC cancer cell lines.
 |
Figure 2 Apo-E was increased in NPC cell lines. (A) Western blot analysis of Apo-E levels in NP69, 6–10B, and 5–8F cell lines. (B) RT-PCR using total RNA extracted from NP-69, 6–10B, and 5–8F cell lines was carried out to examine the expression levels of Apo-E. The quantitative data were obtained from three independent experiments. The p values were calculated using the one-tailed unpaired Student’s t-test. Error bars, S.D. *p < 0.05, **p < 0.01. |
Assay of Apo-E in the Serum of NPC Patients
In order to further confirm the diagnostic value of Apo-E in NPC, the serum Apo-E level was detected by ELISA (Figure 3A). The data indicated that the level of Apo-E was higher in NPC serum samples than in normal serum samples (P < 0.05). Furthermore, sensitivity and specificity analysis for Apo-E were also performed using ROC curve analysis (Figure 3B). The results were expressed as area under the curve (AUC). The AUC of Apo-E was 0.917. These results demonstrate that Apo-E is upregulated in the serum of NPC patients and may act as a potential biomarker for NPC tumor diagnosis.
 |
Figure 3 Increased Apo-E may be a potential biomarker for NPC diagnosis. (A) Analysis of the Apo-E expression in the serum of an NPC patient and healthy control by ELISA. (B) ROC curve analysis of the sensitivity and specificity of Apo-E in the diagnosis of NPC. Data from ELISA analyses for Apo-E. The p values were calculated using the one-tailed unpaired Student’s t-test. Error bars, S.D. ****p<0.0001. |
Effects of Apo-E Overexpression on NPC Cell Lines
To directly evaluate the functional effects of Apo-E on NPC cell lines, RNA interference technology was used to overexpress the endogenous Apo-E in the NPC cell line 6–10B. Western blot (Figure 4A, Supplementary Figure 3) and RT-PCR (Figure 4B) analyses were performed to assess the overexpression efficiency, and the results showed that Apo-E was successfully upregulated. Subsequently, the effects of Apo-E on cell growth and invasion ability of 6–10B cells were investigated using wound healing and transwell assays, respectively. Wound healing indicated that the overexpression of Apo-E increased the number of cell colonies when compared with the control cells (Figure 4C). Transwell migration assays were performed to analyze the migration ability of 6–10B cells, and we compared migration and invasion between the Apo-E overexpressing and control cell groups. We found that Apo-E overexpression in 6–10B cells was associated with high migration and invasion (Figure 4D). Taken together, these results suggest that Apo-E induces the growth, migration, and invasion abilities of 6–10B cells.
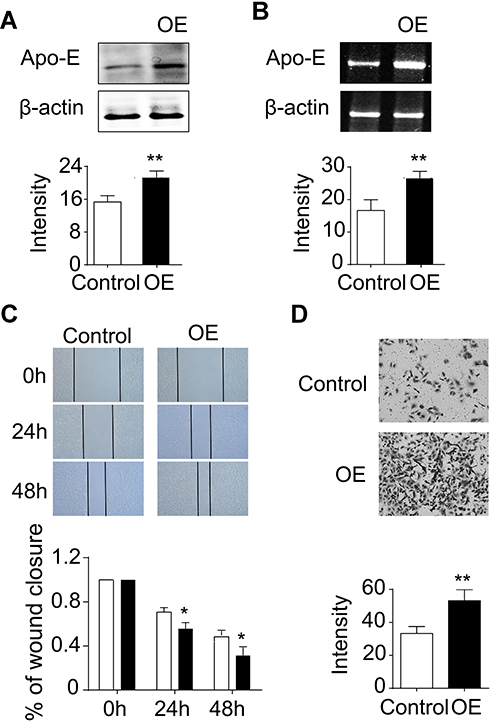 |
Figure 4 Overexpression of Apo-E increased cell growth and migration in 6–10B cells. PCR (A) and Western blot (B) were performed to check the Apo-E knockdown efficiency. The expression level of β-actin was used as a loading control. Cell viability of Apo-E overexpressing and control cells was detected by a migration assay (C). The migratory capability of Apo-E overexpressing cells and control cells was determined by a transwell assay (D). The quantitative data were obtained from three independent experiments. The p values were calculated using one-tailed unpaired Student’s t-test. Error bars, S.D.*p < 0.05, **p < 0.01. |
Discussion
Cancer is a serious threat to the survival of the human race. Tumor distant metastasis and the development of resistance to antitumor therapies are mainly responsible for the death of cancer patients.24 Therefore, exploration of early and effective diagnostic biomarkers has become mainstream in cancer research. NPC is a cancer with a high rate of distant metastasis. Consequently, there is an urgent need to find a novel and accurate diagnostic marker with the aid of modern detection technologies. Although numerous NPC-associated serological markers have been used as biomarkers for NPC diagnosis, none of them has shown satisfactory sensitivity.10–12 Therefore, the principal aim of this study was to find novel molecular biomarkers with a focus on cancer-associated serum proteins.
Apo-E is a secreted protein implicated in lipoprotein metabolism and is mainly synthesized in the liver and brain. Several reports have investigated its significance in various diseases. For example, RT-PCR and immunohistochemistry analyses have indicated that upregulation of Apo-E is an independent indicator of muscular invasion in gastric cancer and is considered a potential biomarker for predicting its invasion. Moreover, the survival of patients has a negative correlation with Apo-E expression.25 Apo-E protein levels also have a potential as an endophenotype marker of Alzheimer’s disease pathology.26 Pencheva et al suggested that Apo-E impedes melanoma cell invasiveness and endothelial cell recruitment.27 Using differential in-gel electrophoresis, Yu et al indicated that increased Apo-E may act as a direct marker of pancreatic malignancy.28,29 In addition, studies have shown that Apo-E has significant diagnostic value in extrahepatic biliary atresia and diabetic nephropathy.30,31 Different from the investigations that focused on the protein level of Apo-E, Heba Allam et al suggested that bisecting glycosylation of Apo-E was significantly increased in ovarian cancer tissues, which means that the unique structures of these proteins are novel research areas and targets.32
The effects of Apo-E on cell behavior have been extensively explored. Qin et al indicated that Apo-E induces MAP kinase activity and a corresponding increase in cyclin D1 expression, which facilitates cell proliferation by regulating key proteins involved in G1/S transition.33,34 Furthermore, Apo-E can bind apolipoprotein E receptor 2 (ApoER2) and participate in transmitting the extracellular Reelin signal to intracellular signaling processes, followed by interaction with c-Jun N-terminal kinase interacting proteins, activating the JNK-signaling pathway.35–37 Reelin, a large secreted extracellular matrix glycoprotein, participates in the migratory capacity of primary cancer cells.38–40 Besides, Reelin also promotes the proliferation of intestinal and submandibular gland epithelial cells and granulosa cells via ApoERs (VLDLR)/Dab1/PI3K/Akt and MAPK pathways.41–43 Taken together, Apo-E can regulate tumor progression via Reelin, activating integrin β1/Syk/Akt and/PI3K/Akt and MAPK pathways and promoting cell adhesion, survival, proliferation, and drug resistance. However, further studies are needed to explore the functions of Apo-E in NPC cellular physiology and progression.
In this study, alteration of Apo-E in the tissues and serum of healthy control and NPC patients was investigated by using RT-PCR, IHC, and Western blotting. Furthermore, ROC analysis revealed that increased Apo-E in the serum of NPC patients may act as a potential biomarker for NPC tumor diagnosis. However, due to the small sample size of this study, the results need to be confirmed by investigating larger patient samples to determine whether they are truly reliable. Future studies on molecular biology and clinical research should be carried out to determine whether Apo-E is helpful in NPC diagnosis along with evaluating its sensitivity and specificity for the diagnosis of NPC.
Conclusion
NPC as a malignant tumor, is attracting more and more attention. In this study, we found that Apo-E, a secreted protein was elevated in NPC patients and may act as a potential biomarker for NPC diagnosis. In addition, the similar phenomenon was also existed in NPC cell lines and promoted cell growth, migration, and invasion. However, the further study is needed to explore the molecular mechanism about Apo-E regulating the behavior of cells.
Abbreviations
NPC, nasopharyngeal carcinoma; qRT-PCR, quantitative reverse transcription-polymerase chain reaction; IHC, immunohistochemical staining; ROC, receiver operating characteristic; AUC, area under the curve.
Funding
This work was supported by the Fund of the Health and Family Planning of Hubei Province (No. WJ2015MB036).
Disclosure
The authors report no conflicts of interest in this work.
References
1. He H, Liao X, Yang Q, et al. MicroRNA-494-3p promotes cell growth, migration, and invasion of nasopharyngeal carcinoma by targeting Sox7. Technol Cancer Res Treat. 2018;17:1533033818809993.
2. Chang ET, Adami HO. The enigmatic epidemiology of nasopharyngeal carcinoma. Cancer Epidemiol Biomarkers Prev. 2006;15(10):1765–1777.
3. Stewart BW, Kleihues P World Cancer Report chap. Head and neck cancer. Lyon, IARC Press. 2003;
4. Seigneurin JM, Fafi-Kremer S, Baccard M, Morand P. Cahier de formation biologie médicale. Le virus Epstein-Barr et les marqueurs de l’infection. 2006;
5. Brennan B. Nasopharyngeal carcinoma. Orphanet J Rare Dis. 2006;1:23.
6. Busson P, Ooka T, Corbex M. Carcinomes nasopharyngés associés au virus d’Epstein-Barr: de l’épidémiologie à la thérapeutique et au dépistage. médecine/sciences. 2004;20(4):453–457.
7. Lee AW, Poon YF, Foo W, et al. Retrospective analysis of 5037 patients with nasopharyngeal carcinoma treated during 1976-1985: overall survival and patterns of failure. Int J Radiat Oncol Biol Phys. 1992;23(2):261–270.
8. Lin GW, Wang LX, Ji M, Qian HZ. The use of MR imaging to detect residual versus recurrent nasopharyngeal carcinoma following treatment with radiation therapy. Eur J Radiol. 2013;82:2240–2246.
9. Gong QY, Zheng GL, Zhu HY. MRI differentiation of recurrent nasopharyngeal carcinoma from postradiation fibrosis. Comput Med Imaging Graph. 1991;15(6):423–429.
10. Cho WC, Yip TT, Yip C, et al. Identification of serum amyloid a protein as a potentially useful biomarker to monitor relapse of nasopharyngeal cancer by serum proteomic profiling. Clin Cancer Res. 2004;10(1):43–52.
11. Tong YQ, Liu B, Huang J, et al. BMI-1 autoantibody in serum as a new potential biomarker of nasopharyngeal carcinoma. Cancer Biol Ther. 2008;7(3):340–344.
12. Tang CE, Tan T, Li C, et al. Identification of Galectin-1 as a novel biomarker in nasopharyngeal carcinoma by proteomic analysis. Oncol Rep. 2010;24(2):495–500.
13. Cao S, Cui Y, Xiao H, et al. Upregulation of flotillin-1 promotes invasion and metastasis by activating TGF-β signaling in nasopharyngeal carcinoma. Oncotarget. 2016;7(4):4252.
14. Mahley RW. Apolipoprotein E: cholesterol transport protein with an expanding role on cell biology. Science. 1988;240:622–630.
15. Li Y, Cam J, Bu G. Low-density lipoprotein receptor family: endocytosis and signal transduction. Mol Neurobiol. 2001;23(1):53–67.
16. Ho YY, Deckelbaum RJ, Chen Y, Vogel T, Talmage DA. Apolipoprotein E inhibits serum-stimulated cell proliferation and enhances serum-independent cell proliferation. J Biol Chem. 2001;276(46):43455–43462.
17. Mahley RW, Rall SC
18. Rubinsztein DC, Hanlon CS, Irving RM, et al. Apo E genotypes in multiple sclerosis, Parkinson’s disease, schwannomas and late-onset Alzheimer’s disease. Mol Cell Probes. 1994;8(6):519–525.
19. Ishigami M, Swertfeger DK, Hui MS, Granholm NA, Hui DY. Apolipoprotein E inhibition of vascular smooth muscle cell proliferation but not the inhibition of migration is mediated through activation of inducible nitric oxide synthase. Arterioscler Thromb Vasc Biol. 2000;20(4):1020–1026.
20. Williams H, Johnson JL, Carson KG, Jackson CL. Characteristics of intact and ruputured atherosclerotic plaques in brachiocephalic arteries of Apolipoprotein E knockout mice. Arterioscler Thromb Vasc Biol. 2002;22:788–792.
21. Chen YC, Pohl G, Wang TL, et al. Apolipoprotein E is required for cell proliferation and survival in ovarian cancer. Cancer Res. 2005;65(1):331–337.
22. Dupont-Wallois L, Soulié C, Sergeant N, et al. ApoE synthesis in human neuroblastoma cells. Neurobiol Dis. 1997;4(5):356–364.
23. Venanzoni MC, Giunta S, Muraro GB, et al. Apolipoprotein E expression in localized prostate cancers. Int J Oncol. 2003;22(4):779–786.
24. Wang YT, Sun XY, Wang H, et al. Effects of NGX6 expression on proliferation and invasion of nasopharyngeal carcinoma cells and survival of patients. Eur Rev Med Pharmacol Sci. 2017;21(23):5378–5385.
25. Sakashita K, Tanaka F, Zhang X, et al. Clinical significance of ApoE expression in human gastric cancer. Oncol Rep. 2008;20(6):1313–1319.
26. Kanekiyo T, Xu H, Bu G. ApoE and Aβ in Alzheimer’s disease: accidental encounters or partners? Neuron. 2014;81(4):740–754.
27. Pencheva N, Tran H, Buss, et al. Convergent multi-miRNA targeting of ApoE drives LRP1/LRP8-dependent melanoma metastasis and angiogenesis. Cell. 2012;151(5):1068–1082.
28. Yan L, Tonack S, Smith R, et al. Confounding effect of obstructive jaundice in the interpretation of proteomic plasma profiling data for pancreatic cancer. J Proteome Res. 2009;8(1):142–148.
29. Yu KH, Rustgi AK, Blair IA. Characterization of proteins in human pancreatic cancer serum using differential gel electrophoresis and tandem mass spectrometry. J Proteome Res. 2005;4(5):1742–1751.
30. Qian G. Association of Apo-E gene polymorphism with biochemical and lipid metabolism parameters in patients with diabetic nephropathy of Hui and Han populations in Gansu Province. China Med Abstracts. 2006;(4):203–204.
31. Rafeey M, Saboktakin L, Hassani JS, et al. Diagnostic value of procalcitonin and Apo-E in extrahepatic biliary Atresia. Iran J Pediatr. 2014;24(5):623–663.
32. Allam H, Aoki K, Benigno BB, et al. Glycomic analysis of membrane glycoproteins with bisecting glycosylation from ovarian cancer tissues reveals novel structures and functions. J Proteome Res. 2015;14(1):434–446.
33. Ishigami M, Swertfeger DK, Granholm NA, Hui DY. Apolipoprotein E inhibits platelet-derived growth factor-induced vascular smooth muscle cell migration and proliferation by suppressing signal transduction and preventing entry to G1 phase. J Biol Chem. 1998;273(32):20156–20161.
34. Qin X, Lin L, Cao L, et al. Extracellular matrix protein Reelin promotes myeloma progression by facilitating tumor cell proliferation and glycolysis. Sci Rep. 2017;7(1):1–2.
35. Gotthardt M, Trommsdorff M, Nevitt MF, et al. Interactions of the low density lipoprotein receptor gene family with cytosolic adaptor and scaffold proteins suggest diverse biological functions in cellular communication and signal transduction. J Biol Chem. 2000;275(33):25616–25624.
36. Stockinger W, Brandes C, Fasching D, et al. The reelin receptor apoER2 recruits JNKinteracting proteins-1 and −2. J Biol Chem. 2000;275(33):25625–25632.
37. Yuan Y, Chen H, Ma G, Cao X, Liu Z. Reelin is involved in transforming growth factor-β1-induced cell migration in esophageal carcinoma cells. PLoS One. 2012;7(2):e31802.
38. Dohi O, Takada H, Wakabayashi N, et al. Epigenetic silencing of RELN in gastric cancer. Int J Oncol. 2009;36(1):85–92.
39. Stein T, Cosimo E, Yu X, et al. Loss of reelin expression in breast cancer is epigenetically controlled and associated with poor prognosis. Am J Pathol. 2010;177(5):2323–2333.
40. Chai X, Förster E, Zhao S, Bock HH, Frotscher M. Reelin stabilizes the actin cytoskeleton of neuronal processes by inducing n-cofilin phosphorylation at serine3. J Neurosci. 2009;29(1):288–299.
41. Vázquez‐Carretero MD, García‐Miranda P, Calonge ML, Peral MJ, Ilundain AA. Dab1 and reelin participate in a common signal pathway that controls intestinal crypt/villus unit dynamics. Biol Cell. 2014;106(3):83–96.
42. Eresheim C, Leeb C, Buchegger P, Nimpf J. Signaling by the extracellular matrix protein Reelin promotes granulosa cell proliferation in the chicken follicle. J Biol Chem. 2014;289(14):10182–10191.
43. Rebustini IT, Hayashi T, Reynolds AD, Dillard ML, Carpenter EM, Hoffman MP. miR-200c regulates FGFR-dependent epithelial proliferation via Vldlr during submandibular gland branching morphogenesis. Development. 2012;139(1):191–202.
 © 2020 The Author(s). This work is published and licensed by Dove Medical Press Limited. The
full terms of this license are available at https://www.dovepress.com/terms
and incorporate the Creative Commons Attribution
- Non Commercial (unported, 3.0) License.
By accessing the work you hereby accept the Terms. Non-commercial uses of the work are permitted
without any further permission from Dove Medical Press Limited, provided the work is properly
attributed. For permission for commercial use of this work, please see paragraphs 4.2 and 5 of our Terms.
© 2020 The Author(s). This work is published and licensed by Dove Medical Press Limited. The
full terms of this license are available at https://www.dovepress.com/terms
and incorporate the Creative Commons Attribution
- Non Commercial (unported, 3.0) License.
By accessing the work you hereby accept the Terms. Non-commercial uses of the work are permitted
without any further permission from Dove Medical Press Limited, provided the work is properly
attributed. For permission for commercial use of this work, please see paragraphs 4.2 and 5 of our Terms.