Back to Journals » Journal of Hepatocellular Carcinoma » Volume 10
Identification of a Novel Prognostic Signature Based on N-Linked Glycosylation and Its Correlation with Immunotherapy Response in Hepatocellular Carcinoma
Authors Lin SS, Cao Y, Zhu K, Yang CN, Zhu XP, Zhang HH, Zhang R
Received 15 April 2023
Accepted for publication 8 September 2023
Published 9 October 2023 Volume 2023:10 Pages 1749—1765
DOI https://doi.org/10.2147/JHC.S417407
Checked for plagiarism Yes
Review by Single anonymous peer review
Peer reviewer comments 2
Editor who approved publication: Dr David Gerber
Shusheng Lin,1,2,* Yi Cao,3,* Ke Zhu,1,2,4,* Caini Yang,1,2 Xiangping Zhu,2 Honghua Zhang,1,2 Rui Zhang1,2
1Department of Biliary-Pancreatic Surgery, Sun Yat-sen Memorial Hospital, Sun Yat-sen University, Guangzhou, People’s Republic of China; 2Guangdong Provincial Key Laboratory of Malignant Tumor Epigenetics and Gene Regulation, Guangdong-Hong Kong Joint Laboratory for RNA Medicine, Sun Yat-sen Memorial Hospital, Sun Yat-sen University, Guangzhou, People’s Republic of China; 3Emergency Department, Sun Yat-sen Memorial Hospital, Sun Yat-sen University, Guangzhou, People’s Republic of China; 4Guangdong TCRCure Biopharma Technology Co., Ltd, Guangzhou, People’s Republic of China
*These authors contributed equally to this work
Correspondence: Rui Zhang; Honghua Zhang, Email [email protected]; [email protected]
Background: The complex tumor microenvironment of hepatocellular carcinoma (HCC) has led to a low response to immune checkpoints inhibitors (ICIs) and a poor prognosis. PD-L1, as one of the indications for ICIs, is rich in glycosylation modifications, which result in untimely ICIs. Our study constructed a prognostic model based on N-linked glycosylation related genes for predicting the prognosis and the response to ICIs.
Methods: The list of N-linked glycosylation related genes is from the AmiGO2 database. The patients in The Cancer Genome Atlas (TCGA) and Gene Expression Omnibus (GEO) cohorts were enrolled. The Cox regression was performed to develop a prognostic model and patients were divided into a low- and high-risk subgroups. The role of signature in HCC was well investigated by prognostic analysis, gene set enrichment analysis, and immune infiltration analysis. 21 recurrent HCC patients who received postoperative adjuvant ICIs were recruited to evaluate the relationship between immunotherapy response and the signature. In vitro studies were conducted to investigate the oncogenic effects of DDOST, STT3A and TMEM165 in HCC.
Results: 59 N-linked glycosylation related differentially expressed genes were screened from HCC and normal tissues in the TCGA cohort. The prognostic model was developed with DDOST, STT3A and TMEM165. The risk score could be an independent prognostic factor. Patients in the high-risk subgroup showed a worse prognosis than patients in the low-risk one. ssGSEA showed that patients in the low-risk subgroup tended to be in the immune-activated state, with higher levels of B cell and macrophage cell infiltrations and lower levels of regulatory T cell (Treg) infiltrations in both TCGC and GEO cohorts. Immunohistochemistry studies showed that DDOST, STT3A and TMEM165 are highly expressed in tumor tissues and patients with a high-risk score correlated with poor progression free survival and worse immunotherapeutic response. Furthermore, the proliferation of HCC cells was reduced after the knockdown of DDOST, as well as upon the knockdown of STT3A and TMEM165.
Conclusion: In this study, we establish that the risk model based on N-linked glycosylation related genes could efficiently predict the prognosis and tumor microenvironment immune state of HCC patients, and the risk score could serve as a novel indicator of immunotherapy.
Keywords: N-linked glycosylation, prognostic signature, HCC, immune infiltration, immunotherapy
Introduction
Based on the GLOBOCAN 2020 estimates produced by IARC, primary liver cancer was ranked as the sixth most common cancer and the third leading cause of cancer-related deaths worldwide in 2020. Among primary liver cancers, Hepatocellular carcinoma (HCC) is the most frequent pathologic subtype.1 Despite significant progress in HCC treatment through surgical resection, liver transplantation, and immune checkpoint inhibitor (ICI)-based therapy, the prognosis for patients with HCC remains poor. The emergence of ICIs has provided a new avenue for HCC treatment. However, due to the lack of effective indicators to predict the therapeutic response of immunotherapy in HCC, there is a current lack of individualized guidance for drug selection.2 Hence, there is an urgent need to identify novel and potential therapeutic targets and prognostic indicators related to tumor formation and progression in patients with HCC.
As one of the most abundant post-translational modifications of membrane-bound proteins in eukaryotes, N-linked glycosylation is initiated in the endoplasmic reticulum (ER) by the oligosaccharyltransferase (OST) complex assembled with STT3A or STT3B catalytic subunits. The core glycan is then trimmed and further processed in the ER and Golgi apparatus before the glycosylated protein is translocated to the cell membrane.3 This form of protein glycosylation is regulated by the programmed remodeling of glycosyltransferases and glycosidases and affects a number of biological activities,4 including protein biosynthesis, protein stability, intracellular trafficking, subcellular localization, and ligand-receptor interaction. Recent studies on protein glycosylation5–10 revealed that glycosylation plays a crucial role in tumor progression at various pathophysiological steps, including tumor proliferation and immune modulation. Li et al11 first demonstrated that glycosylation of PD-L1 inhibited 26S proteasome mediated protein degradation. Their study showed that glycosylation of N192, N200, and N219 may antagonize the interaction between PD-L1 and GSK3β, thereby inhibiting GSK3β-mediated phosphorylation and degradation of PD-L1, leading to tumor-associated immune escape. However, little is known about the regulatory mechanism of N-linked glycosylation in tumor progression and immunotherapy of HCC.
In this study, we conducted a comprehensive investigation of the expression levels of N-linked glycosylation-related genes in HCC, as well as their clinical significance, using multiple bioinformatics analysis tools. Furthermore, we determined the oncological role of N-linked glycosylation-related genes in HCC through functional enrichment analysis and in vitro studies.
Methods
Human Specimens
The paraffin-embedded tissues derived from 21 postoperative recurrent HCC patients were collected (Table S1), who received at least 4 cyclical adjuvant anti-PD1/PD-L1 monoclonal antibody treatments after recurrence at Sun Yat-sen Memorial Hospital, Sun Yat-sen University between 2017 and 2022. The response to ICIs were evaluated by using CT/MRI imaging and measuring serum AFP level according to the guideline of mRECIST. All the human specimens enrolled into this study were anonymously coded in accordance with local ethical guidelines with written informed consent and a protocol approved by the committee review board of Sun Yat-sen Memorial Hospital.
Data Collection
The RNA-sequence data and clinical characteristics of 374 HCC patients were obtained from the TCGA database (https://www.ncbi.nlm.nih.gov/geo) on February 12, 2022. A cohort of HCC patients with RNA-sequence and clinical features were downloaded from the GEO database on January 22, 2009, and the last follow-up update was on October 6, 2021. (https://www.ncbi.nlm.nih.gov/geo, ID: GSE14520)
Identification of Differentially Expressed Genes (DEGs)
Seventy N-linked glycosylation related genes were retrieved from the AmiGO2 database (http://amigo.geneontology.org/amigo) by searching the keyword “N-linked glycosylation” and verified in several reviews.12–15 DEGs were identified by using R package “limma”, and the filtration condition was P<0.05. The correlation of DEGs was analyzed by using the R package “igraph” and “reshape2”. A protein-protein interaction (PPI) network for the DEGs was constructed from the Search Tool for the Retrieval of Interacting Genes (https://cn.string-db.org), the minimum required interaction score between these genes was above 0.9.
Consensus Clustering Analysis of N-Linked Glycosylation Related Genes
To classify the clinical features of HCC patients, consensus cluster analysis was performed by the “ConsensusClusterPlus” package. The number of clusters was determined by the consensus clustering algorithm, and performed at least 1000 times to guarantee the stability of the result. “Survival” and “SurvMiner” packages were performed to compare the overall survival between clusters.
Construction and Validation of Prognostic Models
To establish the prognostic model, N-linked glycosylation genes related to survival were screened through the Cox regression model, and LASSO Cox regression analysis was performed to construct the prognostic model based on these genes according to the lambda value. Three N-linked glycosylation related genes were enrolled with p values less than 0.05 and HR value more than 1.5. The risk score was calculated with the following formula:  (C: coefficients, Y: gene expression level). According to the median of risk score, the patients were divided into high- and low-risk subgroups. To evaluate whether our model could exactly distinguish the features between high and low-risks subgroups, “Survival” “SurvMiner” “timeROC” packages were used. For the study of the validation model, a cohort of patients in GEO database was enrolled to verify the feasibility of prognostic model.
Independent Prognostic Analysis of the Risk Score
The clinical characteristics and the risk score were enrolled into the univariate and multivariable Cox regression analysis to evaluate the predictable value of the risk score we got using our model.
Functional Enrichment Analysis with the DEGs
Gene ontology (GO) functional enrichment analysis and Kyoto Encyclopedia of Genes and Genomes (KEGG) functional enrichment analysis were employed. DEGs between the high-risk group and the low-risk group were selected to be analyzed.
To understand the relationship between the N-linked glycosylation related genes and immune cells infiltration, ssGSEA was performed by R packages “GSVA” “Limma” “GSEABASE” “Reshape2” “GGpubr”, and the relationship between the DEGs and immune checkpoint genes was analyzed by R packages “Corrplot” and “ggExtra”.
Immunohistochemical (IHC) Staining
The IHC staining and analysis were performed as previously described. Briefly, the paraffin-tissue sections first were dewaxed with xylene twice for 30 minutes, re-hydrated with a concentration gradient of ethanol, followed as 100%, 90%, 80%, 70% and water, and subsequently subjected to boiling antigen retrieval buffer (EDTA 9.0) for 10 minutes. The slides were first blocked with 1% normal goat serum (NGS) for 30 minutes at room temperature, which were then incubated with primary antibodies against DDOST (Proteintech, Cat. no.14916-1-AP), STT3A (Proteintech, Cat. no. 12034-1-AP), TMEM165 (Proteintech, Cat. no. 20485-1-AP) and CD20 (Abcam, Cat. no. ab78237) in a humidified chamber overnight at 4 °C. After the incubation, the slides were first washed in PBS 3 times and then incubated with HRP conjugated secondary antibody (Dako, Cat. no. K5007) at 37 °C for 30 minutes. Next, the slides were then washed with PBS 3 times and incubated with DAB (Dako, Cat no. K5007). Finally, the slides were counterstained with hematoxylin for 5 minutes.
The images were captured by using a phase contrast microscope (Nikon, Japan) and were double-blindly assessed by two independent pathologists. The expression level of DDOST, STT3A and TMEM165 was scored by measuring the (IOD) by image J. The score of CD8 and CD20 intensity was defined as the proportion of positive cells in the total number of hematoxylin-positive cells.
Cell Culture
HuH7 cell lines were purchased from the American Type Culture Collection and MHCC-97H cell lines were purchased from Shanghai Zhongqiao Xinzhou Company. The cell lines were cultured in DMEM (GIBCO, Cat. no. C11995500BT) with 10% fetal bovine serum (GIBCO, Cat. no. 10270-106) and incubated with 5% CO2 at 37 °C.
RNA Extraction, RT-qPCR and siRNA Interference
Total RNA was extracted from cells or tissues using RNAiso Plus, according to the instructions. Reverse transcription was performed using HiScript® III All-in-one RT SuperMix Perfect for qPCR (Takara, Japan). qPCR was conducted using SYBR Premix Ex Taq II (Vazyme, Cat. no. R333-01) and performed on the LightCycler® 480 Real-Time PCR System (Roche Applied Science, Mannheim, Germany). β-Actin was used as a reference control, and the relative expression level of mRNA was calculated with 2−ΔΔCt methods.
Genes were silenced by siRNA in accordance with the manufacturer’s instructions. The sequences of siRNA used were as follows:
Negative control (Sense: 5′- GTCTTCATTTGTCGAGGAAAGGA-3′, Antisense: 5′- CTGGGTGAACTCCAAGGTG-3′);
siSTT3A (Sense: 5′- CUGUAAUGGUGCGUCUAAUTT-3′, Antisense: 5′- AUUAGACGCACCAUUACAGTT-3′);
siDDOST (Sense: 5′- GGGAAUUCCUCUAUGACAATT-3′, Antisense: 5′- UUGUCAUAGAGGAAUUCCCTT-3′).
siTMEM165 (Sense: 5′- GGUGAUCGCUCUCAACUAATT-3′, Antisense: 5′- UUAGUUGAGAGCGAUCACCTT-3′).
CCK8 Proliferation Assay
Cells transfected with siRNA for 2 days were seeded into a 96-well plate at a density of 1500 (Huh7) or 1000 (MHCC-97H) cells per well. CCK8 proliferation assay kits (YEASEN, Cat. no. 40203ES88) were used to detect the cell proliferation at different time points (day 0,1,2,3,4,5). The absorbance was measured on a TS Microplate Reader (TECAN, Switzerland) at a wavelength of 450 nm.
EdU Proliferation Assay
A total of 1.5×10⁴ huh7 cells or 1×10⁴ MHCC-97H cells transfected with siRNA for 72 hours were seeded into a 96-well plate. After 24 hours, as the normal cell growth cycle was restored, an appropriate EdU solution was added to the 96-well plate with the cells. After incubation for 2 hours, cells were fixed with 4% paraformaldehyde for 15 minutes, and the EdU incorporated into the DNA of cells was detected by fluorescent antibodies.
Colony Formation Assay
A total of 1.5×10³ huh7 cells or 1.5×10³ MHCC-97H cells transfected with siRNA for 48 hours were seeded into a 6-well plate culturing with complete growth medium. The culture medium was changed every 4 days. After 14 days, the cells were stained with 0.2% crystal violet after being fixed with 4% paraformaldehyde. The colony number was counted using AID GmbH.
Western Blotting
Total protein was extracted by using RIPA lysis buffer containing protease and phosphatase inhibitors. Protein concentration was determined using a BCA assay (Invitrogen, Cat. no. 23227). Total protein (40 µg/lane) was separated on a 10% gel and transferred onto a PVDF membrane (Merck Millipore, Cat.no. ISEQ00010). The membranes were blocked with 5% bovine serum albumin (BSA) at room temperature for 1 hour and incubated overnight at 4 °C with diluted primary antibodies. Then, the membranes were washed using TBS containing 0.1% Tween-20 three times and incubated with HRP-conjugated secondary antibodies for 1 h at room temperature. Finally, signals of proteins on the membrane were detected by ECL.β-Actin (CST, Cat.no 4970S 1:1000) which were used as a reference control.
Statistical Analyses
The Wilcoxon test was applied to compare the gene expression levels between the normal liver and HCC tissues and the immune infiltration levels between subgroups. The two-sided Log rank test was used to compare the OS between subgroups. Other statistical methods are specifically described above. All statistical analyses were accomplished with R (v4.0.5).
Results
DEGs Were Identified in Normal and Tumor Tissues to Classify HCC Patients
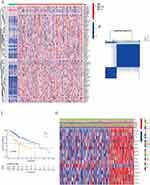
70 N-linked glycosylation related genes were enrolled from the AmiGO2 database (Table S2) and these genes have been reported to be involved in the N-linked glycosylation modification of proteins.12,16,17 Then the expression of these genes was obtained from the TCGA data and compared with 374 HCC tissues to the 50 normal tissues, and finally a total of 59 differentially expressed genes (DEGs) were ultimately identified. The threshold at fold change of 1.5 was used to define the up-regulated or down-regulated genes, with a p-value <0.05 of the fold-change being statistically significant. As shown in Figure 1A, the expression of DEGs was presented as a heatmap (red represented a high expression level; blue represented a low expression level). Among these DEGs, 4 genes were down-regulated, while 55 genes were up-regulated. Protein-Protein interaction analysis (PP1) was performed to explore the relationship between these N-linked glycosylation related DEGs (Figure S1A). In addition, we constructed a co-expression network of these differentially expressed genes (Figure S1B).
In order to further understand the relationship between N-linked glycosylation related genes and clinical characteristics, the consensus clustering analysis was performed. By increasing the cluster variable (k) from 2 to 10, we chose a classification coefficient of 2 (k = 2), which achieved the highest intra-group correlation and the lowest inter-group correlation (Figure 1B). Therefore, HCC patients were divided into 2 clusters and patients in cluster 2 showed shorter overall survival (OS) (Figure 1C). As shown on the heatmap, 15 N-linked glycosylation related genes were found to be differentially expressed in the 2 clusters. In addition, significant differences were found between the two clusters in clinical features including the degree of tumor differentiation and T stage, but no differences were found in age and gender (Figure 1D).
Construction of Risk Model Based on N-Linked Glycosylation Related DEGs in the TCGA Dataset
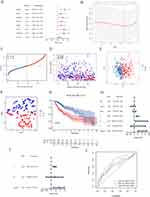
Univariate Cox regression was performed to screen the N-linked glycosylated genes related to survival, and 8 genes were enrolled for further analysis (DDOST GFPT1 MGAT4a MGAT5 PGM3 STT3A TMEM165 TUSC3). These 8 genes were highly associated with increased risk and HR >1 (Figure 2A). LASSO (Least absolute shrinkage and selection operator) Cox regression analysis was performed to construct the prognostic risk model (Figure 2B). The DDOST, STT3A and TMEM165 genes were recruited, and the risk score was calculated as follows: risk score = (0.191183173963103 * DDOST exp.) + (0.174577573840935* STT3A exp.) + (0.191131082938155* TMEM165 exp.). According to the risk model, the risk score of HCC patients in the TCGA database was calculated, and the cut-off value was set as the median of risk score. HCC patients were divided into high- and low-risk subgroups (Figure 2C). HCC patients of TCGA cohort found that the number of dead patients was more distributed as the risk score increased (Figure 2D). Principal component analysis (PCA) (Figure 2E) and T-SNE analysis (Figure 2F) were performed to test whether N-linked glycosylation related genes could effectively distinguish between high- and low-risk groups.
Furthermore, survival analysis showed significant difference in OS between the high- and low-risk groups (P<0.001), and patients in the high-risk subgroup presented shorter OS those that in the low-risk subgroup (Figure 2G). Univariate and multivariate Cox regression analysis were performed based on the survival status and survival time of HCC patients to determine whether the risk score could be an independent indicator to predict the prognosis of patients. In the TCGA cohort, it showed that tumor size (P < 0.001, HR = 1.664) and the risk score (P = 0.007, HR = 3.184) could be independent prognostic factors (Figure 2H and I). Finally, time-dependent receiver operating characteristic (ROC) was used to evaluate the specificity and sensitivity of the model, and the area under the ROC curve (AUC) was 0.725 for one year, 0.650 for three years, and 0.620 for five years, all of which had good feasibility (Figure 2J).
Validation of the Prognostic Model
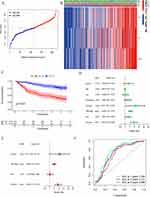
To verify the feasibility of the prognostic model, the clinical characteristics and RNA sequence data of 220 HCC patients were obtained from the GEO database (GSE14520). According to the risk score, 220 HCC patients were divided into high- and low-risk subgroups (Figure 3A). PCA (Figure S2A) and T-SNE analysis (Figure S2B) were also performed, which was satisfied with the effect of distinguishing the two groups based on our model. HCC patients of the GEO cohort also found that the number of dead patients was more distributed as the risk score increased (Figure S2C). As shown on the heatmap, grade, stage and survival status were diversely distributed in the high- and low-risk subgroups (Figure 3B).
Furthermore, survival analysis indicated that patients in the high-risk group presented shorter overall survivability than those in the low-risk group (P<0.001, Figure 3C). In the same way, univariate and multivariate Cox regression analysis were performed to determine whether the risk score could be an independent indicator to predict the prognosis of patients. In the GEO cohort, cirrhosis (P = 0.037, HR = 4.471), TNM stage (P < 0.001, HR = 1.966) and risk score (P < 0.001, HR = 3.487) could serve as independent indicators (Figure 3D and E). The AUC was 0.765, 0.717 and 0.686 corresponding to one, three and five years (Figure 3F), which verified the predictive ability of our model.
Correlation of the HCC Subgroups with Immune Infiltration
The underlying mechanism that the N-linked glycosylation related genes affected the prognosis of HCC patients was further detected. 173 DEGs were identified between the high- and low-risk groups in the TCGA cohort. Among these DEGs, 95 genes were down-regulated in the high-risk group and the other 78 genes were up-regulated (Table S3). Next, gene ontology (GO) enrichment analysis and Kyoto Encyclopaedia of Genes and Genomes (KEGG) pathway analysis were performed based on DEGs (Figure S3A and B). It showed that these DEGs were related to metabolic processes, such as steroid metabolic process, fatty acid metabolic process, glycolysis and some immune-associated signaling pathways like PPAR.
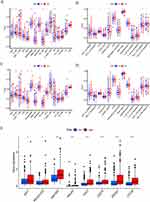
In order to explore the relationship between N-linked glycosylation related genes and immune states, ssGESA was performed to evaluate whether 16 types of immune cells and 13 types of immune-related functions were statistically different between the high- and low-risk subgroups. According to the immune cell score, patients in the low-risk subgroup in the TCGA dataset presented lower infiltration of regulatory T cells (Treg) and macrophages than those in the high-risk subgroup (Figure 4A). Nevertheless, the infiltration of NK cells and B cells was more enriched in the low-risk subgroup. Similar results were also found in the GEO cohort (Figure 4C). In addition, both TCGA and GEO suggested that the patients in the high-risk subgroup showed high activity of APC co-inhibition and MHC class-1 compared with the patients in the low-risk subgroup (Figure 4B–D). However, the immune state of type-1 IFN response is to the contrary. Interestingly, patients in the high-risk subgroup presented higher expression of immune checkpoints genes (CD274, PDCD1, CTLA4, HAVCR2, HHLA2, IDO1, PDCD1LG2, TIGIT) than those in the low-risk subgroup in the TCGA datasets (Figure 4E). Moreover, correlation analysis was performed between risk score and the expression levels of these 8 immune checkpoints. It showed that a high-risk score correlated with a high expression of these immune checkpoints (CD274 (R = 0.26), PDCD1 (R = 0.32), CTLA4 (R = 0.34), HAVCR2 (R = 0.44), HHLA2 (R = 0.36), IDO1 (R = 0.16), PDCD1LG2 (R = 0.18), TIGIT (R=0.32)) (Figure S4A–H).
Prognostic Models are Effective in Predicting Responses to Immunotherapy
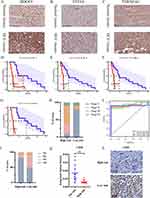
A cohort of 21 cases of HCC patients who received postoperative adjuvant PD-1/PD-L1 antibody treatment were recruited to validate the efficiency of our prognostic model. Immunohistochemistry studies demonstrated higher expressions of DDOST, STT3A and TMEM165 in HCC specimens than in normal tissues (Figure 5A–C), and the level of these three marker expressions related to the clinical stage and the progression free survival (PFS) of HCC patients (Figure S5A–S5C) (Figure 5D–F). According to the prognostic model, 21 cases of HCC patients were divided into high- and low-risk subgroups based on the IOD values of these three markers in the HCC tissues. Our results showed that the high-risk score correlated with poor progression free survival and a poor stage in HCC patients after receiving an adjuvant PD-1/PD-L1 antibody treatment, whereas patients with a low=risk score were associated with increased PFS after treatment with the PD-L1 antibody (Figure 5G and H). In addition, the AUC corresponded to one, two and three years, which verified the predictive ability of our model (Figure 5I). The low-risk subgroup has a higher percentage of immunotherapeutic response than the high-risk subgroup (Figure 5J). Furthermore, patients in the high-risk subgroup presented with a low infiltration of CD20+ B cell as predicted above, indicating that the high-risk score was associated with immunosuppression (Figure 5K and L). Overall, our results demonstrated for the first time that a high-risk score is associated with a poor immunotherapeutic response in HCC patients by our risk model based on N-linked glycosylation related genes.
Knockdown of STT3A, DDOST and TMEM165 Suppresses the Proliferation of HCC Cell Lines
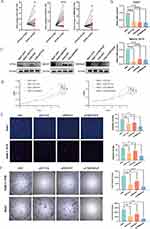
The expression of STT3A, DDOST and TMEM165 mRNA was tested by RT-qPCR in 22 pairs of matched HCC tissues and adjacent normal liver tissues (Figure 6A). The results showed the expression of the STT3A, DDOST and TMEM165 mRNA in HCC tissues was significantly up-regulated compared with paired normal liver tissues, and the difference was statistically significant. To precisely study the effect of these genes on liver cancer cells, Huh7 and MHCC-97H cell lines were chosen to establish the knockdown models through the siRNA. The knockdown efficiency of the three genes were verified by RT-qPCR and Western blotting (Figure 6B and C) with a demonstrated efficacy of over 70%. To explore the role of these genes in the proliferation of cells mentioned above, cell-counting kit-8 (CCK-8) assays were performed. The results showed that the silencing of each of the three genes inhibited the proliferation of HCC cells compared with the normal control (Figure 6D). This conclusion was also confirmed in EdU assays (Figure 6E). Clonal formation experiments demonstrated that the silencing of these genes significantly reduced the ability of proliferation from individual cells to communities (Figure 6F). It has been reported that STT3A et al play an important role in the N-linked glycosylation modification of proteins like PD-L1, but the role of STT3A, DDOST and TMEM165 in the proliferation of HCC cells is unknown.
The flow diagram of this study is shown in Figure 7.
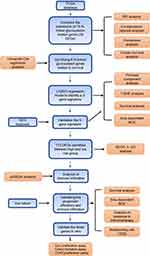 |
Figure 7 Flow diagram of this study. |
Discussion
In this study, we finally screened 59 DEGs (differentially expressed genes) out of 70 N-linked glycosylation related genes between HCC and normal tissues in TCGA datasets. There were significant differences in clinical characteristics, including grade and stage. Three DEGs (STT3A, DDOST and TMEM165) were recruited to construct a prognostic model through LASSO Cox regression analysis. The risk scores obtained through the prognostic model could serve as an independent prognostic factor in the TCGA dataset. In addition, it also suggests that the high-risk scores are associated with poor grading and late staging. In addition, our study showed that N-linked glycosylation related genes were also associated with immune cell infiltration and immune function activity. Furthermore, in order to verify the efficiency of our risk model, 21 HCC patients who received ICIs were enrolled, and IHC studies demonstrated that the expression of STT3A, DDOST and TMEM165 is high in tumor tissues and patients in the high-risk subgroup presented worse responses to ICIs.
Glycosylation is defined as an enzymatic process by which glycans, complex oligosaccharides, etc., bind to other molecules, especially proteins and lipids, by means of a glycosidic bond.18 It is the most diverse post-translational modification, with approximately 200 glycosyltransferases that determine which proteins are glycosylated, where glycans are located, and the structure of these glycans.19
In HCC, it has been reported that N-linked glycosylated CD44 promote the proliferation and invasion of tumor cells by increasing the stability of CD44.20 However, the clinical significance of N-linked glycosylation related genes in HCC patients remains unclear, especially in terms of prognosis and immune microenvironments. Therefore, our study constructed a prognostic model characterized by STT3A-DDOST-TMEM165, which can efficiently predict the overall survival of HCC patients and serve as an indicator on whether to receive ICIs. STT3A encodes a catalytic subunit of an oligosaccharide transferase (OST) complex, which is required for N-linked glycosylation of proteins. The increased STT3 family induced by epithelial-mesenchymal transition (EMT) can increase the expression and stability of PD-L1 protein in tumor stem-like cells of BT-549 cells, thereby promoting tumor cell immune escape.21 In our study, the model risk score was positively correlated with the expression of the immune checkpoint, especially PD-L1 (CD274), the patients in the high-risk subgroup exhibited higher levels of PD-L1 than those in the low-risk group. DDOST was first reported to help catalyze the transfer of high mannose-oligosaccharides across the endoplasmic reticulum to asparagine receptor sites in Asn-X-Ser/Thr consensus motif of the nascent polypeptide chain.22 DDOST is also an integral part of protein N-linked glycosylation in the endoplasmic reticulum. Zhuang et al found that DDOST overexpressing mice increased accumulation of hepatic AGE (advanced glycation end-products), leading to central obesity, deficient insulin secretion, and conversion to the use of ketoacids and fat to supply energy, followed by liver glycogen accumulation and liver enlargement, hepatic ER and oxidative stress.23 In addition, Shapanis et al found that increased expression of DDOST was associated with a shortened time to metastasis in cutaneous squamous cell carcinoma and poor prognosis in cervical and oropharyngeal cancer.24 TMEM165 belongs to the secondary ion transporter family, transporting calcium and manganese ions for the cell, which are indispensable raw materials for intracellular glycosylation. The mutation of TMEM165 is also closely related to the occurrence of congenital disorders of glycosylation.25,26 Moreover, Lee et al verified in vitro that TMEM165 knockdown effectively reduced the invasive activity of MMP-2 dependent HCC.27 Overall, three genes (STT3A, DDOST, and TMEM165) in our prognostic model were identified as contributing factors to poor prognosis, and the risk score performed by the univariate and multivariate Cox regression in both TCGA cohort and GEO cohort could serve as an independent factor of prognosis.
The risk model based on N-linked glycosylation related genes was significantly related to the immune microenvironment. Patients in the high-risk subgroup showed a high infiltration of immunosuppressive cells and activation of the suppressive immune pathway. For example, compared to the low-risk group, we found that the high-risk group had a higher expression of immunosuppressive cells such as Tregs, and a higher expression in APC co-inhibition, but lower cytolytic activity, suggesting that N-linked glycosylation of proteins may be related to the tumor immunosuppressive environment. Further analysis showed patients in the high risk subgroup presented a high expression of immune checkpoint genes, especially PD-L1 and CTLA4. Surprisingly, combined with the double validation of TCGA and GEO, the infiltration of Tregs in the high-risk subgroup patients was higher than that in the low-risk subgroup. Tregs are generally considered to be key immune regulatory cells that inhibit immune response, promote immune escape and cause poor prognosis of HCC.28–30 In addition, the positive correlation between risk score and various immune checkpoint genes, including PD-L1 and CTLA4, suggested that the N-linked glycosylated genes may be involved in tumor immune escape. Therefore, our prognosis model based on N-linked glycosylated genes could not only predict the prognosis of HCC patients, but also reflect the immune microenvironment, providing a theoretical basis for the application of immunotherapy.
Overall, our study proved that N-linked glycosylation is closely related to the prognosis of HCC patients and in vitro functional experiments have proved that the three genes (STT3A, DDOST, and TMEM165) play an important role in proliferation of HCC cells. The three genes (STT3A, DDOST, and TMEM165) involved in constructing the model play a significant role in the immunosuppressive microenvironment of HCC patients, especially the infiltration of Tregs and the expression of immune checkpoints genes. Therefore, we constructed a novel prognostic model based on the N-linked glycosylated genes, that could efficiently predict the prognosis of HCC patients, and could serve as an indicator of the application of ICIs.
Data Sharing Statement
Seventy N-linked glycosylation related genes were retrieved from the AmiGO2 database (http://amigo.geneontology.org/amigo).
The datasets generated and analyzed during the current study are available (https://portal.gdc.cancer.gov/) on February 12, 2022. A cohort of HCC patients with RNA-sequence and clinical features were download from GEO database on January 22, 2009, and the last follow-up update was on October 6, 2021 (https://www.ncbi.nlm.nih.gov/geo, ID: GSE14520).
Ethics Approval
The studies involving human participants were obtained and approved by the ethics committee of Sun Yat-Sen Memorial Hospital, Sun Yat-Sen University (Protocol Code: SYSEC-KY-KS-2022-134). The authors confirm that all methods were carried out in accordance with relevant guidelines and regulations. The authors confirm that all experimental protocols were approved by the ethics committee of Sun Yat-Sen Memorial Hospital, Sun Yat-Sen University. The study was completed in accordance with the Declaration of Helsinki.
Consent to Participate
The subjects of this study were the clinical data of patients with hepatocellular carcinoma in Sun Yat-sen Memorial Hospital of Sun Yat-sen University from January 2018 to December 2021. Since the nature of study is retrospective, Ethics committees of Sun Yat-Sen Memorial Hospital, Sun Yat-Sen University has waived informed consent for the study.
Acknowledgments
We would like to acknowledge the TCGA, GEO, and AmiGO2 networks for providing relevant data.
Author Contributions
All authors made a significant contribution to the work reported, whether that is in the conception, study design, execution, acquisition of data, analysis and interpretation, or in all these areas; took part in drafting, revising or critically reviewing the article; gave final approval of the version to be published; have agreed on the journal to which the article has been submitted; and agree to be accountable for all aspects of the work.
Funding
This work was supported by the Special Research Foundation of the National Nature Science Foundation of China (82273476, 81972262), the Guangdong Basic and Applied Basic Research Foundation (2023A1515010188); Guangzhou Science and Technology Foundation(SL2022A03J0113); Grant [2013]163 from Key Laboratory of Malignant Tumor Molecular Mechanism and Translational Medicine of Guangzhou Bureau of Science and Information Technology; Grant KLB09001 from the Key Laboratory of Malignant Tumor Gene Regulation and Target Therapy of Guangdong Higher Education Institutes; Grant from Guangdong Science and Technology Department (2015B050501004, 2017B030314026).
Disclosure
The authors declare that they have no conflicts of interest in this work.
References
1. Petrick JL, Braunlin M, Laversanne M, et al. International trends in liver cancer incidence, overall and by histologic subtype, 1978–2007. Int J Cancer. 2016;139(7):1534–1545. doi:10.1002/ijc.30211
2. Killock D. Immunotherapy: nivolumab keeps HCC in check and opens avenues for checkmate. Nat Rev Clin Oncol. 2017;14(7):392. doi:10.1038/nrclinonc.2017.70
3. Schwarz F, Aebi M. Mechanisms and principles of N-linked protein glycosylation. Curr Opin Struct Biol. 2011;21(5):576–582. doi:10.1016/j.sbi.2011.08.005
4. Helenius A, Aebi M. Roles of N-linked glycans in the endoplasmic reticulum. Annu Rev Biochem. 2004;73(1):1019–1049. doi:10.1146/annurev.biochem.73.011303.073752
5. Fuster MM, Esko JD. The sweet and sour of cancer: glycans as novel therapeutic targets. Nat Rev Cancer. 2005;5(7):526–542. doi:10.1038/nrc1649
6. Hakomori S. Glycosylation defining cancer malignancy: new wine in an old bottle. Proc Natl Acad Sci U S A. 2002;99(16):10231–10233. doi:10.1073/pnas.172380699
7. Chandler KB, Costello CE, Rahimi N. Glycosylation in the tumor microenvironment: implications for tumor angiogenesis and metastasis. Cells. 2019;8(6):544.
8. Laubli H, Borsig L. Altered cell adhesion and glycosylation promote cancer immune suppression and metastasis. Front Immunol. 2019;10:2120. doi:10.3389/fimmu.2019.02120
9. Li CW, Lim S-O, Chung EM, et al. Eradication of triple-negative breast cancer cells by targeting glycosylated PD-L1. Cancer Cell. 2018;33(2):187–201 e10. doi:10.1016/j.ccell.2018.01.009
10. Pinho SS, Reis CA. Glycosylation in cancer: mechanisms and clinical implications. Nat Rev Cancer. 2015;15(9):540–555. doi:10.1038/nrc3982
11. Li CW, Lim S-O, Xia W, et al. Glycosylation and stabilization of programmed death ligand-1 suppresses T-cell activity. Nat Commun. 2016;7(1):12632. doi:10.1038/ncomms12632
12. Cherepanova N, Shrimal S, Gilmore R. N-linked glycosylation and homeostasis of the endoplasmic reticulum. Curr Opin Cell Biol. 2016;41:57–65. doi:10.1016/j.ceb.2016.03.021
13. Verheijen J, Tahata S, Kozicz T, et al. Therapeutic approaches in Congenital Disorders of Glycosylation (CDG) involving N-linked glycosylation: an update. Genet Med. 2020;22(2):268–279. doi:10.1038/s41436-019-0647-2
14. Breitling J, Aebi M. N-linked protein glycosylation in the endoplasmic reticulum. Cold Spring Harb Perspect Biol. 2013;5(8):a013359. doi:10.1101/cshperspect.a013359
15. Sha S, Agarabi C, Brorson K, et al. N-glycosylation design and control of therapeutic monoclonal antibodies. Trends Biotechnol. 2016;34(10):835–846. doi:10.1016/j.tibtech.2016.02.013
16. Morelle W, Potelle S, Witters P, et al. Galactose supplementation in patients with TMEM165-CDG rescues the glycosylation defects. J Clin Endocrinol Metab. 2017;102(4):1375–1386. doi:10.1210/jc.2016-3443
17. Sparks SE, Krasnewich DM. Congenital Disorders of N-Linked Glycosylation and Multiple Pathway Overview, in GeneReviews((R)). Adam MP Editors. Seattle (WA); 1993.
18. Dalziel M, Crispin M, Scanlan CN, et al. Emerging principles for the therapeutic exploitation of glycosylation. Science. 2014;343(6166):1235681. doi:10.1126/science.1235681
19. Schjoldager KT, Narimatsu Y, Joshi HJ, et al. Global view of human protein glycosylation pathways and functions. Nat Rev Mol Cell Biol. 2020;21(12):729–749. doi:10.1038/s41580-020-00294-x
20. Hou HL, Ge C, Sun H, et al. Tunicamycin inhibits cell proliferation and migration in hepatocellular carcinoma through suppression of CD 44s and the ERK 1/2 pathway. Cancer Sci. 2018;109(4):1088–1100. doi:10.1111/cas.13518
21. Hsu JM, Xia W, Hsu Y-H, et al. STT3-dependent PD-L1 accumulation on cancer stem cells promotes immune evasion. Nat Commun. 2018;9(1):1908. doi:10.1038/s41467-018-04313-6
22. Yamagata T, Tsuru T, Momoi MY, et al. Genome organization of human 48-kDa oligosaccharyltransferase (DDOST). Genomics. 1997;45(3):535–540. doi:10.1006/geno.1997.4966
23. Zhuang A, Yap FY, Bruce C, et al. Increased liver AGEs induce hepatic injury mediated through an OST48 pathway. Sci Rep. 2017;7(1):12292. doi:10.1038/s41598-017-12548-4
24. Shapanis A, Lai C, Smith S, et al. Identification of proteins associated with development of metastasis from cutaneous squamous cell carcinomas (cSCCs) via proteomic analysis of primary cSCCs. Br J Dermatol. 2021;184(4):709–721. doi:10.1111/bjd.19485
25. Foulquier F, Amyere M, Jaeken J, et al. TMEM165 deficiency causes a congenital disorder of glycosylation. Am J Hum Genet. 2012;91(1):15–26. doi:10.1016/j.ajhg.2012.05.002
26. Stribny J, Thines L, Deschamps A, et al. The human Golgi protein TMEM165 transports calcium and manganese in yeast and bacterial cells. J Biol Chem. 2020;295(12):3865–3874. doi:10.1074/jbc.RA119.012249
27. Lee JS, Kim M-Y, Park E-R, et al. TMEM165, a Golgi transmembrane protein, is a novel marker for hepatocellular carcinoma and its depletion impairs invasion activity. Oncol Rep. 2018;40(3):1297–1306. doi:10.3892/or.2018.6565
28. Wang Z, He L, Li W, et al. GDF15 induces immunosuppression via CD48 on regulatory T cells in hepatocellular carcinoma. J Immunother Cancer. 2021;9(9):e002787.
29. Zhang C, Gao Y, Du C, et al. Hepatitis B-induced IL8 promotes hepatocellular carcinoma venous metastasis and intrahepatic treg accumulation. Cancer Res. 2021;81(9):2386–2398. doi:10.1158/0008-5472.CAN-20-3453
30. Gao Y, You M, Fu J, et al. Intratumoral stem-like CCR4+ regulatory T cells orchestrate the immunosuppressive microenvironment in HCC associated with hepatitis B. J Hepatol. 2022;76(1):148–159. doi:10.1016/j.jhep.2021.08.029
 © 2023 The Author(s). This work is published and licensed by Dove Medical Press Limited. The full terms of this license are available at https://www.dovepress.com/terms.php and incorporate the Creative Commons Attribution - Non Commercial (unported, v3.0) License.
By accessing the work you hereby accept the Terms. Non-commercial uses of the work are permitted without any further permission from Dove Medical Press Limited, provided the work is properly attributed. For permission for commercial use of this work, please see paragraphs 4.2 and 5 of our Terms.

