Back to Journals » International Journal of General Medicine » Volume 17
Identification of a Novel Gene Expression Signature Associated with Amino Acid Metabolism (AAM) in Ankylosing Spondylitis (AS)
Received 9 November 2023
Accepted for publication 28 January 2024
Published 19 February 2024 Volume 2024:17 Pages 597—609
DOI https://doi.org/10.2147/IJGM.S435650
Checked for plagiarism Yes
Review by Single anonymous peer review
Peer reviewer comments 2
Editor who approved publication: Dr Woon-Man Kung
Hao Liu,* Yinxiao Peng*
Department of Orthopedics, The Third People’s Hospital of Chengdu, Southwest Jiaotong University, Chengdu, Sichuan, People’s Republic of China
*These authors contributed equally to this work
Correspondence: Hao Liu, Email [email protected]
Background: Studies have proven that amino acid metabolism (AAM) plays an important role in ankylosing spondylitis (AS). Therefore, this study identified key AAM-related genes (AAMRGs) for the diagnosis and prediction of AS.
Methods: Firstly, the differentially expressed genes (DEGs) were identified between AS and normal groups in the GSE25101 and GSE73754 datasets downloaded from the Gene Expression Omnibus (GEO) database, and they were intersected to get common DEGs (Co-DEGs). Weighted Gene Co-expression Network Analysis (WGCNA) was used to identify AS and AAM score-related genes (AS-AAMSRGs). Then, AAM related DEGs (AAMR DEGs) were acquired by intersection of Co-DEGs and AS-AAMSRGs. Moreover, the least absolute shrinkage and selection operator (LASSO) was implemented on AAMR DEGs to identify diagnostic genes, and Gene Set Enrichment Analysis (GSEA) was used to explore the functional pathways of diagnostic genes. By screening differential immune cells, the correlation between differential immune cells and diagnostic genes was further analyzed. Finally, miRNA-mRNA networks were constructed and drug prediction analysis was performed.
Results: By overlapping to obtain three AAMR DEGs (TP53INP1, TUBB and RBM47). The results of nomogram and decision curve analysis (DCA) suggested that three AAMR DEGs had diagnostic value for AS and significantly enriched to neutrophil activation, neutrophil degranulation. The proportion of eight kinds of immune cells in AS and normal groups was significantly different, such as activated dendritic cell, CD56 bright natural killer cell, effector memory CD4 T cell. In the miRNA-mRNA regulatory networks, three miRNAs (has-miR-429, has-miR-200c-3p, has-miR-200b-3p) could regulate TP53INP1 and TUBB. There was only one miRNA (has-miR-122-5p) could regulate RBM47. Finally, 51 target drugs (such as colchicine, vinblastine, vincristine) were associated with TUBB.
Conclusion: TP53INP1, TUBB and RBM47 might play key roles in AS and could be used as potential biomarkers of AS.
Keywords: ankylosing spondylitis, amino acid metabolism, biomarkers, diagnostic model
Introduction
Spinal arthropathy (SpA) is a heterogeneous immune mediated chronic inflammatory disease that mainly affects axial bones. It was divided into axial spinal arthritis (axSpA) and peripheral spinal arthritis (pSpA) based on the location of the disease.1,2 Ankylosing spondylitis (AS) is the most common type of axSpA, which can lead to the development of spinal rigidity and irreversible structural damage.3 At present, our measures to identify AS are still limited to clinical features, including imaging (radiology, computed tomography (CT), and magnetic resonance imaging (MRI)), HLA-B27, and C-reactive protein (CRP), as the main indicators for its clinical diagnosis.1,4 However, even with modern diagnostic methods, the diagnostic sensitivity and specificity of AS are not higher than about 80%.5 Therefore, people eagerly look forward to more highly sensitive and specific methods to find more accurate biomarkers for the diagnosis of AS.
According to the researches, amino acid metabolism plays an important role in AS, especially the level of tryptophan, which is one of the indicators of disease progression in AS patients. Berlinberg et al found that the microbiome metabolizes tryptophan into indole-3-acetate (IAA) and indole-3-acetate (I3Ald), which played an important role in the axSpA epithelial barrier and immune cell function through a joint analysis of multiple omics.6 Meanwhile, the pro-inflammatory cytokine interferon-γ could inducing enzyme indoleamine 2,3-dioxygenase (IDO) to convert tryptophan into kynurine.7 Eryavuz Onmaz et al also demonstrated that pro-inflammatory cytokines can affect the expression of various kynurine pathway enzymes, leading to metabolic changes, affecting inflammatory response and immunity. They also used the Kynurine/Tryptophan ratio as a diagnostic marker for AS.8 In addition, Gao et al also found that the levels of urea, proline, and phenylalanine in the serum of AS patients were significantly increased.7 According to reports, the immune effects that occurred in collagen tissue may lead to excessive breakdown of collagen components, thereby increasing the circulating proline in the blood.9 It is also worth noticing that HLA-B27 molecules have been proven to be rich in proline,10 and the HLA-B27 positivity has been widely used in clinical practice to identify SpA.11,12 What’s more, unpaired cysteine residues in HLA antigens can be directly or indirectly modified by homocysteine and then subsequently disrupted by abnormal autoimmune reactions, which is also considered a mechanism of AS associated with HLA-B27.13 These studies have all pointed out the important role of amino acid metabolism in AS. However, it is currently unclear how amino acid metabolism regulates the progression of AS and what role amino acid metabolism-related genes (AAMRGs) play in it.
In this study, we utilized the public database data related to AS and the bio-informatics analysis methods to explore the amino acid metabolism-related genes with diagnostic value for AS, providing a theoretical basis for further revealing the pathogenesis of AS and deepening our understanding of AS.
Materials and Methods
Data Sources
AS-related datasets (GSE25101, GSE73754, and GSE18781) were downloaded from the Gene Expression Omnibus (GEO) database (https://www.ncbi.nlm.nih.gov/). The samples of these datasets are whole blood samples. The GSE25101 dataset consists of 16 normal and 16 AS samples. The GSE73754 dataset includes 20 normal samples and 52 AS samples. The GSE18781 dataset contains 18 AS and 25 normal samples and it was used as external validation set. In addition, 374 amino acid metabolism-related genes (AAMRGs) were downloaded from reaction metabolism of amino acid derivatives of Molecular Signature Database (MSigDB) (http://www.broad.mit.edu/gsea/msigdb/).
Identification of Differential Expression Genes (DEGs) Between Normal and AS Groups
Differential analysis was performed on AS and normal groups in the GSE25101 and GSE73754 datasets using the “limma” R package (version 3.46.0), respectively.14 The screening conditions for DEGs were P < 0.05 and |log2FC| > 0.5. The DEGs of the GSE25101 and GSE73754 datasets were noted as DEGs1 and DEGs2, separately. To understand the distribution of DEGs overall, the volcano map and the heat map of up- and down-regulated DEGs were plotted by “ggplot2” R package (version 3.3.6) and “pheatmap” R package, respectively. The intersection of the DRGs1 with the DEGs2 was taken to acquire common DEGs (Co-DEGs) via Veen tool.
Identification of Amino Acid Metabolism-Related DEGs (AAMR DEGs)
Firstly, based on AAMRGs, amino acid metabolism scores were calculated for all samples of the GSE25101 dataset by single sample gene set enrichment analysis (ssGSEA). Then, weighted gene co-expression network analysis (WGCNA) was used to identify AS and amino acid metabolism score-related genes (AS-AAMSRGs).15 The samples were clustered to remove outliers. And in order to build a scale-free network, the determination of the optimal soft threshold (β) was performed. Thereafter, the adjacency matrix was established and converted to a topological overlap matrix (TOM), and the gene dendrogram and module color were established using the degree of dissimilarity. Correlations between modules and traits (AS, normal and amino acid metabolism score) were then calculated. The modules that met both |cor| > 0.4 and P < 0.05 were selected for subsequent analysis. Next, AAMR DEGs were obtained through the intersection of co-DEGs and AS-AAMSRGs. Finally, we adopted GeneMANIA (http://genemania.org/) to construct the network of AAMR DEGs interactive proteins based on physical interactions, co-expression, predicted, co-localization, pathway, genetic interactions, and shared protein domains.16
Identification of Biomarkers
Firstly, LASSO was utilized to identified the biomarkers. Then, the diagnostic value of the LASSO model were analyzed via receiver operating characteristic (ROC) curves in GSE25101, GSE73754, and GSE18781 using the “pROC” R package.17
Creation of a Nomogram
The nomogram was created via “Rms” R package to demonstrate the efficacy of biomarkers for the discrimination of AS. To verify the accuracy of the nomogram, the corresponding calibration curve, clinical impact curve, and decision curve analysis (DCA) were plotted.
Gene Set Enrichment Analysis (GSEA)
The samples of the GSE25101 were sorted into high and low expressed groups according to the median value of the expression of each biomarker, and differential analysis was done. All genes were ranked via log fold change (logFC). The GSEA were performed with |NES| > 1, P < 0.05, and FDR < 0.25.
Immune Analysis
The ssGSEA algorithm was employed to compute the infiltration abundance of 28 immune cells in AS and normal groups in the GSE25101.18 Differences between AS and normal groups were assessed by Wilcox test. Moreover, the relevance of biomarkers with differential immune cells were analyzed by Spearman algorithm.
Created of a miRNA-mRNA Network
To investigate the mechanisms involved in biomarkers in AS, we created a miRNA-mRNA network. Firstly, we used Mirwalk database (http://mirwalk.umm.uni-heidelberg.de/), TargetScan database (http://www.targetscan.org/vert71/) and miRTarBase (http://mirtarbase.mbc.nctu.edu.tw/index.html) to predict miRNAs that might regulate biomarkers. Then, the miRNAs obtained via the three databases were taken to intersect to obtain the common miRNAs. Finally, Cytoscape software was employed to visualize the miRNA-mRNA network (version 3.7.1).19
Drug Prediction of Diagnostic Genes
Finally, each biomarker was used as a key word to search for drugs associated with AS in Drug-Gene Interaction Database (DGIdb, https://dgidb.genome.wustl). Afterward, the network diagram of interactions between each biomarker and its corresponding medicines was created via Cytoscape software (version 3.7.1).19
Expression Profiles of Biomarkers in Public Datasets
To further demonstrate the reliability of the results, we evaluated the expression of biomarkers between AS and normal groups in the GSE25101, GSE73754, and GSE18781.
Sample Collection and Real Time Quantitative-Polymerase Chain Reaction (RT-qPCR)
In our study, the blood samples of 5 AS patients (the disease group) and 5 healthy individuals (the control group) at the Third People’s Hospital of Chengdu, between February 2021 and February 2022, were collected. The study was approved by the Ethics Committee of the Third People’s Hospital of Chengdu and the IRB reference number was [2019]S-103.
The RNA was extracted by TRIzol (Ambion, Austin, USA) in accordance with the instructions provided by the manufacturer. The 2xUniversal Blue SYBR Green qPCR Master Mix (Servicebio, Wuhan, China) was employed for RT-qPCR. The internal reference gene was GAPDH. The 2−ΔΔCt method was applied to compute the expression of biomarkers20 (Supplementary Tables 1–3).
Results
There Were 3 Co-DEGs Between AS and Normal Groups
There were 115 DEGs (64 up-regulation genes and 51 down-regulation genes) between AS and normal groups in GSE25101 (Figure 1A and B). Similarly, 176 DEGs contained 74 up-regulation genes and 102 down-regulation genes in DEGs2 (Figure 1C and D). 3 Co-DEGs were obtained through the intersection of DEGs1 and DEGs2 (Figure 1E).
 |
Figure 1 Identification of Co-differentially expressed genes (DEGs) between ankylosing spondylitis (AS) and normal groups. (A and B) Volcano plot for DEGs ((A) GSE25101 (B) GSE73754). (C and D) Heatmap of DEGs ((C) GSE25101 (D) GSE73754). (E) Venn diagram of amino acid metabolism related genes (AAMRGs) up-regulated and AAMRGs down-regulated. |
Acquisition of AAMR DEGs Between AS and Normal Groups
There were no outliers in GSE25101 (Figure 2A). With regard to the WGCNA parameter setting, β was 9, and 25 modules were identified (Figure 2B and C). The yellow module was markedly relevant to AS and amino acid metabolism score (Figure 2D). And 8401 AS-AAMSRGs were obtained. Subsequently, there were 3 AAMR DEGs that were obtained by the intersection of Co-DEGs and AS-AAMSRGs, namely TP53INP1, RBM47, TUBB (Figure 2E). To explore the genes interactions of three AAMR DEGs, the gene–gene interaction network of AAMR DEGs was created (Figure 2F), and these genes demonstrated a complex interaction network.
 |
Figure 2 Acquisition of AAMR DEGs between AS and normal groups. (A) Sample clustering to detect outliers in GSE25101.(B) Soft threshold estimation for scale-free corepresentation networks. (C) All differences AAMRGs cluster. (D) Correlation between each module in the AS or Normal Groups.(E) Differentially expressed genes and modular genes. (F) miRNA-hub gene Network. |
There Were 3 Biomarkers
Furthermore, there were 3 biomarkers via LASSO algorithm. Moreover, the AUC of the LASSO model were all greater than 0.7, suggesting that the 3 biomarkers had diagnostic value for AS (Figure 3A–C). A nomogram including 3 biomarkers was created (Figure 3D). The adjusted C-index was 0.875 (Figure 3E). The DCA curve suggested the nomogram had a higher net benefit (Figure 3F). The clinical impact curve revealed that the “number high risk” curve was nearly identical to the “number high risk with event” curve when the high-risk threshold was between 0.6 and 1.0 (Figure 3G). These results demonstrated that the nomogram had high a predictive accuracy for the AS progression.
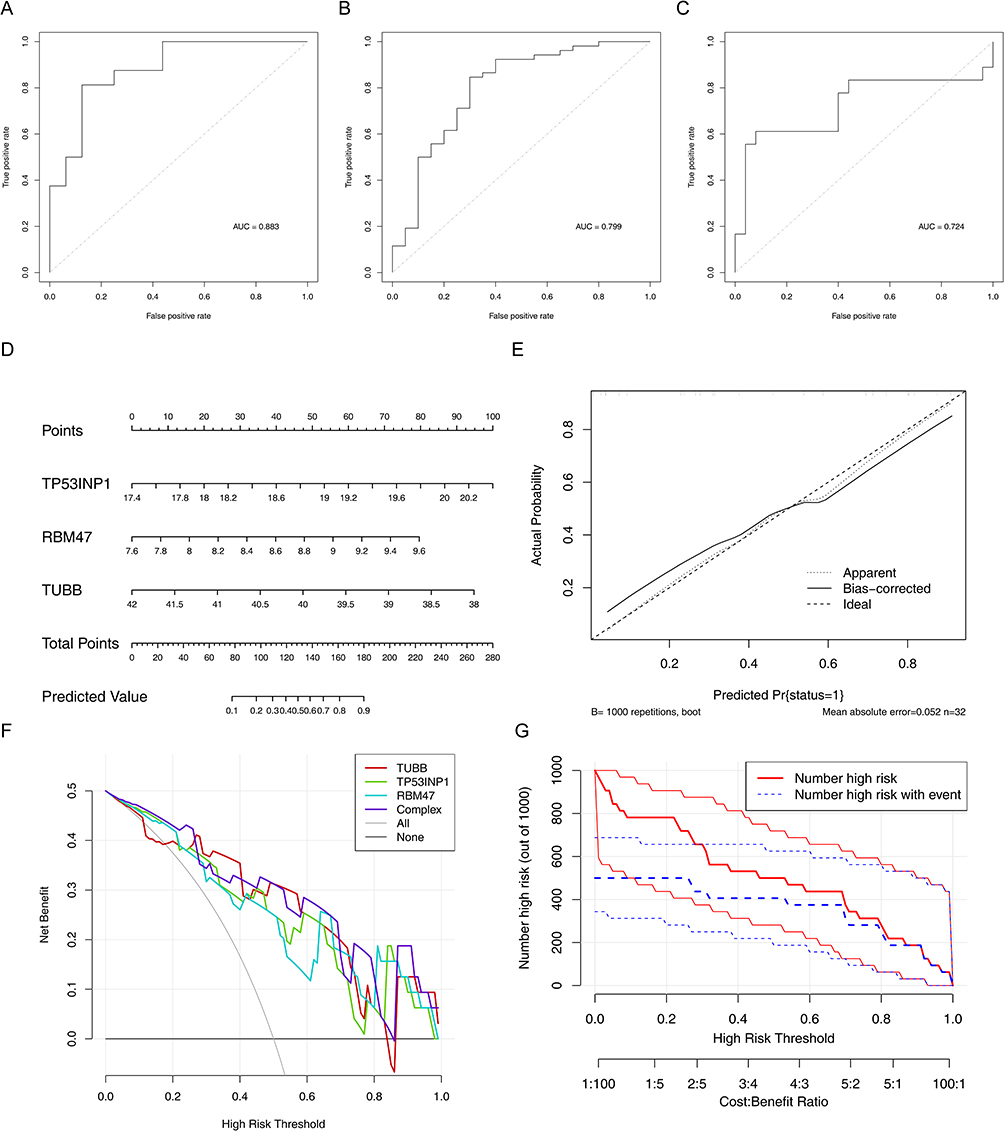 |
Figure 3 Identification of biomarkers. (A–C) Receiver operating characteristic (ROC) for the 3 AAMR DEGs ((A) GSE25101, (B) GSE73754, (C) GSE18781). (D) Nomogram based on characteristic genes. (E) Calibration curve. (F) Decision curve analysis (DCA) curve. (G) Clinical impact curve. |
Enrichment Analysis of Biomarkers
To explore potential biological mechanisms associated with biomarkers, we performed GSEA. RBM47 was enriched to 2097 GO terms and 73 KEGG pathways (Figure 4A and B), such as neutrophil activation, neutrophil activation involved in immune response, chemokine signaling pathway. There were 1622 GO terms and 73 KEGG pathways for TP53INP1 (Figure 4C and D), for instance, neutrophil degranulation, neutrophil mediated immunity, growth hormone synthesis, secretion and action. And TUPP was enriched to 914 GO terms and 84 KEGG pathways (Figure 4E and F), such as cotranslational protein targeting to membrane, ribosome.
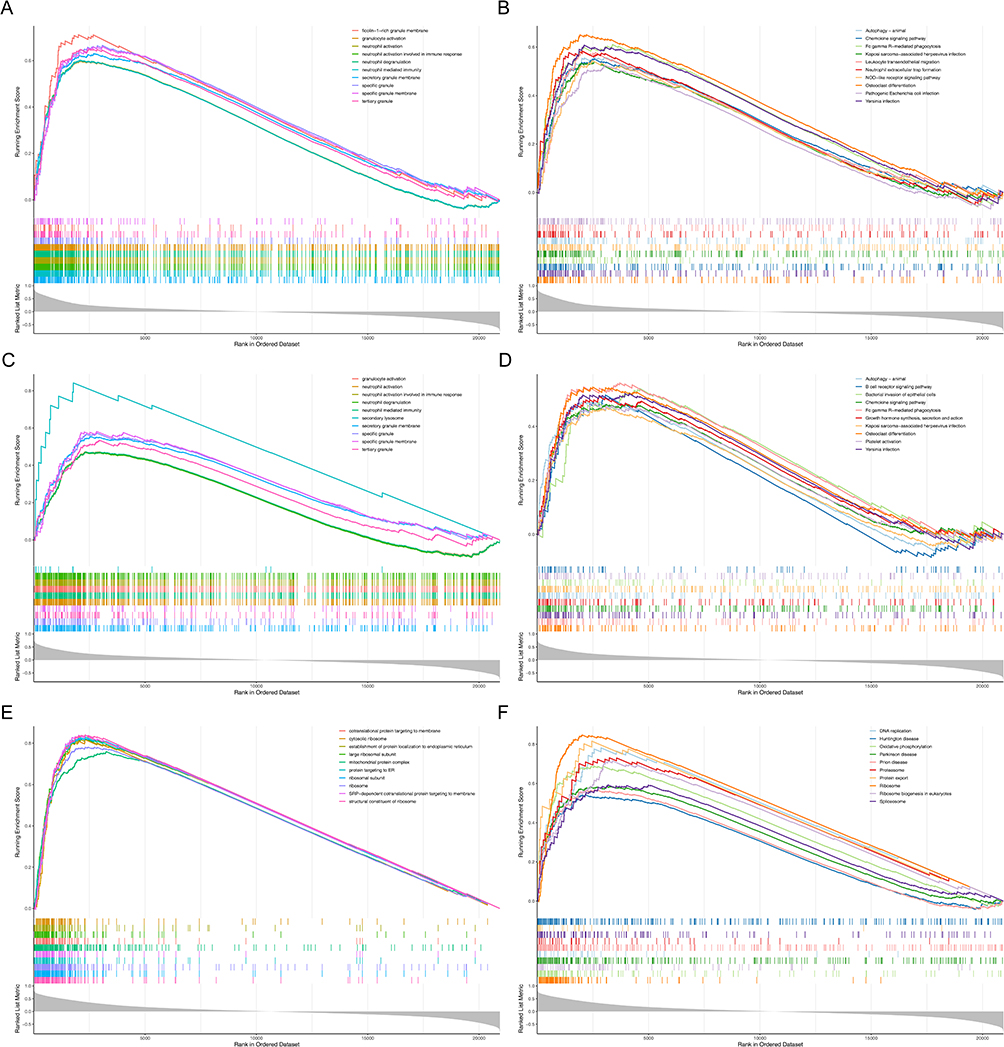 |
Figure 4 Gene set enrichment analysis (GSEA) of three biomarkers. (A and B) RBM47 (C and D) TP53INP1 (E and F) TUBB. (A, C and E) Gene Ontology (GO). (B, D and F) Kyoto Encyclopedia of Genes and Genomes (KEGG). |
Immuno-Infiltration Analysis Between AS and Normal Groups
In total, the infiltration abundance of 8 immune cells between AS and normal groups was considerably different, namely CD56 bright natural killer cell, activated dendritic cell, effector memory CD4 T cell, etc. (Figure 5A). The correlation analysis revealed that TP53INP1 and RBM47 were significantly positively correlated with gamma delta T cell, effector memory CD4 T cells, and type 17 T helper cell (Figure 5B). TP53INP1 and RBM47 were negatively relevant to natural killer T cell and effector memory CD8 T cell, and RBM47 was also negatively related to MDSC (Figure 5B). The relevance of TUBB to effector memory CD8 T cells, natural killer T cell, and MDSC was positive, and the relevance TUBB to activated dendritic cell, type 17 T helper cell, gamma delta T cell, and effector memory CD4 T cell was opposite (Figure 5B). Interestingly, none of the three biomarkers relevant to CD56 bright natural killer cell (Figure 5B).
 |
Figure 5 Immuno-infiltration analysis between AS and normal groups. (A) Differences of immune cells between AS and normal groups were analyzed by Wilcox. Test and the boxplot. (B) Heatmap of correlations of diagnostic genes with differential immune cells. *P < 0.05, **P < 0.01, ***P < 0.001. Abbreviation: ns, not significant. |
The miRNA-mRNA Networks
In total, 27 miRNAs were obtained by prediction. The miRNA-mRNA network was created (Figure 6). In the miRNA-mRNA regulatory networks, the 3 miRNAs (has-miR-429, has-miR-200b-3p, has-miR-200c-3p) could regulate TP53INP1 and TUBB. There was only 1 miRNA (has-miR-122-5p) could regulate RBM47.
 |
Figure 6 The miRNA-mRNA regulatory networks. |
Biomarker-Based Potential Drug Prediction
We constructed a drug–gene interaction network from the DGIdb. The results showed that 51 target drugs were related to TUBB (Figure 7), such as colchicine, vinblastine, vincristine.
 |
Figure 7 The drug–gene interaction network from the DGIdb. |
The Verification of Biomarkers
In all public datasets, there were considerably different in expression of all biomarkers between AS and normal groups (Figure 8A–C). TP53INP1 and RBM47 were highly expressed and TUBB was lowly expressed in the AS group in GSE25101, GSE73754 and GSE18781. Additionally, to further validate the expression of biomarkers, we performed RT-qPCR. The results revealed that RBM47 and TP53INP1 were considerably highly expressed in the disease group (Figure 8D and E), and the expression trends were in line with other findings based on open-access datasets. However, the expression trend of TUBB was opposite to that of public databases, possibly due to heterogeneity of the samples, as well as variations in the experimental design (Figure 8F).
 |
Figure 8 Expression profiles of diagnostic genes in external validation datasets ((A) GSE25101, (B) GSE73754, (C) GSE18781). The expression of three biomarkers by RT-qPCR ((D) RBM47, (E) TP53INP1, (F) TUBB). *P < 0.05, **P < 0.01, ***P < 0.001, ****P < 0.0001. Abbreviation: ns, not significant. |
Discussion
Amino acid metabolism has been shown to play an important role in the AS process, which may be related to inflammatory reactions and immunity,8 but the specific pathways and mechanisms of action were still unclear. In this study, we obtained three AS diagnostic genes related amino acid metabolism, RBM47, TP53INP1 and TUBB, and they were involved in oxidative phosphorylation, osteoclast differentiation, and a variety of immune or inflammatory related signaling pathways, such as B cell receptor signaling pathway, T cell receptor signaling pathway, chemokine signaling pathway, and neutrophil activation, and etc.
Oxidative phosphorylation could regulate cellular processes, affect intracellular metabolic reactions, and promote the normal resolution of inflammatory reactions, through affecting protein activity. Recent studies by Najafzadeh and Lari have shown significant enrichment of the oxidative phosphorylation pathway in AS patients, which confirmed the importance of oxidative phosphorylation in AS.21,22 Tumor protein 53-induced nuclear protein 1 (TP53INP1) is one of the main target genes that mediate the p53 signaling pathway of antioxidant activity, and is significantly correlated with oxidative physiology.23 Perhaps, TP53INP1 exerts antioxidant activity by affecting oxidative physiology, affecting the AS process. In addition, TP53INP1 had been shown to be overexpressed in stress responses including inflammation,24 which was consistent with our research findings.
The pathological changes of AS mainly include osteolytic bone destruction and osteogenic changes. The interaction of mesenchymal stem cells, osteoblasts, osteoclast and other bone cells with T cells, B cells and other immune cells jointly regulated the pathogenesis of AS.25 Piccolo et al pointed out that vertebrate trunk induction requires inhibition of bone morphogenetic protein (BMP) signaling.26 RBM47 is an RNA-binding motif protein that plays multiple roles in bone formation and embryonic development.27 Guan et al also pointed out that RBM47 is involved in bone formation and is associated with BMP signaling and Wnt signaling pathways.26 Our study found a significant positive correlation between RBM47 and osteoclast differentiation function, which may suggest that RBM47 may promote osteoclast differentiation through BMP signaling, thereby affecting AS progression. It is worth noting that RBM47 is also annotated in the B cell receiver signaling path. Moreover, Wei et al also proposed that RBM47 can enhance the production of IL-10 and promote immune suppression of B cells,28 which further deepens our understanding of AS bone immunology. RBM47 can also interact with B cells by participating in the B cell receptor signaling pathway, and jointly regulate the pathogenesis of AS.
TUBB is a type of protein coding gene of β-Tubulin protein. It has been shown to be significantly correlated with the development of the innate immune system29 and differentially expressed in rheumatoid arthritis.30 Besides, Zhang et al also found differential expression of TUBB-peptide in the plasma of AS patients. And in vitro cell experiments showed that TUBB significantly increased the proliferation of fibroblasts,31 while fibroblasts may develop into osteoblasts. Numerous studies have shown that fibroblasts are the starting point for AS ligament ossification.32,33 Moreover, Joos et al confirmed IL-1β is significantly negatively correlated with TUBB, and participates in regulating various cytoskeleton components in human chondrocytes, and is related to the pathogenesis of osteoarthritis.34 We have also mentioned that pro-inflammatory cytokines (such as TNF-α) can affect the expression of various kynurenine pathway enzymes, leading to metabolic changes and affecting inflammatory response and immunity.8 Excitingly, when we further analyzed the upstream regulatory mechanisms of diagnostic genes, we found that has-miR-429, has miR-200c-3p, and has miR-200b-3p can simultaneously regulate TP53INP1 and TUBB. Among them, has miR-200b-3p has been reported to be involved in epithelial mesenchymal transition (EMT).35 Research has shown that cysteine rich domains 1 could promote EMT induced by IL-1β.36 These results might suggest that has-miR-200b-3p is involved in EMT induced by IL-1β to regulates TUBB, thereby affecting the expression of various kynurenine pathway enzymes, and participates in the regulation of cytoskeleton components, which may also be the key mechanism of amino acid metabolism involved in AS. In future drug predictions, we predicted that TUBB has 51 targeted drugs, such as colchicine, vinblastine, vincristine, etc. Among them, colchicine is a common anti IL-1 and TNF-α inhibitors, and have been applied in the clinical treatment of AS.37 Our study further confirms the clinical value of TUBB and provides a theoretical basis for the clinical treatment of colchicine in AS.
We further explored the immune microenvironment of AS, and the correlation results showed that the three diagnostic genes were highly significantly related to gamma delta T cell and type 17 T helper cell. According to reports, gamma delta T cells that produce IL-17 promote bone regeneration by acting on mesenchymal stem cells during fracture healing,38 and the response seems to depend on nonantigenic driving mechanisms, including cytokines (IL-1, IL-23, and IL-28) and chemokines (Th1 and Th2).39 Hull pointed out that the increase in type 17 T helper cells with IL-17 phenotype play a key role in AS treatment, and this mechanism is associated with chemokines Th1 and Th2.40 Our study not only pointed out that the functions of all three diagnostic genes were annotated in the chemokine signaling pathway, but also found that all three diagnostic genes were associated with NF-κB signaling pathway. What is interesting is that the balance of Th1/Th2 is maintained by NF-κB signal.41 These evidence all suggested that RBM47, TP53INP1, and TUBB regulate the balance of Th1/Th2 through the chemokine signaling pathway or NF-κB signaling pathway, and participate in the regulation of bone regeneration in AS by gamma delta T cells and type 17 T helper cells.
In summary, this study screened three diagnostic genes for AS related to amino acid metabolism, and further understood their molecular mechanisms of action on AS through functional enrichment and molecular regulation prediction. However, our conjecture about the regulatory mechanism of diagnostic genes has not been confirmed yet. We will further verify the mechanism of has-miR-200b-3p regulating TUBB through cell experiments, and explore the roles of pro-inflammatory factors such as IL-1, IL-17, IL-1β, and TNF-α in it.
Declaration
All patients provided written informed consent which obtained prior to the commencement of the samples were taken. The authors confirm that this study complies with the Declaration of Helsinki. This study was approved by the Ethics Committee of the Third People’s Hospital of Chengdu and the IRB reference number was [2019]S-103.
Disclosure
The authors report no conflicts of interest in this work.
References
1. Zochling J, Brandt J, Braun J. The current concept of spondyloarthritis with special emphasis on undifferentiated spondyloarthritis. Rheumatology. 2005;44(12):1483–1491. doi:10.1093/rheumatology/kei047
2. Ashrafi M, Ermann J, Weisman MH. Spondyloarthritis evolution: what is in your history? Curr Opin Rheumatol. 2020;32(4):321–329. doi:10.1097/BOR.0000000000000712
3. van der Heijde D, Braun J, Deodhar A, et al. Modified stoke ankylosing spondylitis spinal score as an outcome measure to assess the impact of treatment on structural progression in ankylosing spondylitis. Rheumatology. 2019;58(3):388–400. doi:10.1093/rheumatology/key128
4. Ritchlin C, Adamopoulos IE. Axial spondyloarthritis: new advances in diagnosis and management. BMJ. 2021;372:m4447. doi:10.1136/bmj.m4447
5. Sieper J, Poddubnyy D. Axial spondyloarthritis. Lancet. 2017;390(10089):73–84. doi:10.1016/S0140-6736(16)31591-4
6. Berlinberg AJ, Regner EH, Stahly A, et al. Multi ‘Omics analysis of intestinal tissue in ankylosing spondylitis identifies alterations in the tryptophan metabolism pathway. Front Immunol. 2021;12:587119. doi:10.3389/fimmu.2021.587119
7. Gao P, Lu C, Zhang F, et al. Integrated GC-MS and LC-MS plasma metabonomics analysis of ankylosing spondylitis. Analyst. 2008;133(9):1214–1220. doi:10.1039/b807369d
8. Eryavuz Onmaz D, Sivrikaya A, Isik K, et al. Altered kynurenine pathway metabolism in patients with ankylosing spondylitis. Int Immunopharmacol. 2021;99:108018. doi:10.1016/j.intimp.2021.108018
9. Smith SC, Folefac VA, Osei DK, et al. An immunocytochemical study of the distribution of proline-4-hydroxylase in normal, osteoarthritic and rheumatoid arthritic synovium at both the light and electron microscopic level. Br J Rheumatol. 1998;37(3):287–291. doi:10.1093/rheumatology/37.3.287
10. Stodulkova E, Pohl J, Man P, et al. Comparison of amino acid compositions of peptides eluted from HLA-B27 molecules of healthy individuals and patients with ankylosing spondylitis. Immunol Lett. 2006;103(2):135–141. doi:10.1016/j.imlet.2005.10.017
11. Canossi A, Oumhani K, Del Beato T, et al. The role of CD1 gene polymorphism in the genetic susceptibility to spondyloarthropathies in the moroccan population and the possible cross-link with celiac disease. Vaccines. 2023;11(2):237. doi:10.3390/vaccines11020237
12. Taylor MP. Epilepsy in a Doncaster practice: audit and change over eight years. J R Coll Gen Pract. 1987;37(296):116–119.
13. Gao XM, Wordsworth P, McMichael AJ, et al. Homocysteine modification of HLA antigens and its immunological consequences. Eur J Immunol. 1996;26(7):1443–1450. doi:10.1002/eji.1830260707
14. Ritchie ME, Phipson B, Wu D, et al. limma powers differential expression analyses for RNA-sequencing and microarray studies. Nucleic Acids Res. 2015;43(7):e47. doi:10.1093/nar/gkv007
15. Langfelder P, Horvath S. WGCNA: an R package for weighted correlation network analysis. BMC Bioinf. 2008;9(1):559. doi:10.1186/1471-2105-9-559
16. Franz M, Rodriguez H, Lopes C, et al. GeneMANIA update 2018. Nucleic Acids Res. 2018;46(W1):W60–W64. doi:10.1093/nar/gky311
17. Robin X, Turck N, Hainard A, et al. pROC: an open-source package for R and S+ to analyze and compare ROC curves. BMC Bioinf. 2011;12(1):77. doi:10.1186/1471-2105-12-77
18. Newman AM, Liu CL, Green MR, et al. Robust enumeration of cell subsets from tissue expression profiles. Nat Methods. 2015;12(5):453–457. doi:10.1038/nmeth.3337
19. Shannon P, Markiel A, Ozier O, et al. Cytoscape: a software environment for integrated models of biomolecular interaction networks. Genome Res. 2003;13(11):2498–2504. doi:10.1101/gr.1239303
20. Livak KJ, Schmittgen TD. Analysis of relative gene expression data using real-time quantitative PCR and the 2(-Delta Delta C(T)) Method. Methods. 2001;25(4):402–408. doi:10.1006/meth.2001.1262
21. Lari A, Gholami Pourbadie H, Sharifi-Zarchi A, et al. Evaluation of the ankylosing spondylitis transcriptome for oxidative phosphorylation pathway: the shared pathway with neurodegenerative diseases. Iran J Allergy Asthma Immunol. 2021;20(5):563–573. doi:10.18502/ijaai.v20i5.7406
22. Najafzadeh L, Mahmoudi M, Ebadi M, et al. Co-expression network analysis reveals key genes related to ankylosing spondylitis arthritis disease: computational and experimental validation. Iran J Biotechnol. 2021;19(1):e2630. doi:10.30498/IJB.2021.2630
23. Cano CE, Gommeaux J, Pietri S, et al. Tumor protein 53-induced nuclear protein 1 is a major mediator of p53 antioxidant function. Cancer Res. 2009;69(1):219–226. doi:10.1158/0008-5472.CAN-08-2320
24. Saadi H, Seillier M, Carrier A. The stress protein TP53INP1 plays a tumor suppressive role by regulating metabolic homeostasis. Biochimie. 2015;118:44–50. doi:10.1016/j.biochi.2015.07.024
25. Liu L, Yuan Y, Zhang S, et al. Osteoimmunological insights into the pathogenesis of ankylosing spondylitis. J Cell Physiol. 2021;236(9):6090–6100. doi:10.1002/jcp.30313
26. Guan R, El‐Rass S, Spillane D, et al. rbm47, a novel RNA binding protein, regulates zebrafish head development. Dev Dyn. 2013;242(12):1395–1404. doi:10.1002/dvdy.24039
27. Shivalingappa PKM, Sharma V, Shiras A, et al. RNA binding motif 47 (RBM47): emerging roles in vertebrate development, RNA editing and cancer. Mol Cell Biochem. 2021;476(12):4493–4505. doi:10.1007/s11010-021-04256-5
28. Wei Y, Zhang F, Zhang Y, et al. Post-transcriptional regulator Rbm47 elevates IL-10 production and promotes the immunosuppression of B cells. Cell Mol Immunol. 2019;16(6):580–589. doi:10.1038/s41423-018-0041-z
29. Isrie M, Breuss M, Tian G, et al. Mutations in either TUBB or MAPRE2 cause circumferential skin creases kunze type. Am J Hum Genet. 2015;97(6):790–800. doi:10.1016/j.ajhg.2015.10.014
30. Chang X, Zhao Y, Wang Y, et al. Screening citrullinated proteins in synovial tissues of rheumatoid arthritis using 2-dimensional Western blotting. J Rheumatol. 2013;40(3):219–227. doi:10.3899/jrheum.120751
31. Zhang GN, Xu YJ, Jin L. Peptidomics analysis of plasma in patients with ankylosing spondylitis. Front Immunol. 2023;14:1104351. doi:10.3389/fimmu.2023.1104351
32. Barriere SL. Therapy of choice for the empiric treatment of the febrile neutropenic patient. Drug Intell Clin Pharm. 1986;20(10):767–769. doi:10.1177/106002808602001005
33. Zeng Y, Wang T, Liu Y, et al. Wnt and Smad signaling pathways synergistically regulated the osteogenic differentiation of fibroblasts in ankylosing spondylitis. Tissue Cell. 2022;77:101852. doi:10.1016/j.tice.2022.101852
34. Joos H, Albrecht W, Laufer S, et al. IL-1beta regulates FHL2 and other cytoskeleton-related genes in human chondrocytes. Mol Med. 2008;14(3–4):150–159. doi:10.2119/2007-00118.Joos
35. Wu J, Cui H, Zhu Z, et al. MicroRNA-200b-3p suppresses epithelial-mesenchymal transition and inhibits tumor growth of glioma through down-regulation of ERK5. Biochem Biophys Res Commun. 2016;478(3):1158–1164. doi:10.1016/j.bbrc.2016.08.085
36. Yu R, Wu Y, He P, et al. LIM and Cysteine-Rich Domains 1 promotes transforming growth factor beta1-induced epithelial-mesenchymal transition in human kidney 2 cells. Lab Invest. 2023;103(2):100016. doi:10.1016/j.labinv.2022.100016
37. Yazisiz V, Taner Yılmaz V, Uçar İ, et al. The use of anti-interleukin-1 agents and tumor necrosis factor-alpha inhibitors in renal transplant recipients. Arch Rheumatol. 2021;36(3):366–374. doi:10.46497/ArchRheumatol.2021.8500
38. Okamoto K. IL-17産生性T細胞による骨の制御 [Regulation of bone by IL-17-producing T cells]. Nihon Rinsho Meneki Gakkai Kaishi. 2017;40(5):361–366. Japanese. doi:10.2177/jsci.40.361
39. Bank I. The role of Gamma Delta T cells in autoimmune rheumatic diseases. Cells. 2020;9(2):462. doi:10.3390/cells9020462
40. Hull DN, Williams RO, Pathan E, et al. Anti-tumour necrosis factor treatment increases circulating T helper type 17 cells similarly in different types of inflammatory arthritis. Clin Exp Immunol. 2015;181(3):401–406. doi:10.1111/cei.12626
41. Zheng Y, Cai B, Ren C, et al. Identification of immune related cells and crucial genes in the peripheral blood of ankylosing spondylitis by integrated bioinformatics analysis. PeerJ. 2021;9:e12125. doi:10.7717/peerj.12125
 © 2024 The Author(s). This work is published and licensed by Dove Medical Press Limited. The
full terms of this license are available at https://www.dovepress.com/terms
and incorporate the Creative Commons Attribution
- Non Commercial (unported, 3.0) License.
By accessing the work you hereby accept the Terms. Non-commercial uses of the work are permitted
without any further permission from Dove Medical Press Limited, provided the work is properly
attributed. For permission for commercial use of this work, please see paragraphs 4.2 and 5 of our Terms.
© 2024 The Author(s). This work is published and licensed by Dove Medical Press Limited. The
full terms of this license are available at https://www.dovepress.com/terms
and incorporate the Creative Commons Attribution
- Non Commercial (unported, 3.0) License.
By accessing the work you hereby accept the Terms. Non-commercial uses of the work are permitted
without any further permission from Dove Medical Press Limited, provided the work is properly
attributed. For permission for commercial use of this work, please see paragraphs 4.2 and 5 of our Terms.
Recommended articles
Neutrophil-Related Gene Expression Signatures in Idiopathic Pulmonary Fibrosis: Implications for Disease Characteristic and Identification of Diagnostic Hub Genes
Lin Y, Lai X, Lei T, Qiu Y, Deng Q, Liu Q, Wang Z, Huang W
Journal of Inflammation Research 2023, 16:2503-2519
Published Date: 14 June 2023
An Important Role in Novel Immune Mechanism and Diagnostic Model of Ankylosing Spondylitis: The CeRNA-ADRB2 Network
Huang F, Su Z, Yu C
Journal of Inflammation Research 2023, 16:5915-5936
Published Date: 6 December 2023
Identification of Mitophagy-Associated Genes for the Prediction of Metabolic Dysfunction-Associated Steatohepatitis Based on Interpretable Machine Learning Models
Deng B, Chen Y, He P, Liu Y, Li Y, Cai Y, Dong W
Journal of Inflammation Research 2024, 17:2711-2730
Published Date: 3 May 2024
Identification of Senescence-Related Genes for the Prediction of Ulcerative Colitis Based on Interpretable Machine Learning Models
Ma J, Chen C, Wang N, Fang T, Liu Y, He P, Dong W
Journal of Inflammation Research 2025, 18:3431-3447
Published Date: 10 March 2025
Identification of Oxidative Stress-Associated Biomarkers in Chronic Obstructive Pulmonary Disease: An Integrated Bioinformatics Analysis
Jiang X, Wang M, Li H, Liu Y, Dong X
International Journal of Chronic Obstructive Pulmonary Disease 2025, 20:841-855
Published Date: 26 March 2025