Back to Journals » International Journal of General Medicine » Volume 15
Identification of a Nomogram with an Autophagy-Related Risk Signature for Survival Prediction in Patients with Glioma
Authors Fu X, Hong L, Gong H, Kan G, Zhang P, Cui TT, Fan G, Si X, Zhu J ![]()
Received 23 August 2021
Accepted for publication 24 January 2022
Published 15 February 2022 Volume 2022:15 Pages 1517—1535
DOI https://doi.org/10.2147/IJGM.S335571
Checked for plagiarism Yes
Review by Single anonymous peer review
Peer reviewer comments 2
Editor who approved publication: Dr Scott Fraser
Xiaofeng Fu,1 Luwei Hong,2 Haiying Gong,3 Guangjuan Kan,4 Pengfei Zhang,1 Ting-Ting Cui,5 Gonglin Fan,6 Xing Si,7 Jiang Zhu1
1Department of Ultrasound, Women’s Hospital, Zhejiang University School of Medicine, Hangzhou, Zhejiang, 310000, People’s Republic of China; 2Department of Radiology, The Second Affiliated Hospital, Zhejiang University School of Medicine, Hangzhou, Zhejiang, 310000, People’s Republic of China; 3Department of Ultrasound, Yiwu Traditional Chinese Medicine Hospital, Jinhua, Zhejiang, 321000, People’s Republic of China; 4Department of Ultrasound, The Affiliated Hangzhou First People’s Hospital, Zhejiang University School of Medicine, Hangzhou, Zhejiang, 310000, People’s Republic of China; 5Department of Ultrasound, Taizhou Traditional Chinese Medicine Hospital, Taizhou, Zhejiang, 318000, People’s Republic of China; 6Department of Ultrasound, Sir Run Run Shaw Hospital, Zhejiang University School of Medicine, Hangzhou, Zhejiang, 310000, People’s Republic of China; 7Hangzhou Normal University, Hangzhou, Zhejiang, 310000, People’s Republic of China
Correspondence: Jiang Zhu, Department of Ultrasound, Women’s Hospital, Zhejiang University School of Medicine, Hangzhou, Zhejiang, 31000, People’s Republic of China, Tel +86 13757122629, Email [email protected]
Background: Glioma is a common type of tumor in the central nervous system characterized by high morbidity and mortality. Autophagy plays vital roles in the development and progression of glioma, and is involved in both normal physiological and various pathophysiological progresses.
Patients and Methods: A total of 531 autophagy-related genes (ARGs) were obtained and 1738 glioma patients were collected from three public databases. We performed least absolute shrinkage and selection operator regression to identify the optimal prognosis-related genes and constructed an autophagy-related risk signature. The performance of the signature was validated by receiver operating characteristic analysis, survival analysis, clinic correlation analysis, and Cox regression. A nomogram model was established by using multivariate Cox regression analysis. Schoenfeld’s global and individual test were used to estimate time-varying covariance for the assumption of the Cox proportional hazard regression analysis. The R programming language was used as the main data analysis and visualizing tool.
Results: An overall survival-related risk signature consisting of 15 ARGs was constructed and significantly stratified glioma patients into high- and low-risk groups (P < 0.0001). The area under the ROC curve of 1-, 3-, 5-year survival was 0.890, 0.923, and 0.889, respectively. Univariate and multivariate Cox analyses indicated that the risk signature was a satisfactory independent prognostic factor. Moreover, a nomogram model integrating risk signature with clinical information for predicting survival rates of patients with glioma was constructed (C-index=0.861± 0.024).
Conclusion: This study constructed a novel and reliable ARG-related risk signature, which was verified as a satisfactory prognostic marker. The nomogram model could provide a reference for individually predicting the prognosis for each patient with glioma and promoting the selection of optimal treatment.
Keywords: glioma, autophagy, risk signature, prognosis, nomogram
Introduction
Gliomas, the most common malignant and heterogeneous tumors of the central nervous system, account for 75% of the malignant primary brain tumors in adults. As the highest grade of glioma, the 5-year overall survival (OS) rate post diagnosis of patients with glioblastoma multiforme has been shown to be only 5.5%.1 Current treatment of gliomas has achieved great advances, and the prognosis of patients has been significantly improved by multimodal therapy including surgery, radiotherapy, chemotherapy, targeted therapy and immunotherapy.2 However, there is considerable heterogeneity in patient outcomes. Some researchers have hypothesized that this is due to different molecular genetic backgrounds. Therefore, finding a comprehensive and accurate tool to assist the clinic and develop appropriate individualized treatment plan for patients is very essential.
In the World Health Organization (WHO) Classification of Central Nervous System Tumors published in 2016, molecular markers such as isocitrate dehydrogenase (IDH) mutation and 1p/19q codeletion status were firstly used for the early diagnosis and subgroup classification of patients with glioma.3 Other diagnostic molecular markers include tumor protein p53, ATRX chromatin remodeler, O6-methylguanine-DNA methyltransferase, and telomerase reverse transcriptase promoters.4,5 With the rapid development of high-throughput sequencing, gene chip technology, and bioinformatics analyses, researchers combined molecular characteristics with clinicopathological information to establish some signatures for the risk stratification and prognosis prediction of patients with glioma, such as immune-related 6,7 and metabolism-related 8 prognostic signature, epithelial–mesenchymal transition-related risk signature,9 etc. These approaches achieved satisfactory results, which suggests that it is promising to investigate new prognostic biomarkers and predictors.
Autophagy is a critical cellular process responsible for eliminating damaged organelles, misfolded proteins, and other discarded intracellular macromolecules via a lysosomal degradation mechanism. The purpose of autophagy is to protect cells and organisms from stressors, such as hypoxia, inflammation, and nutrient deficiency.10 In addition, autophagy is also involved in various pathophysiological processes, especially in cancer. In recent years, the regulation or targeting of autophagy for the treatment of cancer, including glioma, has shown a wide range of prospects.11,12 Some studies have carried out in-depth investigation on the role of ARGs in the development and treatment of glioma. Wen et al found that depletion of ATG4C suppressed Temozolomide (TMZ)-activated autophagy and promoted sensitivity of glioma cells to TMZ, and knockdown of the ATG4C suppressed the growth of glioma remarkably in nude mice.13,14 Autophagy-related gene VMP1 knockout blocked autophagic flux and made glioma cells sensitive to radiotherapy and chemotherapy.15 Researchers have found that high LC3/beclin1 expression indicated poor prognosis of glioma patients.16 It follows that current studies on the relationship between ARGs and prognosis in patients with glioma mostly focused on the function of a single gene. Moreover, some studies have begun to use gene expression profiles to explore the relationship between ARG-related signature and glioma prognosis. Xu et al identified an autophagy-related lncRNA (ARL) signature including 38 ARLs for classification of diffuse glioma and verified that the signature was associated with glioma prognosis.17 Chen et al developed 24 ARG signature that can effectively classify low-grade glioma patients into low-risk and high-risk groups and be used to predict prognosis.17 Fan et al constructed a nomogram for survival assessment by integrating clinicopathological features and three-gene autophagy signature.18 However, some current models consist of too many genes and are often not suitable for clinical application, and models with fewer genes lack a certain degree of accuracy. Many studies are limited to algorithmic success and lack validation in independent cohorts or experiments. But these findings do suggest that ARG may be a promising therapeutic target and prognostic factor, and the exploration of new ARG signatures as biomarkers for glioma prognosis can improve current prognostic models and facilitate further stratification of patients.
The aim of this study was to construct a novel autophagy-related risk signature, which can predict prognosis and suggest personalized treatment strategies for patients with glioma. We obtained the mRNA sequencing data and clinical characteristics of 1738 patients with glioma from four databases and collected an ARG set consisting of 531 genes. Univariate Cox analysis was used for the preliminary screening of ARGs. Based on least absolute shrinkage and selection operator (LASSO) regression model, we identified 15 ARGs related to patient OS and constructed an autophagy-related risk signature with good prognosis potential. The expression levels of ARGs were verified by immunohistochemical (IHC) staining and Western blotting analyses. This signature also proved to be an independent risk factor for patients with glioma. In addition, we developed a nomogram that incorporated the autophagy-related risk signature and clinical factors to predict the survival of patients with glioma. Three external validation sets were used to evaluate the prognostic and predictive accuracy of this model. This research may help clinicians make more accurate diagnoses in terms of risk stratification and prognostic prediction, as well as to develop individualized treatment strategies, with the aim to improve patient prognosis and OS rate.
Materials and Methods
Human ARG Set
We obtained ARGs from the Human Autophagy Database (HADb, http://www.autophagy.lu/index.html) and the GO_AUTOPHAGY gene set in the Molecular Signatures Database v6.2 (MSigDB, http://software.broadinstitute.org/gsea/msigdb) for this study. By removing duplicate data, we combined these two gene sets and finally integrated them into an ARG set containing 531 genes.
Samples and Data Source
A total of 1738 glioma samples with mRNA expression sequencing data and clinicopathological information were downloaded from four databases. The Cancer Genome Atlas (TCGA) dataset, including 562 primary glioma samples, was extracted from TCGA dataset (https://portal.gdc.cancer.gov/), and two additional mRNA sequence profiles termed CGGAseq1 (n = 307) and CGGAseq2 (n = 619) were downloaded from the Chinese Glioma Genome Atlas (CGGA) database (http://www.cgga.org.cn), along with the data of 250 glioma samples in the GSE16011 dataset obtained from the Gene Expression Omnibus database (http://www.ncbi.nlm.nih.gov/geo). The mRNA-seq data processing is based on the downloaded fragments per kilobase million (FPKM) data format with log2 transformation after adding a one pseudo count in TCGA, CGGAseq1, and CGGAseq2 datasets. The robust multi-array average algorithm was used in the GSE16011 dataset preprocessing. The RNA-seq data of normal brain samples were downloaded from the Genotype-Tissue Expression (GTEx) Project (https://gtexportal.org/home/), and transformed the primary data to Transcripts Per Kilobase Million (TPM) format for analysis. In addition, the levels of the identified ARGs can be assessed by detecting the mRNA expression profiles using tissue samples from patients with glioma after surgery. IHC staining results of the identified ARGs were obtained from the website of The Human Protein Atlas database (https://www.proteinatlas.org/).
Gene Scanning and Construction of a Gene Risk Signature Associated with the Survival of Patients with Glioma
Univariate Cox regression models were performed in four datasets with 478 shared ARGs. P < 0.0001 denoted statistical significance. According to hazard ratio (HR) values, the statistically significant genes were divided into potential protective (HR <1) and hazardous (HR >1) ARG groups. Finally, 66 overlapping ARGs were extracted via the webtool “Draw Venn Diagram” (http://bioinformatics.psb.ugent.be/webtools/Venn/).
The LASSO regression model was performed to select an optimal gene combination, and subsequently construct a risk signature for predicting the prognosis of patients with glioma using the R package “glmnet”.19 TCGA dataset was used as a training cohort and an autophagy-related risk signature associated with the OS of patients was established based on a linear combination of the regression coefficients generated from the LASSO regression model and expression levels of the genes. The risk score was calculated using the following formula:  . “
. “ ” represented the expression levels of a gene and “
 ” meant the regression coefficient of each gene.
Patients with glioma were divided into the high- or low-risk groups using the median risk score as a classification cutoff value. The differences in OS time of patients with glioma were compared using the Kaplan–Meier method, and we constructed time-dependent receiver operating characteristic (ROC) curves to evaluate the predictive value of the risk signature. The CGGAseq1, CGGAseq2, and GSE16011 datasets were used as validation cohorts.
Functional Enrichment Analysis
To further investigate the potential molecular mechanisms of the differences in prognosis between the high- and low-risk groups divided by the autophagy-related risk signature, we subsequently conducted the Gene Set Variation Analysis (GSVA) in TCGA cohort. The gene sets of “c5.bp.v7.1.symbols.gmt” and “c2.cp.kegg.v7.1.symbols.gmt” were downloaded from the Gene Set Enrichment Analysis (GSEA) website (https://www.gsea-msigdb.org/gsea/msigdb/index.jsp) for performing GSVA, using the R packages “GSVA”20 and “GSEABase”. Then, we obtained the enrichment score (ES) matrix for pathways including biological processes and Kyoto Encyclopedia of Genes and Genomes (KEGG) pathways of each sample. Differential expression analysis was conducted between low- and high-risk subgroups using the “limma”21 package to screen out differentially expressed pathways. | log (fold change) | >0.2 and adjusted P < 0.05 denoted statistically significant differences. The results of rich pathways were visualized with heatmaps.
Construction and Validation of a Prognostic Nomogram Model
Univariate and multivariate Cox proportional regression analyses were performed to screen out the independent prognostic parameters. Then we constructed a prognostic nomogram model using the screened independent prognostic factors with clinicopathological information for predicting the 1-, 3-, and 5-year survival rates of patients with glioma in TCGA cohort. Development of the nomogram was implemented via the R package “rms”. The Schoenfeld residuals for each covariate which screened out were observed and plotted against time using R package “survival” and “survminer”. Schoenfeld’s global and individual test were used to estimate time-varying covariance for the assumption of the Cox proportional hazard regression analysis. P>0.05 refers to no violation of assumption.22 Cohorts, including the CGGAseq1, CGGAseq2, and GSE16011 datasets, were used as external validation sets. Concordance-index (C-index), area under the curve (AUC), and calibration plot were utilized to evaluate the efficiency of the nomogram.
Cell Line and Cell Culture
Normal human astrocytes (NHA) HA1800 and human GBM cell lines (U251, U118, U87, LN229 and T98G) were purchased from the Cell Bank of Chinese academy of science (Shanghai, China). Human low-grade glioma (LGG) cell lines (SW1088 and SW1783) were purchased from the American Type Culture Collection (Maryland, USA). Cells SW1088 and SW1783 were maintained in Leibovitz’s L-15 Medium (Gibco, USA) and other cells were all cultured in Dulbecco’s modified Eagle Medium (DMEM) (Gibco, USA) containing 10% fetal bovine serum (FBS; Gibco, USA), 100 units/mL penicillin and 100 μg/mL streptomycin. All cells were maintained at 37°C in a humidified incubator containing 5% CO2.
Western Blot Analysis
Cultured cells were rinsed with phosphate buffered saline (PBS) three times and then lysed using ice-cold radioimmunoprecipitation assay (RIPA) buffer (Beyotime Biotechnology, Shanghai, China). Protein concentration of each samples was measured by bicinchoninic acid assay (BCA) kit (KeyGEN Biotech, China). Equivalent proteins were separated on 10–12% sodium dodecyl sulfate (SDS)-polyacrylamide gels and then transferred to polyvinylidene difluoride (PVDF) membranes. After being blocked in 5% non-fat dry milk dissolved with Tris-buffered saline with Tween-20 (TBST) for 1 hour at room temperature, the membranes were incubated overnight at 4°C with appropriate dilutions of primary antibodies including anti-NAMPT antibody, anti-cathepsin B (CTSB) antibody, anti-GAPDH antibody (Abcam, USA). The membranes were washed with TBST and incubated with horseradish peroxidase (HRP)-conjugated secondary antibody (Abcam, USA) for 2 hours at room temperature. The enhanced chemiluminescence (ECL) kit (Thermo Fisher Scientific, USA) was utilized for the visualization of bands, and the bands’ gray values were quantified using the Image J software (National Institutes of Health, Bethesda, MD, USA).
Statistical Analysis
The R programming language (version 3.6.3) was used as the main data analysis and visualizing tool to carry out statistical analyses, including univariate and multivariate Cox regression models, LASSO regression model, Kaplan–Meier survival analysis, ROC curves, heatmap drawing, etc. The R packages used in this study mainly included “glmnet,” “survival,” “pheatmap,” “survivalROC,” “timeROC,” “ggplot2,” “GSVA,” and “GSEABase”. These were used to obtain data and figures, such as forest plots, heatmaps, box plots, and calibration plots. The results of experimental were analyzed with one-way ANOVA by GraphPad Prism version 8.0.2 software (GraphPad Software, Inc., La Jolla, CA, USA). P<0.05 denoted statistically significant differences.
Results
ARG Screening
We designed a flow chart to systematically and intuitively demonstrate the design of our study (Figure 1). The clinicopathological characteristics of patients with glioma from four datasets were organized and shown in Table 1. An ARG set containing 531 genes was integrated from the HADb and GO_AUTOPHAGY gene set. To preliminarily screen out OS-related ARGs in glioma, univariate Cox regression models were performed in the four datasets using the shared 478 ARGs. P < 0.0001 denoted statistical significance. We divided these statistically significant ARGs into two groups based on the HR values. Subsequently, a total of 66 overlapping ARGs were extracted from potential protective (HR <1) and hazardous (HR >1) ARGs groups using the webtool “Draw Venn Diagram.” LASSO regression analysis was performed with the 66 overlapping genes in TCGA training cohort to select an optimal gene combination. Finally, 15 ARGs were identified on the basis of the optimal lambda value to construct a risk signature.
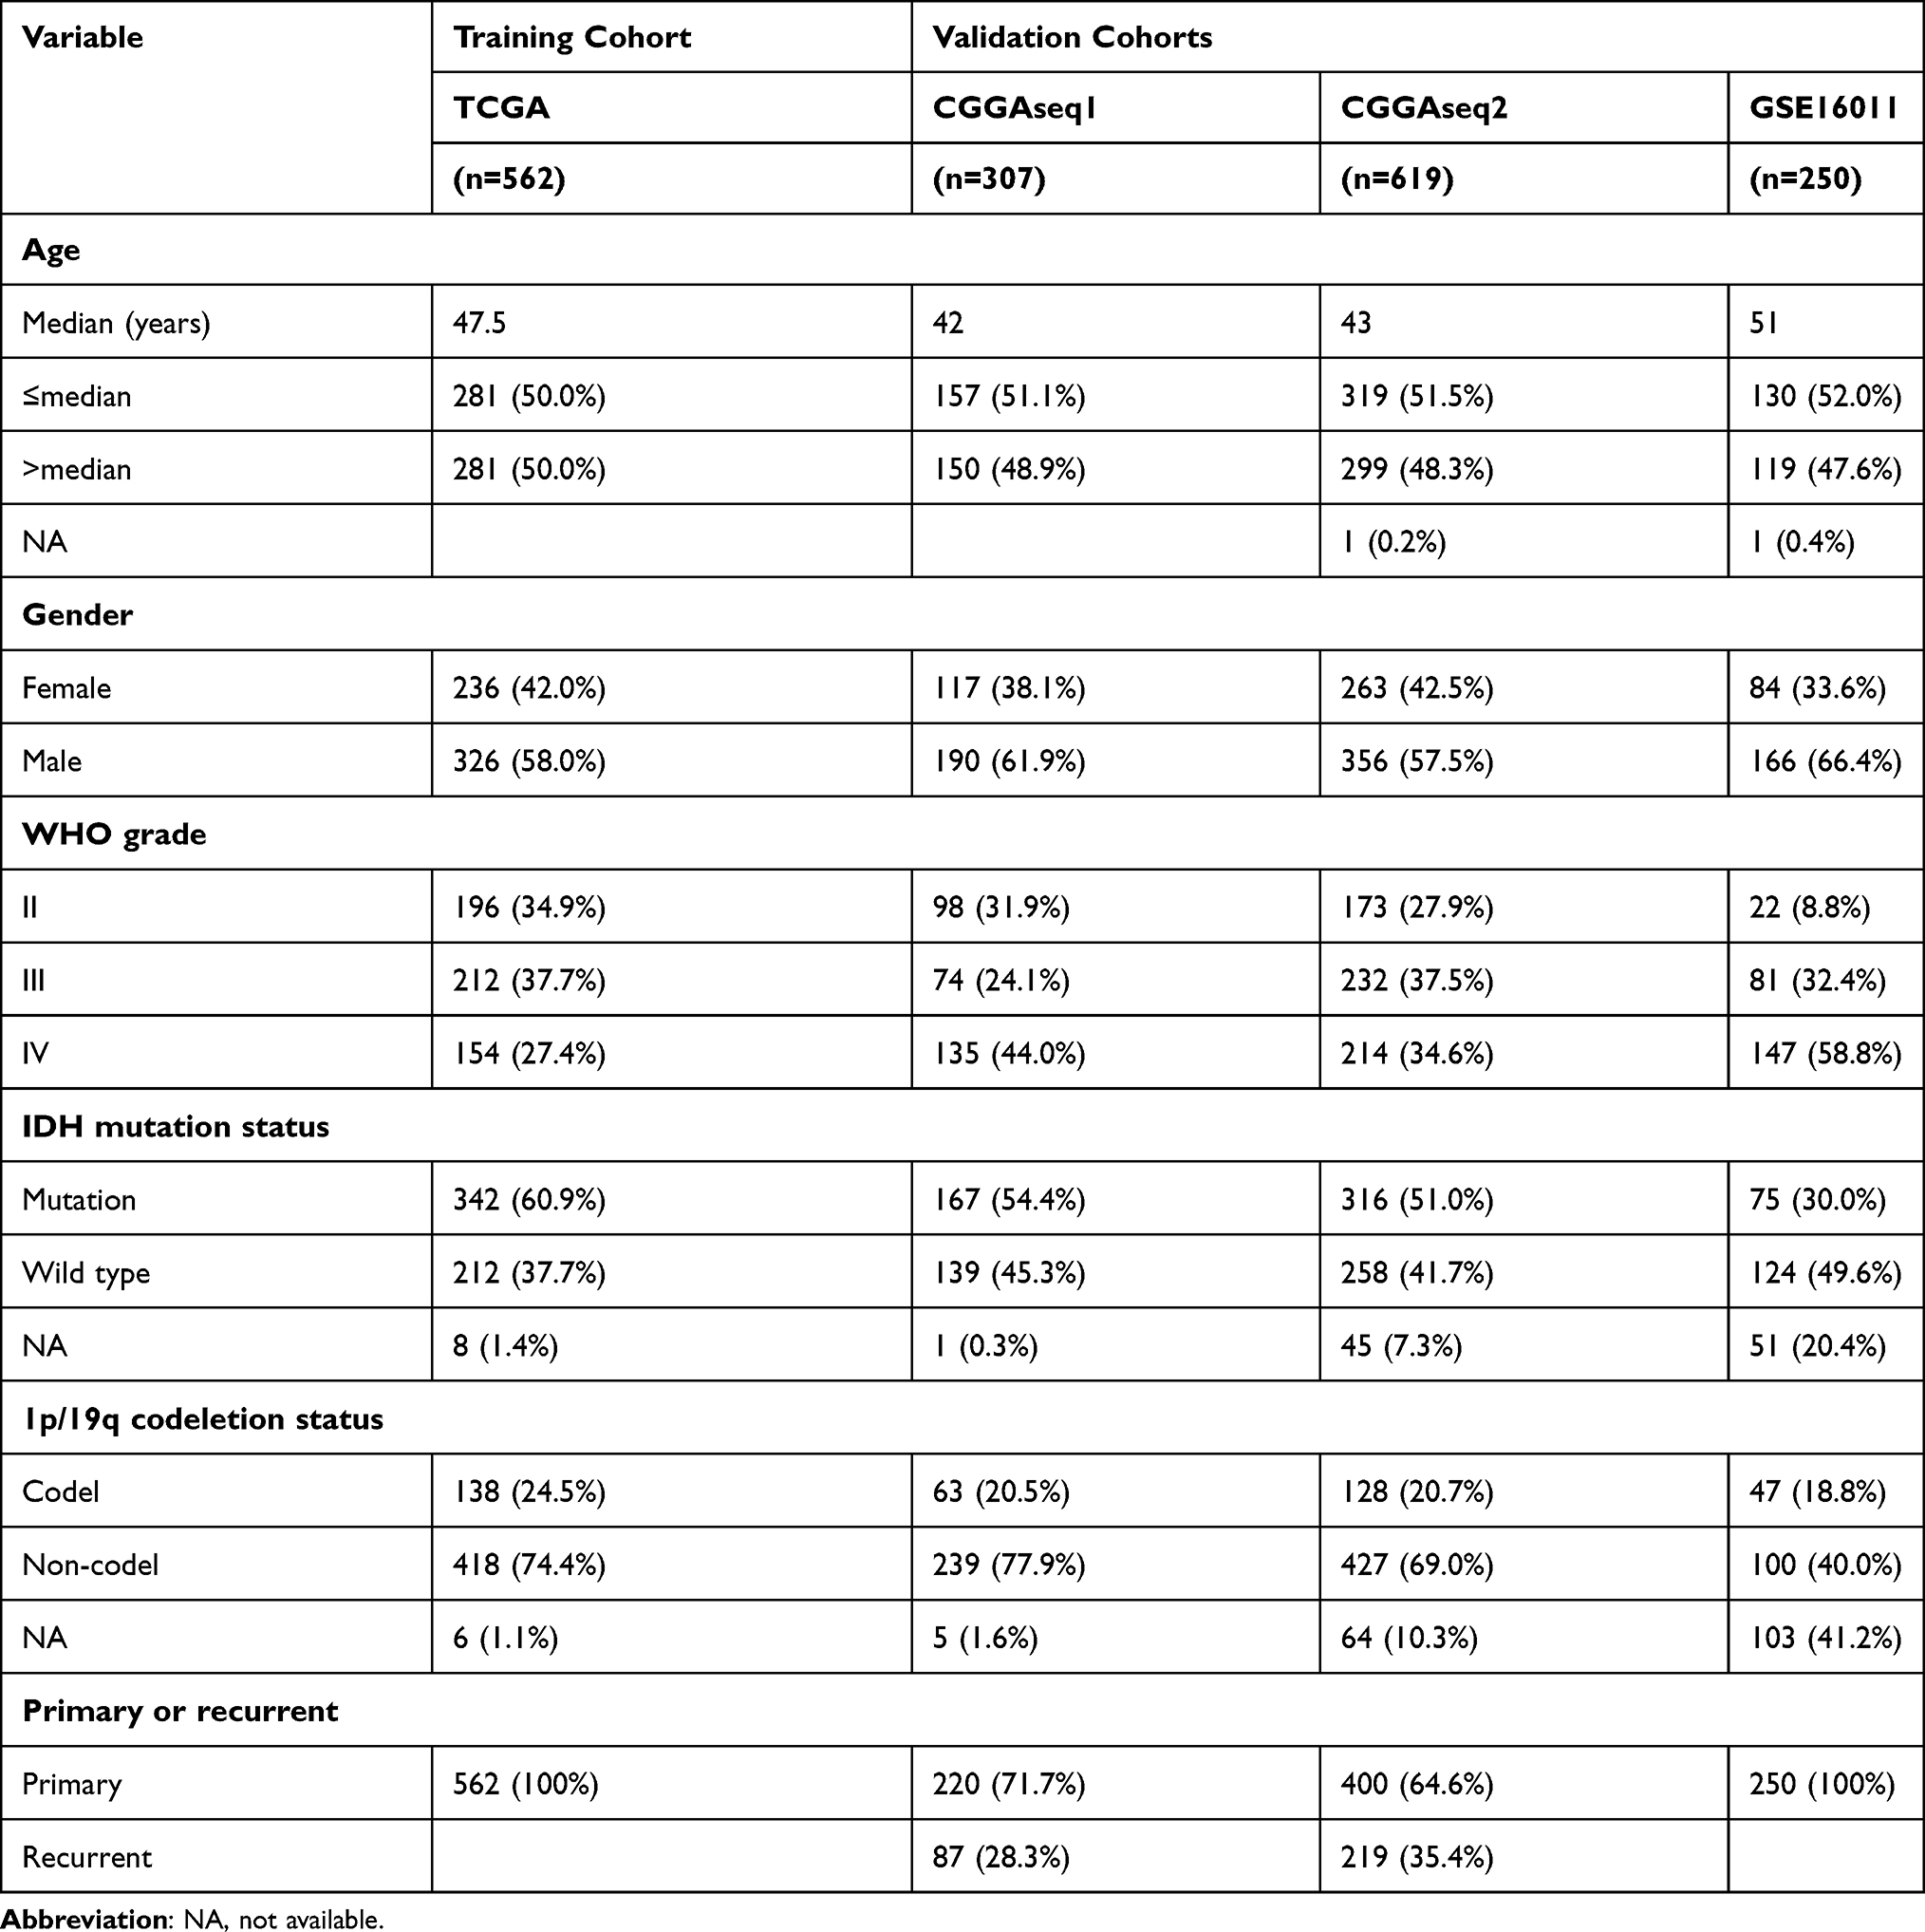 |
Table 1 Summary of Demographics and Clinicopathological Information of Patients with Glioma in This Study |
 |
Figure 1 Study flowchart. |
Establishment and Validation of a Risk Signature with 15 ARGs
A total of 562 patients with glioma in TCGA dataset were used to establish an autophagy-related risk signature. The regression coefficients of 15 ARGs (CHAF1B, CTSB, LGALS8, CASP4, ANXA5, DIRAS3, ERBB2, ATG9B, NAMPT, VEGFA, TREM1, KCNK3, BID, GRID1, NRG3) were obtained from the results of the LASSO regression (Figure 2A and B). An OS-related risk signature was established based on a linear combination of the regression coefficients generated from LASSO regression model coefficients and expression levels of the genes (Figure 2C). The algorithm was as follows: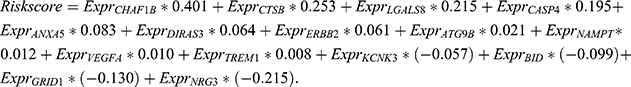
 |
Figure 2 Establishment of the risk signature with fifteen ARGs in the TCGA dataset. (A). Log (Lambda) value of the 66 ARGs in LASSO regression model. (B). The most proper log (Lambda) value in LASSO regression model. (C). The coefficients of selected genes. (D). The risk scores trend and patients’ survival distribution in TCGA dataset. (E). Receiver operating characteristic curves (ROC) for predicting 1-, 3-, 5-year survival of glioma patients.(F–I). The prognostic value of the ARG-related risk signature showed by Kaplan-Meier survival curves between low-risk group (n = 281) and high-risk group (n = 281) both in all grades and each grade. |
Each patient was granted a risk score based on the above formula and assigned to the high- or low-risk group according to the median risk score as a classification cutoff value. The number of alive patients was markedly decreased with the increasing risk score (Figure 2D). ROC curves were applied to evaluate the prognostic ability of the signature, and the AUC of 1-, 3-, 5-year survival was 0.89, 0.923, and 0.889, respectively (Figure 2E). The OS of patients in the low-risk group was significantly longer than that of patients in the high-risk group (P < 0.0001) (Figure 2F). Moreover, we also demonstrated that the risk signature remained a powerful marker for predicting the OS of patients with grade II, III, and IV tumors (Figure 2G–I). Thus, we believe that this risk signature, constructed using the above 15 ARGs, has good prognostic value.
Next, we calculated the risk score for each patient in the CGGAseq1, CGGAseq2, and GSE16011 datasets using the formula and regression coefficients derived from TCGA dataset, and established the validation cohorts. Similar to the results obtained in the training set, Kaplan–Meier survival curves also showed that the OS of patients in the high-risk group was significantly shorter than that recorded in the low-risk group (P < 0.0001) (Supplementary Figure 1A–C). The time-dependent ROC curve analyses of the autophagy-related risk signature indicated a promising prognostic ability for OS in the CGGAseq1 (AUC of 1-, 3-, 5-year was 0.769, 0.845, and 0.865, respectively; Supplementary Figure 1D), CGGAseq2 (AUC of 1-, 3-, 5-year was 0.729, 0.793, and 0.788, respectively; Supplementary Figure 1E), and GSE16011 (AUC of 1-, 3-, 5-year was 0.799, 0.885, and 0.826, respectively; Supplementary Figure 1F) cohorts. These results obtained from the three validation cohorts further illustrated that this ARG-related risk signature had excellent prognostic value in predicting the survival of patients with glioma.
In addition, considering the inclusion of primary and recurrent gliomas in the CGGAseq1 and CGGAseq2 validation cohorts, we further validated the prognostic value of this risk signature in primary gliomas in order to exclude the effect of TMZ treatment on OS of patients. Surprisingly, we found that in both cohorts, the OS of the high-risk group was significantly lower than that of the low-risk group, and ROC curves suggested that this signature had very good prognostic performance. The results showed that the ARG-related risk signature retained its prognostic value in primary patients (Supplementary Figure 2A–D).
Functional Enrichment Analysis Between the High- and Low-Risk Groups
We performed biological processes and KEGG pathway enrichment analyses using GSVA in the TCGA dataset to investigate the differences in prognosis between the high- and low-risk groups. Biological processes, including DNA replication and damage repair, immune response, inflammatory response to wounding, and cell adhesion mediated by integrin, were found to be significantly enriched in the high-risk group. The GO terms of inhibitory postsynaptic potential, cell differentiation in hindbrain, and neurotransmitter gated on channel clustering were enriched in the low-risk group (Figure 3A). In the KEGG pathway enrichment analysis, the pathways of cell cycle, DNA replication, mismatch repair, glycan biosynthesis and metabolism, glutathione metabolism, and ECM-receptor interaction were mainly enriched in the high-risk group (Figure 3B).
 |
Figure 3 Biological processes and KEGG pathway enrichment analyses performed by GSVA in TCGA dataset. (A). GSVA for biological processes analysis; (B). GSVA for KEGG pathways analysis. (|log2 (fold change) | >0.2 and adjusted P < 0.05). |
Associations Between the Autophagy-Related Risk Signature and Clinicopathologic Features
To assess the roles of each of the 15 ARGs in gliomas, we developed a heatmap to visualize the associations between the autophagy-related risk signature and common clinicopathologic characteristics in patients with glioma, as shown in Figure 4A. It showed that with the increase of risk score, the expression levels of NRG3, GRID1, BID and KCNK3 genes decreased significantly, while the expression levels of the CHAF1B, CTSB, LGALS8, CASP4, ANXA5, DIRAS3, ERBB2, ATG9B, NAMPT, VEGFA, and TREM1 genes increased significantly. In addition, we further analyzed the mRNA expression levels of revealed ARGs in the high- and low-risk cohorts visualizing by box plot. The expression levels of NRG3, GRID1, BID and KCNK3 in the low-risk group were significantly higher than those in the high-risk group, whereas the expression levels of the other 11 ARGs were higher in the high-risk group (Supplementary Figure 3). Then we found that the clinical characteristics including age, WHO grade, histological classification, IDH mutation, and 1p/19q codeletion status were significantly correlated with the autophagy-related risk signature that we constructed (P < 0.0001), whereas there was no significant difference between the high and low risk scores for gender. The expressions of ARGs (including CHAF1B, CTSB, LGALS8, CASP4, ANXA5, DIRAS3, ERBB2, ATG9B, NAMPT, VEGFA, and TREM1) increased distinctly in the elderly, high-grade and IDH mutant, and 1p/19q non-codeletion groups. On the contrary, the expression of ARGs containing NRG3, GRID1, BID, and KCNK3 was significantly decreased (Figure 4B–E).
 |
Figure 4 Associations between the ARG-related risk signature and clinicopathologic features in glioma patients in TCGA dataset. (A). Associations between the increasing risk score and clinicopathologic information (age, gender, WHO grade, histological classification, IDH mutation, and 1p/19q codeletion status) of 562 patients. (B–E). The expression levels of approved 15 ARGs in different cohorts stratified by age, WHO grade, IDH mutation, and 1p/19q codeletion status subtypes. ***P < 0.001, ****P < 0.0001. |
Subsequently, we constructed box plots and further compared the risk scores for each cohort in different clinical groups. The risk scores in patients with high-grade glioma were significantly higher than that calculated in those with low-grade glioma (Figure 5A). Compared with patients in the elderly group, those in the young age group had markedly lower risk scores (Figure 5B). The risk scores of patients with glioblastoma were significantly higher than those of patients with astrocytoma, oligoastrocytoma, and oligodendroglioma (Figure 5D). For the IDH mutation and 1p/19q codeletion status, the risk scores of IDH wild type and 1p/19q non-codeletion were higher (Figure 5E and F). However, there were no significant differences in the risk scores between male and female patients (Figure 5C).
 |
Figure 5 Distribution of the risk scores in different clinical groups and analyses of independent prognostic significance of the risk signature.(A–F). Distribution of the risk scores for different cohorts stratified by age, gender, WHO grade, histological classification, IDH mutation, and 1p/19q codeletion status subgroups showed by box plots. A, astrocytoma; OA, oligoastrocytoma; OD, oligodendroglioma; GBM, glioblastoma multiforme.(G–H). Results of univariate and multivariate Cox regression analyses in the TCGA training set. |
Validation of the Expression Levels of ARGs
To study the role of ARGs in the development of human glioma, the relative expression levels of identified ARGs between normal brain samples and gliomas were assessed. The results showed that the mRNA expression levels of genes including ANXA5, BID, CASP4, CHAF1B, CTSB, DIRAS3, ERBB2, GRID1, NAMPT, NRG3, TREM1 and VEGFA in tumor samples were higher than those in normal brain samples. In contrast, ATG9B and LGALS8 showed higher mRNA expression levels in normal brain samples (Figure 6A). To further validate the believability of the ARGs, we performed Western blotting analysis to investigate the protein expression levels of two selected ARGs (NAMPT and CTSB) in NHA and human glioma cell lines. We found that the protein expression levels of NAMPT and CTSB were up-regulated in glioma cell lines relative to NHA (Figure 6B–D). Immunohistochemical images of representative ARGs from the website of the HPA were used to further evaluating the functional status of these ARGs in glioma. Interestingly, in protein expression levels, most investigated ARGs (including CHAF1B, CTSB, ANXA5, DIRAS3, ERBB2, NAMPT, VEGFA, TREM1 and BID) in high- and low-grade glioma differed significantly, and have similar expression tendency with the previous results in our analysis (Supplementary Figure 4A–I).
 |
Figure 6 Validation of the expression levels of ARGs. (A). The relative mRNA expression levels of identified 15 ARGs between human brain and glioma samples.(B). Representative Western blots of NAMPT and CTSB protein expression levels in normal human astrocytes (NHA) and human glioma cell lines.(C, D). Relative quantification of Western blots shown in (g). One-way ANOVA for multi-group comparisons: NS, non-significant, **P < 0.01, ***P < 0.001, ****P < 0.0001. |
Identification of the Autophagy-Related Risk Signature as an Independent Prognostic Factor
Univariate and multivariate Cox regression analyses were performed to evaluate the independent prognostic significance of the autophagy-related risk signature combined with various clinicopathologic parameters. In the TCGA training cohort, our results of the univariate Cox regression analysis indicated that the age (HR = 1.073, 95% confidence interval [CI]=1.061–1.086, P < 0.001), grade of glioma (HR = 4.920, 95% CI = 3.842–6.299, P < 0.001), IDH mutation status (HR = 0.093, 95% CI = 0.066–0.132, P < 0.001), 1p/19q codeletion status (HR = 0.199, 95% CI = 0.115–0.345, P < 0.001), and autophagy-related risk signature (HR = 10.040, 95% CI = 6.670–15.111, P < 0.001) were significantly associated with the OS of patients with glioma (Figure 5G). Subsequently, these factors were included in a multivariate Cox regression analysis, which showed that age (HR = 1.046, 95% CI = 1.031–1.061, P < 0.001), grade of glioma (HR = 1.763, 95% CI = 1.302–2.388, P < 0.001), and autophagy-related risk signature (HR = 3.592, 95% CI = 1.972–6.542, P < 0.001) were significantly associated with OS (Figure 5H). Hence, the autophagy-related risk signature was identified as an independent prognostic factor for glioma. The CGGAseq1, CGGAseq2, and GSE16011 datasets were used as independent external validation cohorts. Consistently, univariate and multivariate Cox regression analyses confirmed the independent prognostic ability of our signature. The autophagy-related signature was verified as an independent indicator in three validation cohorts (HR = 1.925, 95% CI = 1.259–2.944, P = 0.003; HR = 1.803, 95% CI = 1.245–2.612, P = 0.002; and HR = 1.825, 95% CI = 1.039–3.207, P = 0.036) (Table 2). Furthermore, univariate and multivariate Cox regression analyses also validated the independent prognostic ability of our signature in primary glioma patients (HR = 2.302, 95% CI = 1.323–4.007, P = 0.003; HR = 2.317, 95% CI = 1.337–4.015, P = 0.003) (Supplementary Figure 2E–F).
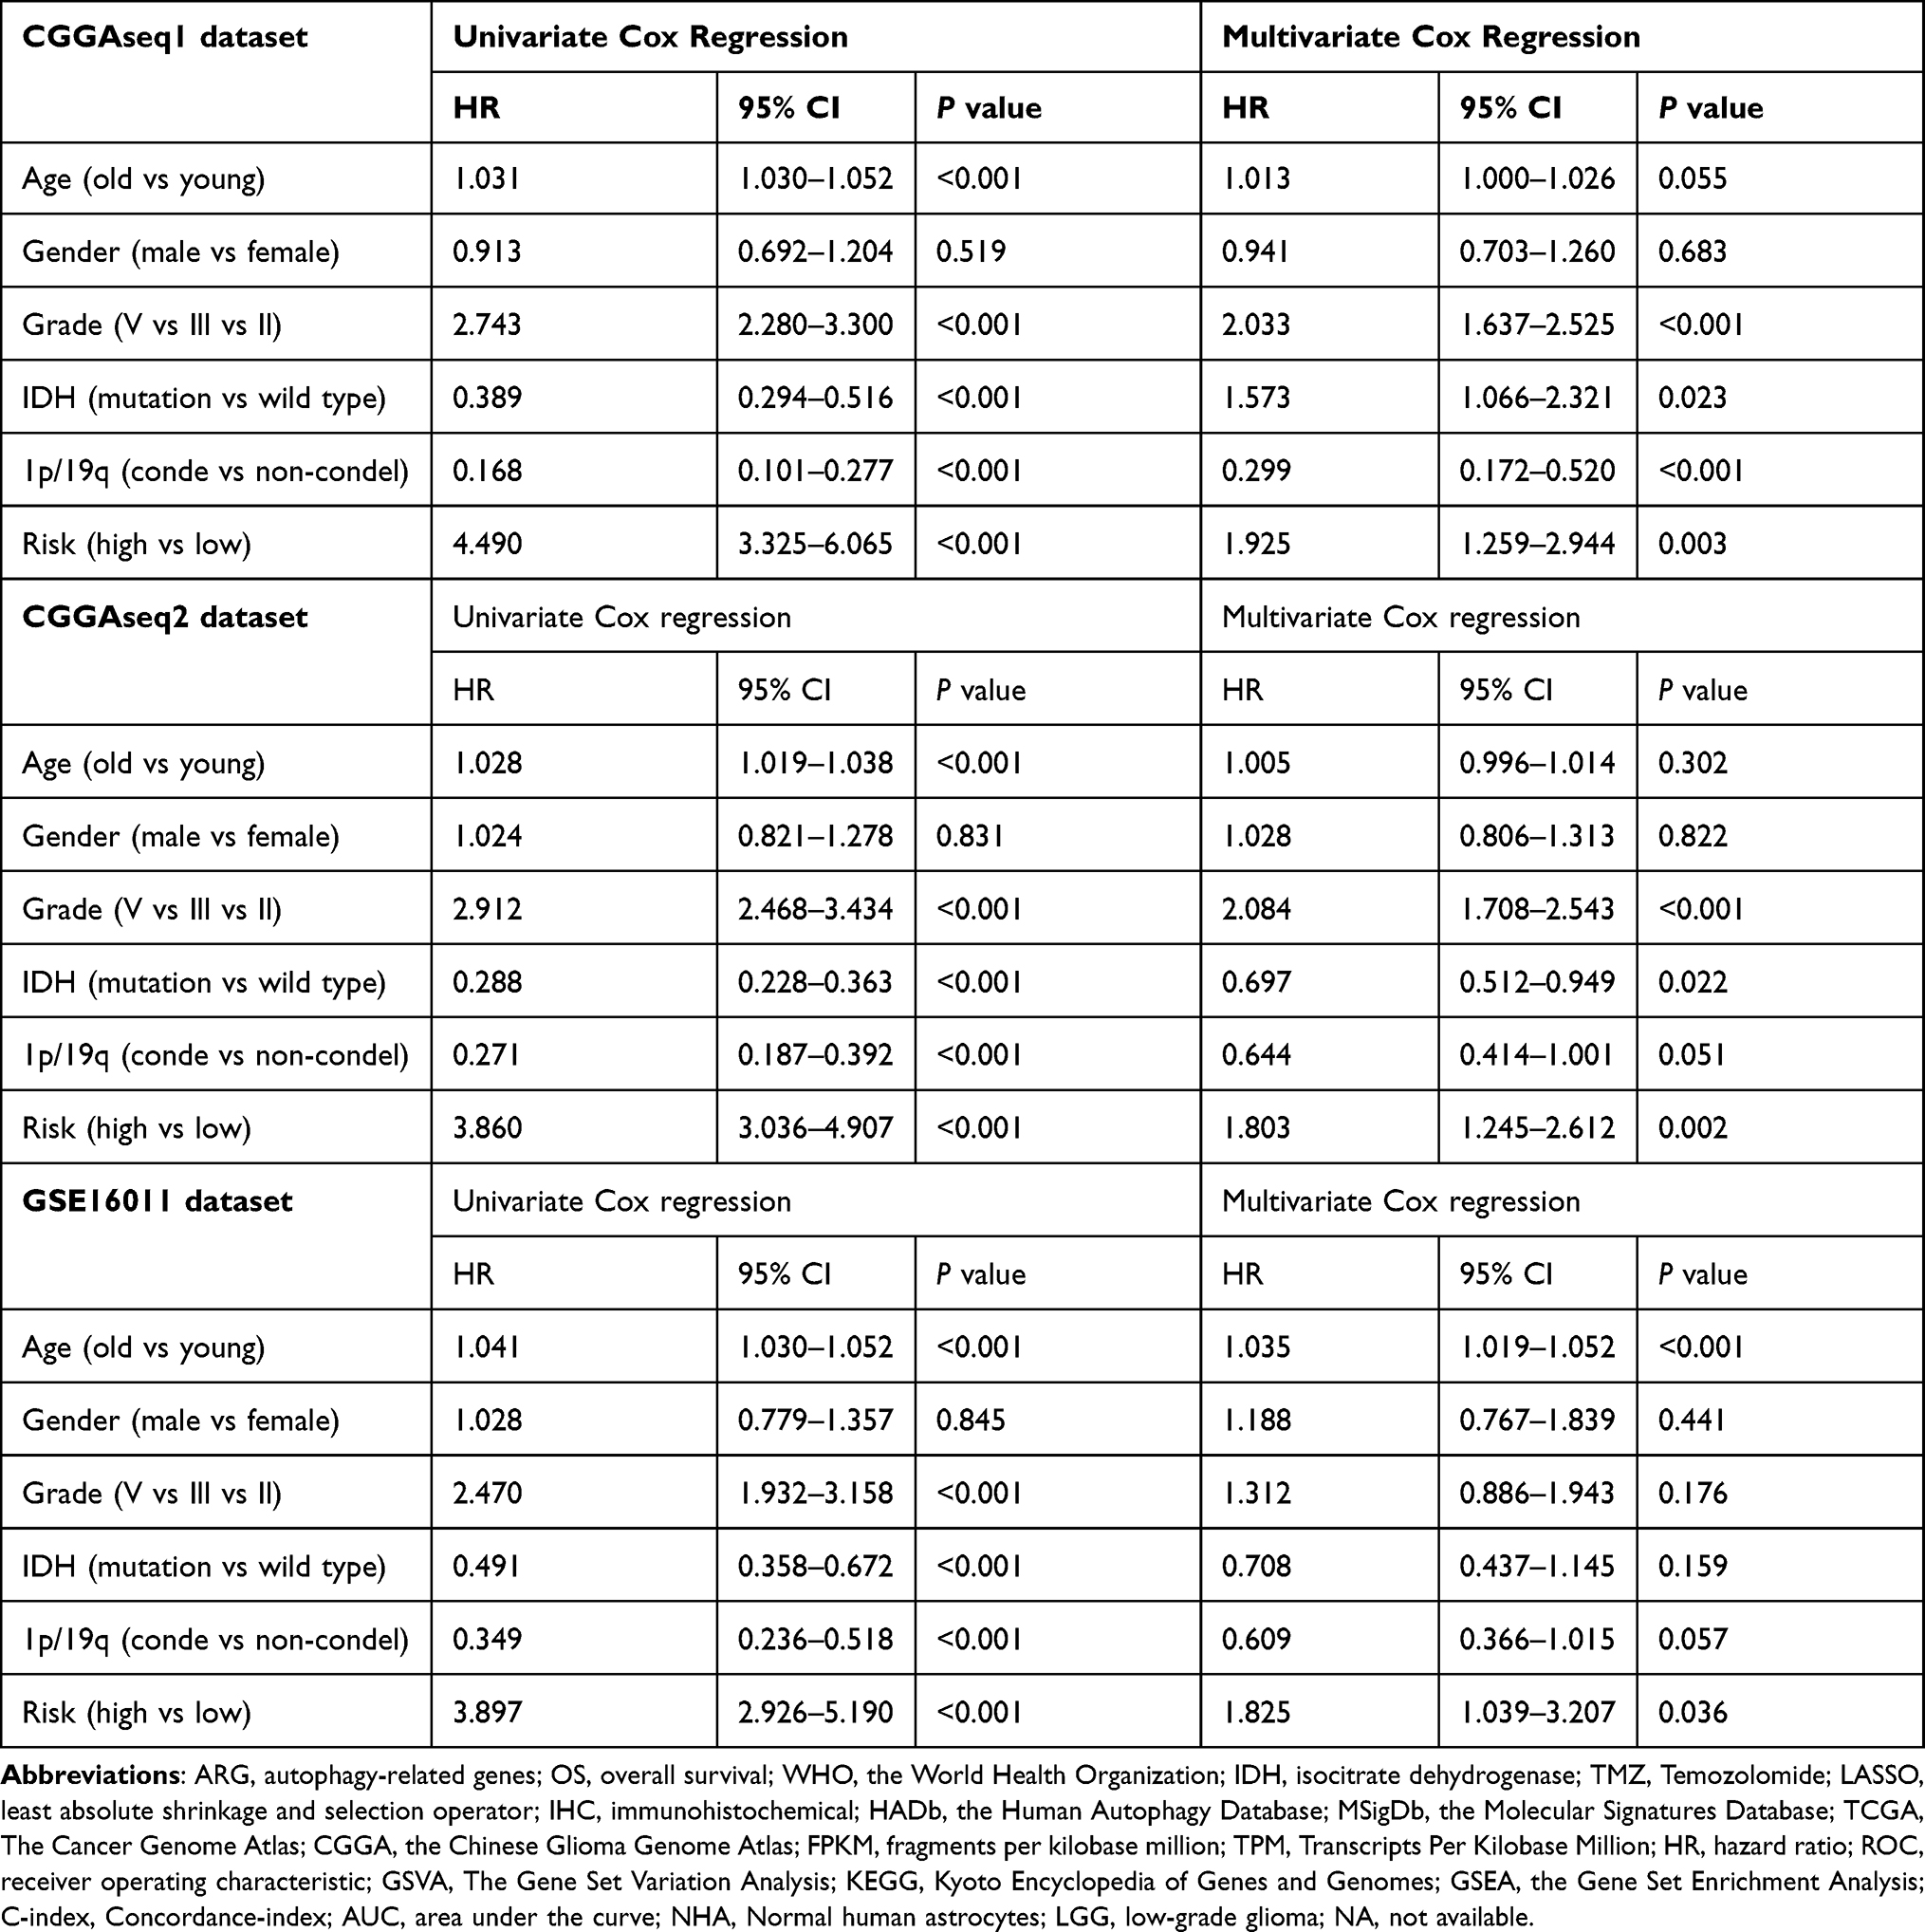 |
Table 2 Univariate Cox Regression Analysis and Multivariate Cox Regression Analysis Outcome Based on the Risk Score and Other Clinical Factors in Validation Cohorts |
Construction and Validation of a Nomogram for Predicting the 1-, 3-, and 5-Year Survival Rates of Patients with Glioma
We established a prognostic nomogram model using TCGA training set with clinicopathological information for predicting the 1-, 3-, and 5-year survival rates of patients with glioma to develop a better clinical application of prognostic prediction in this setting. The external validation cohorts, including the CGGAseq1, CGGAseq2, and GSE16011 datasets were used to evaluate the robustness and stability of the nomogram model. According to the results of the above univariate and multivariate Cox regression analyses, three independent prognostic indicators (age, grade, and autophagy-related risk signature) for patients with glioma were incorporated into the final prediction model. The total points were calculated by adding up the score of each item using the nomogram depicted in Figure 7A.
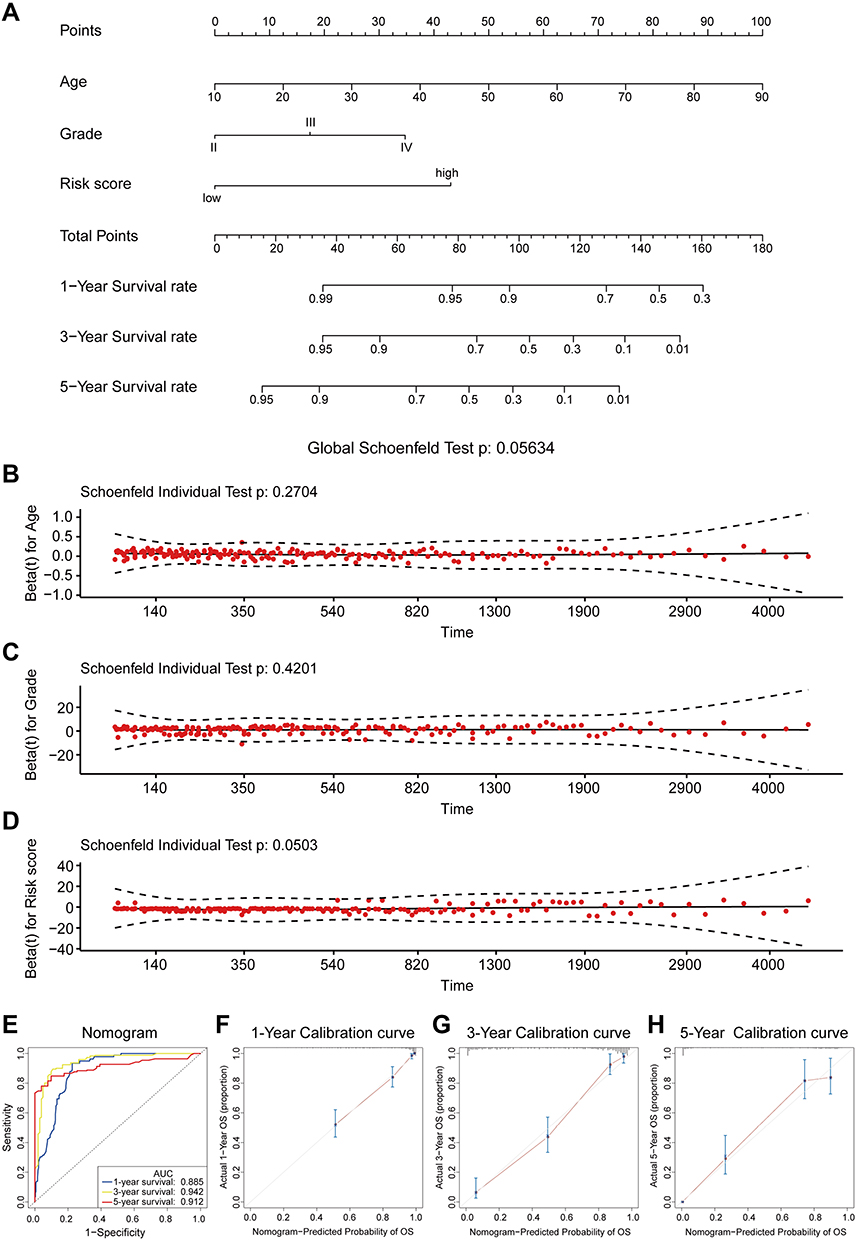 |
Figure 7 Construction and validation of a prognostic nomogram model. (A). A nomogram for predicting the 1-, 3-, and 5- year survival rates of patients with glioma. (B–D). Schoenfeld’s individual and global test for estimating time-varying covariance. (B) Age; (C) Grade; (D) Risk score.(E). ROC curves were used for evaluating the efficiency of the nomogram in the TCGA dataset.(F–H). The calibration plots for predicting patients’ survival at 1- (F), 3- (G), or 5- (H) year in the TCGA dataset. |
The Cox proportional hazard regression assumes that the hazards ratio of any individual variables (age, grade, risk signature) is constant over time. We performed The Cox proportional hazard assumption test based on Schoenfeld residuals and which evaluated by the Schoenfeld’s individual and global test. As shown in Figure 7B–D, the Schoenfeld residual plots indicated that the results of Schoenfeld’s individual and global test did not suggest a violation of the proportional hazard assumption (P>0.05).
C-index, ROC curve, and calibration plot were carried out to evaluate the performance of the nomogram. In TCGA training cohort, the C-index was 0.861±0.024 and the AUC of ROC curves for predicting the 1-, 3-, and 5-year survival rates of patients with glioma were 0.885, 0.942, and 0.912, respectively (Figure 7E). The calibration plots at 1, 3, or 5 years also showed high consistency between the nomogram-predicted probability of OS and actual survival proportion in TCGA cohort (Figure 7F–G). Furthermore, the proposed nomogram was verified in the independent validation cohorts. The C-index was 0.728±0.031, 0.737±0.026, and 0.742±0.030 in the CGGAseq1, CGGAseq2, and GSE16011 datasets, respectively. The AUC values of ROC curves showed excellent predictive ability for the 1-, 3-, and 5-year survival rates (Supplementary Figure 5A–C). As expected, the calibration plots for the three validation cohorts also showed excellent agreement between the nomogram prediction actual survival proportion (Supplementary Figure 5D–L). Therefore, all the evidence above indicated that the proposed nomogram was sufficiently accurate for predicting the 1-, 3-, and 5-year survival rates of patients with glioma.
Discussion
Glioma is a progressive disease with various malignancy grades (I–IV) and histological subtypes, and characterized by significant morbidity and mortality. Based on the traditional classification and grading systems, in addition to diagnosis challenges, the survival time of patients with the same diagnosis may vary from a few weeks or months to several years.23 Tumor heterogeneity remains a major challenge in patient prognosis assessment and precise treatment, leading to wide variations in patient prognosis, treatment response, and drug resistance. In recent years, the exploration of molecular characteristics of glioma has brought new progress in risk stratification and prognosis assessment of patients with glioma.
Increasing evidence revealed that autophagy plays an important role in tumorigenesis, invasiveness, metastasis, and therapeutic resistance of various types of cancer, especially glioma.24,25 Regulation of the disordered ARGs or pathways can inhibit tumor growth and migration and further improve the sensitivity of the tumor to various treatments. Previous studies have shown that miR-519a enhances cell apoptosis by promoting autophagy and targeting the STAT3/Bcl-2/Beclin-1 pathway, rendering glioblastoma sensitive to chemotherapy with temozolomide.26 Inhibition of autophagy using the autophagy inhibitor 3-methyladenine or knockdown of ATG5 or ATG7 in combination with treatment with flavokawain B induced apoptosis in glioma cells and significantly inhibited glioma growth.27 Collectively, this evidence suggests that the investigation of autophagy or ARGs in glioma is of vital importance for risk stratification, prognosis prediction, and the subsequent development of individualized treatment strategies for patients with glioma. ATGs may be promising prognostic indicators and therapeutic targets. In our study, we analyzed the gene expression profiles and clinicopathological data of 1738 glioma samples from four different cohorts and identified 15 optimal OS-related ARGs (CHAF1B, CTSB, LGALS8, CASP4, ANXA5, DIRAS3, ERBB2, ATG9B, NAMPT, VEGFA, TREM1, KCNK3, BID, GRID1, NRG3). Based on the expression of these 15 ARGs, we constructed a new a novel autophagy-related prognostic risk signature, which could be used to classify all patients into high- and low-risk groups. This subgroup was significantly associated with the prognosis of patients with glioma and had different clinical features. To explore the molecular mechanism responsible for the differences in prognosis between the high- and low-risk groups associated with the autophagy-related risk signature, enrichment analyses revealed that main themes including “DNA replication and damage repair,” “cell cycle,” “immune and inflammatory response,” “cell adhesion mediated by integrin,” and “glycan biosynthesis and metabolism” were found to be significantly enriched in the high-risk group. Previous research has illustrated that DNA double strand breaks and DNA replication stress are the most serious damage caused by various physical and chemical substances in the environment and cells to DNA. These can induce a strong “DNA damage response,” as they bear the high risk of cell death and genome instability leading to cancer.28 Proinflammatory cytokines and chemokines secreted by activated immune cells in the tumor microenvironment promote the proliferation of tumor cells.29 Glioblastoma cells recruit innate immune cells and alter their phenotypes to create a microenvironment conducive to tumor development and finally cooperate with normal cells to promote tumor proliferation, brain invasion, immune suppression, and angiogenesis.30 In general, ARGs may exert certain influence on the development of glioma through these biological processes or functional pathways, thus playing an important role in the prognosis of glioma.
Survival analysis showed that the OS of patients in the high-risk glioma subgroup was significantly shorter than that in the low-risk glioma subgroup, and significant separation was still observed in the survival curves between the high- and low-risk glioma subgroups at each level of grades. The risk score was verified successfully in the other three external cohorts and showed good robustness and repeatability. Moreover, Time-dependent ROC showed that the 15 ARGs signatures had relatively high accuracy in predicting patients’ prognosis such as OS at the 1, 3, 5 years (AUC = 0.89, 0.923, 0.889). Next, clinical correlation analysis showed that no significant difference between the high and low risk scores for gender. The older the patient was, the higher the risk score was. With the median age of 47 years as the boundary, the risk scores of patients with glioma older than 47 years were significantly higher than that younger than 47 years. Among them, the high-risk subgroup had high risk scores and enriched with malignant glioma subtypes, including high pathological grade, high WHO grade, IDH wildtype and 1p/19q non-codeleted status, suggesting that ARGs may be a potential biomarker for differentiating glioma prognosis.
In addition, univariate and multivariate analyses combined with other clinicopathological factors showed that this ARG-related risk signature was a satisfactory independent prognostic factor, further confirming the prognostic power of our signature for glioma patients. To improve the clinical application of the ARG-related risk signature, we established a prognostic nomogram model with clinical features (age, WHO grade) for predicting the 1-, 3-, and 5-year survival rates of patients with glioma. This nomogram was constructed and validated in large datasets with long-term follow-up. C-indexes, AUC of ROC curves, and calibration plots verified the excellent performance of the nomogram. In clinical practice, this simple visual scoring system can help both physicians and patients to carry out individualized survival predictions, which will contribute to the choice of better treatment options.
Of these ARGs identified, most have been confirmed to be associated with the development or prognosis of glioma and other cancers. CHAF1B, which is related to the invasiveness, migration, and colony-forming ability of cancer cells, is highly expressed in various malignant tumors.31,32 CTSB plays a key role in the degradation of impaired organelles, tumorigenesis, and malignant development. In a previous study, CTSB was recognized as a radio-responsive protein and its knockdown led to radiosensitivity.33,34 CASP4 was involved in the modulation of focal adhesion, cell detachment, and actin cytoskeleton polymerization, which ultimately controls cell migration and invasion.35 ANXA5, a Ca2+-regulated phospholipid- and membrane-binding protein, is up-regulated in most tumors, including gliomas, and associated with tumor progression, invasion, metastasis, drug resistance, and tumor treatments.36 Previous reports showed that DIRAS3 induced autophagy and inhibited proliferation in ovarian, breast, and gastric cancers.37–39 However, it was upregulated in gliomas, promoting cell proliferation and invasion, which was positively correlated with poor prognosis.40 Inhibition of ERBB2 can enhance radiation-induced inhibition of tumor growth, which is related to mitochondrial-dependent apoptosis.41 Yun et al revealed that a high level of ATG9B expression was associated with glioblastoma multiforme (GBM) compared to low-grade glioma. ATG9B expression was mainly regulated through the Wnt/β-catenin pathway, and knockdown of ATG9B expression in GBM cells suppressed TMZ-induced autophagy as well as TMZ-resistance.42 NAMPT plays a crucial role in cancer cell metabolism, and regulation of NAPMT inhibitors increased the temozolomide-induced apoptosis in glioblastoma cells.43 VEGF, especially VEGF-A, is a major angiogenic factor promoting angiogenesis in multiple solid malignancies.44 The TREM-1 receptor and its signaling pathways contribute to the pathological process of several non-infective acute and chronic inflammatory diseases, including cancer.45 BID plays a key role in the process of apoptosis, and its dysfunction is the foundation of carcinogenesis.46 The nuclear expression of NRG3 was statistically correlated with low tumor grade in breast cancer; however, its function in glioma remains unexplored.47 The role of LGALS8, KCNK3, and GRID1 in tumors, including glioma, has not been specifically reported, which may be a new research direction and worthy of further exploration.
Recently, some researchers have constructed some autophagy-related glioma prognostic models by analyzing gene expression profiles and clinicopathological information. Wei et al constructed an autophagy-related 10-lncRNA-mRNA signature using CGGA dataset. The signature could distinguish GBM from LGG and predict OS in glioma patients, which also validated using TCGA dataset.48 Five-ATG signature identified by Guo et al using two datasets was validated that it had good predictive performance.49 Xu et al used 15ARGs to construct a risk model that could predict the prognosis of glioma patients.50 Most studies only used two datasets for model construction and validation, and the sample size was not large enough. In addition, there are also some signatures composed of more than 20 genes or less than 5 genes. We believed that too many genes may make the models unsuitable for clinical practice, while too few genes may make the models lack certain accuracy. Many models were only developed for LGG subgroup or GBM subgroup, so their application was limited.51–53 Compared with previous studies, our study increased the number of samples and validation sets, and used TCGA dataset as the training set, and CGGAseq1/2 and GSE16011 datasets as validation set (N = 1738). The expression levels of selected genes were verified by experiments, making the results more convincing. In addition to some individual duplicated genes, it was selected again as signature to indicate its important role in glioma prognosis. Besides, the discovery of new genes can further stratify patients, supplement current indicators, and provide new directions or therapeutic targets for autophagy therapy. Nonetheless, the present study had some limitations. Firstly, in terms of data collection, the clinical information utilized in this study is not sufficiently comprehensive. Analysis of additional information, such as neuroimaging information and extent of lesion resection, will be more conducive to establishing an accurate model. This prediction model requires further validation in multi-center, large-scale clinical trials, and prospective studies. In addition, the performance of such models (even well-validated clinical prediction models) will decline over time due to changes in disease risk factors, unmeasured risk factors, treatment measures and treatment background; this phenomenon is termed calibration drift. Therefore, the clinical prediction model requires continuous evolution and dynamic updating.
Conclusion
In conclusion, our study constructed a novel and reliable ARG-related risk signature, which was verified as a satisfactory prognostic marker. The nomogram model could provide a reference for individually predicting the prognosis for each patient with glioma and promoting the selection of optimal treatment.
Ethical Waiver
Our study has been reviewed by the Clinical Research Ethics Committee of Women’s Hospital, Zhejiang University School of Medicine, and the need for ethics approval was waived because all our data belong to public databases including TCGA, CGGA and GEO databases and online websites. The patients involved in the databases have obtained ethical approval. Users can download relevant data for free for research and publish relevant articles. Our study is based on open source data, so there are no ethical issues and other conflicts of interest.
Acknowledgments
The authors gratefully acknowledge contributions from the CGGA project, the TCGA project and GEO repository.
Disclosure
The authors report no conflicts of interest in this work.
References
1. Ostrom QT, Gittleman H, Liao P, et al. CBTRUS statistical report: primary brain and other central nervous system tumors diagnosed in the United States in 2010–2014. Neuro Oncol. 2017;19(suppl_5):v1–v88. doi:10.1093/neuonc/nox158
2. Lapointe S, Perry A, Butowski NA. Primary brain tumours in adults. Lancet. 2018;392(10145):432–446.
3. Wesseling P, Capper D. WHO 2016 Classification of gliomas. Neuropathol Appl Neurobiol. 2018;44(2):139–150. doi:10.1111/nan.12432
4. Hegi ME, Diserens A-C, Gorlia T, et al. MGMT gene silencing and benefit from temozolomide in glioblastoma. N Engl J Med. 2005;352(10):997–1003. doi:10.1056/NEJMoa043331
5. Eckel-Passow JE, Lachance DH, Molinaro AM, et al. Glioma groups based on 1p/19q, IDH, and TERT promoter mutations in tumors. N Engl J Med. 2015;372(26):2499–2508. doi:10.1056/NEJMoa1407279
6. Deng X, Lin D, Chen B, et al. Development and validation of an IDH1-associated immune prognostic signature for diffuse lower-grade glioma. Front Oncol. 2019;9:1310. doi:10.3389/fonc.2019.01310
7. Song LR, Weng JC, Li CB, et al. Prognostic and predictive value of an immune infiltration signature in diffuse lower-grade gliomas. JCI Insight. 2020;5(8). doi:10.1172/jci.insight.133811
8. Zhou Z, Huang R, Chai R, et al. Identification of an energy metabolism-related signature associated with clinical prognosis in diffuse glioma. Aging. 2018;10(11):3185–3209. doi:10.18632/aging.101625
9. Tao C, Huang K, Shi J, Hu Q, Li K, Zhu X. Genomics and prognosis analysis of epithelial-mesenchymal transition in glioma. Front Oncol. 2020;10:183. doi:10.3389/fonc.2020.00183
10. Ravanan P, Srikumar IF, Talwar P. Autophagy: the spotlight for cellular stress responses. Life Sci. 2017;188:53–67.
11. Huang T, Wan X, Alvarez AA, et al. MIR93 (microRNA −93) regulates tumorigenicity and therapy response of glioblastoma by targeting autophagy. Autophagy. 2019;15(6):1100–1111. doi:10.1080/15548627.2019.1569947
12. Feng F, Zhang M, Yang C, Heng X, Wu X. The dual roles of autophagy in gliomagenesis and clinical therapy strategies based on autophagic regulation mechanisms. Biomed Pharmacother. 2019;120:109441. doi:10.1016/j.biopha.2019.109441
13. Wen ZP, Zeng WJ, Chen YH, et al. Knockdown ATG4C inhibits gliomas progression and promotes temozolomide chemosensitivity by suppressing autophagic flux. J Exp Clin Cancer Res. 2019;38(1):298. doi:10.1186/s13046-019-1287-8
14. Huang T, Kim CK, Alvarez AA, et al. MST4 Phosphorylation of ATG4B regulates autophagic activity, tumorigenicity, and radioresistance in glioblastoma. Cancer Cell. 2017;32(6):840–855.e848. doi:10.1016/j.ccell.2017.11.005
15. Lin W, Sun Y, Qiu X, Huang Q, Kong L, Lu JJ. VMP1, a novel prognostic biomarker, contributes to glioma development by regulating autophagy. J Neuroinflammation. 2021;18(1):165. doi:10.1186/s12974-021-02213-z
16. Padmakrishnan C, Easwer H, Vijayakurup V, M GR, Nair S, Gopala S. High LC3/beclin expression correlates with poor survival in glioma: a definitive role for autophagy as evidenced by in vitro autophagic flux. Pathol Oncol Res. 2019;25(1):137–148. doi:10.1007/s12253-017-0310-7
17. Xu S, Tang L, Liu Z, Yang K, Cheng Q. Bioinformatic Analyses Identify a Prognostic Autophagy-Related Long Non-coding RNA Signature Associated With Immune Microenvironment in Diffuse Gliomas. Front Cell Dev Biol. 2021;9:694633. doi:10.3389/fcell.2021.694633
18. Fan Y, Peng X, Li B, Zhao G. Development of autophagy signature-based prognostic nomogram for refined glioma survival prognostication. Biomed Res Int. 2020;2020:1872962. doi:10.1155/2020/1872962
19. Simon N, Friedman J, Hastie T, Tibshirani R. Regularization paths for Cox’s proportional hazards model via coordinate descent. J Stat Softw. 2011;39(5):1–13.
20. Hänzelmann S, Castelo R, Guinney J. GSVA: gene set variation analysis for microarray and RNA-seq data. BMC Bioinform. 2013;14:7. doi:10.1186/1471-2105-14-7
21. Ritchie ME, Phipson B, Wu D, et al. limma powers differential expression analyses for RNA-sequencing and microarray studies. Nucleic Acids Res. 2015;43(7):e47. doi:10.1093/nar/gkv007
22. Abeysekera W, Sooriyarachchi MR. Use of schoenfeld’s global test to test the proportional hazards assumption in the Cox proportional hazards model: an application to a clinical study. J Natl Sci Found Sri Lanka. 2009;37(1):41–45.
23. Chen R, Smith-Cohn M, Cohen AL, Colman H. Glioma subclassifications and their clinical significance. Neurotherapeutics. 2017;14(2):284–297. doi:10.1007/s13311-017-0519-x
24. Amaravadi R, Kimmelman AC, White E. Recent insights into the function of autophagy in cancer. Genes Dev. 2016;30(17):1913–1930. doi:10.1101/gad.287524.116
25. Mowers EE, Sharifi MN, Macleod KF. Functions of autophagy in the tumor microenvironment and cancer metastasis. FEBS J. 2018;285(10):1751–1766. doi:10.1111/febs.14388
26. Li H, Chen L, Li JJ, et al. miR-519a enhances chemosensitivity and promotes autophagy in glioblastoma by targeting STAT3/Bcl2 signaling pathway. J Hematol Oncol. 2018;11(1):70. doi:10.1186/s13045-018-0618-0
27. Wang J, Qi Q, Zhou W, et al. Inhibition of glioma growth by flavokawain B is mediated through endoplasmic reticulum stress induced autophagy. Autophagy. 2018;14(11):2007–2022. doi:10.1080/15548627.2018.1501133
28. Mladenov E, Magin S, Soni A, Iliakis G. DNA double-strand-break repair in higher eukaryotes and its role in genomic instability and cancer: cell cycle and proliferation-dependent regulation. Semin Cancer Biol. 2016;37:51–64. doi:10.1016/j.semcancer.2016.03.003
29. Ferrari SM, Fallahi P, Galdiero MR, et al. Immune and inflammatory cells in thyroid cancer microenvironment. Int J Mol Sci. 2019;20(18). doi:10.3390/ijms20184413
30. Broekman ML, Maas SLN, Abels ER, Mempel TR, Krichevsky AM, Breakefield XO. Multidimensional communication in the microenvirons of glioblastoma. Nat Rev Neurol. 2018;14(8):482–495. doi:10.1038/s41582-018-0025-8
31. Mascolo M, Ilardi G, Merolla F, et al. Tissue microarray-based evaluation of chromatin assembly Factor-1 (CAF-1)/p60 as tumour prognostic marker. Int J Mol Sci. 2012;13(9):11044–11062. doi:10.3390/ijms130911044
32. Peng X, Fu H, Yin J, Zhao Q. CHAF1B knockdown blocks migration in a hepatocellular carcinoma model. Oncol Rep. 2018;40(1):405–413.
33. Malla RR, Gopinath S, Alapati K, Gorantla B, Gondi CS, Rao JS. uPAR and cathepsin B inhibition enhanced radiation-induced apoptosis in gliomainitiating cells. Neuro Oncology. 2012;14(6):745–760. doi:10.1093/neuonc/nos088
34. Zhang X, Wang X, Xu S, Li X, Ma X. Cathepsin B contributes to radioresistance by enhancing homologous recombination in glioblastoma. Biomed Pharmacother. 2018;107:390–396. doi:10.1016/j.biopha.2018.08.007
35. Papoff G, Presutti D, Lalli C, et al. CASP4 gene silencing in epithelial cancer cells leads to impairment of cell migration, cell-matrix adhesion and tissue invasion. Sci Rep. 2018;8(1):17705. doi:10.1038/s41598-018-35792-8
36. Peng B, Guo C, Guan H, Liu S, Sun MZ. Annexin A5 as a potential marker in tumors. Clin Chim Acta. 2014;427:42–48. doi:10.1016/j.cca.2013.09.048
37. Lu Z, Luo RZ, Peng H, et al. Transcriptional and posttranscriptional down-regulation of the imprinted tumor suppressor gene ARHI (DRAS3) in ovarian cancer. Clin Cancer Res. 2006;12(8):2404–2413. doi:10.1158/1078-0432.CCR-05-1036
38. Zou CF, Jia L, Jin H, et al. Re-expression of ARHI (DIRAS3) induces autophagy in breast cancer cells and enhances the inhibitory effect of paclitaxel. BMC Cancer. 2011;11:22.
39. Qiu J, Li X, He Y, Sun D, Li W, Xin Y. Distinct subgroup of the Ras family member 3 (DIRAS3) expression impairs metastasis and induces autophagy of gastric cancer cells in mice. J Cancer Res Clin Oncol. 2018;144(10):1869–1886. doi:10.1007/s00432-018-2708-3
40. Peng Y, Jia J, Jiang Z, Huang D, Jiang Y, Oncogenic LY. DIRAS3 promotes malignant phenotypes of glioma by activating EGFR-AKT signaling. Biochem Biophys Res Commun. 2018;505(2):413–418. doi:10.1016/j.bbrc.2018.09.119
41. Gao L, Li F, Dong B, et al. Inhibition of STAT3 and ErbB2 suppresses tumor growth, enhances radiosensitivity, and induces mitochondria-dependent apoptosis in glioma cells. Int J Radiat Oncol Biol Phys. 2010;77(4):1223–1231. doi:10.1016/j.ijrobp.2009.12.036
42. Yun E-J, Kim S, Hsieh J-T, Baek ST. Wnt/н╡-catenin signaling pathway induces autophagy-mediated temozolomide-resistance in human glioblastoma. Cell Death Dis. 2020;11(9):771.
43. Feng J, Yan PF, Zhao HY, Zhang FC, Zhao WH, Feng M. Inhibitor of nicotinamide phosphoribosyltransferase sensitizes glioblastoma cells to temozolomide via activating ROS/JNK signaling pathway. Biomed Res Int. 2016;2016:1450843. doi:10.1155/2016/1450843
44. Canavese M, Ngo DT, Maddern GJ, Hardingham JE, Price TJ, Hauben E. Biology and therapeutic implications of VEGF-A splice isoforms and single-nucleotide polymorphisms in colorectal cancer. Int J Cancer. 2017;140(10):2183–2191. doi:10.1002/ijc.30567
45. Tammaro A, Derive M, Gibot S, Leemans JC, Florquin S, Dessing MC. TREM-1 and its potential ligands in non-infectious diseases: from biology to clinical perspectives. Pharmacol Ther. 2017;177:81–95.
46. Gryko M, Pryczynicz A, Zareba K, Kedra B, Kemona A, Guzinska-Ustymowicz K. The expression of Bcl-2 and Bid in gastric cancer cells. J Immunol Res. 2014;2014:953203. doi:10.1155/2014/953203
47. Marshall C, Blackburn E, Clark M, Humphreys S, Gullick WJ. Neuregulins 1–4 are expressed in the cytoplasm or nuclei of ductal carcinoma (in situ) of the human breast. Breast Cancer Res Treat. 2006;96(2):163–168. doi:10.1007/s10549-005-9073-z
48. Wei B, Wang L, Zhao J. Identification of an autophagy-related 10-lncRNA-mRNA signature for distinguishing glioblastoma multiforme from lower‑grade glioma and prognosis prediction. Gen Physiol Biophys. 2021;40(4):257–274. doi:10.4149/gpb_2021008
49. Guo JC, Wei QS, Dong L, Fang SS, Li F, Zhao Y. Prognostic value of an autophagy-related five-gene signature for lower-grade glioma patients. Front Oncol. 2021;11:644443. doi:10.3389/fonc.2021.644443
50. Xu Y, Li R, Li X, et al. An autophagy-related gene signature associated with clinical prognosis and immune microenvironment in gliomas. Front Oncol. 2020;10:571189. doi:10.3389/fonc.2020.571189
51. Lin JZ, Lin N. A risk signature of three autophagy-related genes for predicting lower grade glioma survival is associated with tumor immune microenvironment. Genomics. 2021;113(1 Pt 2):767–777.
52. Wang Z, Gao L, Guo X, et al. Development and validation of a nomogram with an autophagy-related gene signature for predicting survival in patients with glioblastoma. Aging. 2019;11(24):12246–12269. doi:10.18632/aging.102566
53. Feng S, Liu H, Dong X, Du P, Guo H, Pang Q. Identification and validation of an autophagy-related signature for predicting survival in lower-grade glioma. Bioengineered. 2021;12(2):9692–9708. doi:10.1080/21655979.2021.1985818
 © 2022 The Author(s). This work is published and licensed by Dove Medical Press Limited. The
full terms of this license are available at https://www.dovepress.com/terms
and incorporate the Creative Commons Attribution
- Non Commercial (unported, 3.0) License.
By accessing the work you hereby accept the Terms. Non-commercial uses of the work are permitted
without any further permission from Dove Medical Press Limited, provided the work is properly
attributed. For permission for commercial use of this work, please see paragraphs 4.2 and 5 of our Terms.
© 2022 The Author(s). This work is published and licensed by Dove Medical Press Limited. The
full terms of this license are available at https://www.dovepress.com/terms
and incorporate the Creative Commons Attribution
- Non Commercial (unported, 3.0) License.
By accessing the work you hereby accept the Terms. Non-commercial uses of the work are permitted
without any further permission from Dove Medical Press Limited, provided the work is properly
attributed. For permission for commercial use of this work, please see paragraphs 4.2 and 5 of our Terms.