Back to Journals » Journal of Inflammation Research » Volume 17
Identification and Validation of Genes Related to Macrophage Polarization and Cell Death Modes Under Mycobacterium tuberculosis Infection
Authors Yang Z, Wang J ![]() , Pi J
, Pi J ![]() , Hu D, Xu J, Zhao Y
, Hu D, Xu J, Zhao Y ![]() , Wang Y
, Wang Y
Received 8 November 2023
Accepted for publication 16 February 2024
Published 29 February 2024 Volume 2024:17 Pages 1397—1411
DOI https://doi.org/10.2147/JIR.S448372
Checked for plagiarism Yes
Review by Single anonymous peer review
Peer reviewer comments 2
Editor who approved publication: Dr Adam Bachstetter
Zisha Yang,1,2,* Jiajun Wang,1,2,* Jiang Pi,1– 3,* Di Hu,1,2 Junfa Xu,1,2 Yi Zhao,1,2,4 Yan Wang1,4
1Guangdong Provincial Key Laboratory of Medical Molecular Diagnostics, The First Dongguan Affiliated Hospital, Guangdong Medical University, Dongguan, Guangdong, 523713, People’s Republic of China; 2Institute of Laboratory Medicine, School of Medical Technology, Guangdong Medical University, Dongguan, Guangdong, 523808, People’s Republic of China; 3The Marine Biomedical Research Institute, Guangdong Medical University, Zhanjiang, Guangdong, 524023, People’s Republic of China; 4Microbiology and Immunology Department, Guangdong Medical University, Dongguan, Guangdong, 523808, People’s Republic of China
*These authors contributed equally to this work
Correspondence: Yan Wang; Yi Zhao, Guangdong Medical University, No. 1 Xincheng Avenue, Songshan Lake, Dongguan, Guangdong Province, 523808, People’s Republic of China, Tel/Fax +86 769 2289 6038, Email [email protected]; [email protected]
Purpose: To investigate the correlation between M1/M2 macrophages (M1/M2 M&phis;) and cell death mode under Mycobacterium tuberculosis (Mtb) infection.
Methods: Raw gene expression profiles were collected from the Gene Expression Omnibus (GEO) database. Genes related to different cell death modes were collected from the KEGG, FerrDb and GSEA databases. The differentially expressed genes (DEGs) of the gene expression profiles were identified using the limma package in R. The intersection genes of M1/M2 M&phis; with different cell death modes were obtained by the VennDiagram package. Hub genes were obtained by constructing the protein–protein interactions (PPI) network and Receiver Operating Characteristic (ROC) curve analysis. The expression of cell death modes marker genes and Hub genes were verified by Western Blot and Quantitative Real-Time Polymerase Chain Reaction (qRT-PCR).
Results: Bioinformatics analysis was performed to screen Hub genes of Mtb-infected M1 M&phis; and different cell death modes, naming NFKB1, TNF, CFLAR, TBK1, IL6, RELA, SOCS1, AIM2; Hub genes of Mtb-infected M2 M&phis; and different cell death modes, naming TNF, BIRC3, MAP1LC3C, DEPTOR, UVRAG, SOCS1. Combined with experimental validation, M1 M&phis; under Mtb infection showed higher expression of death (including apoptosis, autophagy, ferroptosis, and pyroptosis) genes compared to M2 M&phis; and genes such as NFKB1, TNF, CFLAR, TBK1, IL6, RELA, AIM2, BIRC3, DEPTOR show differential expression.
Conclusion: NFKB1, TNF, CFLAR, TBK1, IL6, RELA, AIM2 in Mtb-infected M1 M&phis;, and TNF, BIRC3, DEPTOR in Mtb-infected M2 M&phis; might be used as potential diagnostic targets for TB. At early stage of Mtb infection, apoptosis, autophagy, ferroptosis, and pyroptosis occurred more significantly in M1 M&phis; than that in M2 M&phis;, which may contribute to the transition of Mtb-infected M&phis; from M1-dominant to M2-dominant and contribute to the immune escape mechanisms of Mtb.
Keywords: macrophage polarization, cell death modes, Mycobacterium tuberculosis, bioinformatics analysis, biomarkers
Introduction
Tuberculosis (TB), caused by Mycobacterium tuberculosis (Mtb) infection, is a serious infectious disease. Until the coronavirus disease 2019 (COVID-19) pandemic, TB has been the leading cause of death from a single infectious agent worldwide. According to the Global TB Report 2022, World Health Organization (WHO) estimates that about a quarter of the world’s population has been infected with Mtb.1 Between 2020 and 2021, the burden of drug-resistant TB increased by 3% to 450,000 cases.
During Mtb infection, macrophages (Mφ) are the main target and primary barrier, as well as the main site of immune evasion against innate immunity by Mtb. Mφ can be polarized into multiple states after infection, with M1 (typically activated Mφ) or M2 (alternatively activated Mφ) being predominant.2 M1 Mφ exhibit Mtb-killing and pro-inflammatory effects through high expression of pro-inflammatory and antimicrobial molecules such as interferon-β (IFN-β), interleukin-1β (IL-1β), and tumor necrosis factor (TNF).3 In contrast, M2 Mφ control body inflammation and supports Mtb growth by expressing high levels of anti-inflammatory cytokines such as IL-4, IL-10, and chemokine (CCL22).4,5 In the early stage of Mtb infection, the polarization state of Mφ is mainly M1-type, while in the late stage of infection, M2-associated markers gradually increase, and the Mφ polarization is dominated by M2-type.6 However, up to now, the regression of Mφ subtypes under Mtb infection is still not determined.
Mtb establishes an in vivo infection by parasitizing Mφ, spreads between cells and organs, and ultimately leads to host cell death.7,8 Manipulation of the Mφ death mode in infected macrophages is a potential mechanism for host defense against Mtb.9 However, it is also one of the mechanisms by which Mtb evades host defense.10 Mtb-infected Mφ exhibit multiple modes of death, such as apoptosis, autophagy, ferroptosis, and pyroptosis.11 Apoptosis is the first definitive mode of programmed cell death that reduces intracellular Mtb activity without causing any inflammatory responses. CASP3, as a key enzyme controlling apoptosis, marks the onset of apoptosis.12 Autophagy promotes the maturation of Mφ phagosomes, a defense mechanism by which Mφ removes Mtb and inhibits Mtb growth and reproduction. LC3, as a structural protein of the autophagosome, is an indicator of the occurrence of autophagy.13,14 Degradation of ferritin FTH1 increases intracellular iron levels, which triggers ferroptosis.15 The study by Eduardo et al identified ferroptosis as a major mechanism of Mtb-induced cell death in vitro and highly correlated with the course of Mtb infection.16 Pyroptosis is a lytic cell death mode that is dependent on CASP1, GSDMD, and NLRP3 inflammasomes.17 Mtb infection induces an inflammatory response in Mφ, which leads to pyroptosis.18 However, the correlation between the Mtb-infected Mφ death modes and Mφ polarization has not been illustrated, which greatly affects the understanding of immune regulatory mechanisms under Mtb infection and the immune escape mechanisms of Mtb. Moreover, exploration of biomarkers involved in Mtb-infected Mφ death modes and polarization would also benefit the diagnosis and treatment of TB.
This study screened genes that intersected Mφ polarization with different cell death modes under Mtb infection. Next, Hub genes were identified by constructing PPI networks and ROC curve analyses. Subsequently, we detected the marker genes’ expression of Mtb-infected M1/M2 Mφ death modes in vitro experiments.
Materials and Methods
Data Sources
Original gene expression profiles (GSE5099, GSE52819, GSE54992) were collected from GEO database. Apoptosis, autophagy, ferroptosis, and pyroptosis related genes were collected from the KEGG, FerrDb and GSEA databases. The workflow of the present study is shown in Figure 1.
 |
Figure 1 Workflow chart of the bioinformatics analysis. |
Differential Expression of Death Related Genes (DEDRGs) Analysis
The data of GSE5099, GSE52819 and GSE54992 were analyzed using the “limma” package of R, and the differentially expressed genes (DEGs) were filtered with the thresholds of adj.P.Val<0.05, |logFC|>1. The volcano maps, venn maps, and Pheatmap were plotted using the “ggplot2”, “VennDiagram”, and “Pheatmap” packages of R, respectively.
GO and KEGG Pathway Enrichment Analysis of DEDRGs
Gene Ontology (GO) and Kyoto Encyclopedia of Genes and Genomes (KEGG) enrichment analyses were performed using the “clusterProfiler” package with the standard setting of P<0.05. The GO analysis consisted of cellular component (CC), biological process (BP), and molecular function (MF).
Protein–Protein Interactions (PPI) Analysis of DEDRGs
The STRING database (http://string-db.org) was used to build the PPI network. The Hub genes with the highest degree were analyzed by Hubba plugin of Cytoscape (3.9.1).
Receiver Operating Characteristic (ROC) Curve Analysis
The ROC curve analysis was performed to calculate the area under the curve (AUC) and evaluate the diagnostic value of the Hub genes using gene expression data in GSE54992 with the “pROC” package. Genes with AUC >80% was selected as the candidate gene.
Genetic Correlation Analysis
The dataset GSE54992 was used to map the correlation network of Hub genes with the “corrr” package.
Immune Infiltration Analysis
The proportion of 22 immune cells in the samples of the GSE54992 dataset was obtained using the CIBERSORTx online website (https://cibersortx.stanford.edu/). Box plots and heat maps depicting the level of immune cell infiltration between active TB patients and healthy controls were plotted using the “ggplot2” package.
Macrophage Polarization
THP-1 cells were purchased from ATCC (USA, TIB-202) and cultured using RPM1 1640 and 10% fetal bovine serum (FBS). Logarithmic growth phase cells were taken and inoculated into six-well plates at a density of 1.0×10⁶ per well and treated with 100 ng/mL PMA (SIGMA) for 24 hours to activate to M0 Mφ. After that, M1 Mφ were generated by incubation with 150ng/mL LPS (SIGMA) and 30ng/mL IFN-γ (Sinobiological) for 48 hours. And M2 Mφ were generated by incubation with 30ng/mL IL-4 (Sinobiological) for 48 hours. This study was conducted in accordance with the Helsinki Declaration and was approved by the Institutional Review Ethics Committee of the Affiliated Hospital of Guangdong Medical University.
H37Ra Infects Mφ
H37Ra was cultured and proliferated in 7H9 broth containing OADC (1:10) and ampicillin (1:1000). H37Ra (MOI = 10) was inoculated into the above cultured Mφ and infected for 4 hours, followed by three PBS washes to remove extracellular bacteria for subsequent experiments.
Quantitative Real-Time Polymerase Chain Reaction (qRT-PCR)
Total RNA was extracted from Mφ using RNAiso Plus reagent (TakaRa). mRNA was reverse transcribed to cDNA using the PrimeScript RT kit (TakaRa). qPCR was performed in QuantStudio 6 Flex using SYBR premix Ex Taq II (TakaRa). Relative expression of the genes was calculated using GAPDH as an internal reference gene by 2−ΔCt [2 (−ΔCt sample) / 2(−ΔCt of control)] method. The qRT-PCR oligonucleotide primers are shown in Table 1.
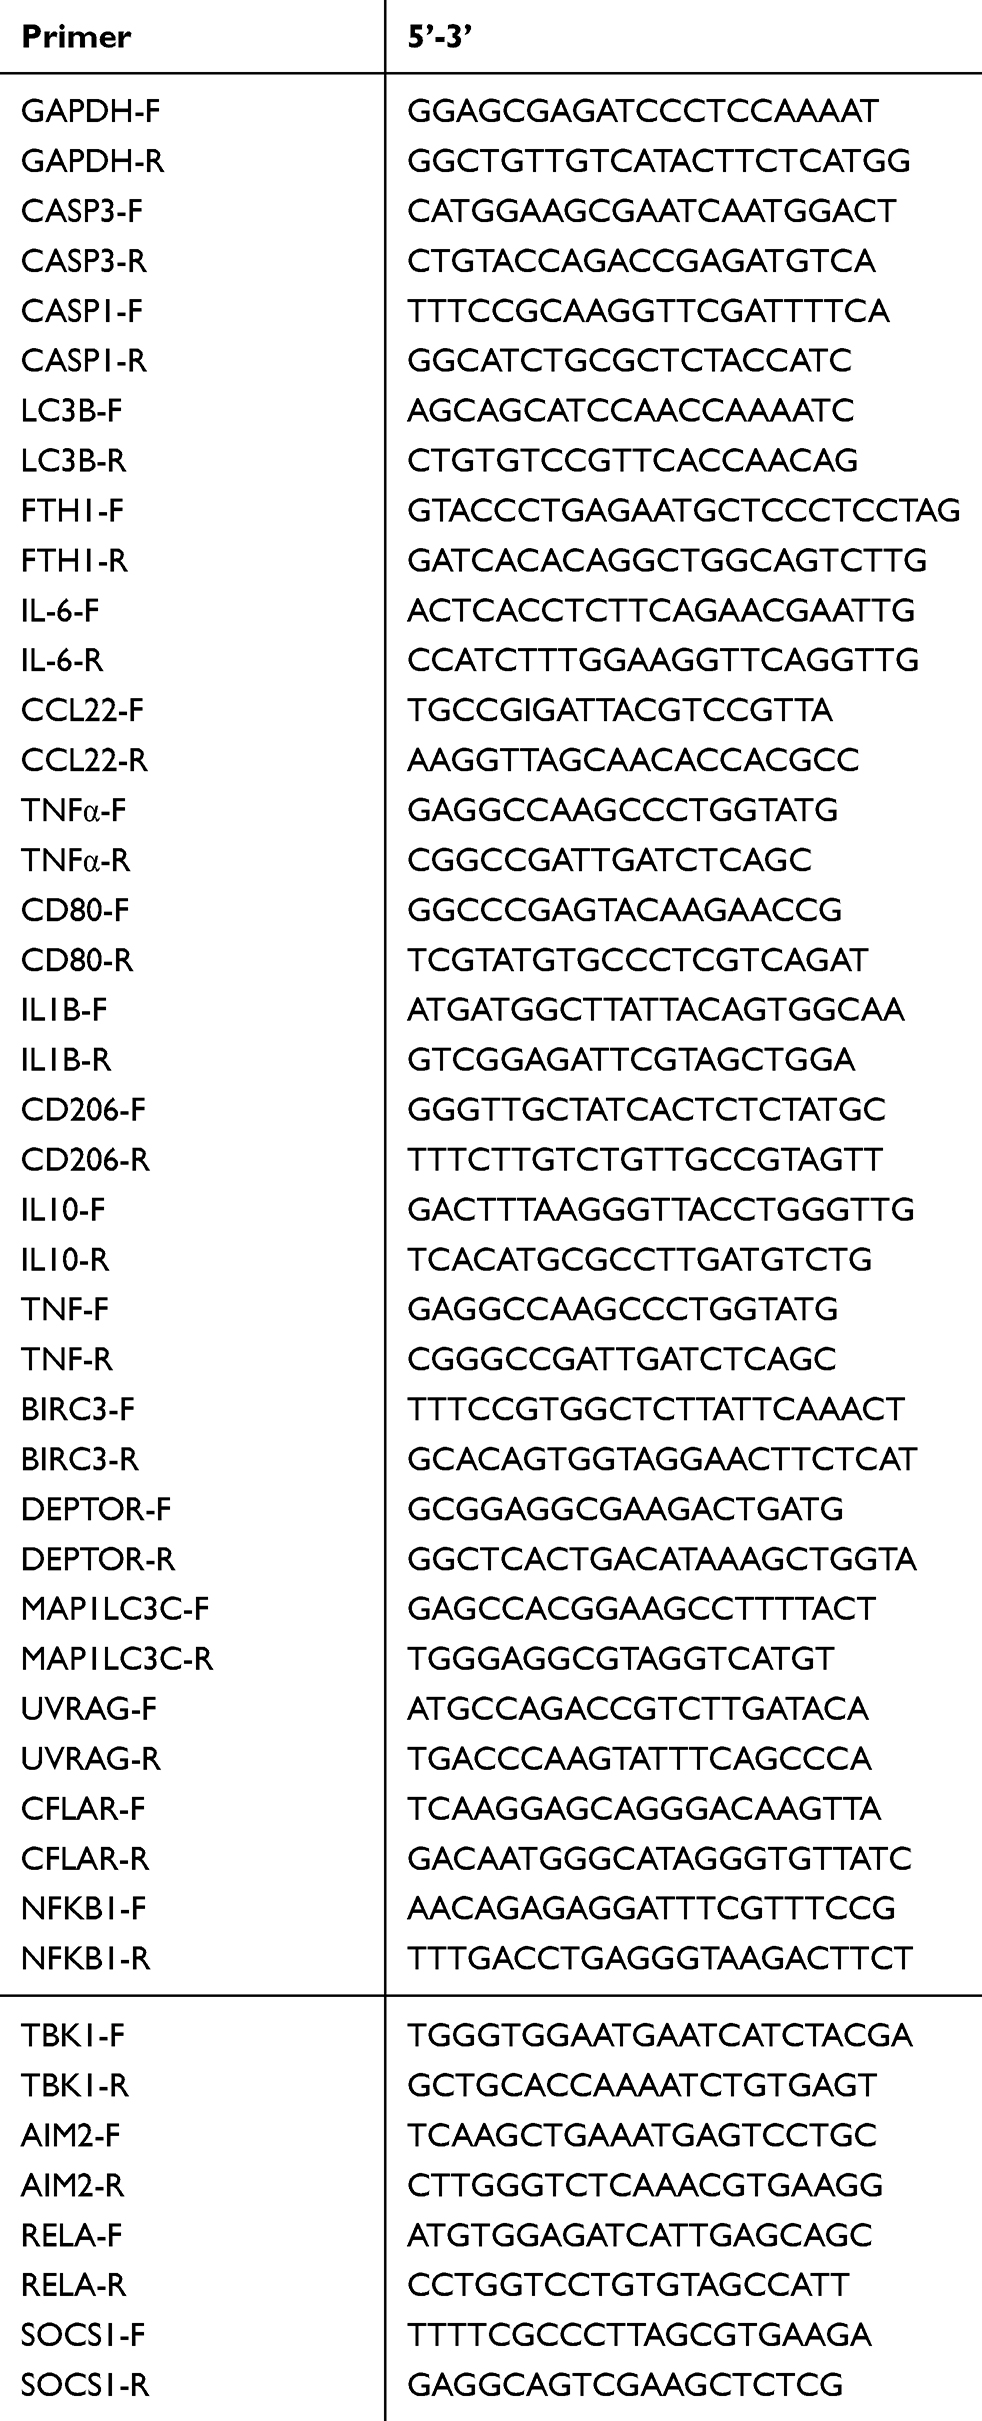 |
Table 1 Primer Sequences Used for qRT-PCR |
Western Blot
Mφ was lysed in RIPA lysis buffer (Beyotime). Protein concentrations were measured using the BCA protein assay kit (Solarbio). GAPDH (proteintech, 10494-1-AP), Tubulin (Affinity Biosciences, DF7967), IL-1β (proteintech, 16806-1-AP), IL-10 (abcam, ab133575), CASP3 (abcam, ab13847), CASP1 (abcam, ab179515), LC3B (abcam, ab225382), FTH1 (Cell Signaling Technology, 4393) antibodies were incubated at 4°C overnight. Further incubation with HRP-linked anti-rabbit IgG Antibody (Beyotime, A0208) was performed for 1 hour at room temperature. Protein bands were visualized by an enhanced chemiluminescence detection kit (Millipore) and quantified using ImageJ software.
Statistical Analysis
All experiments were repeated at least three times. The results were analyzed using GraphPad Prism 9.0 software. Multiple sample data comparison was analyzed using ordinary one-way ANOV. For two sample data, a paired t-test was used to determine P values. Statistical significance was defined as P<0.05. P values were assigned as *P<0.05; **P<0.01; ***P<0.001; and ****P<0.0001.
Results
Identification of DEDRGs Between Normal M0 Mφ and Polarized Mφ Infected with Mtb
We analyzed 3 cases of M0 Mφ, 3 cases of M1 Mφ, and 3 cases of M2 Mφ samples from GSE5099, and identified 2584 DEGs (1535 up-regulated genes and 1049 down-regulated genes) for M1 Mφ and 394 DEGs (327 up-regulated genes and 67 down-regulated genes) for M2 Mφ. In addition, we analyzed 3 cases of Mtb-infected Mφ and 3 cases of untreated Mφ samples from GSE52819, and identified 6417 DEGs (6168 up-regulated genes and 249 down-regulated genes) of Mtb-infected Mφ. These DEGs were presented in a volcano plot (Figure 2A and B).
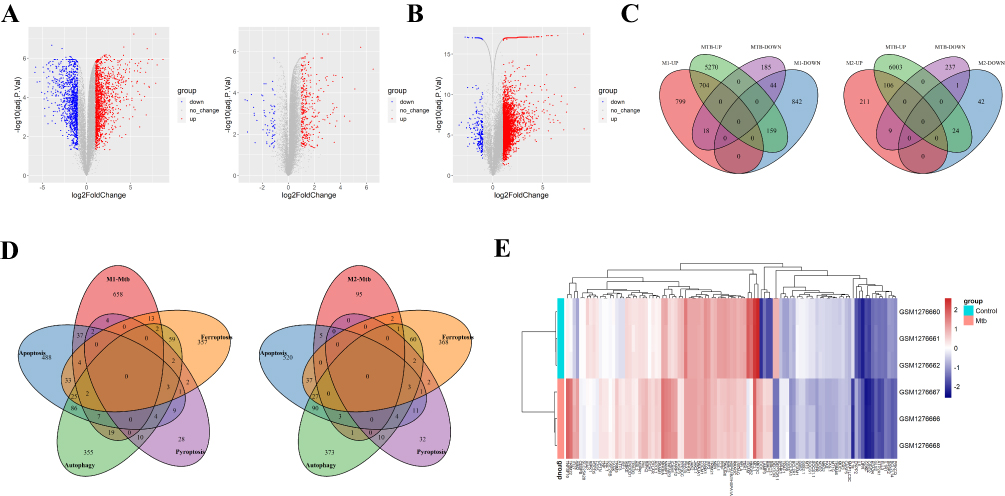 |
Figure 2 Identification of DEDRGs. (A) Volcano map of dataset GSE5099 shows DEGs of polarized Mφ (left: M1 Mφ, right: M2 Mφ). The red dots represent significantly upregulated genes, while the blue dots represent significantly downregulated genes. (B) The volcanic map of dataset GSE52819 shows DEGs of Mtb-infected Mφ. (C) Venn plot shows DEGs of M1/M2 Mφ infected with Mtb. (D) Venn plot shows intersection genes of Mtb-infected M1/M2 Mφ and apoptosis, autophagy, ferroptosis, or pyroptosis related genes, which names differentially expressed death related genes (DEDRGs). (E) Heat map of differential expression of DEDRGs in GSE52819. |
The up- and down-regulated genes of Mφ infected with Mtb intersected with the up- and down-regulated genes of M1/M2 Mφ, respectively. Obtaining 748 DEGs of M1 Mφ infected with Mtb(M1 DEGs, including 704 upregulated genes and 44 downregulated genes), as well as 107 DEGs of M2 Mφ infected with Mtb(M2 DEGs, including 106 upregulated genes and 1 downregulated gene) (Figure 2C). Seven hundred and one apoptosis genes, 574 autophagy genes, 502 ferroptosis genes, and 65 pyroptosis genes were obtained from the database collection. As a result, we obtain the differential expression of death related genes (DEDRGs) of M1/M2 Mφ infected with Mtb through the Venn intersection (Figure 2D, Table 2). The heatmap shows the expression pattern of the DEDRGs in GSE52819 (Figure 2E).
 |
Table 2 Intersection Genes of Differentially Expressed Genes of M1 or M2 Macrophages Infected with Mtb and Death Related Genes (DRIGs) |
GO and KEGG Enrichment Analysis of DEDRGs
We performed GO and KEGG enrichment analysis of DEDRGs from M1 Mφ and M2 Mφ, respectively, to determine the potential functions of DEDRGs in Mtb infection. GO enrichment analysis of M1 DEDRGs revealed that these genes were involved in the regulation of apoptotic signaling pathway, I-kappaB kinase/NF-kappaB signaling, and ubiquitin-like protein ligase binding (Figure 3A). GO enrichment analysis of M2 DEDRGs showed that these genes were involved in the regulation of apoptotic signaling pathway, growth factor receptor binding, and associated with autophagosome (Figure 3B). KEGG enrichment analysis of M1 DEDRGs showed that these genes were associated with signaling pathways such as Apoptosis and NOD like receiver signaling pathway (Figure 3C). KEGG enrichment analysis of M2 DEDRGs showed that these genes were associated with signaling pathways such as Apoptosis, Autophagy-animal, and NF-kappa B signaling pathway (Figure 3D).
 |
Figure 3 Enrichment analysis of DEDRGs. (A) GO enrichment analysis of DEDRGs of M1 Mφ. (B) GO enrichment analysis of DEDRGs of M2 Mφ. (C) KEGG enrichment analysis of DEDRGs of M1 Mφ. (D) KEGG enrichment analysis of DEDRGs of M2 Mφ. |
Identification of Hub Genes
To determine the interactions between DEDRGs, the intersecting genes of Mtb-infected M1 Mφ with apoptosis, autophagy, pyroptosis, and ferroptosis as well as the intersecting genes of Mtb-infected M2 Mφ with apoptosis were subjected to PPI analyses. These PPI networks were also analyzed using the CytoHubba plugin to obtain the Hub genes (M1-Hub, M2-Hub) associated with cell death and M1/M2 Mφ infected with Mtb (Figure 4A and B). Because the number of autophagy and ferroptosis related genes in M2 DEDRGs was too small, all of them were listed as Hub genes (Table 3). Box line plots were drawn to show the differential expression of these Hub genes between the Mtb-infected and uninfected groups in GSE52819 (Figure 4C and D).
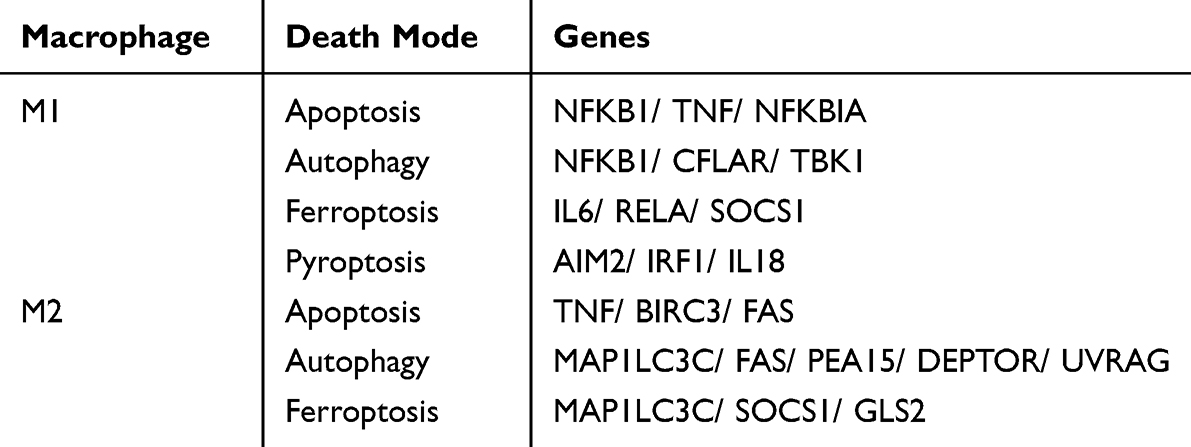 |
Table 3 Hub Genes Were Screened by PPI Analysis |
 |
Figure 4 Screening for Hub genes. (A) The PPI network of DEDRGs in M1 Mφ. Use red to represent the Hub gene. (Upper left: apoptosis, upper right: autophagy, lower left: ferroptosis, lower right: pyroptosis). (B) The PPI network of DEDRGs of M2 Mφ and apoptosis related genes. (C) Box plot of M1 Hub gene expression in GSE52819. (D) Box plot of M2 Hub gene expression in GSE52819. |
ROC Curve Analysis and Correlation Analysis
Peripheral blood expression data of 9 active TB patients and 6 healthy people from GSE54992 were analyzed. These data were utilized to perform ROC curve analysis of the above Hub genes to further validate the reliability of these Hub genes in the peripheral blood of patients (Figure 5A and B). The Hub genes with AUC >80% may have excellent specificity and sensitivity for the next experimental validation, including 8 genes in M1-Hub and 6 genes in M2-Hub (Table 4). Mapping the correlation network of Hub genes showed that in M1-Hub, NFKB1, IL6, and SOCS1 as the center of the network graph were closely correlated with each gene, and in M2-Hub, TNF, BIRC3, DEPTOR, and SOCS1 as the clusters of genes had a strong correlation (Figure 5C and D).
 |
Table 4 Genes to Be Verified |
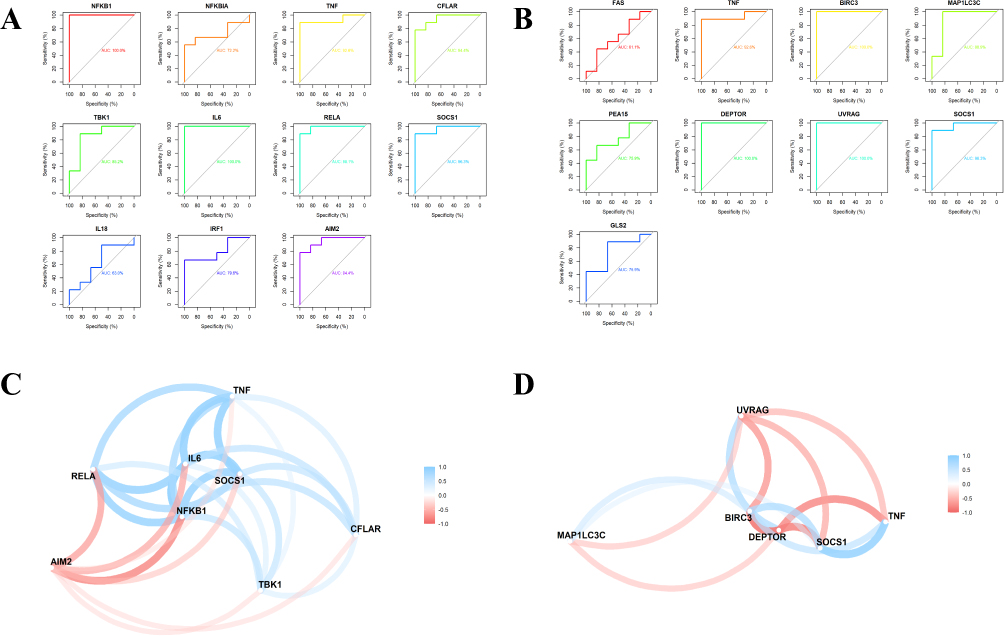 |
Figure 5 ROC curve analysis and correlation analysis. (A) ROC curve screening for M1-Hub with AUC >80%. (B) ROC curve screening for M2-Hub with AUC >80%. (C) Correlation network diagram of M1-Hub. (D) Correlation network diagram of M2-Hub. |
Immune Infiltration Analysis
Boxplots showed that the proportions of Macrophages M0 and Macrophages M1 were significantly lower in active TB samples compared with healthy controls (Figure 6A). Heatmaps showed the correlation of the three types of Mφ with M1-Hub and M2-Hub genes. It was evident that M1 Mφ had a strong correlation with M1-Hub (Figure 6B and C).
 |
Figure 6 Immunoinfiltration analysis. (A) Box plot of differential infiltration of 22 immune cells in tuberculosis patients and healthy people. Using the wilcox.test function for Wilcoxon rank sum test, calculate the p-value between two sets of samples, *P<0.05 **P<0.01 ***P<0.001. (B) The correlation heatmap between M1-Hub and three types of Mφ. (C) The correlation heatmap between M2-Hub and three types of Mφ. Abbreviation: ns, nonsignificant. |
Mφ Polarization
The Mφ polarization process was shown in Figure 7A. qRT-PCR was performed to detect the expression of CD80, IL-1β, TNFα, CD206, IL-10, CCL22 in the three groups (Figure 7B). Compared with M0 Mφ, the M1 Mφ group significantly highly expressed the M1 Mφ marker molecules (CD80, IL-1β, TNFα), while the M2 Mφ group significantly highly expressed the M2 Mφ marker molecules (CD206, IL-10, CCL22). Western Blot verified the expression of M0/M1/M2 Mφ of IL-1β, IL-10 (Figure 7C) and determined that the Mφ was successfully oriented to polarize.
 |
Figure 7 Macrophage polarization. (A) The flowchart of inducing THP-1 polarization into M1/M2 Mφ. Created with BioRender.com. (B) PCR validation of M1/M2 Mφ marker genes. Compare data between multiple groups using one way ANOVA. (C) WB validation of M1/M2 Mφ marker genes. Compare data between multiple groups using one way ANOVA. The statistical chart shows the analysis results of three independent repeated experiments. **P<0.01 ***P<0.001 ****P<0.0001. |
Experimental Proof of Mode of Death
Using M0 Mφ as a control, qRT-PCR and Western Blot were used to detect the expression of marker genes of the cell death modes of M1/M2 Mφ infected with Mtb (Figure 8A and B). It can be seen that the gene expression of CASP3, LC3B, FTH1, and CASP1 in M1 Mφ infected with Mtb was significantly higher than that of M0 Mφ (P<0.05), while there was no significant difference in M2 Mφ (P>0.05). It indicates that the occurrence of apoptosis, autophagy, ferroptosis, and pyroptosis in Mtb-infected M1 Mφ was significantly higher than that in M2 Mφ.
 |
Figure 8 Death modes and Hub genes validation. (A) PCR detection of marker genes of four death modes in M1/M2 Mφ infected with Mtb. (B) WB validation of marker genes of four death modes in M1/M2 Mφ infected with Mtb. The statistical chart shows the analysis results of three independent repeated experiments. Compare data between multiple groups using one way ANOVA. (C) PCR validation of M1 Mφ Hub genes. (D) PCR validation of M2 Mφ Hub genes. The P value is calculated using paid T text. All experiments were conducted with three independent replicates. *P<0.05 **P<0.01 ***P<0.001 ****P<0.0001. |
Validation Hub Genes by qRT-PCR Analysis
M1-Hub and M2-Hub were detected by qRT-PCR, respectively (Figure 8C and D). Compared with M0 Mφ, NFKB1, TNF, CFLAR, TBK1, IL6, RELA, AIM2 were significantly up-regulated in Mtb-infected M1 Mφ, as well as TNF, BIRC3 were significantly up-regulated and DEPTOR was significantly down-regulated in Mtb-infected M2 Mφ, which was in accordance with the results of bioinformatics analysis.
Discussion
As an infectious disease, tuberculosis seriously jeopardizes the life and health security of all human beings. Mφ, as the frontline of innate immune defense, can kill Mtb by controlling self-death.19 However, a large number of Mtb aggregated and internalized within the Mφ phagosome will induce M1 Mφ involuntary deaths and even lead to cell death cascade.20,21 As a result, the Mφ in the organism is biased from M1 Mφ to M2 Mφ,6 promoting the immune escape of Mtb.
Our study obtained the intersecting genes (DEDRGs) of Mtb-infected M1/M2 Mφ with death-related genes from bioinformatics analysis. It was found that there was a difference in the DEDRGs between M1 and M2 Mφ, which indicated that there may be differences in their death modes. To test the role of these DEDRGs in the intrinsic immunity of the organism, we conducted KEGG and GO enrichment analysis and found that they were significantly correlated with the cell death modes. The activation of NF-kappaB signaling promotes BCG infection-induced pyroptosis of THP-1,22 and induces ferroptosis through the widespread effects of multiple factors.23 In addition, NF-kappaB is involved in numerous protein kinase cascades that regulate the crosstalk between autophagy and apoptosis.24 The NOD-like receptor signaling pathway and ubiquitin-like protein ligase binding have also been widely shown to be associated with autophagy.25,26 To further determine the diagnostic value of these DEDRGs, we constructed PPI networks to access highly connected sub-networks in bioregulation and analyzed the AUC values by ROC curves to identify genes with high specificity and sensitivity, thus identifying the Hub genes. In addition, to explore the level of macrophage infiltration in overall immune cells after Mtb infection and the association of Hub genes with two major macrophage subtypes. We performed immune infiltration analyses that showed differences in infiltration of M1 macrophages between TB patients and healthy individuals, as well as a strong correlation between M1 macrophages and M1-hub.
Mφ subpopulations exercise differential control over Mtb infection due to different gene expression patterns, with M1 and M2 Mφ expressing pro-and anti-inflammatory cytokine and chemokines, respectively.27 Our experiments determined that compared to M0 Mφ, the occurrence of apoptosis, autophagy, ferroptosis, and pyroptosis was significantly higher in Mtb-infected M1 Mφ than in M2 Mφ. Thus, inhibition of death in Mtb-infected Mφ may become a key component in controlling Mtb transmission. Exploring the biomarkers associated with Mφ polarization and different death modes under Mtb infection will greatly facilitate the development of this critical link.
Mtb infection promotes the production of the pro-inflammatory cytokine IL-1β, prompts activation of AIM2 inflammasomes to induce pyroptosis or autophagy,28,29 and kills intracellular Mtb in a TBK1-dependent manner.30 In addition, the inflammatory factor TNF activates the NF-kappaB signaling pathway centered on NFKB1 to induce apoptosis and inflammatory responses in Mφ.31,32 In addition, NFKB1 activates autophagy by upregulating the transcription of Beclin 1 (a key autophagy gene).33 Whereas the onset of ferroptosis is induced by activation of IL-6/ferritin signaling,34 and negatively regulated by RELA.35 Among the M2-hub genes, BIRC3 is a closely related member of the inhibitor of apoptosis proteins (IAP family) and plays an important role in apoptosis regulation;36 and DEPTOR acts as an inhibitor of cell proliferation by enhancing autophagy.37 M1 macrophages highly express NFKB1, TNF, AIM2, IL-6 and other Hub genes after Mtb infection, which promote or participate their own apoptosis, autophagy, pyroptosis and ferroptosis. On the contrary, although M2 macrophages highly express Hub genes such as BIRC3 and DEPTOR to lead to death, they have a much lower proportion of the deaths compared with M1 macrophages. As a result, the majority of macrophages in the body gradually changed from M1 type to M2 type. It was experimentally verified that NFKB1, TNF, CFLAR, TBK1, IL6, RELA, and AIM2 were dysregulated in M1 Mφ infected with Mtb. TNF, BIRC3, and DEPTOR were dysregulated in M2 Mφ infected with Mtb. These results showed that there are multiple different death modes in Mφ with different polarization states.
Conclusion
In this work, we validated the potential diagnostic efficacy of NFKB1, TNF, CFLAR, TBK1, IL6, RELA, AIM2, BIRC3, and DEPTOR in TB. We also investigated the correlation between Mφ subtypes infected with Mtb and different death modes and demonstrated that M1 Mφ is more susceptible to apoptosis, autophagy, ferroptosis, and pyroptosis upon Mtb infection, which partially explains the mechanism of the transition of Mtb-infected Mφ from M1-dominant to M2-dominant (Figure 9). This work is not only of great significance for the exploration of potential biomarkers of TB but also provide more deep insights into the innate immune responses against Mtb infection and the immune escape mechanisms of Mtb.
 |
Figure 9 Visualization of the biological process of M1 macrophages undergoing apoptosis, autophagy, pyroptosis, ferroptosis, and gradually transforming into M2 macrophages. Created with BioRender.com. |
Abbreviations
Mtb, Mycobacterium tuberculosis; Mφ, Macrophage; TB, Tuberculosis; IFN-β, Interferon-β; IL-1β, Interleukin-1 β; TNF, Tumor Necrosis Factor; PPI, Protein–Protein Interaction; GO, Gene Ontology; KEGG, Kyoto Encyclopedia of Genes and Genomes; GEO, Gene Expression Omnibus; DEGs, differentially expressed genes; ROC, Receiver Operating Characteristic; qRT-PCR, Quantitative Real-Time Polymerase Chain Reaction; COVID-19, the coronavirus disease 2019; WHO, World Health Organization; DEDRGs, differential expression of death related genes; CC, cellular component; BP, biological process; MF, molecular function; AUC, area under the curve; FBS, fetal bovine serum.
Data Sharing Statement
Data GSE5099, GSE52918, and GSE54992 were downloaded from the Gene Expression Omnibus (GEO) database (https://www.ncbi.nlm.nih.gov/geo/); 701 apoptosis genes were obtained from the KEGG database (https://www.kegg.jp/) and GSEA database (https://www.gsea-msigdb.org/gsea/index.jsp); 574 autophagy genes were obtained from KEGG database, GSEA database and human autophagy database (http://www.autophagy.lu/index.html); 502 ferroptosis genes were obtained from the FerrDb database (http://www.zhounan.org/ferrdb/current/); 65 pyroptosis genes were obtained from the GSEA database.
Acknowledgments
The authors would like to thank all the investigators of the GSE5099, GSE52819, and GSE54992, involved in the present study for sharing the data online and the volunteers involved in the project.
Author Contributions
All authors made a significant contribution to the work reported, whether that is in the conception, study design, execution, acquisition of data, analysis and interpretation, or in all these areas; took part in drafting, revising or critically reviewing the article; gave final approval of the version to be published; have agreed on the journal to which the article has been submitted; and agree to be accountable for all aspects of the work.
Funding
This work was supported by the National Natural Science Foundation of China (82270013, 82272348, 81572566 and 81870016), High Talent Project of Guangdong Province (2021QN02Y720), the Guangdong Basic and Applied Basic Research Foundation (2022A1515010525), Natural Science Foundation of Guangdong Province (2023A1515030195 and 2022A1515011223), Graduate Education Innovation Program Project of Guangdong Province (2022KCXTD010, 2022XSLT047 and 2022SFKC063), the Science and Technology Project of Dongguan (20211800905072), Open Research Fund of Songshan Lake Materials Laboratory (2021SLABFN10), Open Research Fund for Key Laboratory of Tropical Disease Control Sun Yat-sen University and Ministry of Education (2022kfkt01) and Youth Research Projects of Guangdong Medical University (GDMUD2022001), Discipline construction project of Guangdong Medical University (4SG22259G, 4SG23290G, 4SG23030G, 4SG23143G, 4SG22098G and 4SG23077G).
Disclosure
The authors report no conflicts of interest in this work.
References
1. Bagcchi S. WHO’s global tuberculosis report 2022. Lancet Microbe. 2023;4:e20.
2. Mosser DM, Edwards JP. Exploring the full spectrum of macrophage activation. Nat Rev Immunol. 2008;8(12):958–969. doi:10.1038/nri2448
3. Martinez FO, Gordon S. The M1 and M2 paradigm of macrophage activation: time for reassessment. F1000Prime Rep. 2014;6:13. doi:10.12703/P6-13
4. Martinez FO, Helming L, Gordon S. Alternative activation of macrophages: an immunologic functional perspective. Annu Rev Immunol. 2009;27(1):451–483. doi:10.1146/annurev.immunol.021908.132532
5. Lundahl MLE, Mitermite M, Ryan DG, et al. Macrophage innate training induced by IL-4 and IL-13 activation enhances OXPHOS driven anti-mycobacterial responses. eLife. 2022;11:e74690.
6. Huang Z, Luo Q, Guo Y, et al. Mycobacterium tuberculosis-induced polarization of human macrophage orchestrates the formation and development of tuberculous granulomas in vitro. PLoS One. 2015;10:e0129744.
7. Behar SM, Divangahi M, Remold HG. Evasion of innate immunity by Mycobacterium tuberculosis: is death an exit strategy? Nat Rev Microbiol. 2010;8(9):668–674. doi:10.1038/nrmicro2387
8. Moraco AH, Kornfeld H. Cell death and autophagy in tuberculosis. Semin Immunol. 2014;26(6):497–511. doi:10.1016/j.smim.2014.10.001
9. Raja A. Immunology of tuberculosis. Indian J Med Res. 2004;120(4):213–232.
10. Divangahi M, Behar SM, Remold H. Dying to live: how the death modality of the infected macrophage affects immunity to tuberculosis. Adv Exp Med Biol. 2013;783:103–120.
11. Chai Q, Wang L, Liu CH, Ge B. New insights into the evasion of host innate immunity by Mycobacterium tuberculosis. Cell Mol Immunol. 2020;17(9):901–913. doi:10.1038/s41423-020-0502-z
12. Lam A, Prabhu R, Gross CM, Riesenberg LA, Singh V, Aggarwal S. Role of apoptosis and autophagy in tuberculosis. Am J Physiol Lung Cell Mol Physiol. 2017;313:L218–L229.
13. Parzych KR, Klionsky DJ. An overview of autophagy: morphology, mechanism, and regulation. Antioxid Redox Signaling. 2014;20(3):460–473. doi:10.1089/ars.2013.5371
14. Castillo EF, Dekonenko A, Arko-Mensah J, et al. Autophagy protects against active tuberculosis by suppressing bacterial burden and inflammation. Proc Natl Acad Sci USA. 2012;109(46):E3168–E3176. doi:10.1073/pnas.1210500109
15. Chen X, Kang R, Kroemer G, Tang D. Broadening horizons: the role of ferroptosis in cancer. Nat Rev Clin Oncol. 2021;18(5):280–296. doi:10.1038/s41571-020-00462-0
16. Amaral EP, Costa DL, Namasivayam S, et al. A major role for ferroptosis in Mycobacterium tuberculosis–induced cell death and tissue necrosis. J Exp Med. 2019;216(3):556–570. doi:10.1084/jem.20181776
17. Shi J, Zhao Y, Wang K, et al. Cleavage of GSDMD by inflammatory caspases determines pyroptotic cell death. Nature. 2015;526(7575):660–665. doi:10.1038/nature15514
18. Toniolo C, Dhar N, McKinney JD. Uptake-independent killing of macrophages by extracellular Mycobacterium tuberculosis aggregates. EMBO J. 2023;42:e113490.
19. Weiss G, Schaible UE. Macrophage defense mechanisms against intracellular bacteria. Immunol Rev. 2015;264(1):182–203. doi:10.1111/imr.12266
20. Mahamed D, Boulle M, Ganga Y, et al. Intracellular growth of Mycobacterium tuberculosis after macrophage cell death leads to serial killing of host cells. eLife. 2017;6:e22028.
21. Korb VC, Chuturgoon AA, Moodley D. Mycobacterium tuberculosis: manipulator of protective immunity. Int J Mol Sci. 2016;17(3):131. doi:10.3390/ijms17030131
22. Li M, Liu Y, Nie X, et al. S100A4 promotes BCG-induced pyroptosis of macrophages by activating the NF-κB/NLRP3 inflammasome signaling pathway. Int J Mol Sci. 2023;25(1):24. doi:10.3390/ijms25010024
23. Chen Y, Fang ZM, Yi X, Wei X, Jiang DS. The interaction between ferroptosis and inflammatory signaling pathways. Cell Death Dis. 2023;14(3):205. doi:10.1038/s41419-023-05716-0
24. Kaminskyy VO, Zhivotovsky B. Free radicals in cross talk between autophagy and apoptosis. Antioxid Redox Signaling. 2014;21(1):86–102. doi:10.1089/ars.2013.5746
25. Franco LH, Nair VR, Scharn CR, et al. The ubiquitin ligase Smurf1 functions in selective autophagy of Mycobacterium tuberculosis and anti-tuberculous host defense. Cell Host Microbe. 2017;21(1):59–72. doi:10.1016/j.chom.2016.11.002
26. Zhou L, He X, Wang L, et al. Palmitoylation restricts SQSTM1/p62-mediated autophagic degradation of NOD2 to modulate inflammation. Cell Death Differ. 2022;29(8):1541–1551. doi:10.1038/s41418-022-00942-z
27. Khan A, Zhang K, Singh VK, et al. Human M1 macrophages express unique innate immune response genes after mycobacterial infection to defend against tuberculosis. Commun Biol. 2022;5(1):480. doi:10.1038/s42003-022-03387-9
28. Ning B, Shen J, Liu F, Zhang H, Jiang X. Baicalein suppresses NLRP3 and AIM2 inflammasome-mediated pyroptosis in macrophages infected by Mycobacterium tuberculosis via induced autophagy. Microbiol Spectr. 2023;11:e0471122.
29. Qu Z, Zhou J, Zhou Y, et al. Mycobacterial EST12 activates a RACK1-NLRP3-gasdermin D pyroptosis-IL-1β immune pathway. Sci Adv. 2020;6:eaba4733.
30. Pilli M, Arko-Mensah J, Ponpuak M, et al. TBK-1 promotes autophagy-mediated antimicrobial defense by controlling autophagosome maturation. Immunity. 2012;37(2):223–234. doi:10.1016/j.immuni.2012.04.015
31. Kundu M, Pathak SK, Kumawat K, et al. A TNF- and c-Cbl-dependent FLIP(S)-degradation pathway and its function in Mycobacterium tuberculosis-induced macrophage apoptosis. Nat Immunol. 2009;10(8):918–926. doi:10.1038/ni.1754
32. Liu Z, Wang J, Dai F, Zhang D, Li W. DUSP1 mediates BCG induced apoptosis and inflammatory response in THP-1 cells via MAPKs/NF-κB signaling pathway. Sci Rep. 2023;13(1):2606. doi:10.1038/s41598-023-29900-6
33. Lin F, Ghislat G, Luo S, Renna M, Siddiqi F, Rubinsztein DC. XIAP and cIAP1 amplifications induce Beclin 1-dependent autophagy through NFκB activation. Hum Mol Genet. 2015;24(10):2899–2913. doi:10.1093/hmg/ddv052
34. Yang L, Wang H, Yang X, et al. Auranofin mitigates systemic iron overload and induces ferroptosis via distinct mechanisms. Signal Transduct Target Ther. 2020;5(1):138. doi:10.1038/s41392-020-00253-0
35. Zhou N, Bao J. FerrDb: a manually curated resource for regulators and markers of ferroptosis and ferroptosis-disease associations. Database. 2020;2020. doi:10.1093/database/baaa021
36. Yamato A, Soda M, Ueno T, et al. Oncogenic activity of BIRC 2 and BIRC 3 mutants independent of nuclear factor-κB-activating potential. Cancer Sci. 2015;106(9):1137–1142. doi:10.1111/cas.12726
37. Yao H, Tang H, Zhang Y, et al. DEPTOR inhibits cell proliferation and confers sensitivity to dopamine agonist in pituitary adenoma. Cancer Lett. 2019;459:135–144. doi:10.1016/j.canlet.2019.05.043
 © 2024 The Author(s). This work is published and licensed by Dove Medical Press Limited. The
full terms of this license are available at https://www.dovepress.com/terms
and incorporate the Creative Commons Attribution
- Non Commercial (unported, 3.0) License.
By accessing the work you hereby accept the Terms. Non-commercial uses of the work are permitted
without any further permission from Dove Medical Press Limited, provided the work is properly
attributed. For permission for commercial use of this work, please see paragraphs 4.2 and 5 of our Terms.
© 2024 The Author(s). This work is published and licensed by Dove Medical Press Limited. The
full terms of this license are available at https://www.dovepress.com/terms
and incorporate the Creative Commons Attribution
- Non Commercial (unported, 3.0) License.
By accessing the work you hereby accept the Terms. Non-commercial uses of the work are permitted
without any further permission from Dove Medical Press Limited, provided the work is properly
attributed. For permission for commercial use of this work, please see paragraphs 4.2 and 5 of our Terms.