Back to Journals » International Journal of General Medicine » Volume 14
Identification and Development of Subtypes with Poor Prognosis in Gastric Cancer Based on Both Hypoxia and Immune Cell Infiltration
Authors Wang Y, Sun J, Yang Y, Zebaze Dongmo S, Qian Y, Wang Z
Received 26 June 2021
Accepted for publication 15 October 2021
Published 6 December 2021 Volume 2021:14 Pages 9379—9399
DOI https://doi.org/10.2147/IJGM.S326647
Checked for plagiarism Yes
Review by Single anonymous peer review
Peer reviewer comments 3
Editor who approved publication: Dr Scott Fraser
Yao Wang,1,* Jingjing Sun,1,* Yang Yang,1,* Sonia Zebaze Dongmo,2 Yeben Qian,1 Zhen Wang3
1Department of General Surgery, The First Affiliated Hospital of Anhui Medical University, Hefei, People’s Republic of China; 2Department of Neurosurgery, The First Affiliated Hospital of Anhui Medical University, Hefei, People’s Republic of China; 3Department of General Surgery, Feixi County People’s Hospital, Hefei, People’s Republic of China
*These authors contributed equally to this work
Correspondence: Yeben Qian
Department of General Surgery, The First Affiliated Hospital of Anhui Medical University, Hefei, 230022, People’s Republic of China
Email [email protected]
Zhen Wang
Department of General Surgery, Feixi County People’s Hospital, Hefei, 231200, People’s Republic of China
Email [email protected]
Purpose: Hypoxia and immune cell infiltration play an important role in the progression and metastasis of gastric cancer. However, the molecular classification of gastric cancer combined with hypoxia and immune cell infiltration remains unknown.
Materials and Methods: ssGSEA was used to evaluate the hypoxic state and immune cell infiltration of 1059 gastric cancer samples collected from the GEO and TCGA database. Based on the results, unsupervised clustering was performed to obtain different gastric cancer subtypes. The differentially expressed genes related to OS between these subtypes were utilized for LASSO analysis to construct a prognostic signature (HIscore). Subsequently, small-molecule drugs were predicted using the Connectivity Map (CMAP) database.
Results: We obtained three hypoxic-immune infiltration patterns (HIcluster A-C) with different prognoses and classified them as low hypoxic/low immune, high hypoxic/high immune, and low hypoxic/high immune subtypes. Based on the differential genes between HIclusters, we have also obtained other three gastric cancer subtypes (genecluster A-C) and a 13-gene signature (HIscore). At the same time, we extensively explored the clinical and transcriptome traits in different clusters and groups with high or low HIscore. We proved that HIscore is an independent prognostic biomarker and an indicator of genome stability and EMT. Using the CMAP database, we found 96 small-molecule drugs that could reverse the poor prognosis and could serve as therapeutic drugs, especially for gastric cancer patients with high HIscore.
Conclusion: Our study evaluated the hypoxic state and immune cell infiltration in gastric tumors, and identified different gastric cancer subtypes. In addition, we established a hypoxia-immune signature to predict prognosis which is tightly linked to tumor EMT and genomic stability. Based on HIscore, we used the CMAP database to explore small-molecule drugs that may have the potential in serving as therapeutic drugs.
Keywords: hypoxia, tumor microenvironment, genome instability, microsatellites, mutation burden
Introduction
Gastric cancer is the fourth most common incident cancer and the third most common cause of cancer death.1 In addition, previous literature suggests that gastric cancer is a heterogeneous disease featuring many distinct histological and molecular subtypes.2 As an example, Lauren classification, proposed in 1965, has been recognized by both clinicians and pathologists and continues to be used. However, the limitations of Lauren classification as a prognostic predictor are also gradually unveiled. Currently, whether intestinal type gastric cancer patients have better prognosis in comparison with diffuse-type patients remains controversial.3,4 Even more, Lauren classification could not be used as an independent prognostic factor on large population-based studies, calling into question their reliability.5,6
The exploration of gastric cancer subtypes used for diagnosis and treatment has never stopped in recent years. In 2014, according to key DNA defects and molecular abnormalities, The Cancer Genome Atlas Consortium (TCGA) group described four subtypes for gastric cancer including Epstein–Barr virus (EBV)-positive, microsatellite instability (MSI), gene stable (GS), and chromosome instability (CIN) types.7 Moreover, Oh et al indicated two different transcriptomic subtypes in gastric cancer, MP and EP, where the MP subtype was closely linked to significantly poor survival and resistance to chemotherapy.8 So an in-depth exploration and development of tumor subtypes of gastric cancer is imperative to improve therapeutic effects and prognosis.
Hypoxia is an important and common feature of solid tumors.9 The occurrence of this condition is generally considered to be caused by the unrestricted proliferation of the tumor and the hypertonicity and tortuosity of the vascular network in the tumor.10,11 The disturbance of immune cell infiltration in tumors caused by hypoxia has been widely discussed, such as myeloid-derived suppressor cells (MDSCs) and tumor-associated macrophages (TAMs) which are important components in TME. Tumor-associated macrophages (TAMs) derived from Macrophages were found to preferentially appear in hypoxic areas of tumors.12 In tumor-bearing mice, a quick increase of PD-L1 is observed in MDSCs, macrophages, dendritic cells, and tumor cells under hypoxia, and this phenomenon depends on an oxygen-regulated subunit HIF-1α. At the same time, Noman et al also found that T cell activation mediated by MDSCs can be significantly enhanced when PD-L1 is blocked under hypoxic conditions, which is evidence for the simultaneous inhibition of PD-L1 and HIF-1α can be utilized as novel immunotherapy.13
In previous literatures, it has received heightened attention that the heterogeneity of hypoxia or tumor immune cell infiltration can be used to guide the therapeutic strategy and predict the prognosis in different kinds of cancers.14–16 However, most of the studies were based on only hypoxia or tumor immune cell infiltration. The research on identification of tumor subtypes by combining the characteristic of both hypoxia and immune cell infiltration is regrettably scarce.
In this study, we tried to utilize a large sample size of gastric cancer transcriptome data to describe the characteristics of tumor hypoxia and immune-related cell infiltration. Combining these two characteristics, we attempt to develop hypoxia-immune classifiers to identify gastric cancer subtypes with different biological features and outcome.
Materials and Methods
Retrieval, Downloading, and Processing of Gene Expression Profiles in Patients with Gastric Cancer
Cohorts with patient survival information or relatively complete clinical information were retrieved from the Gene-Expression Omnibus (GEO) and the Cancer Genome Atlas (TCGA) database. We selected several qualified cohorts and downloaded all their expression profiles and corresponding clinical information (including GSE15459, GSE34942, GSE57303, GSE62254/ACRG, GSE84437, GSE26253, and TCGA-STAD) (Supplementary Table 1).17,18 The above data were all downloaded from the website https://portal.gdc.cancer.gov/ and https://www.ncbi.nlm.nih.gov/geo/. In the TCGA database, we also obtained somatic mutation data of patients with gastric cancer.
We converted high-throughput sequencing data (FPKM) from TCGA-STAD to transcripts per kilobase million (TPM) values.19 R software and the “ComBat” algorithm are used to remove batch effects and then we merge five of the cohorts (GSE15459, GSE34942, GSE57303, GSE62254 (ACRG), GSE84437) into one GC (gastric cancer) metadata for further analysis (n=1059).20 We also downloaded the transcriptome data and clinical information of GSE13911, including the patient’s microsatellite status information.
We download GSE114083 as another validated data set, which contains mRNA and lncRNA data of gastric cancer cell lines treated with hypoxia (n=4) and normoxia (n=4).
Unsupervised Clustering for Hypoxic and Immune-Related Characteristic Gene Sets
We extracted a total of 23 different immune cell marker gene sets from Charoentong P’s research,21 and we searched and selected 13 gene sets that up-regulated with Hypoxic in the Molecular Signatures Database.22,23 These 36 gene sets in total are shown in Supplementary Table 2.
We capitalized on the ssGSEA (single-sample gene-set enrichment analysis) algorithm in the “GSVA” R packages to measure the enrichment scores of these 36 gene sets in each patient of the GC metadata.24 These enrichment scores were considered to represent the infiltration of immune cells and the intensity of hypoxia in tumors. By integrating the enrichment scores of these 36 gene sets, we put the Consensus ClusterPlus package into service to complete unsupervised clustering analysis and identified different hypoxic-immune patterns in gastric cancer patients. The above algorithm ran repeatedly 1000 times to ensure the stability of the results.25
ESTIMATE algorithm was used to predict tumor purity, and the presence of infiltrating stromal/immune cells in tumor tissues in different clusters, and output stromal score, immune score, and estimate score (Supplementary Table 3).26 In addition to the ssgsea algorithm, we also used CIBERSORT analysis to calculate the 22 types of immune cell proportions in the tumor, and select samples with P<0.05 for the next step to verify (n=974) the accuracy of the hypoxic-immune patterns and further analysis.27
Determination of Differential Genes Between Hypoxic-Immune Patterns and Construction of Hypoxic-Immune Gene Signature
Based on differences in immune cell infiltration and hypoxia pathway enrichment, we divide gastric cancer patients into three hypoxic-immune patterns. To obtain differentially expressed genes (DEGs) related to different hypoxic-immune types, limma R package was utilized in every two patterns. We set the screening criteria to “FDR < 0.05”.28 A web-based portal, Metascape, was utilized to conduct biological functional enrichment analysis of these DEGs and we considered p < 0.01 statistically significant.29
Univariate Cox proportional hazard regression analysis was utilized to extract prognosis-related genes in ACRG samples, with p < 0.05 as the criteria.
With the above prognostic-related genes, we performed unsupervised clustering in the ARCG data set and we classified patients into several clusters for the next analysis. We used R package, glmnet, to perform the least absolute shrinkage and selection operator (Lasso) Cox regression analysis, and selected the potential prognostic genes to construct a prognostic model. According to the median score of this model (HIscore), gastric cancer patients were divided into high-HIscore groups and low-HIscore groups.

The Coefi means the coefficients, and xi is the TPM of each gene included in the model.
Identification of candidate small-molecule drugs for gastric cancer patients with high HIscore.
The CMAP database (https://portals.broadinstitute.org/cmap/), composed of 7056 gene expression profiles induced by 1309 small molecules, is widely applied to explore the potential unknown roles of existing drugs on diseases.30
The R package “limma” was utilized to identify DEGs in the high and low HIscore samples in ACRG and TCGA cohorts, respectively. The criteria for DEG screening were as follows: false discovery rate (FDR) <0.01. The top quarter DEGs with largest |log2 (fold change)| were extracted from the up-regulated and down-regulated DEGs, respectively. We take the intersection of The top quarter up-regulated and down-regulated DEGs in ACRG and TCGA, respectively, and the result obtained is used as the input file of the CMAP database. Then, we obtained the potential small drug molecules, and P < 0.05 was regarded as the cut-off criteria.
Acquisition of Biological Processes
We obtained 21 biological processes from previous studies and the KEGG database,31 shown in Supplementary Table 4, including EMT1, EMT2, angiogenesis, antigen processing and presentation, antigen processing machinery, CD8 T effector, immune checkpoint, base excision repair, cell cycle, DNA damage repair, DNA replication, mismatch repair, ECM–receptor interaction, JAK-STAT signaling pathway, MAPK signaling pathway, NF-kappa B signaling pathway, nucleotide excision repair, Pan-F-TBRS, PI3K-Akt signaling pathway, TGF-beta signaling pathway, Wnt signaling pathway. We not only calculated and compared their enrichment scores in different patient clusters but also obtained the correlation between them and hypoxic-immune scores (HIscore) through Pearson’s correlation analysis (Supplementary Table 5).32
Tumor Mutation Burden, Microsatellite Status, Genomic Instability
We downloaded the somatic mutation data of gastric cancer patients in TCGA and calculated the number of mutation events/million bases as tumor mutation burden (TMB). Non-coding alterations were excluded from TMB calculation.33 Microsatellite instability information was downloaded from The Cancer Immunome Atlas (https://tcia.at/) including MSS (microsatellite stability, n=229), MSI-H (microsatellite instability-high, n=59), MSI-L (microsatellite instability-low, n=49). In the TCGA cohort, we also developed a framework for evaluating genome stability. Sorting the patients according to the accumulated number of somatic mutation genes from high to low, the first 25% were considered to be the group genome unstable (GU), and the last 25% were considered to be the group genome stable (GS).34
Gene Set Enrichment Analysis
GSEA was performed between hypoxia and normoxia gastric cancer cell lines in GSE114083. The number of random sample permutations was set at 1000, and NOM p-value <0.05, FDR q-value <0.25, and | NES | > 1 were set as the significance threshold.35
Statistical Analysis
Correlations were assessed using Pearson’s coefficients. A Kruskal–Wallis test was used in the comparison between three or more groups and a Wilcox test was used in the comparison between two groups. We used the median value of HIscore in ACRG as the cutoff value, and with the cut-off, we divided the gastric cancer patients into the corresponding data set into high and low HIscore groups. Kaplan–Meier method was adopted to generate survival curves, Log rank tests were utilized to determine whether there is a significant difference in prognosis between high and low groups.36 The hazard ratios (HR) of genes related to patient classification are obtained from univariate Cox regression analysis. Whether it is an independent prognostic factor is judged by multivariable Cox regression analysis.37 Multivariable Cox regression analysis was only used for gastric cancer patient data sets with detailed clinical information (ACRG and TCGA-STAD). The results of multivariable Cox regression analysis were visualized by the forest plot. The R package timeROC was used to generate the receiver operating characteristic, and the AUC was also calculated to evaluate the specificity and sensitivity of the HIscore. A combined nomogram was established as a quantitative tool for predicting the likelihood to die of each patient using the “regplot” R package. The concordance index (C-index) was calculated to assess the consistency between model prediction and actual clinical outcomes of patients. The calibration plot was established to evaluate the accuracy of the prediction for 1-, 3-, and 5-year overall survival using this nomogram by the “rms” R package.
The somatic mutation landscape between high and low HIscore groups was obtained from TCGA-STAD, and the R package maftools were used for visualization.38 In all the above statistical processes, p < 0.05 means statistical significance. We utilized R software for data processing and analysis, version 4.0.4.
Results
Hypoxic-Immune Infiltration Patterns
We merged GSE15459, GSE34942, GSE57303, GSE62254, and GSE84437, and then we obtained a large sample size meta-cohort with complete patient survival information. With the R package Consensus ClusterPlus, we divided patients in meta-cohort into different subtypes based on the enrichment scores of 23 immune cell-related gene sets and 13 hypoxia-related gene sets. Based on such unsupervised two-dimensional hierarchical clustering, we identified three distinct HIclusters (hypoxic-immune cluster) with different immune infiltration and hypoxic states (Figure S1A), including 416 cases in HIcluster A, 372 cases in HIcluster B, and 271 cases in HIcluster C (Figure 1A). Kaplan–Meier analysis pointed out that there are significant differences in OS among the three subgroups (Figure S1B). The median survival time of patients in HIcluster C was 10.30 years, and the median survival time of HIcluster A and HIcluster B was 7.13 years and 4.80 years, respectively. HIcluster C has the best 5-year survival rate of 51.7%, while the 5-year survival rates of HIcluster A and HIcluster B are 45.5% and 39.8%, respectively. This implies that gastric cancer patients with low hypoxia and high immune characteristics may have a better prognosis.
 |
Figure 1 Gastric cancer subtypes with different immune cell infiltration and hypoxia status. (A) Unsupervised clustering of 36 gene sets related to hypoxia or Immune cell infiltration in GC metacohort including the 5 independent stomach cancer cohorts. Each column represented patients and each row represented the enrichment scores for these gene sets. The clinical information collated serves as the patient’s annotation. Differences in stromal scores (B), immune score (C) and estimate score (D) between different HIcluster. The Kruskal–Wallis test was used to compare the statistical difference between HIcluster. (E) The component differences of immune cells among the three HIcluster analyzed by CIBERSORT. Differences in PD-L1 (F) and CTLA4 expression (G) among three HIclusters in GC metadata. The Kruskal–Wallis test was used to compare the statistical difference. (***p < 0.001.). |
The expression level of gene HIF1A in HIcluster B was significantly higher than HIcluster A and HIcluster C (Figure S1C). We scaled and compared the enrichment scores of 23 immune-related gene sets and 13 hypoxia-related gene sets in different HIclusters involved in unsupervised clustering (Figure S1D and E). The enrichment scores of all hypoxia-related gene sets in HIcluster B were significantly higher than HIcluster A and HIcluster C. The trend of the enrichment scores of CD56dim natural killer cell and neutrophil in HIclusters was similar to that of hypoxia-related gene sets, both of which were that HIcluster B is significantly higher than other groups. The enrichment scores of other immune cell infiltration-related gene sets were the highest in HIcluster C, the lowest in HIcluster A, and the middle level in HIcluster B. The stromal score obtained by the ESTIMATE algorithm was significantly lower in HIcluster A than the other two groups, while there was no difference in stromal scores between HIcluster B and C (Figure 1B). The immune score and estimate score were the lowest in HIcluster A and the highest in HIcluster C (Figure 1C and D). The differences between the three groups are statistically significant. By CIBERSORT analysis, 22 types of immune cell proportions in different clusters are shown in Figure 1E. The median expression of immune checkpoint genes PDL1 and CLTA4 was the lowest in HIcluster A, and that of CLTA4 was the highest in HIcluster C. There was no significant difference in the median expression of PDL1 between HIcluster B and C (Figure 1F and G).
Combining the above results, HIcluster A was classified as low hypoxic/low immune subtype, HIcluster B was classified as high hypoxic/high immune subtype and HIcluster C was classified as low hypoxic/high immune subtype.
Construction of Hypoxic-Immune Signatures and Functional Annotation
Because the ACRG cohort has more comprehensive clinical information on the 300 gastric cancer patients, we extracted the ACRG cohort from the meta-cohort to study the clinical and biological characteristics in the ACRG cohort that may be closely linked to different hypoxic-immune infiltration patterns. Similar to the clustering results of meta-cohort, ACRG cohort also found three different hypoxic-immune infiltration patterns (Figure S2A and B). Through the limma R package, we obtained 5607 differentially expressed genes between HIcluster A and B, 7770 differentially expressed genes between HIcluster A and C,2776 differentially expressed genes between HIcluster B and C. Taking the intersection of these genes, we obtained a total of 880 DEGs that were significantly differentially expressed in the three clusters (Figure S2C). A web-based portal, Metascape, was utilized to conduct biological functional enrichment analysis of the DEGs. When P < 0.01 is considered statistically significant, we obtained a total of 1907 enriched biological processes (Supplementary Table 6). The top 20 enrichment results with the smallest p-value are shown in Figure S2D. Many results were related to activation of an immune response, immune cell recruitment, such as GO:0046649 (lymphocyte activation), GO:0002366 (leukocyte activation involved in immune response), and GO:0050900 (leukocyte migration). The largest number of DEGs (133) was enriched in lymphocyte activation, and its p-value was the smallest (Log10 P=−60.86).
With univariate Cox regression analysis, we selected 293 OS-related genes from the ACRG cohort of 880 DEGs (p<0.05), and they are shown in Supplementary Table 7.
Based on these 293 genes, unsupervised clustering analyses were performed in the ARCG cohort to classify patients into different subtypes. Similar to the results of clustering based on immune infiltration and hypoxia gene sets, we obtained three different genomic phenotypes (HIgenecluster A–C) (Figure 2A and B; Supplementary Table 8). It implied that three different hypoxia-immune infiltration patterns do exist. The median survival time of HIgenecluster B–C was 7.453 and 1.970 years, and the 5-year survival rates of HIgenecluster A–C were 56%, 58.5%, 28.8%, respectively (Figure 2C).
 |
Figure 2 Identify different genomic subtypes in ACRG cohort. (A) Consensus matrices of the ACRG cohort for k = 3. (B) Unsupervised clustering of overlapping hypoxia-immune-related genes in ACRG cohorts to classify patients into different genomic subtypes (genecluster A–C). The geneclusters, HIclusters, molecular subtypes, stage, gender, survival status and age were utilized as patient annotations. (C) Survival analyses for the three geneclusters in ACRG cohort including 132 cases in gencluster A, 116 cases in genecluster B, and 52 cases in genecluster C. Kaplan–Meier curves with Log rank p value< 0.001 showed a significant survival difference among three geneclusters. Genecluster C showed significantly worse OS than the other two genclusters. |
In the Lauren classification of gastric cancer obtained in the ACRG cohort, we found that the diffuse subtype occupies the largest proportion in genecluster C, and the intestinal subtype occupies the largest proportion in genecluster A. In geneclusters A–C, the proportion of diffuse subtypes gradually increased, and the proportion of intestinal subtypes gradually decreased (Table 1, Figure 3A). Interestingly, tumor patients with EMT molecular subtypes have an absolute advantage in HIgenecluster C, while genecluster C does not include MSI molecular subtype, tumor patients. In genecluster, the proportion of patients with molecular subtypes MSS/TP53+ or MSS/TP53- is less than that of geneclusters A and B. The molecular subtypes of gene clusters A and B are the same (Table 1, Figure 3B). In addition, we also compared the proportion of patients with EMT subtypes in different tumor stages and T stages with HIgeneclusters, and found that they were much smaller than that in the HIgenecluster C group (Figure 3C and D).
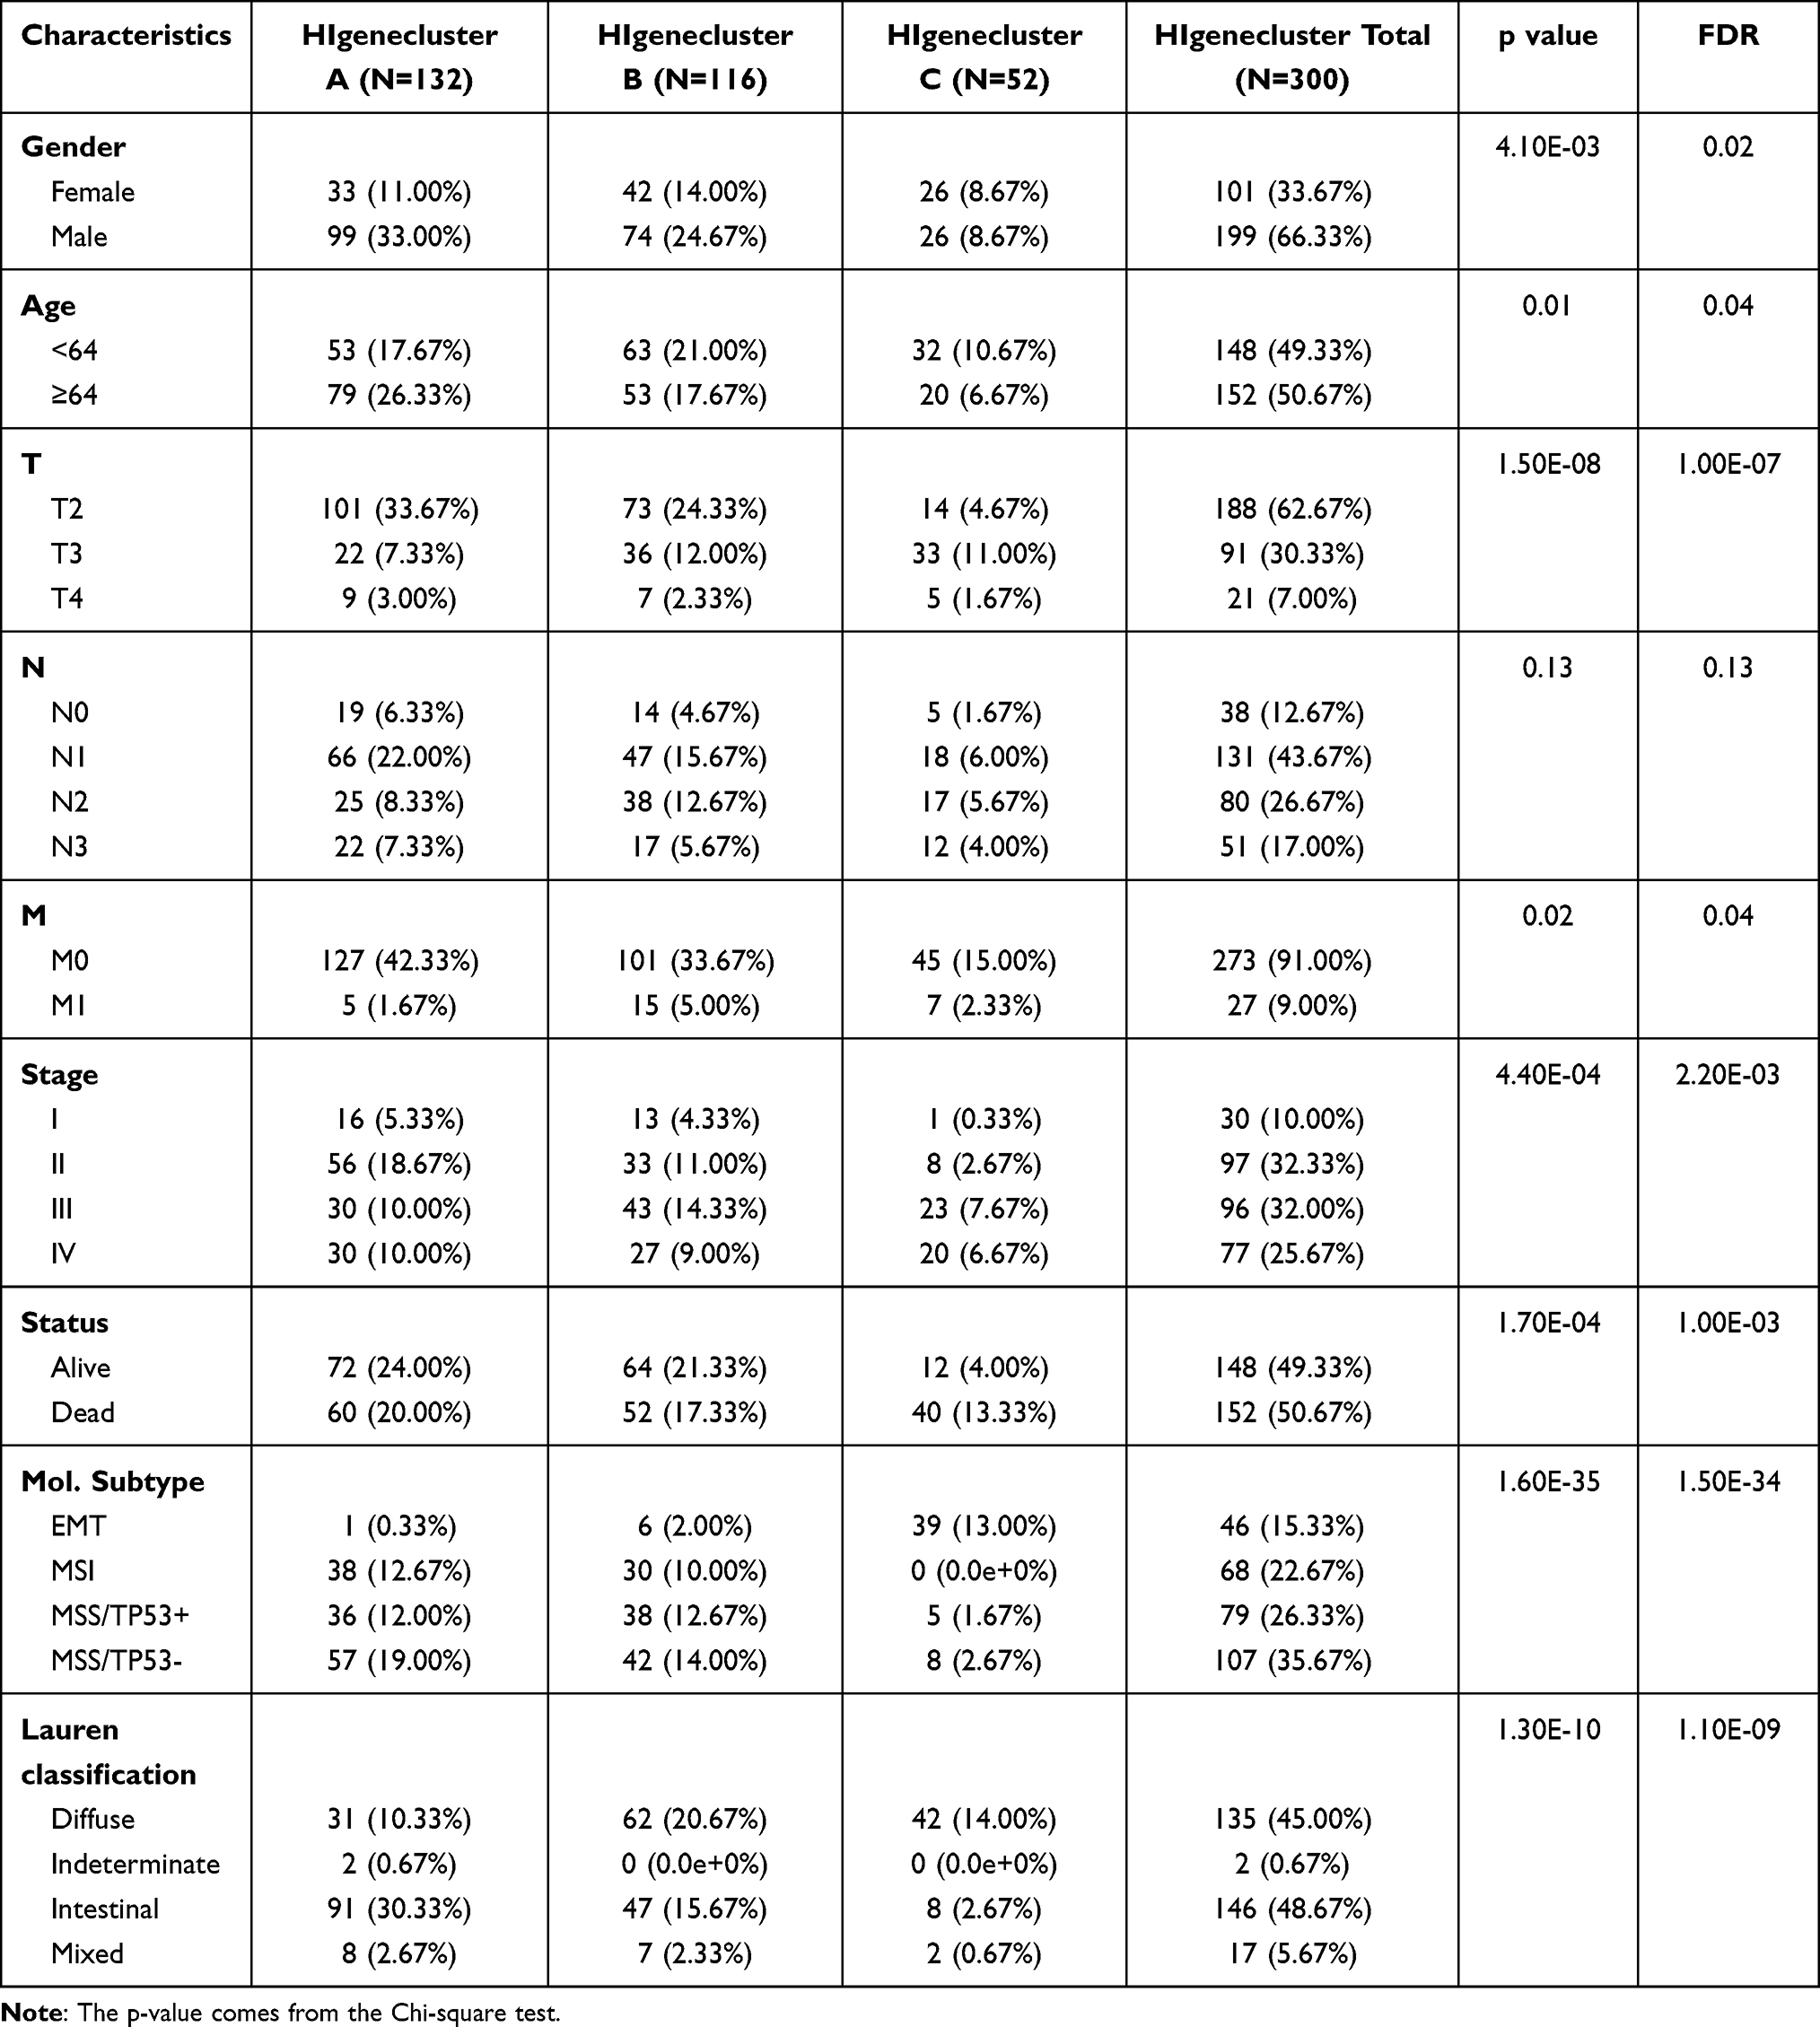 |
Table 1 Clinicopathological Characteristics in Relation to Different HIgeneclusters in ARCG Cohorts |
 |
Figure 3 The proportion of Lauren-classifications (A) and ACRG molecular subtypes (B) in the three geneclusters. The proportion of ACRG molecular subtypes in different T stages (C) and tumor stages (D). (E) Difference in the expression of 21 known biological processes related to tumor progression among three geneclusters. The upper and lower ends of the boxes represented interquartile range of values. The lines in the boxes represented median value, and black dots showed outliers. The asterisks represented the statistical p value (****P < 0.0001). |
Characteristics of Transcriptome Traits in Different Hypoxic-Immune-Related Genecluster (HIgenecluster)
We have collated and obtained 21 biological processes from previous studies and the KEGG database. The sources of these biological processes, the genes involved in these processes, and the enrichment scores of each sample in ACRG were shown in (Figure 3E).
The processes EMT1 and EMT2 have the highest enrichment scores in HIgenecluster C, which was mutually corroborated the fact that the EMT subtype (molecular subtypes in ACRG cohort) in HIgenecluster C accounts for a large proportion. And the enrichment scores of EMT1 and EMT2 in HIgeneclusterB were higher than that of HIgenecluster A. Immune-related biological processes, such as Antigen processing and presentation, CD8 T effector, etc were enriched more in HIgenecluster B. Surprisingly, for some pathways that related to genome stability, such as Nucleotide excision repair, base excision repair, DNA damage repair, DNA replication Mismatch repair, etc, all revealed a low enrichment in HIgenecluster C. Other signal pathways closely related to the occurrence and development of tumors also had significant differences between different geneclusters.
Based on the enrichment results of these biological processes in different HIgeneclusters, we classified HIgenecluster B as an immune-activation group, and HIgenecluster C classified as EMT-Genomic stability group. Combined with classification and previous research, the poor prognosis of gastric cancer patients in HIgenecluster C has been explained to a certain extent.
Construction of the Hypoxic-Immune-Related Signature
Based on the previously obtained 293 Hypoxic-immune infiltrations phenotype-related DEGs, unsupervised clustering allowed us to identify a part of patients with poor prognosis (HIgenecluster C). In order to dig deeper into their prognostic value, we constructed a hypoxic-immune-related signature. With ACRG cohort as the training set, the Lasso Cox Regression Analysis was utilized to construct the hypoxic-immune-related signature, and 13 hypoxic-immune-related signatures were built for predicting the overall survival of cular sugastric carcinoma patients (Figure S3A and D). Based on the TPM value and related coefficients of these 13 signatures, we obtained the risk scores (HI score) of each patient.
HIscore = (BEX4*0.060280828757125) + (BTN3A2*0.0480478080183311) + (CCDC50*0.221803823749138) + (CLIP4*0.0185094741736464) + (COL4A1*0.0245555436398619+CPE*0.0137755467630004) + (HLA.DRB6*-0.0326550077240013) + (JAZF1*0.0282045392726293) + (LMO2*0.0299067833201967)+(PSMB10* - 0.120416260002512) + (RASGRP2*0.0162557186287523) + (MXD1*-0.007241171408135) + (ZNF326* - 0.114149705889599).
According to the median value (1.61406348) of HI-score in the ACRG cohort, patients were divided into high HIscore group (n=150) and low HIscore group (n=150). Kaplan–Meier survival curves depicted the specifically remarkable survival advantage in the high HIscore group (P<0.0001) (Figure S3B). The median survival time of the high HIscore group (2.3556 years) was worse than that of the low HIscore group (>7.133 years). The 5-year survival rates of the low HIscore group were better than that of the high HIscore group (66.6% VS 36.5%). ROC curves indicated that HI-score ability to predict OS is extraordinary in the ACRG cohort (3-year AUC = 0.72, 5-year AUC = 0.73, 8-year AUC = 0.74; Figure S3C).
We utilized the same formula to obtain the HIscore of each gastric cancer patient in the TCGA cohort and made the median value of the HIscore (1.61406348) in the ACRG cohort as the cut-off to classify the patients into a high HIscore group (n=70) and a low HIscore group (n=267). ACRG cohort was utilized as a validation set to test the robustness and stability of hypoxic-immune-related signatures. The K–M survival curves attested to the higher HIscore were related to the better OS (Figure S3E). The median survival time of the high HIscore group (1.663 years) was worse than that of the low HIscore group (3.1589 years). The 3-year survival rates of the low HIscore group were better than that of the high HIscore group (53.1% VS 31.9%). The ROC analysis indicated that the AUC of predicting 5-year OS in the TCGA cohort was 0.7 (Figure S3F).
Including the factors of age, sex, TNM status, tumor stage, and grade (only TCGA cohort), multivariate Cox regression analysis was utilized to prove that HIscore can be an independent prognostic biomarker for gastric cancer patients in both ACRG (HR 3.710 (2.659–5.178); Figure S3G) or TCGA (HR 2.026 (1.163–3.529); Figure S3H).
To establish a quantitative tool for predicting the prognosis of gastric cancer patients in the ACRG cohort, a nomogram was generated by integrating clinicopathological factors and HIscore based on the multivariable Cox proportional hazards model (Figure S3I). The point scale in the nomogram was used to generate point to these variables, and the risk of death of each patient was evaluated by accumulating total points of all variables. The HIscore had the most excellent weight among all these variables, which was consistent with the result of the previous multivariable Cox regression analysis. The calibration plots confirmed the significant consistency between predicted and observed actual clinical outcomes of gastric cancer patients (Figure S3J).
Characteristics of Transcriptome Traits in High and Low HIscore Groups
We evaluated the 23 TME immune cells infiltrating tumors in the high- and low-risk groups, and found that most of the TME immune cells have significant differences between the two groups. activated CD4 T cell, activated dendritic cell and neutrophil had higher enrichment scores in the low HIscore group, while other immune cell enrichment scores had higher enrichment scores in the high HIscore group (Figure 4A). The expression levels of some genes related to tumor hypoxia status were also significantly differentially expressed in high and low HIscore groups. Among the hypoxia genes with statistically significant differences in the Kruskal–Wallis test, except for VKORC1 and HIF1A, which is highly expressed in the high HIscore group, the others were highly expressed in the low HIscore group (Figure 4B).
 |
Figure 4 Immune cell infiltration characteristics and transcriptome traits in different group with high or low HIscore. (A) The abundance of each TME infiltrating cell in high and low HIscore groups. (B) Difference in the expression of 18 hypoxia gene signatures between high and low HIscore groups. The asterisks represented the statistical p value (Wilcox test, *P < 0.05; **P < 0.01; ***P < 0.001). (C) Differences in HIscore among three geneclusters in ACRG cohort. The Kruskal–Wallis test was used to compare the statistical difference between three geneclusters (P < 0.0001). (D) Differences in HIscore between different ACRG molecular subtypes. The Kruskal–Wallis test was used to compare the statistical difference between four ACRG molecular subtypes (p < 0.0001). (E) Correlations between HIscore and the known gene signatures in ACRG cohort using Pearson's analysis. Negative correlation was marked with blue and positive correlation with red. (F) Difference in the expression of 21 known biological processes related to tumor progression between high and low HIscore groups. The upper and lower ends of the boxes represented interquartile range of values. The lines in the boxes represented median value, and black dots showed outliers. The asterisks represented the statistical p value (*P < 0.05; **P < 0.01; ***P < 0.001; ****P < 0.0001). |
The vast majority of patients with EMT subtypes were classified as HIgenecluster C, and all patients in HIgenecluster C carried high HIscore. Kruskal–Wallis test indicates that HIscore has a significant difference between HIgenecluster A–C. HIgenecluster A had the lowest median HIscore and HIgenecluster C had the highest median HIscore (Figure 4C), which indicates that HIscore may serve as a signature of EMT-Genomic stability. More clearly in ACRG cohort, the median HIscore of EMT mole type was significantly higher than other.
The median HIscore of MSI molecular subtypes was higher than that of MSS subtypes, and whether TP53 is mutated will not significantly affect the HIscore of MSS subtypes (Figure 4D).
To legitimately decipher the characteristics of HIscore, we calculated the correlation between HIscore and the signatures of some biological processes (Figure 4E; Supplementary Table 5), and the enrichment scores of these biological processes between the high and low HIscore groups were shown in Figure 4F. Pan-F-TBRS was the pathway was the most positively related to HIscore (R = 0.706, P < 0.001), and TGF-beta signaling pathway is also closely related to HIscore (R = 0.629, P < 0.001). Echoing the results of the previous alluvial diagram, two signatures related to epithelial-mesenchymal transition also showed a strong positive correlation with HIscore (EMT1, R = 0.593, P < 0.001; EMT2, R = 0.550, P < 0.001) and their median enrichment scores were higher in the high HIscore group. It was striking that the biological process signatures related to the maintenance of genome stability are strongly negatively correlated with HIscore, such as base excision repair (R = −0.739, P < 0.001), DNA replication (R = −0.659, P < 0.001), cell cycle (R = −0.630, P < 0.001), DNA damage repair (R = −0.577, P < 0.001), nucleotide excision repair (R =−0.568, P < 0.001) and mismatch repair (R = −0.564, P < 0.001). The median enrichment scores of genome stability-related biological processes are lower in the high HIscore group.
The Role of HIscore in Assessing Genome Instability
In the TCGA cohort, based on the prognostic model we constructed, we obtained the HIscore of all gastric cancer patients and utilized 1.61406348 (the median value of HI-score in ACRG cohort) as the cut-off to divide the patients into high and low HIscore groups. Pearson correlation analysis indicated that a high HIscore could be closely linked to high TMB (R =−0.46, P < 0.001; Figure 5A). We divided the patients into high or low TMB groups based on the median value of TMB and the high TMB group had a lower median HIscore (Figure 5B). We found that both high and low HIscore groups accounted for a large proportion of patients with MSS, but the low HIscore group accounted for the higher proportion of MSI-L (16% VS 9%) and MSI-H patients (21% VS 6%) than that in high HIscore group (Figure 5D). Kruskal–Wallis test revealed that patients with different Micro satellite status in the TCGA cohort had significantly different median HIscore (Figure 5E). MSS patients had the highest median HIscore, and MSI-H patients had the lowest median HIscore. Taking the upper quartile and lower quartile of the total number of somatic mutation genes as cut-off, we obtained the genome unstable (GU) group (n=81) and the group genome stable (GS) group (n=87) in the TCGA cohort, and we extracted these 168 patients and combined their HIscore. In the low HIscore group, genome unstable patients accounted for a larger proportion (Figure 5G). Not only that the median HIscore in the genome unstable group was lower than that in the genome stable group (P<0.0001, Figure 5H). We also evaluated the expression levels of all genes that constitute the prognostic model in different TMB, Micro Satellite, and genome stability states (Figure 5C, F, and I). In the TCGA cohort, the high TMB, the MSI, and the genome unstable (GU) group all showed low expressions of BEX4, CCDC50, CLIP4, CPE, JAZF1, LMO2, and RASGRP2, while PSMB10 was highly expressed in these groups.
 |
Figure 5 The close relationship between HIscore and TMB, microsatellite status, genomic instability. (A) Correlation between the TMB and HIscore in the TCGA cohort. (Pearson correlation analysis, R=−0.46, P < 0.0001) (B) Difference in the HIscore of patients between high and low TMB group. (C) Difference in the expression of 13 members of the hypoxia-immune signature between high and low TMB group. (D) The proportion of MSS, MSI-L and MSI-H patients in the high and low HIscore groups. (E) Difference in the HIscore of patients among MSS, MSI-L and MSI-H groups. (F) Difference in the expression of 13 members of the hypoxia-immune signature among MSS, MSI-L and MSI-H groups. (G) The proportion of genome unstable and genome stable patients in the high and low HIscore groups. (GU: genome unstable patient; GS: genome stable patient) (H) Difference in the HIscore of patients between GU and GS group. (I) Difference in the expression of 13 members of the hypoxia-immune signature between GU and GS group. The Kruskal–Wallis test was used to compare the statistical difference (*p < 0.05, **p < 0.01, ***p < 0.001, ****p < 0.0001). |
In order to verify our inference that HIscore is related to genome instability, we also evaluated the expression of these common differentially expressed genes in another GSE13911 containing Micro satellite information of gastric cancer patients. Because the Micro satellite status in GSE13911 only included MSS (n=20) and MSI (n=20), the difference of these genes between the MSI-L and the MSI-H group could not be observed. Wilcox test revealed that except for LMO2, PSMB10, and RASGRP2, the median gene expression levels of other genes in the MSI group were significantly lower than those in the MSS group (P<0.05), which was consistent with the phenomenon we found in the TCGA cohort (Figure S4). The median expression of LMO2 was lower in the MSI group, although the P-value was not less than 0.05 (Wilcox test, P=0.07).
Identification of Candidate Small Molecule Drugs for Gastric Cancer Patients with High HIscore
In total, we identified 546 up-regulated genes and 337 down-regulated genes in high HIscore groups of both ACRG and TCGA cohort (Supplementary Table 9). By using the CMAP database we obtained total 96 potential small drug molecules, and P < 0.05 was regarded as the cut-off criteria (Table 2). The enrichment scores (− 1 to + 1) that could assess the similarity between genes and drugs were calculated. Specifically, enrichment score <0 revealed molecules had potential antagonistic effects to biological processes closely linked to high HIscore, indicating they could reverse the poor prognosis and could serve as therapeutic drugs, especially for gastric cancer patients with high HIscore. In our research, the enrichment scores of adiphenine (−0.939), isoflupredone (−0.929), vinblastine (−0.916), and viomycin (−0.907) are all lower than −0.9. They are the four small drug molecules with the enrichment score closest to −1. This showed that they have great potential in reversing the poor prognosis and serving as therapeutic drugs.
 |
Table 2 Identification of Candidate Small-Molecule Drugs for Gastric Cancer Patients with High HIscore Using the CMAP Database |
Verify the Accuracy of the Hypoxia Pathway Gene Set Included in the Study
To determine the correctness of the 13 hypoxia-related gene sets involved in unsupervised clustering in this study, we performed GSEA between hypoxia and normoxia gastric cancer cell lines in GSE114083. The genes of gastric cancer cell lines in the hypoxic group were significantly enriched in 13 hypoxia-related gene sets we used (Figure S5 and Supplementary Table 10).
Discussion
Previous researches have forced us to get to the deeper issue of the biological and molecular subtypes of gastric cancer. However, relevant classifiers are still in great demand for guiding clinical treatment or predicting prognosis. Hypoxia, a kind of tumor microenvironmental stress related to poor prognosis of patients, is a hallmark of solid tumors,39 and immune cell infiltration characterizations are also a research hotspot in many solid tumors.40 Most classifications focus on a single biological and molecular feature and in this study, a new classifier was developed by combining the hypoxic state and immune cell infiltration of gastric cancer.41,42
Due to the complexity of immune activity and hypoxia in the tumor micro environment, few transcriptome-based biomarkers could evaluate hypoxia and immune status, so we took advantage of ssGSEA to calculate the enrichment scores of related immune and hypoxia gene sets as our evaluation index.43,44 Of course, the gene sets of these hypoxia-related processes have been verified in GSE114083 and the results show that they can represent tumor hypoxia traits in gastric cancer cell lines. In the GC (gastric cancer) meta-cohort after removing the batch effect, the unsupervised clustering algorithm revealed that there are three markedly different gastric cancer subtypes. Among the three subtypes, HIcluster A was classified as low hypoxic/low immune, HIcluster B was classified as high hypoxic/high immune, and HIcluster C was classified as low hypoxic/high immune. We utilized the expression of HIF1A to verify the correctness of our judgment of the three types of hypoxia, while the ImmuneScore, the expression of PDL1, and CLTA4 were used to verify the correctness of the immune cell infiltration type.
Firstly, we found that the median OS of HIcluster with high hypoxia levels was smaller than that with low hypoxia levels. This phenomenon was in line with our expectation. Hypoxia leads to increased glycolysis and lactate production.45 Glycolysis can reduce the production of reactive oxygen species (ROS), and the low concentrations of ROS can contribute to tumor cell survival.46 In addition, lactate, generated during glycolysis, decreases the tumor environmental pH and an acidic pH distinctly impedes the function of normal immune cells, such as T-cell and tumor-infiltrating lymphocytes.47 Furthermore, the lactate-mediated enhancement of tumor cell motility is reported not only in single-cell motion but also in enforced bulk migration.48 Hyaluronan, synthesized by tumor-associated fibroblasts (TAF), increases around the carcinoma regions at high lactate concentrations and encourages the growth and motility of cancer cells.49 Moreover, hypoxia induces EMT and the formation of angiogenesis and lymphangiogenesis, which will allow tumor cells to escape the adverse microenvironment and disseminate into secondary sites.50,51 Taken together, these findings may at least partially explain the facilitation of tumor progression and the worse prognosis in the high hypoxia levels cluster as compared to the low hypoxia levels cluster.
Even for the same tumor subtype in which immune cells highly infiltrated (HIcluster B and C), different hypoxia status still caused different infiltration patterns. For example, activated CD8+ T cells, activated B cells and immature B cells have a higher infiltration in HIcluster C. This phenomenon is consistent with the research of Akio Ohta et al, which indicated that lower tissue oxygenation decrease the extent of T cell activation.52 Previous studies have also pointed out that the narrow maturation process of dendritic cells under lower local O2 tension may also reduce T cell activation.53 HIFs (HIF-1, HIF-2, HIF-3) are involved in most biological processes caused by hypoxia.54 Burrows et al generated a mouse with B cell-specific deficiency of VHL (an important protein that causes the dissociation of HIFs and indicated that HIFs activation results in immature B cell developmental arrest and peripheral B cell loss.55 The infiltration pattern of B cell especially activated B cell in HIcluster B and C also conforms to this rule.
We compared the median survival time between HIcluster B and C. Both of them are highly immune cells infiltrated, however, HIcluster C had a better prognosis. We speculate that it is not only due to hypoxic effects but also closely related to the different infiltration characteristics of activated CD8+ T cells and B cells in tumors. Abnormal angiogenesis, desmoplasia, and inflammation will all be promoted due to the oxygen supply obstacles in the tumor that proliferates unrestrictedly, which can cause tumor progression and drug resistance.56,57 Furthermore, activated HIF1a up-regulation of the activity of Snail and Twist, two transcription factors that decrease E-cadherin expression and facilitate EMT.58 Previous studies have already shown that pancreatic cancer and bladder urothelial carcinoma patients with high densities of CD8+ T-cells have a better prognosis.59 Kim et al constructed B-cell depleted mice of which the tumor size is larger and the growth rate is higher than the control group. They further researched and found that the B-cell-specific gene expression is a prognostic biomarker of head-neck carcinoma.60 Therefore, we speculate that hypoxia, CD8+ T cells, and B cells may also play a similar role in gastric cancer, resulting in the poor prognosis in HIcluster B. Immune checkpoint inhibitors therapy has developed rapidly in recent years, such as that target CTLA4 and PD1 pathway, but only a fraction of patients can benefit from it.61 The median expression of PDL1 and CLTA4 was the lowest in HIcluster A, and that of CLTA4 was the highest in HIcluster C. There was no significant difference in the median expression of PDL1 between HIcluster B and C. Plentiful researches in different cancer types have indicated a positive correlation between PDL1 expression and ICI response and OS.62,63 The new classifier we created has the potential in guiding ICI treatment for patients with gastric cancer.
Furthermore, We explored the differences in transcriptome traits between different HIclusters, and performed the enrichment analysis with the differentially expressed genes obtained. These biological processes are mainly concentrated on the activation and differentiation of immune cells, leukocyte migration, which is consistent with the characteristics of our classifier. In order to amplify the ability of the classifier, we created to classify the poor prognosis patients with gastric cancer. We selected genes with the prognostic value among the differential genes to perform unsupervised clustering again. We were surprised to isolate a genecluster C with a significantly poor prognosis. We evaluated the interaction between other gastric cancer classification methods in ACRG cohort and genecluster, and we found that EMT subtype and diffuse subtype have an absolute advantage in genecluster C. Diffuse-type gastric cancer, a subtype with a poor prognosis, lacks effective and specialized treatments and accounts for 30% of the total number of gastric cancer patients.64,65 As the early stage of tumor metastasis, EMT includes not only the dissolution of cell–cell junctions but also loss of apico-basolateral polarity. Throughout the EMT, down-regulation of cellular adhesion proteins and up-regulation of mesenchymal markers occur on gastric cancer cells.66 Clinically, EMT is closely linked to a poor prognosis.67 Therefore, we suppose that The epithelial-mesenchymal transition (EMT) is a pivotal characteristic of tumors in genecluster C, and it is also the basis for our classifier to classify patients with worse prognosis. In order to verify our ideas, we measured the expression levels of EMT-related genes in different geneclusters, and found that the EMT-related gene set (EMT1, EMT2) obtained in the previous literature got the highest enrichments score in genecluster C. Similar to EMT1 and EMT2, other pathways and biological processes closely related to the EMT processes are also enriched in genecluster C, such as ECM–receptor interaction,68 MAPK signaling pathway,69 PI3K-Akt signaling pathway,70 TGF-beta signaling pathway and Wnt signaling pathway.71,72 This supports our conjecture.
The pathways related to repairing DNA damage in genecluster A and B are more activated than genecluster C, such as nucleotide excision repair, base excision repair, and mismatch repair.73,74 This implies that geneclusters A and B (especially genecluster A) will undergo more processes of detecting and removing bases, repairing modified bases, and removal of bulky adducts in DNA. Each of these DNA repair pathways resects a damaged region and inserts new bases to fill the gap. It implies that the stability of genomes in geneclusters A and B may have already been challenged.75,76 Cell cycle and DNA replication have a negative correlation with genome stability, so their lower enrichment in genecluster C supports our guess that genecluster C belongs to the subtype of genome stability.77,78
Furthermore, we utilized lasso Cox regression analysis to screen out 13 differentially expressed genes among HIclusters to construct a hypoxic-immune-related signature (HIscore). According to the median value of HIscore, patients are divided into high- and low-risk groups. Gastric cancer patients in the high-HIscore group have a poorer prognosis. We utilized TCGA cohort as the validation set and found that HIscore is still robust in predicting prognosis. Multivariate Cox regression analysis indicated that whether in ACRG or TCGA cohort, HIscore was an independent risk factor for overall survival (ACRG (HR 3.710 (2.659–5.178))); TCGA (HR 2.026 (1.163–3.529)). The accuracy of HIscore in ACRG cohort was evaluated by the AUC of receiver operating characteristic analysis and the AUC was 0.72 at 3 years, 0.73 at 5 years, and 0.74 at 8 years, respectively. The AUC was 0.70 at 5 years in the TCGA cohort. This suggests that HIscore is clinically significant in predicting the long-term prognosis of patients. In addition, we found that whether the patient undergoes adjuvant chemotherapy or not, HIscore’s ability to predict the prognosis will not be diminished, which could make HIscore more widely used in clinical practice. In addition, we developed a nomogram to describe the risk of death of each gastric cancer patient and the calibration plots confirmed the significant consistency between predicted and observed actual clinical outcomes. This nomogram is established by the combination of hypoxic-immune-related signature and clinical characteristics including TNM stage and Lauren classification. So that it showed considerable property for predicting the survival and can be more clinically applicable.
The vast majority of patients with EMT subtypes were classified as HIgenecluster C, and patients in HIgenecluster C carried higher HIscore. In ACRG cohort, the median HIscore of the EMT molecular subtype was significantly higher than other subtypes. This suggests that HIscore may be an indicator of the characteristics of genecluster C (EMT-genome stability type). Pearson correlation analysis showed that EMT-related biological processes are strongly positively correlated with HIscore, and DNA damage repair processes are strongly negatively correlated with HIscore. At the same time, the enrichment scores of EMT-related biological processes are higher in the high HIscore group, and the enrichment score of the DNA damage repair process was lower in the high HIscore group. Furthermore, we compared the HIscores between different TMB and microsatellite status, which is closely linked to genomic instability.79,80 The results are consistent with our expectations that gastric cancer patients with high TMB and MSI have lower HIscore, and Pearson correlation analysis showed that HIscore is negatively correlated with TMB. We also ranked the total number of mutated genes from most to least. The first 25% were identified as genomically unstable patients, and the last 25% were identified as genomically stable patients.34 In this new framework for evaluating the extent of genomic instability in gastric cancer, high HIscore is still a good indicator of genome stability.
We focused on the members that constitute hypoxic-immune-related signature (HIscore) and found that most of their expression levels are significantly different between genomic stability and instability group. BEX4 protein mainly localizes at centrosomes, contractile rings, and midbodies, and BEX4 contributes to the stabilization and elongation rates of microtubules. Moreover, BEX4 plays an important role in apoptosis and the adaptation to aneuploidy induced by spindle damage or a mitotic checkpoint defect.81 CLIP4, one of the CLIP-170 family, connects microtubule with organelle by CAP-Gly which contributed to cell polarity maintenance, intracellular transport, cell migration, and oncogenesis.82,83 Multiple studies indicated that microtubule is altered in cancer cell divisions and linked to chromosomal instability, aneuploidy, and drug resistance.84 Parvin et al found that LMO2 expression is sufficient to increase genomic instability in DLBCL and T-ALL cell lines, leading to the accumulation of chromosomal rearrangements and phosphorylated H2AX (g-H2AX), a marker of DNA double-strand breaks (DSBs).85 Therefore, these genes may be the cornerstones of HIscore to predict the genome stability of gastric carcinoma.
In the TCGA cohort, BEX4, CCDC50, CLIP4, CPE, JAZF1, LMO2, and RASGRP2 all showed lower expressions level in the high TMB group, the MSI group, and the genome unstable (GU) group, while PSMB10 was highly expressed in all these groups. We chose another independent cohort (GSE13911) from the GEO database as the validation set. The expression trend of the majority in the validation set is similar to that in the TCGA cohort. The P-value of LMO2 is 0.07, which is close to 0.05, and we think it makes partial sense that the expression of LMO2 was lower in the MSI group.86 The P-value of LMO2, PSMB10, and RASGRP2 is greater than 0.05, which may be caused by insufficient sample size in the verification set.87 The results of the validation set further confirm that the HIscore we constructed is closely related to genome stability.
In short, in clinical practice, HIscore is not only an independent prognostic biomarker but also a forecast for clinicopathological features of patients with gastric cancer, such as EMT and genomic stability. This provides new insights into personalized treatment for some traditional chemotherapy drugs, such as cisplatin and gemcitabine that target DNA damage.88,89 At the same time, because of the significant differences in immune cell infiltration and TMB between patients with high and low HIscore, it may also have the potential to screen out patients who will benefit from immunotherapy.90 In addition, based on the fact that patients with high HIscore have a worse prognosis, we used the CMAP database to screen 96 small-molecule drugs that had potential antagonistic effects to biological processes closely linked to high HIscore. Specially, in our study, adiphenine, isoflupredone, vinblastine and viomycin have great potential in reversing the poor prognosis and serving as therapeutic drugs.
Our research provides new ideas and materials for the personalized clinical treatment plans for patients with gastric cancer, although some limitations of this study should be acknowledged. Firstly, our study only included a bioinformatics analysis, lacking the validation of solid clinical specimens. Additionally, the research was conducted with a retrospective design rather than a prospective one. However, our risk model was validated by multiple data cohorts; therefore, the result is still reliable and acceptable. Thus, future studies with prospective clinical trials and mechanistic exploration are warranted to further validate the present result.
Conclusion
In conclusion, our study evaluated the hypoxic state and immune cell infiltration in gastric tumors and identified different gastric cancer subtypes through the interaction of them. Subsequently, we obtained three subtypes with different prognosis: low hypoxic/low immune subtype, high hypoxic/high immune subtype, and low hypoxic/high immune subtype. Moreover, based on the DEGs between the above three subtypes, we can clearly identified another three sub-classification of patients with gastric cancer through unsupervised clustering including immune-activation subtype and EMT-Genomic stability subtype.
We extensively explored the differences in clinical and transcriptome traits among those cancer subtypes. Then, we constructed hypoxic-immune-related signature (HIscore) by LASSO regression. HIscore is an independent prognostic biomarker that could not be ignored to link to tumor EMT and genomic stability. Based on HIscore, we used the CMAP database to explore small-molecule drugs that may have the potential in serving as therapeutic drugs such as adiphenine, isoflupredone, vinblastine and viomycin. In addition, a nomogram was established by using the combination of HIscore and clinical characteristics to describe the risk of death of each gastric cancer patient.
This study proposes new insights on the molecular classification of gastric cancer and may contribute to the advancement of personalized treatment for gastric cancer. However, further experimental studies are needed to verify our proposal.
Data Sharing Statement
Data in the present study can be freely obtained by email from the corresponding authors.
Acknowledgments
We thank all those participants in this study.
Author Contributions
All authors made substantial contributions to conception and design, acquisition of data, or analysis and interpretation of data; took part in drafting the article or revising it critically for important intellectual content; agreed to submit to the current journal; gave final approval of the version to be published; and agree to be accountable for all aspects of the work.
Disclosure
The authors report no conflicts of interest in this work.
References
1. Fitzmaurice C, Akinyemiju TF, Al Lami FH, et al.; Global Burden of Disease Cancer Collaboration. Global, regional, and national cancer incidence, mortality, years of life lost, years lived with disability, and disability-adjusted life-years for 29 cancer groups, 1990 to 2016: a systematic analysis for the global burden of disease study. JAMA Oncol. 2018;4(11):1553–1568. doi:10.1001/jamaoncol.2018.2706
2. Smyth EC, Nilsson M, Grabsch HI, et al. Gastric cancer. Lancet (London, England). 2020;396(10251):635–648. doi:10.1016/S0140-6736(20)31288-5
3. Petrelli F, Berenato R, Turati L, et al. Prognostic value of diffuse versus intestinal histotype in patients with gastric cancer: a systematic review and meta-analysis. J Gastrointest Oncol. 2017;8(1):148–163. doi:10.21037/jgo.2017.01.10
4. Tang C-T, Zeng L, Yang J, et al. Analysis of the incidence and survival of gastric cancer based on the Lauren classification: a large population-based study using SEER. Front Oncol. 2020;10:1212. doi:10.3389/fonc.2020.01212
5. Roy P, Piard F, Dusserre-Guion L, et al. Prognostic comparison of the pathological classifications of gastric cancer: a population-based study. Histopathology. 1998;33(4):304–310. doi:10.1046/j.1365-2559.1998.00534.x
6. Li Z-Y, Zhang Q-W, Teng L-M, et al. Comparable rates of lymph node metastasis and survival between diffuse type and intestinal type early gastric cancer patients: a large population-based study. Gastrointest Endosc. 2019;90(1):84–95.e10. doi:10.1016/j.gie.2019.03.002
7. Cancer Genome Atlas Research Network. Comprehensive molecular characterization of gastric adenocarcinoma. Nature. 2014;513(7517):202–209. doi:10.1038/nature13480
8. Oh SC, Sohn BH, Cheong J-H, et al. Clinical and genomic landscape of gastric cancer with a mesenchymal phenotype. Nat Commun. 2018;9(1):1777. doi:10.1038/s41467-018-04179-8
9. Fu Z, Mowday AM, Smaill JB, Hermans IF, Patterson AV. Tumour hypoxia-mediated immunosuppression: mechanisms and therapeutic approaches to improve cancer immunotherapy. Cells. 2021;10(5):1006. doi:10.3390/cells10051006
10. Folkman J. Tumor angiogenesis: therapeutic implications. N Engl J Med. 1971;285(21):1182–1186. doi:10.1056/NEJM197111182852108
11. Goel S, Duda DG, Xu L, et al. Normalization of the vasculature for treatment of cancer and other diseases [published correction appears in Physiol Rev. 2014 Apr;94(2):707]. Physiol Rev. 2011;91(3):1071–1121. doi:10.1152/physrev.00038.2010
12. Mantovani A, Sozzani S, Locati M, Allavena P, Sica A. Macrophage polarization: tumor-associated macrophages as a paradigm for polarized M2 mononuclear phagocytes. Trends Immunol. 2002;23(11):549–555. doi:10.1016/s1471-4906(02)02302-5
13. Noman MZ, Desantis G, Janji B, et al. PD-L1 is a novel direct target of HIF-1α, and its blockade under hypoxia enhanced MDSC-mediated T cell activation. J Exp Med. 2014;211(5):781–790. doi:10.1084/jem.20131916
14. Zhang B, Tang B, Gao J, et al. A hypoxia-related signature for clinically predicting diagnosis, prognosis and immune microenvironment of hepatocellular carcinoma patients. J Transl Med. 2020;18(1):342. doi:10.1186/s12967-020-02492-9
15. Cao R, Yuan L, Ma B, et al. Tumour microenvironment (TME) characterization identified prognosis and immunotherapy response in muscle-invasive bladder cancer (MIBC). Cancer Immunol Immunother. 2021;70(1):1–18. doi:10.1007/s00262-020-02649-x
16. Walsh JC, Lebedev A, Aten E, et al. The clinical importance of assessing tumor hypoxia: relationship of tumor hypoxia to prognosis and therapeutic opportunities. Antioxid Redox Signal. 2014;21(10):1516–1554. doi:10.1089/ars.2013.5378
17. Barrett T, Wilhite SE, Ledoux P, et al. NCBI GEO: archive for functional genomics data sets–update. Nucleic Acids Res. 2013;41(Database issue):D991–D995. doi:10.1093/nar/gks1193
18. Tomczak K, Czerwińska P, Wiznerowicz M. The Cancer Genome Atlas (TCGA): an immeasurable source of knowledge. Contemp Oncol (Pozn). 2015;19(1A):A68–A77. doi:10.5114/wo.2014.47136
19. Zhao S, Ye Z, Stanton R. Misuse of RPKM or TPM normalization when comparing across samples and sequencing protocols. RNA. 2020;26(8):903–909. doi:10.1261/rna.074922.120
20. Leek JT, Johnson WE, Parker HS, Jaffe AE, Storey JD. The sva package for removing batch effects and other unwanted variation in high-throughput experiments. Bioinformatics. 2012;28(6):882–883. doi:10.1093/bioinformatics/bts034
21. Charoentong P, Finotello F, Angelova M, et al. Pan-cancer immunogenomic analyses reveal genotype-immunophenotype relationships and predictors of response to checkpoint blockade. Cell Rep. 2017;18(1):248–262. doi:10.1016/j.celrep.2016.12.019
22. Subramanian A, Tamayo P, Mootha VK, et al. Gene set enrichment analysis: a knowledge-based approach for interpreting genome-wide expression profiles. Proc Natl Acad Sci U S A. 2005;102(43):15545–15550. doi:10.1073/pnas.0506580102
23. Liberzon A, Birger C, Thorvaldsdóttir H, Ghandi M, Mesirov JP, Tamayo P. The Molecular Signatures Database (MSigDB) hallmark gene set collection. Cell Syst. 2015;1(6):417–425. doi:10.1016/j.cels.2015.12.004
24. Ferreira MR, Santos GA, Biagi CA, Silva Junior WA, Zambuzzi WF. GSVA score reveals molecular signatures from transcriptomes for biomaterials comparison. J Biomed Mater Res A. 2021;109(6):1004–1014. doi:10.1002/jbm.a.37090
25. Wilkerson MD, Hayes DN. ConsensusClusterPlus: a class discovery tool with confidence assessments and item tracking. Bioinformatics. 2010;26(12):1572–1573. doi:10.1093/bioinformatics/btq170
26. Yoshihara K, Shahmoradgoli M, Martínez E, et al. Inferring tumour purity and stromal and immune cell admixture from expression data. Nat Commun. 2013;4:2612. doi:10.1038/ncomms3612
27. Chen B, Khodadoust MS, Liu CL, Newman AM, Alizadeh AA. Profiling tumor infiltrating immune cells with CIBERSORT. Methods Mol Biol. 2018;1711:243–259. doi:10.1007/978-1-4939-7493-1_12
28. Ritchie ME, Phipson B, Wu D, et al. limma powers differential expression analyses for RNA-sequencing and microarray studies. Nucleic Acids Res. 2015;43(7):e47. doi:10.1093/nar/gkv007
29. Zhou Y, Zhou B, Pache L, et al. Metascape provides a biologist-oriented resource for the analysis of systems-level datasets. Nat Commun. 2019;10(1):1523. doi:10.1038/s41467-019-09234-6
30. Lamb J, Crawford ED, Peck D, et al. The Connectivity Map: using gene-expression signatures to connect small molecules, genes, and disease. Science. 2006;313(5795):1929–1935. doi:10.1126/science.1132939
31. Mariathasan S, Turley SJ, Nickles D, et al. TGFβ attenuates tumour response to PD-L1 blockade by contributing to exclusion of T cells. Nature. 2018;554(7693):544–548. doi:10.1038/nature25501
32. Hazra A, Gogtay N. Biostatistics series module 6: correlation and linear regression. Indian J Dermatol. 2016;61(6):593–601. doi:10.4103/0019-5154.193662
33. Ritterhouse LL. Tumor mutational burden. Cancer Cytopathol. 2019;127(12):735–736. doi:10.1002/cncy.22174
34. Bao S, Zhao H, Yuan J, et al. Computational identification of mutator-derived lncRNA signatures of genome instability for improving the clinical outcome of cancers: a case study in breast cancer. Brief Bioinform. 2020;21(5):1742–1755. doi:10.1093/bib/bbz118
35. Tilford CA, Siemers NO. Gene set enrichment analysis. Methods Mol Biol. 2009;563:99–121. doi:10.1007/978-1-60761-175-2_6
36. Sjölander A. A cautionary note on extended Kaplan-Meier curves for time-varying covariates. Epidemiology. 2020;31(4):517–522. doi:10.1097/EDE.0000000000001188
37. Yu SC, Qi X, Hu YH, Zheng WJ, Wang QQ, Yao HY. Overview of multivariate regression model analysis and application. Zhonghua Yu Fang Yi Xue Za Zhi. 2019;53(3):334–336. doi:10.3760/cma.j.issn.0253-9624.2019.03.020
38. Mayakonda A, Lin DC, Assenov Y, Plass C, Koeffler HP. Maftools: efficient and comprehensive analysis of somatic variants in cancer. Genome Res. 2018;28(11):1747–1756. doi:10.1101/gr.239244.118
39. Shi R, Liao C, Zhang Q. Hypoxia-driven effects in cancer: characterization, mechanisms, and therapeutic implications. Cells. 2021;10(3):678. doi:10.3390/cells10030678
40. Gajewski TF, Schreiber H, Fu YX. Innate and adaptive immune cells in the tumor microenvironment. Nat Immunol. 2013;14(10):1014–1022. doi:10.1038/ni.2703
41. Li Q, He W, Wan G. Methyladenosine modification in RNAs: classification and roles in gastrointestinal cancers. Front Oncol. 2021;10:586789. doi:10.3389/fonc.2020.586789
42. Zhou Z, Zhang J, Xu C, et al. An integrated model of N6-methyladenosine regulators to predict tumor aggressiveness and immune evasion in pancreatic cancer. EBioMedicine. 2021;65:103271. doi:10.1016/j.ebiom.2021.103271
43. Shen Y, Peng X, Shen C. Identification and validation of immune-related lncRNA prognostic signature for breast cancer. Genomics. 2020;112(3):2640–2646. doi:10.1016/j.ygeno.2020.02.015
44. Li J, Liu C, Chen Y, et al. Tumor characterization in breast cancer identifies immune-relevant gene signatures associated with prognosis. Front Genet. 2019;10:1119. doi:10.3389/fgene.2019.01119
45. Xie Y, Shi X, Sheng K, et al. PI3K/Akt signaling transduction pathway, erythropoiesis and glycolysis in hypoxia (Review). Mol Med Rep. 2019;19(2):783–791. doi:10.3892/mmr.2018.9713
46. Lee M, Yoon J-H. Metabolic interplay between glycolysis and mitochondrial oxidation: the reverse Warburg effect and its therapeutic implication. World J Biol Chem. 2015;6(3):148–161. doi:10.4331/wjbc.v6.i3.148
47. Calcinotto A, Filipazzi P, Grioni M, et al. Modulation of microenvironment acidity reverses anergy in human and murine tumor-infiltrating T lymphocytes. Cancer Res. 2012;72(11):2746–2756. doi:10.1158/0008-5472.CAN-11-1272
48. Goetze K, Walenta S, Ksiazkiewicz M, et al. Lactate enhances motility of tumor cells and inhibits monocyte migration and cytokine release. Int J Oncol. 2011;39(2):453–463. doi:10.3892/ijo.2011.1055
49. Walenta S, Mueller-Klieser WF. Lactate: mirror and motor of tumor malignancy. Semin Radiat Oncol. 2004;14(3):267–274. doi:10.1016/j.semradonc.2004.04.004
50. Wei L, Sun -J-J, Cui Y-C, et al. Twist may be associated with invasion and metastasis of hypoxic NSCLC cells. Tumour Biol. 2016;37(7):9979–9987. doi:10.1007/s13277-016-4896-2
51. Schito L. Hypoxia-dependent angiogenesis and lymphangiogenesis in cancer. Adv Exp Med Biol. 2019;1136:71–85. doi:10.1007/978-3-030-12734-3_5
52. Ohta A, Diwanji R, Kini R, Subramanian M, Ohta A, Sitkovsky M. In vivo T cell activation in lymphoid tissues is inhibited in the oxygen-poor microenvironment. Front Immunol. 2011;2:27. doi:10.3389/fimmu.2011.00027
53. Yang M, Ma C, Liu S, et al. Hypoxia skews dendritic cells to a T helper type 2-stimulating phenotype and promotes tumour cell migration by dendritic cell-derived osteopontin. Immunology. 2009;128(1 Suppl):e237–e249. doi:10.1111/j.1365-2567.2008.02954.x
54. Foster JG, Wong SC, Sharp TV. The hypoxic tumor microenvironment: driving the tumorigenesis of non-small-cell lung cancer. Future Oncol. 2014;10(16):2659–2674. doi:10.2217/fon.14.201
55. Burrows N, Bashford-Rogers RJM, Bhute VJ, et al. Dynamic regulation of hypoxia-inducible factor-1α activity is essential for normal B cell development. Nat Immunol. 2020;21(11):1408–1420. doi:10.1038/s41590-020-0772-8
56. Jain RK. Antiangiogenesis strategies revisited: from starving tumors to alleviating hypoxia. Cancer Cell. 2014;26(5):605–622. doi:10.1016/j.ccell.2014.10.006
57. Whatcott CJ, Han H, Von Hoff DD. Orchestrating the tumor microenvironment to improve survival for patients with pancreatic cancer: normalization, not destruction. Cancer J. 2015;21(4):299–306. doi:10.1097/PPO.0000000000000140
58. Thiery JP, Acloque H, Huang RY, Nieto MA. Epithelial-mesenchymal transitions in development and disease. Cell. 2009;139(5):871–890. doi:10.1016/j.cell.2009.11.007
59. Zhang C, Shen L, Qi F, Wang J, Luo J. Multi-omics analysis of tumor mutation burden combined with immune infiltrates in bladder urothelial carcinoma. J Cell Physiol. 2020;235(4):3849–3863. doi:10.1002/jcp.29279
60. Kim SS, Shen S, Miyauchi S, et al. B cells improve overall survival in HPV-associated squamous cell carcinomas and are activated by radiation and PD-1 blockade. Clin Cancer Res. 2020;26(13):3345–3359. doi:10.1158/1078-0432.CCR-19-3211
61. Havel JJ, Chowell D, Chan TA. The evolving landscape of biomarkers for checkpoint inhibitor immunotherapy. Nat Rev Cancer. 2019;19(3):133–150. doi:10.1038/s41568-019-0116-x
62. Topalian SL, Hodi FS, Brahmer JR, et al. Safety, activity, and immune correlates of anti-PD-1 antibody in cancer. N Engl J Med. 2012;366(26):2443–2454. doi:10.1056/NEJMoa1200690
63. Rosenberg JE, Hoffman-Censits J, Powles T, et al. Atezolizumab in patients with locally advanced and metastatic urothelial carcinoma who have progressed following treatment with platinum-based chemotherapy: a single-arm, multicentre, Phase 2 trial. Lancet. 2016;387(10031):1909–1920. doi:10.1016/S0140-6736(16)00561-4
64. Ge S, Xia X, Ding C, et al. A proteomic landscape of diffuse-type gastric cancer [published correction appears in Nat Commun. 2018 May 8;9(1):1850]. Nat Commun. 2018;9(1):1012. doi:10.1038/s41467-018-03121-2
65. Cristescu R, Lee J, Nebozhyn M, et al. Molecular analysis of gastric cancer identifies subtypes associated with distinct clinical outcomes. Nat Med. 2015;21(5):449–456. doi:10.1038/nm.3850
66. Lamouille S, Xu J, Derynck R. Molecular mechanisms of epithelial-mesenchymal transition. Nat Rev Mol Cell Biol. 2014;15(3):178–196. doi:10.1038/nrm3758
67. Spaderna S, Schmalhofer O, Hlubek F, et al. A transient, EMT-linked loss of basement membranes indicates metastasis and poor survival in colorectal cancer. Gastroenterology. 2006;131(3):830–840. doi:10.1053/j.gastro.2006.06.016
68. Sun HF, Yang XL, Zhao Y, et al. Loss of TMEM126A promotes extracellular matrix remodeling, epithelial-to-mesenchymal transition, and breast cancer metastasis by regulating mitochondrial retrograde signaling. Cancer Lett. 2019;440–441:189–201. doi:10.1016/j.canlet.2018.10.018
69. Zhao XW, Zhou JP, Bi YL, et al. The role of MAPK signaling pathway in formation of EMT in oral squamous carcinoma cells induced by TNF-α. Mol Biol Rep. 2019;46(3):3149–3156. doi:10.1007/s11033-019-04772-0
70. Xu W, Yang Z, Lu N. A new role for the PI3K/Akt signaling pathway in the epithelial-mesenchymal transition. Cell Adh Migr. 2015;9(4):317–324. doi:10.1080/19336918.2015.1016686
71. Syed V. TGF-β signaling in cancer. J Cell Biochem. 2016;117(6):1279–1287. doi:10.1002/jcb.25496
72. Arend RC, Londoño-Joshi AI, Straughn JM
73. Spivak G. Nucleotide excision repair in humans. DNA Repair (Amst). 2015;36:13–18. doi:10.1016/j.dnarep.2015.09.003
74. Sanderson RJ, Lindahl T. Down-regulation of DNA repair synthesis at DNA single-strand interruptions in poly(ADP-ribose) polymerase-1 deficient murine cell extracts. DNA Repair (Amst). 2002;1(7):547–558. doi:10.1016/s1568-7864(02)00054-x
75. Li Z, Pearlman AH, Hsieh P. DNA mismatch repair and the DNA damage response. DNA Repair (Amst). 2016;38:94–101. doi:10.1016/j.dnarep.2015.11.019
76. Tubbs A, Nussenzweig A. Endogenous DNA damage as a source of genomic instability in cancer. Cell. 2017;168(4):644–656. doi:10.1016/j.cell.2017.01.002
77. Mladenov E, Magin S, Soni A, Iliakis G. DNA double-strand-break repair in higher eukaryotes and its role in genomic instability and cancer: cell cycle and proliferation-dependent regulation. Semin Cancer Biol. 2016;37–38:51–64. doi:10.1016/j.semcancer.2016.03.003
78. Maya-Mendoza A, Moudry P, Merchut-Maya JM, Lee M, Strauss R, Bartek J. High speed of fork progression induces DNA replication stress and genomic instability. Nature. 2018;559(7713):279–284. doi:10.1038/s41586-018-0261-5
79. Collura A, Lefevre JH, Svrcek M, Tougeron D, Zaanan A, Duval A. Instabilité des microsatellites et cancer - De l’instabilité du génome à la médecine personnalisée [Microsatellite instability and cancer: from genomic instability to personalized medicine]. Med Sci (Paris). 2019;35(6–7):535–543. doi:10.1051/medsci/2019093
80. Chalmers ZR, Connelly CF, Fabrizio D, et al. Analysis of 100,000 human cancer genomes reveals the landscape of tumor mutational burden. Genome Med. 2017;9(1):34. doi:10.1186/s13073-017-0424-2
81. Lee JK, Ha GH, Kim HS, Lee CW. Oncogenic potential of BEX4 is conferred by Polo-like kinase 1-mediated phosphorylation. Exp Mol Med. 2018;50(10):1–12. doi:10.1038/s12276-018-0168-0
82. Galjart N, Perez F. A plus-end raft to control microtubule dynamics and function. Curr Opin Cell Biol. 2003;15(1):48–53. doi:10.1016/s0955-0674(02)00007-8
83. Akhmanova A, Hoogenraad CC. Microtubule plus-end-tracking proteins: mechanisms and functions. Curr Opin Cell Biol. 2005;17(1):47–54. doi:10.1016/j.ceb.2004.11.001
84. Cirillo L, Gotta M, Meraldi P. The elephant in the room: the role of microtubules in cancer. Adv Exp Med Biol. 2017;1002:93–124. doi:10.1007/978-3-319-57127-0_5
85. Parvin S, Ramirez-Labrada A, Aumann S, et al. LMO2 confers synthetic lethality to PARP inhibition in DLBCL. Cancer Cell. 2019;36(3):237–249.e6. doi:10.1016/j.ccell.2019.07.007
86. Andrade C. The P value and statistical significance: misunderstandings, explanations, challenges, and alternatives. Indian J Psychol Med. 2019;41(3):210–215. doi:10.4103/IJPSYM.IJPSYM_193_19
87. Concato J, Hartigan JA. P values: from suggestion to superstition. J Investig Med. 2016;64(7):1166–1171. doi:10.1136/jim-2016-000206
88. Rocha CRR, Silva MM, Quinet A, Cabral-Neto JB, Menck CFM. DNA repair pathways and cisplatin resistance: an intimate relationship. Clinics (Sao Paulo). 2018;73(suppl1):e478s. doi:10.6061/clinics/2018/e478s
89. Hailan WAQ, Abou-Tarboush FM, Al-Anazi KM, Ahmad A, Qasem A, Farah MA. Gemcitabine induced cytotoxicity, DNA damage and hepatic injury in laboratory mice. Drug Chem Toxicol. 2020;43(2):158–164. doi:10.1080/01480545.2018.1504957
90. Samstein RM, Lee CH, Shoushtari AN, et al. Tumor mutational load predicts survival after immunotherapy across multiple cancer types. Nat Genet. 2019;51(2):202–206. doi:10.1038/s41588-018-0312-8
 © 2021 The Author(s). This work is published and licensed by Dove Medical Press Limited. The
full terms of this license are available at https://www.dovepress.com/terms
and incorporate the Creative Commons Attribution
- Non Commercial (unported, 3.0) License.
By accessing the work you hereby accept the Terms. Non-commercial uses of the work are permitted
without any further permission from Dove Medical Press Limited, provided the work is properly
attributed. For permission for commercial use of this work, please see paragraphs 4.2 and 5 of our Terms.
© 2021 The Author(s). This work is published and licensed by Dove Medical Press Limited. The
full terms of this license are available at https://www.dovepress.com/terms
and incorporate the Creative Commons Attribution
- Non Commercial (unported, 3.0) License.
By accessing the work you hereby accept the Terms. Non-commercial uses of the work are permitted
without any further permission from Dove Medical Press Limited, provided the work is properly
attributed. For permission for commercial use of this work, please see paragraphs 4.2 and 5 of our Terms.