")
Back to Journals » International Journal of Nanomedicine » Volume 17
ICAM1-Targeting Theranostic Nanoparticles for Magnetic Resonance Imaging and Therapy of Triple-Negative Breast Cancer
Authors Chen J , Lv M, Su X, Wang S, Wang Y, Fan Z, Zhang L, Tang G
Received 12 May 2022
Accepted for publication 8 November 2022
Published 22 November 2022 Volume 2022:17 Pages 5605—5619
DOI https://doi.org/10.2147/IJN.S374293
Checked for plagiarism Yes
Review by Single anonymous peer review
Peer reviewer comments 4
Editor who approved publication: Professor Lei Yang
Jieying Chen,1,* Mingchen Lv,2,* Xiaolian Su,1 Sizhu Wang,1 Yitong Wang,1 Zhen Fan,2,3 Lin Zhang,1 Guangyu Tang1
1Department of Radiology, Shanghai Tenth People’s Hospital, Tongji University School of Medicine, Shanghai, People’s Republic of China; 2Department of Polymeric Materials, School of Materials Science and Engineering, Tongji University, Shanghai, People’s Republic of China; 3Institute for Advanced Study, Tongji University, Shanghai, China; Department of Orthopedics, Shanghai Tenth People’s Hospital, Tongji University School of Medicine, Shanghai, People’s Republic of China
*These authors contributed equally to this work
Correspondence: Guangyu Tang; Lin Zhang, Tel +86-18917683528, Email [email protected]; [email protected]
Purpose: Owing to the lack of effective biomarkers, triple-negative breast cancer (TNBC) has the worst prognosis among all subtypes of breast cancer. Meanwhile, tremendous progress has been made to identify biomarkers for TNBC. However, limited number of biomarkers still restrain the specifically targeting outcomes against TNBC. Here, to solve the obstacle, we designed and synthesized a new type of biocompatible nanoparticles to amplify the targeting effects for TNBC theranostics.
Methods: To identify the biomarker of TNBC, the expression of intercellular adhesion molecule-1 (ICAM1) was assessed by real-time polymerase chain reaction and western blot among all subtypes of breast cancer and normal breast epithelium. Then, vesicular nanoparticles based on poly(ethylene glycol)-poly(ϵ-caprolactone) copolymers were prepared by the double emulsion method and modified with anti-ICAM1 antibodies through click chemistry to conjugate with related antigens on TNBC cell membranes and then loaded with magnetic resonance imaging (MRI) contrast agent gadolinium and chemotherapeutic drug doxorubicin. The targeting capability, diagnostic and therapeutic efficacy of this nanoparticle were validated through cell-based and tumor model-based experiments.
Results: ICAM1 was expressed significantly higher on TNBC than on other subtypes of breast cancer and normal breast epithelium in both mRNA and protein level. Theranostic nanoparticle modified with anti-ICAM1 was proved to be able to specifically target to TNBC in vitro experiments. Such theranostic nanoparticle also displayed enhanced diagnostic and therapeutic efficacy by specifically targeting capability and extending circulation time in tumor models. The biocompatibility and biosafety of this nanoparticle was also confirmed in vitro and in vivo.
Conclusion: Overall, this new nanoparticle has been demonstrated with effective therapeutic outcomes against TNBC, providing a promising theranostic approach for MRI-guided therapy of TNBC.
Keywords: breast carcinoma, nanoparticles, magnetic resonance imaging, theranostics, intercellular adhesion molecule-1
Introduction
Breast cancer is the most common newly diagnosed cancer and ranks in the top five leading causes of cancer-related death in Chinese women.1,2 Triple-negative breast cancer (TNBC), which is negative for estrogen receptor (ER), progesterone receptor (PR) and without human epidermal growth factor receptor 2 (HER2) overexpression, accounts for 10–20% of all types of breast cancer.3 In comparison with other subtypes of breast cancer, TNBC has the highest mortality and is the most difficult to treat with systemic therapy.4 The risk of recurrence and death within five years after diagnosis is significantly higher in patients with TNBC than those with other subtypes of breast cancer.5 Therefore, early diagnosis and effective treatment is important for the improvement of the prognosis in TNBC.
Currently, chemotherapy has been the only viable systemic treatment option for TNBC since it lacks targeted treatment.6 Among various chemotherapeutic drugs for cancer therapy, one of the most used is doxorubicin (DOX).6,7 It belongs to the anthracycline class and is able to interact with DNA base pairs to produce a range of cytotoxic effects.7 Because its free form shows high toxicity to most major organs, especially to cardiac tissue, liposomal formulation of DOX, known as Doxil, was invented to avoid serious side effects.7,8 However, Doxil’s therapeutic efficacy is still limited because it relies on passive accumulation at tumor sites through enhanced permeability and retention (EPR) effect. Therefore, efforts have been devoting to develop carriers which can increase therapeutic efficacy while decrease systemic toxicity through active accumulation.
Intercellular adhesion molecule 1 (ICAM1) is an Ig-like transmembrane glycoprotein expressed on many cell types, including endothelial cells, leukocytes and cancer cells.9 Previous studies have linked increased ICAM1 to airway inflammation.10,11 Furthermore, ICAM1 plays an important role in the proliferation and invasion of breast cancer cell.12 The expression of ICAM1 was also demonstrated to be associated with a more aggressive tumor phenotype in breast cancer.13 In addition, several studies have proved that ICAM1 was expressed significantly higher on TNBC than on other types of breast cancer and was used for targeted imaging or therapy for TNBC.14–16 Thus, ICAM1 may serve as a potential marker for TNBC.
Nowadays, various theranostic nanoparticles have also been developed,17–25 yet there is no approved theranostic nanoparticles for TNBC.26 Therefore, we aimed to design a new theranostic nanoparticle specific for TNBC with biocompatible materials. Briefly speaking, magnetic resonance imaging (MRI) contrast agent gadolinium and DOX were loaded within poly(ethylene glycol)-poly(ε-caprolactone) copolymers (PEG-PCL)-based nanoparticles which were modified with anti-ICAM1 antibodies on the surface. The gadolinium-based contrast agents, approved for intravenous use for MRI since the late 1980s, are well tolerated and widely used in a majority of patients.27 PEG has the properties of biocompatibility, hydrophilicity, low toxicity and is used in various fields of medical research.28,29 PCL has been proved to be successfully used in medical and tissue engineering.30–32 PEG-PCL-based nanoparticles have been considered as promising drug deliver tools characterized by high biocompatibility, biodegradability, and long-circulating properties.33 In this study, we demonstrated that this biocompatible nanoparticle displayed enhanced diagnostic and therapeutic efficacy by specifically targeting to TNBC and extending circulation time, thus indicating its potential to be an effective theranostic nanoparticle for the management of TNBC.
Materials and Methods
Materials
HOOC-PEG(2k)-PCL(12k) and HOOC-PEG(2k)-PCL(12k)-FITC were purchased from Chongqing Yusi Pharmaceutical Technology Co. (China). Cy5.5 hydrazide (non-sulfonated) was purchased from APExBIO Technology (USA). DOX•HCl was purchased from Dalian Meilun Biotechnology Co. (China). Gadopentetate dimeglumine (Gd) was purchased from Beijing Beilu Pharmaceutical Co. (China). Human breast cancer cell lines (MCF7, BT-474, SK-BR-3, and MDA-MB-231) and human non-neoplastic mammary epithelial cell line (MCF10A) were purchased from American Type Culture Collection (Manassas, VA, USA). Anti-icam1 (EPR4776) antibody was purchased from Abcam.
Nanoparticle Preparation
Gd-DOX@PEG/PCL nanoparticles were prepared by the double emulsion (W/O/W) method. Briefly, 20 mg of HOOC-PEG-PCL was dissolved in 1 mL of methylene chloride and then 0.2 mL of deionized water (containing DOX and Gd) was added. The mixture was transferred into a centrifuge tube and emulsified by sonication at 40% amplitude for 4 min. Obtained emulsion was quickly added to 2 mL of 2% polyvinyl alcohol (PVA) and emulsified for a second time by sonication at 40% amplitude for 5 min. Then, the emulsion was then slowly dropped into 10 mL of 0.6% PVA and stirred overnight. Unencapsulated DOX and Gd were removed by dialysis (MWCO:10K) against deionized water for 2 days.
Nanoparticle Modification with Anti-ICAM1 Antibody
1-ethyl-3-(3-(dimethylamino)propyl) carbodiimide (EDC) (0.5 mg) was added into a mixture of Gd-DOX@PEG/PCL nanoparticles (2 mg/mL) and anti-ICAM1 antibodies (40 μg/mL), and the reaction was carried out at 4 °C overnight. After removing the unconjugated antibody by centrifugation, the antibody-conjugated nanoparticles (Anti-Gd-DOX@PEG/PCL) were stored in PBS (pH 7.4) at 4 °C before use.
Preparation of Other Nanoparticles
Nanoparticles marked with FITC (Gd-Dox@PEG/PCL-FITC and Anti-Gd-Dox@PEG/PCL-FITC) were prepared as the same method as above except for replacing HOOC-PEG-PCL with HOOC-PEG-PCL-FITC and used for assessment with fluorescence microscope and flow cytometry. For in vivo biodistribution experiments, cy5.5-marked nanoparticles (Gd-Dox@PEG/PCL-cy5.5 and Anti-Gd-Dox@PEG/PCL-cy5.5) were prepared by slowly dropping DMSO-solved cy5.5 hydrazide into prepared Gd-Dox@PEG/PCL and Anti-Gd-Dox@PEG/PCL nanoparticles, respectively, with molar ratio of 1:1 and stirring at 37 °C water bath in dark for 24 h. Then, unencapsulated cy5.5 hydrazide was removed by dialysis (MWCO:3.5K) against deionized water for 2 days. Blank nanoparticles (PEG/PCL) without adding DOX and Gd were also prepared to analysis the biocompatibility of the materials.
Characterization of Nanoparticles
The morphology of nanoparticles was assessed with the transmission electron microscope (TEM) (TEM H-800, Hitachi, Japan). Briefly, a small drop of nanoparticle suspension was added to the carbon film and left over night. Then, a drop of 1% (W/V) phosphor-tungstic acid was added onto the film containing the nanoparticle sample and left for 1–2 min before observation. The size and z-potential of nanoparticles were measured with dynamic light scattering (DLS) (Zetasizer, Malvern, UK). Calibration of DOX and Gd was made to quantify the concentration of DOX and Gd in the nanoparticles, respectively (Supplementary Figure S1 and the following section). After dialysis, the drug loading content (DLC) and drug loading efficiency (DLE) for DOX and Gd were measured, respectively, using the following formulas:


In vitro Drug Release
The DOX release was monitored as following. Nanoparticle dispersion (3.00 mL) was dialyzed (MWCO:1K) against tris buffer (80.0 mL) in a beaker (100 mL) at 37 °C and a constant stirring rate of 250 rpm. 2.00 mL samples were withdrawn at various time intervals and analyzed by fluorescence spectroscopy (SpectraMax iD5, Molecular Devices, Shanghai) to measure the DOX concentration at 490 nm and then put back into the beaker after measurement. Calibration of DOX mentioned above was used for quantification. The cumulative DOX release was calculated according to the following formula:
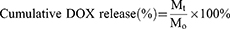
In which Mt (μg) is the total amount of DOX released from nanoparticles at time t, and M0 (μg) is the amount of DOX initially loaded into the nanoparticles.
In vitro MRI
Gd solution (in PBS) with different concentrations were prepared and scanned using a 3.0 T MR scanner (Philips ingenia cs 3.0 T) equipped with a wrist coil. The longitudinal relaxation times (T1) were measured using T1 mapping sequence. The calibration of Gd was derived from the proportional correlation between the concentrations of Gd and their longitudinal relaxivity (r1) (r1=1/T1) (Supplementary Figure S1). To measure the MRI capability of nanoparticles, T1WIs of nanoparticle solutions with different concentrations were also acquired using the same MRI scanner. The T1WI and T1 mapping were acquired with the following parameters: T1WI, FOV 200 × 160 × 18 mm, slice thickness 3 mm, slice gap 0 mm, TE = 13 ms, TR = 500 ms, matrix 1024 × 500 × 396; T1-mapping, FOV 200 × 162.5 × 6 mm, slice thickness 3 mm, slice gap 0 mm, TE = 3.4 ms, TR = 1.60 ms, matrix 384 × 168 × 139.
Cell Culture
Breast cancer cells were cultured in DMEM (MCF7, SK-BR-3 and MDA-MB-231) or RPMI-1640 (BT-474) (GIBCO) medium with 10% fetal bovine serum (GIBCO) and 1% penicillin-streptomycin (GIBCO). MCF10A cells were cultured in MEBM (Lonza/Clonetics) medium with all recommended supplements (Lonza/Clonetics), 10% fetal bovine serum and 1% penicillin-streptomycin. Cells were maintained at 37 °C in a humidified incubator with 5% CO2 and passaged twice a week.
Western Blot
Cells were lysed in radioimmunoprecipitation buffer (Boster Biological Technology) supplemented with protease inhibitor mixture (Boster Biological Technology) on ice. Cell lysates were cleared by centrifugation at 12,000 rpm for 10 min and loading (30 μg) was normalized according to BCA relative protein quantification (Boster Biological Technology). Proteins were separated using 10% SDS-PAGE under reducing conditions and blotted onto nitrocellulose membranes. After electrophoresis, the membranes were blocked with 5% non-fat dry milk in PBS for 1 h and incubated overnight with the following primary antibodies at 4 °C: 1:1000 anti-β-actin (Sigma-Aldrich); 1:1000 anti-icam1 (EPR4776) (Abcam). Blots were then washed on a shaker and probed with respective HRP-conjugated secondary antibodies (goat anti-mouse IgG, goat anti-rabbit IgG, Jackson ImmunoResearch). Bands were visualized using chemiluminescence (Amersham Imager 600, GE). Densitometric analysis was performed using ImageJ software (National Institutes of Health, Bethesda, MD).
Real-Time Quantitative Polymerase Chain Reaction (qPCR)
For qPCR of all cellular mRNAs, total RNA was isolated with Trizol (Invitrogen). Total RNA (0.5 μg) was reverse transcribed to generate cDNA using PrimeScript RT Reagent Kit (TaKaRa Bio) and qPCR was performed using the TB Green Premix Ex Taq II (TaKaRa Bio) with the indicated primer for the real-time PCR detection system (ABI 7900HT Fast, USA). The oligonucleotide primers used here were as follows: ICAM1 forward 5’-TGCAAGAAGATAGCCAACCAAT-3’ and reverse 5’-GTACACGGTGAGGAAGGTTTTA-3’, β-actin forward 5′-CTCCATCCTGGCCTCGCTGT-3′ and reverse 5′-GCTGTCACCTTCACCGTTCC-3′.
Fluorescence Microscope Assessment
MDA-MB-231, MCF7, BT-474, SK-BR-3, and MCF10A cells (5 × 10⁴) were plated in 35 mm glass bottom dish with 1 mL medium and incubated overnight at 37 °C. After medium was removed, cells were fixed with 4% formaldehyde at room temperature for 15 min. Afterwards, cells were rinsed with PBS 3 times and blocked with 5% BSA at room temperature for 60 min. After removal of BSA, cells were incubated overnight with 1:1000 anti-icam1 (EPR4776) (Abcam) at 4 °C. Then, cells were rinsed with PBS 3 times and incubated with 1:1000 cy3 anti-rabbit IgG (Jackson ImmunoResearch) at room temperature at dark place for 60 min. After rinsing with PBS 3 times, cells were incubated with DAPI (1:1000) for 15 min in dark place to stain the cell nuclei. Unconjugated DAPI was washed with PBS 3 times. Finally, cells were soaked in PBS and observed and photographed using a laser scanning confocal microscope (CarlZeiss LSM900, Germany).
For targeting experiments, MDA-MB-231 and MCF7 cells (5 × 10⁴) were plated in 24-well plates with 1 mL medium overnight at 37 °C. Afterwards, old medium was replaced with fresh medium containing 5 μg/mL (equivalent to DOX) of DOX, Gd-Dox@PEG/PCL-FITC or Anti-Gd-Dox@PEG/PCL-FITC and cells were incubated for scheduled time (3 h, 6 h). After washing with PBS for 3 times, cells were fixed with 4% formaldehyde at room temperature for 20 min. Then, DAPI was used to stain the cell nuclei. Finally, cells were soaked in PBS and observed and photographed using an inverted fluorescence microscope (Eclipse Ti2, Intensilight C-HGFI, Nikon, Japan).
Flow Cytometry
MDA-MB-231 cells (5 × 10⁴) were plated in 24-well plates with 1 mL medium and incubated overnight at 37 °C. Afterwards, old medium was replaced with fresh medium containing 5 μg/mL (equivalent to DOX) DOX, Gd-Dox@PEG/PCL-FITC or Anti-Gd-Dox@PEG/PCL-FITC and cells were incubated for scheduled time (3 h, 6 h). After washing with PBS for 3 times, cells were detached with 0.05% Trypsin-EDTA (GIBCO), washed twice with PBS and immediately analyzed with flow cytometer (BD LSRFortessa X-20, BD) to quantify the proportion of cells positive for FITC by gating with FITC channel. All flow cytometry data were analyzed using FlowJo (version 10).
Cytotoxicity Assay
Cell viability were estimated using the conventional colorimetric MTT (3-(4,5-Dimethyl-2-thiazolyl)-2,5-diphenyl-2H-tetrazolium bromide) assay (Beyotime Biotechnology). In brief, 2.5 × 10³ MDA-MB-231 cells per well were seeded in 96-well plates and cultured at 37 °C in the incubator overnight. Then, cells were treated with DOX, Gd-Dox@PEG/PCL or Anti-Gd-Dox@PEG/PCL of different concentrations (equivalent to DOX (μg/mL): 0.0064, 0.032, 0.16, 0.8, 4, 20). After treatment for 48 h, 20 μL MTT (5 mg/mL in PBS) were added to each well followed by 4 h incubation at 37 °C to enable live cells to produce crystalline formazan. After carefully removal of the supernatant of each well, 100 μL DMSO (Dimethyl sulfoxide) (Beyotime Biotechnology) per well was added. Then, plates were shaken with intermediate speed for 10 min to dissolve the crystalline. Absorbance was measured at 490 nm using a fluorescence spectroscopy (SpectraMax iD5, Molecular Devices, Shanghai). Values were normalized to untreated controls with media controls subtracted. For MCF7 cells, 2.5 × 10³ cells were seeded in 96-well plates and cultured at 37 °C in the incubator overnight. Then, cells were treated with DOX, Gd-Dox@PEG/PCL or Anti-Gd-Dox@PEG/PCL of different concentrations (equivalent to DOX (μg/mL): 0.0032, 0.016, 0.08, 0.4, 2, 10) for 48 h. For biocompatibility assessment, cells’ viability was tested after MDA-MB-231 cells and MCF7 cells incubated with blank PEG/PCL nanoparticles of different concentrations (0.5, 5, 50, and 500 μg/mL) for 48 h.
Tumor-Bearing Mouse Model Establishment
Animal studies were performed according to the protocols approved by the Institutional Animal Care and Use Committees of Shanghai Tenth People’s Hospital (SHDSYY-2021-Y0829) and followed the Guideline for ethical review of animal welfare (GB/T 35892–2018). Female Balb/C nu/nu mice with 20 g were obtained from the Shanghai Lab. Animal Research Center (Shanghai, China). The TNBC model was established by subcutaneously injecting 5 × 10⁶ MDA-MB-231 cells into the flank of nude mice. Tumors generally formed in 1 to 2 weeks. Then, tumor growth was monitored daily using caliper, and the volume was calculated with the following formula: 
In vivo Biodistribution
For In vivo biodistribution experiments, tumors were allowed to develop for 2 to 3 weeks until they were at least 200 mm3 in volume. Tumor-bearing mice were randomized into 2 groups (n = 3 for each group). They were intravenously injected with 0.1 mmol/kg (equivalent to Gd) of Gd-Dox@PEG/PCL -cy5.5 (group 1) or Anti-Gd-Dox@PEG/PCL -cy5.5 (group 2) via tail vein. At 1, 2, 4, and 24 h after the injection, tumor-bearing mice were anaesthetized at a vaporizer and in vivo fluorescence imaging was performed using an in-vivo optical imager (InVivo Smart-LF, VIEWORKS Co., KOREA). At 24 h after injection, mice were euthanized, and ex vivo fluorescence images of various organs (heart, liver, lung, kidney, and spleen) and excised tumors were acquired using in vivo optical imager. All of the fluorescence images were adjusted to optimal threshold for displaying tumors.
In vivo MRI
For in vivo MRI, MRI scan was performed using a 3.0 T MR scanner (Philips ingenia cs 3.0 T) equipped with a 3.0 T 8 Ch Mouse Coil (CG-MUC45-H300-AP, Shanghai Chenguang Medical Technology, China). Tumors were allowed to develop for 2 to 3 weeks until they were at least 200 mm3 in volume. Tumor-bearing mice were randomized into three groups (n = 3 for each group). Before scanning, tumor-bearing mice were anaesthetized by intraperitoneal injection of 1% pentobarbital solution at dosage of 50 mg/kg. Non-contrast sagittal non-fat suppressive T2WI and transversal fat suppressive T1WI were acquired before intravenous injection of any drugs. Afterwards, mice were intravenously injected with 0.1 mmol/kg (equivalent to Gd) of Gd (group 1), Gd-Dox@PEG/PCL-cy5.5 (group 2) or Anti-Gd-Dox@PEG/PCL-cy5.5 (group 3) via tail vein, and transversal fat suppressive T1WI was acquired at 5 min, 1, 2, 4, 6, and 24 h after injection. The acquisition parameters were as follows: non-contrast, T1WI-TSE-transverse-fs, FOV: 80 × 80 × 10.5 mm, slice thickness 0.6 mm, slice gap 0.3 mm, TE = 18 ms, TR = 500 ms, matrix 512 × 268 × 226; T2WI-TSE-sagittal, FOV: 80 × 100 × 19 mm, slice thickness 3 mm, slice gap 1 mm, TE = shortest, TR = 1500 ms, matrix 400 × 160 × 149; T1WI-TSE-transverse+C-fs, FOV: 80 × 80 × 10.5 mm, slice thickness 0.6 mm, slice gap 0.3 mm, TE = 18 ms, TR = 500 ms, matrix 512 × 268 × 226. The contrast-noise ratios (CNRs) of tumors on TWI1 at different time points were calculated and compared among different groups. The CNR was calculated with the following formula: CNR=(SIT-SIM)/SDNoise, in which SIT denotes the signal intensity of tumor, SIM denotes the signal intensity of ipsilateral hind limb muscle. Images with tumor of the largest section were selected to measure signal intensity via region of interest (ROI). The ROI of tumor was circular and covered the region of homogeneous enhancement with area larger than 4 mm2, and corresponding SIM was measured in the same image with the same ROI size.
In vivo Therapeutic Efficacy Experiment
For in vivo therapeutic efficacy experiments, tumors were allowed to develop for 1 to 2 weeks until they reached 100 mm3 in volume. Tumor-bearing mice were randomly divided into 4 groups (n = 5 for each group) and were treated with DOX (group 1), Gd-Dox@PEG/PCL (group 2), and Anti-Gd-Dox@PEG/PCL (group 3), respectively, at a dosage of 2 mg/kg (equivalent to DOX) every 3 days. All treatments were performed intravenously via tail vein injection in ~100 μL volume. Additional group of mice (group 4) intravenously injected equivalent volume of saline were set as untreated control. Tumor growth was monitored every other day using caliper. The body weights were also measured every other day. Fifteen days after treatment, the whole blood was collected and analyzed for routine blood parameters and serum biochemical parameters. After euthanasia, tumors were excised and analyzed for apoptosis and proliferation using TUNEL and Ki-67 staining, respectively. Various organs (heart, liver, lung, kidney, and spleen) were collected and analyzed for systemic toxicity using HE staining.
Statistics
All of the experimental data were obtained in triplicate and presented as means ± SD unless otherwise mentioned. One-way analysis of variance (ANOVA) with Bonferroni post hoc tests was used to analyze statistical variance when making multiple comparisons. All statistical analysis was performed using GraphPad Prism software (version 8).
Results and Discussion
Confirmation the Target of TNBC
In order to confirm the expression of ICAM1 in TNBC, we tested the expression of ICAM1 among different subtypes of breast cancer and normal breast epithelium. The result showed that the mRNA of ICAM1 was expressed significantly higher on MDA-MB-231 cells (TNBC) than on other types of breast cancer cells (luminal A type: MCF7, luminal B type: BT-474, HER2+ type: SK-BR-3) and normal breast epithelium (MCF10A) (Figure 1A). The protein expression level of a molecule may be different from its mRNA level after translation and subsequent modification. Therefore, we also compared the protein expression of ICAM1 among these cells. The results showed that the ICAM1 protein was also expressed significantly higher on MDA-MB-231 cells than on other types of breast cancer cells and normal breast epithelium (Figure 1B). In comparison with cytoplastic antigen, cell surface antigen will facilitate binding of exogenous antibody to antigen since the antibody does not need to approach antigen through transcytosis. Thus, the subcellular localization of ICAM1 protein is important for the specific targeting and accumulation of our nanotheranostic particle at tumor site because the binding of ligand to ICAM1 protein is the strategy we designed. Immunofluorescence experiments displayed that ICAM1 was expressed mainly on cell surface (Figure 1C). Besides, the results demonstrated again that ICAM1 was expressed higher on MDA-MB-231 cells. Based on our results and previous studies, ICAM1 was selected as the target of TNBC in this study.
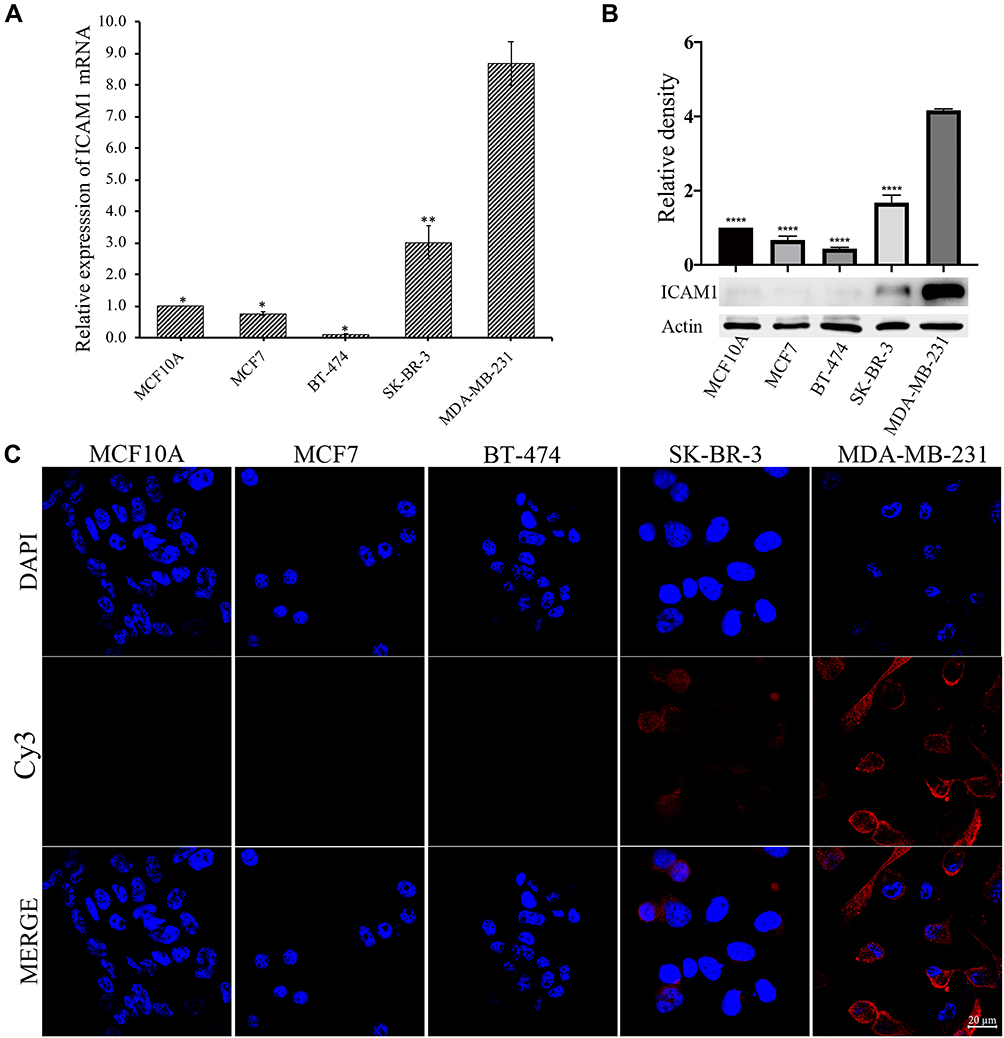 |
Figure 1 The expression of ICAM1 on normal breast epithelium and different types of breast cancer cells. (A) Real-time quantitative PCR, (B) Western-blot, (C) Immunofluorescence. *p < 0.05, **p < 0.01, ****p < 0.0001, in comparison with MDA-MB-231. Experiments were replicated three times. |
Characterization of Targeting Theranostic Nanoparticles
After double emulsion, we yielded hydrophilic nanoparticles with Gd and DOX loading within their hydrophilic inner core named Gd-Dox@PEG/PCL. The target products named Anti-Gd-Dox@PEG/PCL nanoparticles were obtained by modification with anti-ICAM1 antibodies on the surface of Gd-Dox@PEG/PCL. DLS analysis showed the hydrodynamic size of Anti-Gd-Dox@PEG/PCL to be 279.7 ± 7.6 nm and z-potential to be −24.7 ± 0.9 mV (Figure 2A and B). The hydrophilic surface of these nanoparticles makes them blood compatible and suitable for intravenous route of administration. The size of Anti-Gd-Dox@PEG/PCL nanoparticles is larger than most of other nanoparticles based on PEG/PCL.33 However, size will not be a barrier for these nanoparticles to extravasate through leaky tumor vascular since the fenestrations in most tumor vasculature range in size from 380 to 780 nm.34 The negative surface charge can reduce the adsorption of serum proteins, thus resulting in longer circulation time.35,36 The TEM image showed that Anti-Gd-Dox@PEG/PCL nanoparticles displayed membrane structure and irregular shape (Figure 2C).
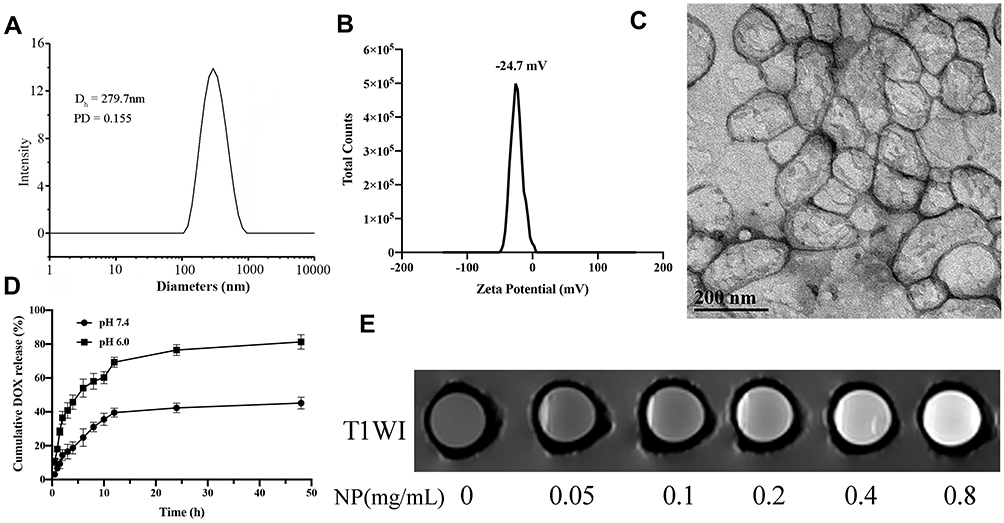 |
Figure 2 Characterization of Anti-Gd-Dox@PEG/PCL. (A) The hydrodynamic size distribution, (B) The zeta-potential distribution, (C) Transmission electron microscope image, (D) The release profile of DOX in tris buffer, (E) T1WI images of different concentrations. |
DOX released from the nanoparticles is pH-dependent. At pH 6.0, 76.5% DOX was released after 24 h, and the release percentage continued to increase to 81.3% after 48 h. However, at pH7.4 the release percentage was only 42.3% after 24 h and 45.2% after 48 h (Figure 2D). This pH sensitivity facilitates the release of DOX from the nanoparticles in acidic tumor microenvironment37 while reduces unfavored leakage of DOX from the nanoparticles at undesired place in the body.
In order to test the T1 contrast ability, T1WI images of Anti-Gd-Dox@PEG/PCL nanoparticles in aqueous solutions with various concentrations were acquired. The result showed that T1WI images of Anti-Gd-Dox@PEG/PCL solutions became observably brighter as the concentration of Anti-Gd-Dox@PEG /PCL increased, suggesting its excellent T1 contrast ability (Figure 2E). The quantification of DOX and Gd were calculated from the calibrations of DOX and Gd, respectively (Supplementary Figure S1). The DLE and DLC for DOX were 13.23% and 1.75%, and for Gd 28.80% and 67.54%, respectively. The loading efficacy of DOX in our study is relatively low compared with other studies.38,39 This may be attributed to the concurrently loading both DOX and Gd within a nanoparticle for the theranostic purpose as well as the synthesis methods. However, the ability of active targeting and extended circulation time of these nanoparticles will lower required drug loading.
In vitro Targeting Capability of Anti-Gd-Dox@PEG/PCL Nanoparticles
In order to determine whether Anti-Gd-Dox@PEG/PCL nanoparticles can specifically target to TNBC, MDA-MB-231 and MCF7 cells were incubated with Anti-Gd-Dox@PEG/PCL-FITC, Gd-Dox@PEG/PCL-FITC and DOX, respectively. The results showed that MDA-MB-231 cells absorbed more Anti-Gd-Dox@PEG/PCL-FITC nanoparticles than Gd-Dox@PEG/PCL-FITC nanoparticles after 3 h treatment. Besides, the difference of absorption increased as the incubation time extended to 6 h (Figure 3A). The analysis of flow cytometry quantitatively displayed the above difference: the percentage of FITC positive MDA-MB-231 cells was 3.98% ± 1.21% in Anti-Gd-Dox@PEG/PCL-FITC treated group and 0.96% ± 0.18% in Gd-Dox@PEG/PCL-FITC treated group after 3 h incubation (p = 0.005), and the percentage increased to 21.57% ± 2.96% in Anti-Gd-Dox@PEG/PCL-FITC treated group but was almost unchanged in Gd-Dox@PEG/PCL-FITC treated group (1.64% ± 0.25%) (p < 0.001 in comparison with Anti-Gd-Dox@PEG/PCL-FITC treated group) as the incubation time extended to 6 h (Figure 3B and C). In contrast, the absorption of Anti-Gd-Dox@PEG/PCL-FITC nanoparticles or Gd-Dox@PEG/PCL-FITC nanoparticles was barely observed in MCF7 cells even though the incubation time was extended to 6 h (Supplementary Figure S2). The above results indicated that the Anti-Gd-Dox@PEG/PCL nanoparticles we synthesized could specifically target to TNBC via binding to ICAM1, which was higher in TNBC than in other types of breast cancer and normal breast epithelium.
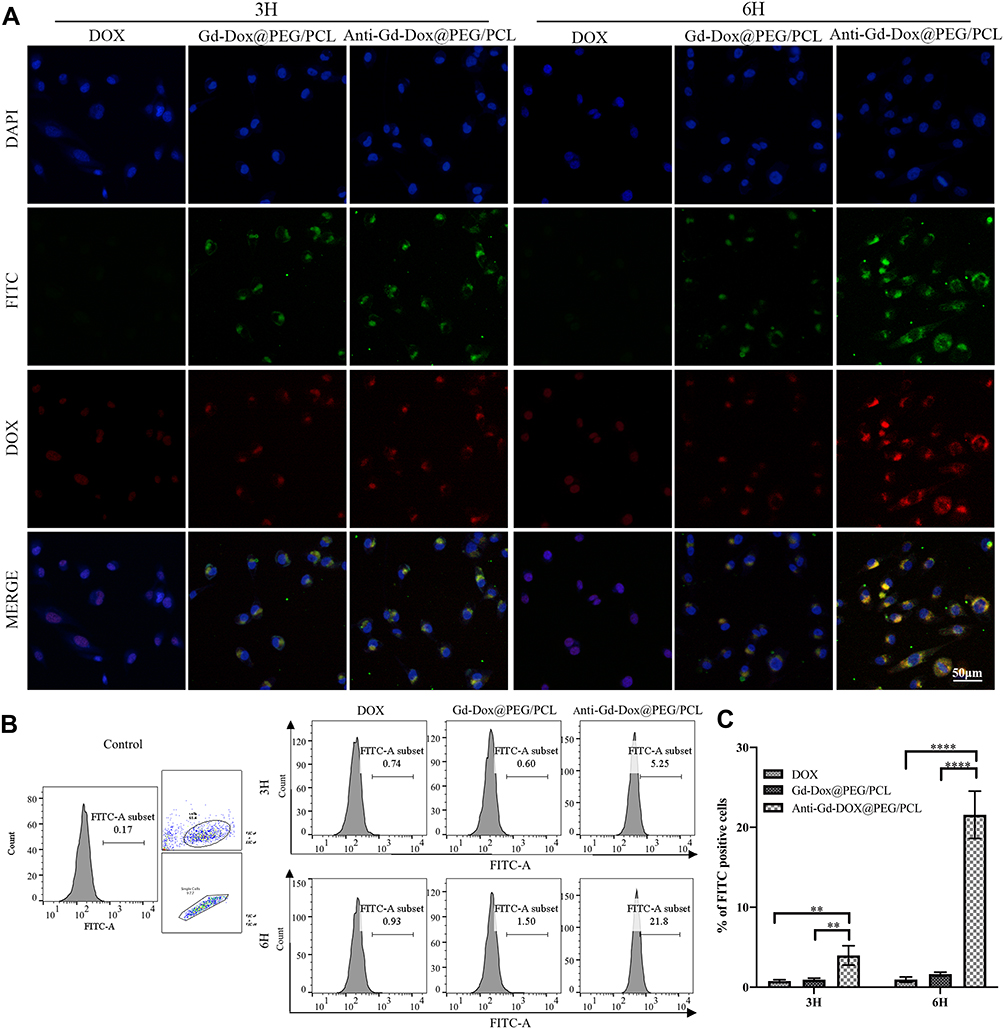 |
Figure 3 In vitro targeting capacity of Anti-Gd-Dox@PEG/PCL nanoparticles. (A) Fluorescence microscope images of MDA-MB-231 cells treated with Anti-Gd-Dox@PEG/PCL-FITC, Gd-Dox@PEG/PCL-FITC and DOX for 3 h and 6 h, respectively, (B) Flow cytometry analysis of FITC positive MDA-MB-231 cells, gating with FITC channel, numbers represent the percentage of FITC positive cells, (C) The comparison of percentages of FITC positive MDA-MB-231 cells in Anti-Gd-Dox@PEG/PCL-FITC, Gd-Dox@PEG/PCL-FITC and DOX treated groups in different time. **p < 0.01, ****p < 0.0001. Experiments were replicated 3 times. |
Cytotoxicity of Anti-Gd-Dox@PEG/PCL Nanoparticles
In order to determine the cytotoxicity of Anti-Gd-Dox@PEG/PCL nanoparticles, viability of different cells after incubation with various nanoparticles for 48 h was tested by traditional MTT assay. Firstly, blank PEG/PCL nanoparticles with different concentrations were incubated with MDA-MB-231 cells and MCF7 cells to investigate their biocompatibility. The results showed that blank PEG/PCL nanoparticles had little cytotoxicity to these cells even at concentration up to 500 μg/mL (Figure 4A), indicating good biocompatibility of the carriers. Then, the cytotoxicity to MDA-MB-231 cells was compared among Anti-Gd-Dox@PEG/PCL nanoparticles, Gd-Dox@PEG/PCL nanoparticles and DOX. The results showed that Anti-Gd-Dox@PEG/PCL nanoparticles were more effective in inhibiting the proliferation of MDA-MB-231 cells than Gd-Dox@PEG/PCL nanoparticles or DOX, with its half maximal inhibitory concentration (IC50) (0.29 ± 0.06 μg/mL) significantly lower than that of Gd-Dox@PEG/PCL nanoparticles (0.67 ± 0.02 μg/mL, p < 0.0001) or DOX (0.57 ± 0.03 μg/mL, p < 0.001) (Figure 4B and C). To verify the specifical inhibition of Anti-Gd-Dox@PEG/PCL nanoparticles to TNBC, MCF7 cells were also treated with Anti-Gd-Dox@PEG/PCL nanoparticles, Gd-Dox@PEG/PCL nanoparticles and DOX, respectively. Comparable cytotoxicity to MCF7 cell was observed for Anti-Gd-Dox@PEG/PCL nanoparticles, Gd-Dox@PEG/PCL nanoparticles and DOX, with their IC50s to be 0.67 ± 0.09 μg/mL, 0.91 ± 0.19 μg/mL and 0.59 ± 0.14 μg/mL (p = 0.080), respectively (Figure 4D and E). These results indicated that the cytotoxicity of Anti-Gd-Dox@PEG/PCL nanoparticles to TNBC was significantly enhanced by specifically targeting to ICAM1.
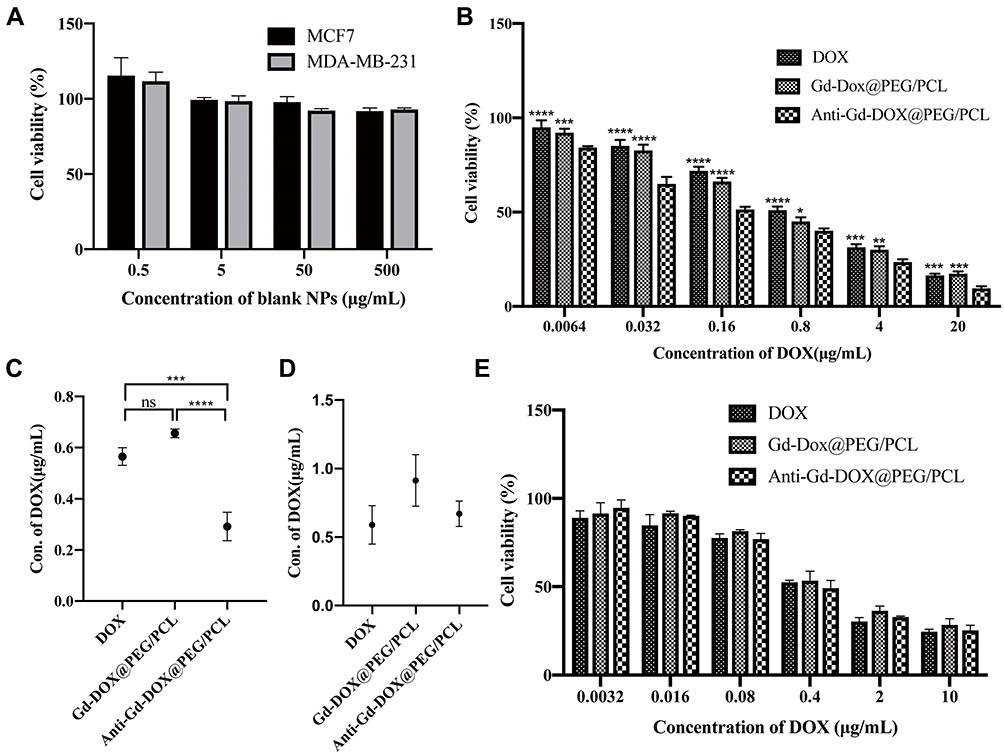 |
Figure 4 Cytotoxicity of Anti-Gd-Dox@PEG/PCL nanoparticles. (A) Cell viability of MDA-MB-231 cells and MCF7 cells after incubation with blank PEG/PCL nanoparticles for 48 h, (B) Cell viability of MDA-MB-231 cells after incubation with Anti-Gd-Dox@PEG/PCL, Gd-Dox@PEG/PCL and DOX for 48 h, (C) IC50s for Anti-Gd-Dox@PEG/PCL, Gd-Dox@PEG/PCL and DOX in MDA-MB-231 cells, (D) IC50s for Anti-Gd-Dox@PEG/PCL, Gd-Dox@PEG/PCL and DOX in MCF7 cells, (E) Cell viability of MCF7 cells after incubation with Anti-Gd-Dox@PEG/PCL, Gd-Dox@PEG/PCL and DOX for 48 h. *p < 0.05, **p < 0.01, ***p < 0.001, ****p < 0.0001, ns p > 0.05, in comparison with Anti-Gd-DOX@PEG/PCL in B. Experiments were replicated 3 times. |
In vivo Biodistribution of Anti-Gd-Dox@PEG/PCL Nanoparticles
As is well known, the biodistribution of a nanomaterial is important for its application in medical imaging or therapy. In order to investigate the biodistribution of Anti-Gd-Dox@PEG/PCL nanoparticles in vivo, MDA-MB-231 tumor-bearing nude mice were injected with Anti-Gd-Dox@PEG/PCL-cy5.5 and Gd-Dox@PEG/PCL-cy5.5 nanoparticles, respectively, through the tail vein. Then, the in vivo cy5.5 fluorescence images were acquired using an in vivo imaging system at 1, 2, 4, and 24 h after injection. As expected, effective accumulation of nanoparticles at tumor sites could be seen (Figure 5A) and possibly attributed to the EPR effect in solid tumors with tortuous and leaky vasculatures. Furthermore, accumulation of nanoparticles continuously increased within 2 h after injection (Figure 5A). Excitingly, the accumulation of Anti-Gd-Dox@PEG/PCL-cy5.5 nanoparticles at tumor sites was more efficient than that of Gd-Dox@PEG/PCL-cy5.5 nanoparticles (Figure 5A), indicating that the specific targeting capability of the former could enhance the tumor uptake. In addition, the images showed that metabolism of nanoparticles occurred mainly in liver and kidney, especially in liver (Figure 5A). Ex vivo images of major organs and tumors 24 h after injection further confirmed the specific targeting capability of Anti-Gd-Dox@PEG/PCL-cy5.5 nanoparticles to tumors and metabolism of nanoparticles in liver (Figure 5B). Therefore, the prolonged circulation time and specific targeting capability of Anti-Gd-Dox@PEG/PCL-cy5.5 nanoparticles make them a favorable particle for in vivo imaging and therapy of TNBC.
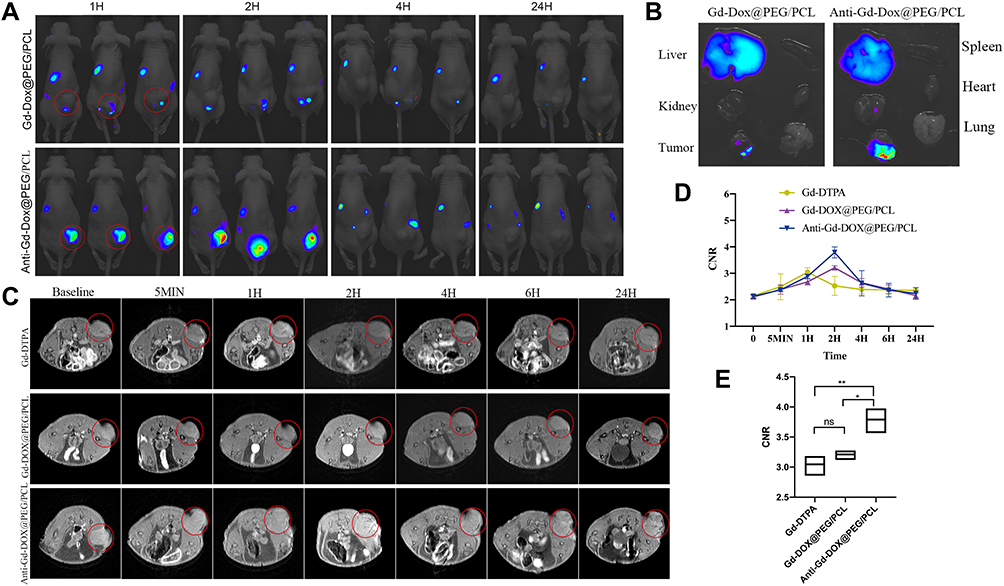 |
Figure 5 In vivo biodistribution and in vivo T1 contrast of Anti-Gd-Dox@PEG/PCL nanoparticles. (A) In vivo cy5.5 fluorescence images of MDA-MB-231 tumor-bearing mice after injection with Anti-Gd-Dox@PEG/PCL-cy5.5 and Gd-Dox@PEG/PCL-cy5.5 nanoparticles respectively through the tail vein, (B) Ex vivo cy5.5 fluorescence images of heart, liver, lung, kidney, spleen, and tumor 24 h after injection, (C) In vivo MRI T1WI of MDA-MB-231 tumor-bearing mice, (D) Contrast-noise ratios (CNRs) of tumors on T1WI, (E) Comparison of peaks of CNRs. *p < 0.05, **p < 0.01, ns p > 0.05, n = 3 for each group. Red circle: region of interest (tumor). |
In vivo T1 Contrast of Anti-Gd-Dox@PEG/PCL Nanoparticles
Anti-Gd-Dox@PEG/PCL nanoparticles displayed excellent T1 contrast ability in vitro. Herein, the in vivo T1 contrast capability of them was assessed. The CNRs of tumors were measured after injection of Anti-Gd-Dox@PEG/PCL nanoparticles, Gd-Dox@PEG/PCL nanoparticles and traditional Gd-DTPA via tail vein. In mice injected with Gd-DTPA, CNRs of tumors started to increase soon after injection (5 min) due to the accumulation of contrast agents through EPR effect, so as in mice injected with Anti-Gd-Dox@PEG/PCL nanoparticles and Gd-Dox@PEG/PCL nanoparticles (Figure 5C and D). However, the CNRs continuously increased to peak at 2 h after injection in mice injected with Anti-Gd-Dox@PEG/PCL nanoparticles and Gd-Dox@PEG/PCL nanoparticles, while the CNRs in mice injected with traditional Gd-DTPA reached its peak at merely 1 h after injection (Figure 5C and D). This indicated that the circulation time of nanoparticles was extended by PEG/PCL-based carriers, as demonstrated in previous studies,40–42 so that they obtained more opportunity to accumulate in tumor. Furthermore, the peak CNR of Anti-Gd-Dox@PEG/PCL nanoparticles (3.79 ± 0.21) was significantly higher than that of Gd-Dox@PEG/PCL nanoparticles (3.21 ± 0.08, p = 0.011) or Gd-DTPA (3.05 ± 0.17, p = 0.003) (Figure 5E), indicating enhanced accumulation of Anti-Gd-Dox@PEG/PCL nanoparticles at tumor site via specifical targeting capability.
In vivo Therapeutic Efficacy of Anti-Gd-Dox@PEG/PCL Nanoparticles
In order to verify the in vivo tumor therapeutic efficacy of Anti-Gd-Dox@PEG/PCL nanoparticles, MDA-MB-231 tumor-bearing mice were intravenously treated with Anti-Gd-Dox@PEG/PCL nanoparticles, Gd-Dox@PEG/PCL nanoparticles and DOX, respectively, at a dosage equivalent to DOX of 2 mg/kg every 3 days for 2 weeks. In comparison with untreated control group, significant inhibition of tumor growth was observed in all 3 treated groups (all p < 0.001) during the treatment (Figure 6A-C). Furthermore, the tumor growth inhibition was more obvious in mice treated with Anti-Gd-Dox@PEG/PCL nanoparticles (p = 0.004) and Gd-Dox@PEG/PCL nanoparticles (p = 0.022) than in those treated with traditional chemotherapeutical drug DOX (Figure 6A). Tumor inhibition by Anti-Gd-Dox@PEG/PCL nanoparticles was slightly more effective than by Gd-Dox@PEG/PCL nanoparticles. Although the volume difference between the 2 groups was not significant (202.87 ± 33.19 mm3 vs 256.83 ± 26.08 mm3, p = 0.851) possibly due to measurement error (Figure 6A), the tumor weight was significantly lower in Anti-Gd-Dox@PEG/PCL treated group (0.15 ± 0.02 g) than in Gd-Dox@PEG/PCL treated group (0.26 ± 0.04 g, p = 0.014) (Figure 6B). The above results indicated that the extended circulation time by PEG/PCL-based carriers may play the major role in tumor therapeutic efficacy. At the end of treatment, mice were sacrificed and tumors were excised to analyze the proliferation and apoptosis via Ki-67 and TUNEL staining. The results showed that the proliferation of tumor cells decreased in mice from treated groups, especially in mice treated with Anti-Gd-Dox@PEG/PCL nanoparticles, displayed as less brown-staining tumor cells on Ki-67 staining (Figure 6D). On the contrary, the apoptosis of tumor cells increased most obviously in mice treated with Anti-Gd-Dox@PEG/PCL nanoparticles, displayed as most red-staining tumor cells on TUNEL staining (Figure 6D). The above results demonstrated that Anti-Gd-Dox@PEG/PCL nanoparticles had increased tumor therapeutic efficacy in comparison with traditional chemotherapeutic drug DOX due to specifical targeting capability and extended circulation time resulted from PEG/PCL-based carriers. Nanoparticles based on PEG/PCL have been shown to significantly reduce protein adsorption, thus minimizing the immune response and toxicity.43–45 Consistently, the body weight of mice in all groups remained stable during treatment (Figure 6E), and there was no significant damage to major organs such as heart, liver, spleen, kidney, and lung after treatment (Figure 6F) and no inflammation and abnormal liver and kidney function (Supplementary Figure S3), demonstrating the biosafety of Anti-Gd-Dox@PEG/PCL nanoparticles for in vivo application.
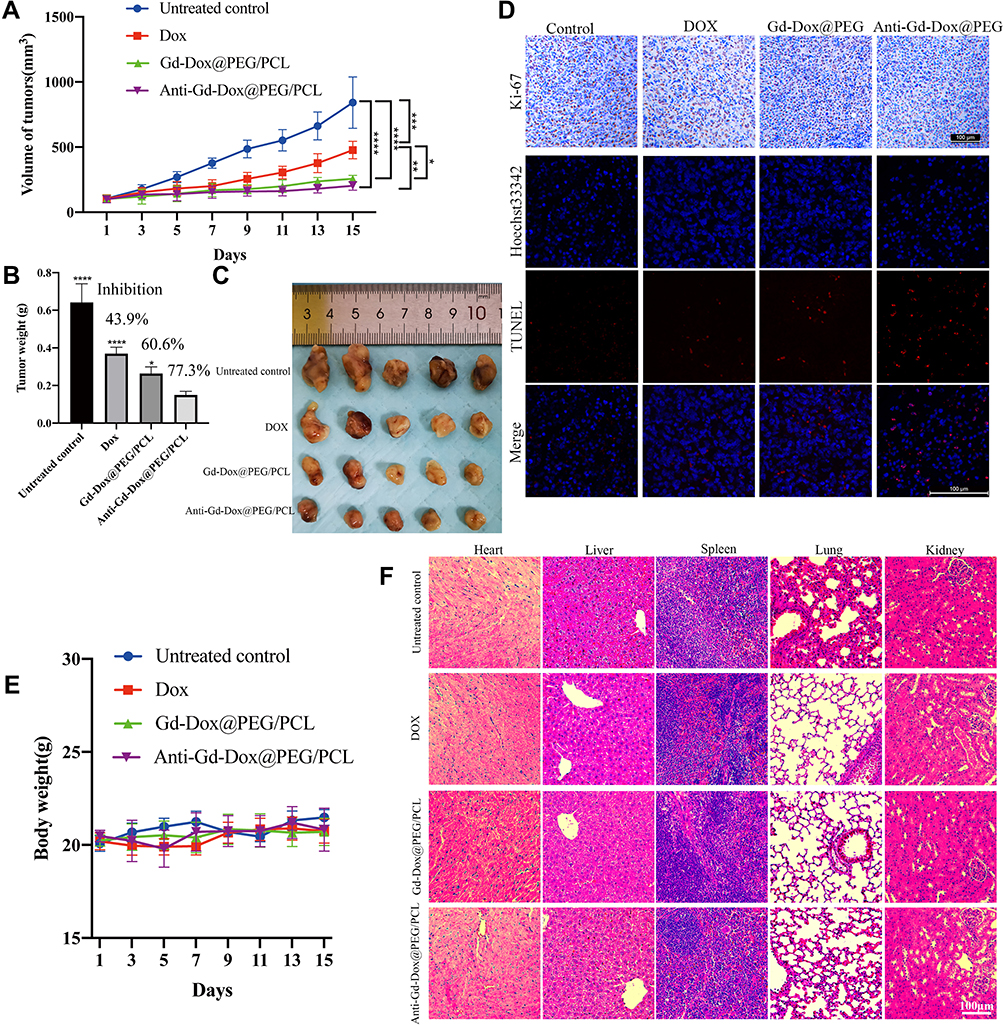 |
Figure 6 In vivo therapeutic efficacy of Anti-Gd-Dox@PEG/PCL nanoparticles. (A) Volume of tumors during treatment, (B) Tumor weights at the end of treatment, (C) Tumors excised at the end of treatment, (D) Ki-67 and TUNEL staining of tumors, (E) Body weight of mice during treatment, (F) HE staining of major organs including heart, liver, spleen, lung, and kidney. *p < 0.05, **p < 0.01, ***p < 0.001, ****p < 0.0001, in comparison with Anti-Gd-DOX@PEG/PCL in B. N = 5 for each group. |
Conclusions
We have developed a new nanoparticle based on Anti-Gd-Dox@PEG/PCL nanoparticles with PEG/PCL-based carriers loading with Gd and DOX for simultaneous specific MRI and therapy of TNBC. The Anti-Gd-Dox@PEG/PCL nanoparticles were prepared via simple synthesis by emulsification of PEG/PCL with mixture of DOX and Gd and subsequent modification with anti-ICAM1. These nanoparticles could actively accumulate in TNBC tumor sites due to their prolonged circulation time as well as the specific targeting capability. Overall, this study developed a new nanoparticle for MRI and chemotherapy of TNBC, providing a promising theranostic approach for MRI-guided therapy of TNBC.
Acknowledgments
This work was supported by the National Natural Science Foundation of China (No 81871325), Project of Science and Technology Commission of Shanghai Municipality (STCSM) (20Y11911800) and SCDSTC (CKY2021-41).
Disclosure
The authors report no conflicts of interest in this work.
References
1. Fan L, Strasser-Weippl K, Li JJ, et al. Breast cancer in China. Lancet Oncol. 2014;15(7):e279–289. doi:10.1016/S1470-2045(13)70567-9
2. Zheng R, Zhang S, Zeng H, et al. Cancer incidence and mortality in China, 2016. J Natl Cancer Cent. 2022;5:38.
3. Dawson SJ, Provenzano E, Caldas C. Triple negative breast cancers: clinical and prognostic implications. Eur J Cancer. 2009;45(Suppl 1):27–40. doi:10.1016/S0959-8049(09)70013-9
4. Edition S, Edge SB, Byrd DR. AJCC Cancer Staging Manual Eighth Edition.
5. Dent R, Trudeau M, Pritchard KI, et al. Triple-negative breast cancer: clinical features and patterns of recurrence. Clin Cancer Res. 2007;13(15 Pt 1):4429–4434. doi:10.1158/1078-0432.CCR-06-3045
6. Won KA, Spruck C. Triple negative breast cancer therapy: current and future perspectives (Review). Int J Oncol. 2020;57(6):1245–1261. doi:10.3892/ijo.2020.5135
7. Tacar O, Sriamornsak P, Dass CR. Doxorubicin: an update on anticancer molecular action, toxicity and novel drug delivery systems. J Pharm Pharmacol. 2013;65(2):157–170. doi:10.1111/j.2042-7158.2012.01567.x
8. Dawidczyk CM, Kim C, Park JH, et al. State-of-The-art in design rules for drug delivery platforms: lessons learned from FDA-approved nanomedicines. J Control Release. 2014;187:133–144. doi:10.1016/j.jconrel.2014.05.036
9. van de Stolpe A, van der Saag PT. Intercellular adhesion molecule-1. J Mol Med (Berl). 1996;74(1):13–33. doi:10.1007/BF00202069
10. Devadoss D, Daly G, Manevski M, et al. A long noncoding RNA antisense to ICAM-1 is involved in allergic asthma associated hyperreactive response of airway epithelial cells. Mucosal Immunol. 2021;14(3):630–639. doi:10.1038/s41385-020-00352-9
11. Manevski M, Devadoss D, Long C, et al. Increased Expression of LASI lncRNA Regulates the Cigarette Smoke and COPD Associated Airway Inflammation and Mucous Cell Hyperplasia. Front Immunol. 2022;13:803362. doi:10.3389/fimmu.2022.803362
12. Rosette C, Roth RB, Oeth P, et al. Role of ICAM1 in invasion of human breast cancer cells. Carcinogenesis. 2005;26(5):943–950. doi:10.1093/carcin/bgi070
13. Schroder C, Witzel I, Muller V, et al. Prognostic value of intercellular adhesion molecule (ICAM)-1 expression in breast cancer. J Cancer Res Clin Oncol. 2011;137(8):1193–1201. doi:10.1007/s00432-011-0984-2
14. Zhang Y, Wang M, Liu W, Peng X. Optical imaging of triple-negative breast cancer cells in xenograft athymic mice using an ICAM-1-targeting small-molecule probe. Mol Imaging Biol. 2019;21(5):835–841. doi:10.1007/s11307-018-01312-3
15. Guo P, Yang J, Liu D, et al. Dual complementary liposomes inhibit triple-negative breast tumor progression and metastasis. Sci Adv. 2019;5(3):eaav5010. doi:10.1126/sciadv.aav5010
16. Guo P, Huang J, Wang L, et al. ICAM-1 as a molecular target for triple negative breast cancer. Proc Natl Acad Sci U S A. 2014;111(41):14710–14715. doi:10.1073/pnas.1408556111
17. Yang J, Wang T, Zhao L, et al. Gold/alpha-lactalbumin nanoprobes for the imaging and treatment of breast cancer. Nat Biomed Eng. 2020;4(7):686–703. doi:10.1038/s41551-020-0584-z
18. Schilb AL, Ayat NR, Vaidya AM, et al. Efficacy of targeted ECO/miR-200c nanoparticles for modulating tumor microenvironment and treating triple negative breast cancer as non-invasively monitored by MR molecular imaging. Pharm Res. 2021;38(8):1405–1418. doi:10.1007/s11095-021-03083-z
19. Jiang Q, Liu L, Li Q, et al. NIR-laser-triggered gadolinium-doped carbon dots for magnetic resonance imaging, drug delivery and combined photothermal chemotherapy for triple negative breast cancer. J Nanobiotechnology. 2021;19(1):64. doi:10.1186/s12951-021-00811-w
20. Amrahli M, Centelles M, Cressey P, et al. MR-labelled liposomes and focused ultrasound for spatiotemporally controlled drug release in triple negative breast cancers in mice. Nanotheranostics. 2021;5(2):125–142. doi:10.7150/ntno.52168
21. Alawak M, Abu Dayyih A, Mahmoud G, et al. ADAM 8 as a novel target for doxorubicin delivery to TNBC cells using magnetic thermosensitive liposomes. Eur J Pharm Biopharm. 2021;158:390–400. doi:10.1016/j.ejpb.2020.12.012
22. Huang S, Zhu W, Zhang F, et al. Silencing of pyruvate kinase M2 via a metal-organic framework based theranostic gene nanomedicine for triple-negative breast cancer therapy. ACS Appl Mater Interfaces. 2021;13(48):56972–56987. doi:10.1021/acsami.1c18053
23. Hu X, Lu Y, Zhao W, et al. A PDA-DTC/Cu-MnO2 nanoplatform for MR imaging and multi-therapy for triple-negative breast cancer treatment. Chem Commun (Camb). 2021;57(34):4158–4161. doi:10.1039/D1CC00987G
24. Wang Y, Jiang L, Zhang Y, et al. Fibronectin-targeting and cathepsin B-activatable theranostic nanoprobe for MR/fluorescence imaging and enhanced photodynamic therapy for triple negative breast cancer. ACS Appl Mater Interfaces. 2020;12(30):33564–33574. doi:10.1021/acsami.0c10397
25. Abulrob A, Corluka S, Blasiak B, et al. LyP-1 conjugated nanoparticles for magnetic resonance imaging of triple negative breast cancer. Mol Imaging Biol. 2018;20(3):428–435. doi:10.1007/s11307-017-1140-4
26. Thakur V, Kutty RV. Recent advances in nanotheranostics for triple negative breast cancer treatment. J Exp Clin Cancer Res. 2019;38(1):430–452. doi:10.1186/s13046-019-1443-1
27. Prince MR, Zhang H, Zou Z, Staron RB, Brill PW. Incidence of immediate gadolinium contrast media reactions. AJR Am J Roentgenol. 2011;196(2):W138–143. doi:10.2214/AJR.10.4885
28. Wu Y, Ng DY, Kuan SL, Weil T. Protein-polymer therapeutics: a macromolecular perspective. Biomater Sci. 2015;3(2):214–230. doi:10.1039/C4BM00270A
29. Kolate A, Baradia D, Patil S, Vhora I, Kore G, Misra A. PEG - a versatile conjugating ligand for drugs and drug delivery systems. J Control Release. 2014;192:67–81. doi:10.1016/j.jconrel.2014.06.046
30. Dash TK, Konkimalla VB. Poly-small je, Ukrainian-caprolactone based formulations for drug delivery and tissue engineering: a review. J Control Release. 2012;158(1):15–33. doi:10.1016/j.jconrel.2011.09.064
31. Lam CX, Hutmacher DW, Schantz JT, Woodruff MA, Teoh SH. Evaluation of polycaprolactone scaffold degradation for 6 months in vitro and in vivo. J Biomed Mater Res A. 2009;90(3):906–919. doi:10.1002/jbm.a.32052
32. Martinez-Diaz S, Garcia-Giralt N, Lebourg M, et al. In vivo evaluation of 3-dimensional polycaprolactone scaffolds for cartilage repair in rabbits. Am J Sports Med. 2010;38(3):509–519. doi:10.1177/0363546509352448
33. Grossen P, Witzigmann D, Sieber S, Huwyler J. PEG-PCL-based nanomedicines: a biodegradable drug delivery system and its application. J Control Release. 2017;260:46–60. doi:10.1016/j.jconrel.2017.05.028
34. Hobbs SK, Monsky WL, Yuan F, et al. Regulation of transport pathways in tumor vessels: role of tumor type and microenvironment. Proc Natl Acad Sci U S A. 1998;95(8):4607–4612. doi:10.1073/pnas.95.8.4607
35. Alexis F, Pridgen E, Molnar LK, et al. Factors affecting the clearance and biodistribution of polymeric nanoparticles. Mol Pharm. 2008;5(4):505–515. doi:10.1021/mp800051m
36. Blanco E, Shen H, Ferrari M. Principles of nanoparticle design for overcoming biological barriers to drug delivery. Nat Biotechnol. 2015;33(9):941–951. doi:10.1038/nbt.3330
37. Boedtkjer E, Pedersen SF. The Acidic Tumor Microenvironment as a Driver of Cancer. Annu Rev Physiol. 2020;82(1):103–126. doi:10.1146/annurev-physiol-021119-034627
38. Jafari A, Yan L, Mohamed MA, Wu Y, Cheng C. Well-defined diblock poly(ethylene glycol)-b-poly(epsilon-caprolactone)-based polymer-drug conjugate micelles for pH-responsive delivery of doxorubicin. Materials. 2020;13(7):1510. doi:10.3390/ma13071510
39. Zhang L, Chen Z, Wang H, et al. Preparation and evaluation of PCL–PEG–PCL polymeric nanoparticles for doxorubicin delivery against breast cancer. RSC Adv. 2016;6(60):54727–54737. doi:10.1039/C6RA04687H
40. Jokerst JV, Lobovkina T, Zare RN, Gambhir SS. Nanoparticle PEGylation for imaging and therapy. Nanomedicine. 2011;6(4):715–728. doi:10.2217/nnm.11.19
41. van Vlerken LE, Vyas TK, Amiji MM. Poly(ethylene glycol)-modified nanocarriers for tumor-targeted and intracellular delivery. Pharm Res. 2007;24(8):1405–1414. doi:10.1007/s11095-007-9284-6
42. Veronese FM, Pasut G. PEGylation, successful approach to drug delivery. Drug Discov Today. 2005;10(21):1451–1458. doi:10.1016/S1359-6446(05)03575-0
43. Liu X, Yuan L, Li D, et al. Blood compatible materials: state of the art. J Mater Chem B. 2014;2(35):5718–5738. doi:10.1039/C4TB00881B
44. Unsworth LD, Sheardown H, Brash JL. Polyethylene oxide surfaces of variable chain density by chemisorption of PEO-thiol on gold: adsorption of proteins from plasma studied by radiolabelling and immunoblotting. Biomaterials. 2005;26(30):5927–5933. doi:10.1016/j.biomaterials.2005.03.010
45. Unsworth LD, Sheardown H, Brash JL. Protein Resistance of Surfaces Prepared by Sorption of End-Thiolated Poly(ethylene glycol) to Gold: effect of Surface Chain Density. Langmuir. 2005;21(3):1036–1041. doi:10.1021/la047672d
 © 2022 The Author(s). This work is published and licensed by Dove Medical Press Limited. The full terms of this license are available at https://www.dovepress.com/terms.php and incorporate the Creative Commons Attribution - Non Commercial (unported, v3.0) License.
By accessing the work you hereby accept the Terms. Non-commercial uses of the work are permitted without any further permission from Dove Medical Press Limited, provided the work is properly attributed. For permission for commercial use of this work, please see paragraphs 4.2 and 5 of our Terms.
© 2022 The Author(s). This work is published and licensed by Dove Medical Press Limited. The full terms of this license are available at https://www.dovepress.com/terms.php and incorporate the Creative Commons Attribution - Non Commercial (unported, v3.0) License.
By accessing the work you hereby accept the Terms. Non-commercial uses of the work are permitted without any further permission from Dove Medical Press Limited, provided the work is properly attributed. For permission for commercial use of this work, please see paragraphs 4.2 and 5 of our Terms.