Back to Journals » OncoTargets and Therapy » Volume 14
High Red Cell Distribution Width Independently Predicts Adverse Survival in Patients with Newly Diagnosed Skull Base Chordoma
Authors Li M, Shen Y, Xiong Y, Bai J, Wang S, Li C ![]() , Zhang Y
, Zhang Y ![]()
Received 22 August 2021
Accepted for publication 29 November 2021
Published 11 December 2021 Volume 2021:14 Pages 5435—5445
DOI https://doi.org/10.2147/OTT.S335454
Checked for plagiarism Yes
Review by Single anonymous peer review
Peer reviewer comments 4
Editor who approved publication: Dr Leo Jen-Liang Su
Mingxuan Li,1,* Yutao Shen,1,* Yujia Xiong,1,* Jiwei Bai,2 Shuai Wang,1 Chuzhong Li,1 Yazhuo Zhang1– 5
1Beijing Neurosurgical Institute, Capital Medical University, Beijing, People’s Republic of China; 2Department of Neurosurgery, Beijing Tiantan Hospital, Capital Medical University, Beijing, People’s Republic of China; 3Beijing Institute for Brain Disorders Brain Tumor Center, Beijing, People’s Republic of China; 4China National Clinical Research Center for Neurological Diseases, Beijing, People’s Republic of China; 5Key Laboratory of Central Nervous System Injury Research, Capital Medical University, Beijing, People’s Republic of China
*These authors contributed equally to this work
Correspondence: Yazhuo Zhang Email [email protected]
Objective: Accumulating studies report that levels of mean corpuscular volume (MCV) and red cell distribution width (RDW) are associated with outcomes in cancer patients, while studies including MCV and RDW in chordoma are lacking so far. Therefore, our study aims to investigate the prognostic impact of MCV and RDW on survival in skull base chordoma patients.
Methods: Levels of preoperative MCV and RDW in 187 primary skull base chordoma patients were collected. X-tile software was used to find the cutoff values of MCV and RDW. Progression-free survival (PFS) and overall survival (OS) analyses were performed using the Kaplan–Meier methods, Cox analysis, and nomogram model.
Results: Low MCV level (MCV < 84.2) was more commonly observed in classical chordoma patients (p=0.022). High RDW level (RDW≥ 12.7) was correlated with older patient age (p=0.022) and a tough tumor texture (p=0.035). Low MCV level and high RDW level were associated with poor PFS (p=0.045 and 0.007, respectively) and OS (p=0.023 and < 0.001, respectively). Multivariate Cox analysis demonstrated that RDW was an independent prognostic indicator for both PFS (p=0.001) and OS (p< 0.001). Importantly, a nomogram based on RDW and clinical predictors showed satisfactory performance for PFS and OS prediction (concordance index, C-index: 0.684 and 0.744, respectively).
Conclusion: Our data was first to reveal the prognostic role of RDW in skull base chordoma, and identified the use of RDW may contribute to a more accurate prognosis judgment and personalized treatment decision.
Keywords: skull base chordoma, mean corpuscular volume, red cell distribution width, survival analysis, biomarker
Introduction
Skull base chordoma, which accounts for approximately 30% of all chordoma, is a slow-growing malignant neoplasm that is believed to originate from remnants of notochord, with an incidence of one per million per year.1,2 Maximal surgical resection and adjuvant radiotherapy are recommended for better local control and improvement of patient survival.3,4 Additionally, due to the resistance of chordoma to classical chemotherapy, several clinical trials of molecular targeted agents aiming to find novel therapeutic options were carried out during the past decade.5,6 However, radical surgical resection remains a challenge for skull base chordoma due to the potential involvement of the internal carotid artery, cranial nerve, and brainstem.4 Moreover, chordoma cells are relatively resistant to radiotherapy. The high local recurrent rate was observed in the clinical management of skull base chordoma and patients have a poor outcome.7 The exploitation of preoperative prognostic markers may aid in the clinical choice of optimal treatment and improve patient long-term survival.
Accumulating evidence shows that cancer-related inflammation can participate in oncogenesis, tumor progression, and cancer metastasis.8,9 Accordingly, many blood-based inflammatory markers, such as neutrophil-lymphocyte ratio and platelet-lymphocyte ratio, C-reactive protein are further developed, and these indexes show promising prognostic values in various cancers.10−12 Recently, the potential impact of mean corpuscular volume (MCV) and red blood distribution width (RDW) in cancers attracts much attention.
MCV, an index characterizing the mean volume of red blood cells, and RDW, a parameter showing the heterogeneity in the size of red blood cells, are easily available in the routine complete blood count, and they are used for differential diagnosis of anemia-related diseases in clinical practice.13 Recent research suggested that the potential prognostic value of the aberrant level of MCV in cancer patients.14,15 Besides, several studies indicated that RDW was significantly elevated in various diseases, such as diabetes, chronic hepatitis, cardiovascular disease, chronic obstructive pulmonary disease, and trauma.13,16,17 In addition, recent studies demonstrate that an increased level of RDW is observed in many types of cancers; moreover, high RDW can act as a useful marker of adverse outcomes in cancer patients, including chronic lymphocytic leukemia, esophageal cancer, hepatocellular carcinoma, and lung cancer.18,19
However, to our knowledge, the roles of MCV and RDW in skull base chordoma have not been explicitly elucidated. Some reports have suggested that chronic inflammation plays an important role in the progression of chordoma, and inflammatory cells release varieties of signaling molecules, which may affect the activity or synthesis of erythropoietin, thus impairing red blood cell maturation and causing immature red blood cells to enter the blood flow.20 At the same time, inflammation can also lower red blood cell survival, thus resulting in the mixing of red blood cell volumes in the peripheral circulation.21 Our study aims to evaluate the levels of preoperative MCV and RDW in primary skull base chordoma patients, evaluate their associations with clinical features, and analyze their potential prognostic values.
Materials and Methods
Patients
Skull base chordoma patients undergoing surgery in Beijing Tiantan Hospital between January 2008 and September 2014 were evaluated for current retrospective research. Patients with newly diagnosed skull base chordoma by histopathology, no prior radiation therapy and/or chemotherapy and follow-up data were included. Patients were excluded if they belonged to any of the following criteria: 1) ambiguous histopathological diagnosis; 2) prior therapies such as radiation and chemotherapy; 3) unavailable clinicopathological information and/or complete blood count; 4) clinical evidence of infections or inflammatory diseases, other malignant tumors such as leukemia and liver cancer, hematological disorders; 5) blood transfusion within 3 months; 6) no follow-up data. Finally, 187 patients with primary skull base chordoma were enrolled, and this cohort has been detailed in our previous study.22
Data Collection
Medical records were regularly reviewed, and patient clinical/pathological data including patient’s gender, age at diagnosis, tumor texture (defined as soft or others including moderate and tough), tumor volume, the blood supply of tumor (considered as abundant or others including poor or moderate), tumor pathology, posterior cranial nerve involvement (yes, no), the involvement of brainstem (yes, no), Al-Mefty classification (defined as type I, II and III)23 and degree of resection (evaluated as total/non-total resection based on postoperative magnetic resonance imaging) were collated.24 In addition, preoperative complete blood counts including hemoglobin (Hb, g/L), MCV (fl), and RDW (%) from every patient were collected.
Patients were periodically followed up at the interval of 3 to 6 months via telephone or outpatient clinic for the first 2 years after the operation, and following annual follow-up was performed. The last follow-up date was October 2019. Progression-free survival (PFS, the time from operation to first tumor recurrence) and overall survival (OS, the interval from tumor resection to death) was then collected for survival analysis.
Statistical Analysis
IBM SPSS 19.0 software (Armonk, NY, USA) and R version 4.0.2 (R Foundation for Statistical Computing, Vienna, Austria) were used for statistical analysis. Quantitative data was listed as mean ± standard deviation (SD) and was further analyzed using Student’s t-test or Mann–Whitney U-test. For categorical data, the chi-square test was applied. The Pearson correlation test was used to reveal the potential correlations between Hb and MCV or RDW. We used X-tile software 3.6.1 (Yale University, USA) to find the threshold values of MCV and RDW for survival analysis.25 Briefly, p values were acquired from the Log rank test between two groups separated by a certain point, and the optimal cutoff value of each index was then recognized as the value with the minimum p value. The Kaplan-Meier methods and Log rank tests were applied to find the differences of PFS and OS between groups. The multivariate Cox proportional regression hazard model was used to determine the independence of variables with a p value of less than 0.10 in the univariate Cox analysis. The PFS and OS nomogram was developed based on independent prognostic factors, and the concordance index (C-index) and the receiver operating characteristic (ROC) curve were used to evaluate the predictive accuracy of the nomogram. Calibration curve and decision curve analysis were performed to explore the performance of the nomogram. A 2-sided p value less than 0.05 was considered statistically significant.
Results
Clinical Characteristics
Overall, 187 skull base chordoma patients (98 males and 89 females) with a mean age of 40.1 (SD, 15.3) years were included in current retrospective research.22 Of these patients, 126 (67.4%) patients had the classical pathological type of chordoma, and the remaining 61 (32.6%) patients got chondroid chordoma, no dedifferentiated chordoma was observed.4 There were 57 (30.5%) patients with soft tumors and 130 (69.5%) patients who harbored moderate or tough tumors. The mean tumor volume was 31.7 (SD, 33.2) cm3. In terms of tumor blood supply, the abundant blood supply was observed in 109 (58.3%) patients, while 78 (41.7%) tumors got poor or moderate supply. According to Al-Mefty classification, type I, II, and III tumors were observed in 34, 89, and 64 patients, respectively. Other clinicopathological characteristics are reported in Table 1.
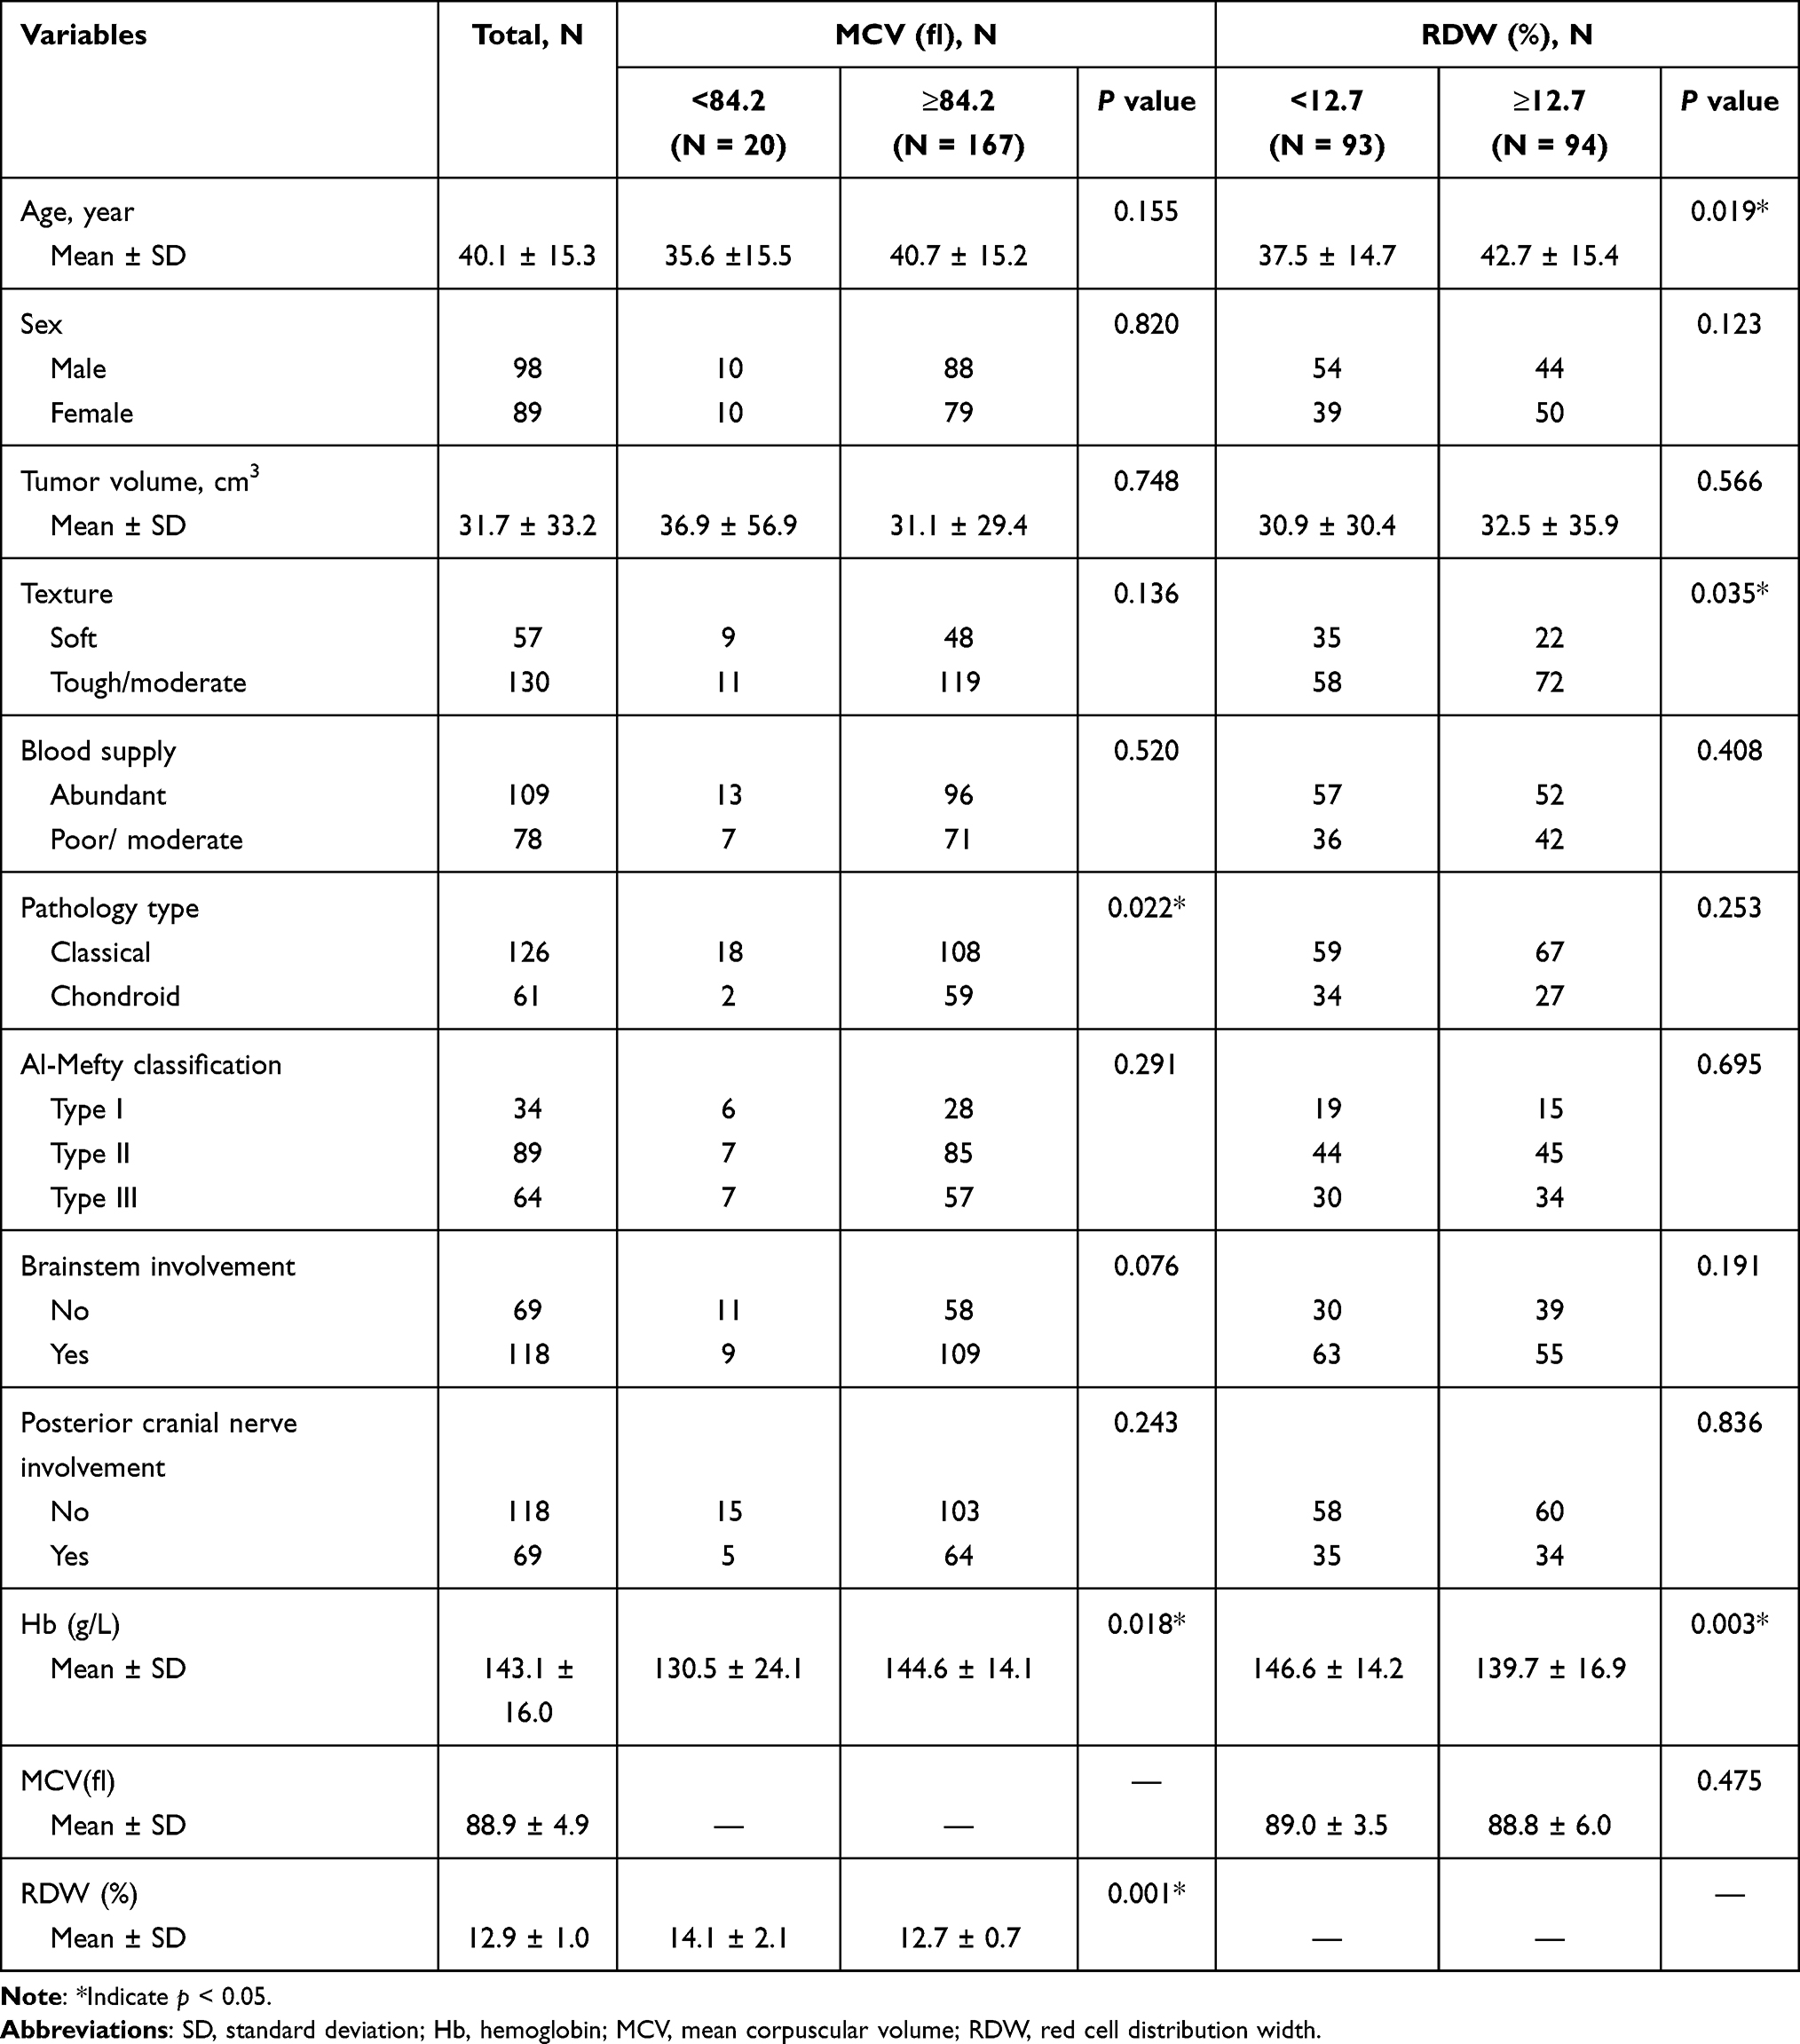 |
Table 1 Association Between MCV, RDW and Clinicopathological Features of Skull Base Chordoma Patients |
Description of MCV and RDW in Skull Base Chordoma Patients
As shown in Table 1, the mean (± SD) values of MCV and RDW were 88.9 (± 4.9) fl and 12.9 (± 1.0) %, respectively. For subsequent analysis, X-tile software identifying the optimal cutoff values of these indexes was performed (Figure S1). The optimal cutoff points were 84.2 for MCV, and 12.7 for RDW. Then, the levels of MCV and RDW were divided into high and low groups using cutoff values: 167 (89.3%) patients with MCV ≥84.2 while 20 (10.7%) patients with MCV <84.2; 93 (49.7%) patients in the RDW <12.7 group and 94 (50.3%) patients in the RDW ≥12.7 group.
Association Between MCV, RDW, and Clinicopathologic Parameters
Low MCV level was more commonly observed in classical chordoma patients (p=0.022), and brainstem involvement showed a tendency of lower MCV (p=0.076). High RDW level was correlated with older patient age (p=0.022) and a tough tumor texture (p=0.035). Also, we observed the level of Hb was higher in MCV≥84.2 group (p=0.018). By contrast, high RDW (RDW≥12.7) was associated with a low level of Hb (p=0.003). Besides, in patients with MCV≥84.2, a lower RDW level was observed (p=0.001). No significant correlation was seen between MCV, RDW, and other parameters, including gender, Al-Mefty classification, posterior cranial nerve involvement, and blood supply (Table 1).
The correlations between Hb, MCV, and RDW were further analyzed. Pearson correlation analysis showed that a limited correlation between Hb and MCV (r = 0.227, p=0.002) and a weak negative correlation between Hb and RDW (r=−0.427, p<0.001). Moreover, a weak negative correlation between MCV and RDW was found (r=−0.364, p<0.001).
Association Between MCV, RDW, and Patient Outcome
The median follow-up time in this study was 74 months (mean, 72.4 months; range, 3–141 months), 129 (69.0%) patients got tumor recurrence and 72 (38.5%) patients died till the last of the follow-up. Kaplan–Meier analysis showed that patients with a low level of MCV (MCV <84.2) had a shorter PFS time than that of patients with MCV ≥84.2 (median PFS time, 15 months versus 36 months; p=0.045) (Figure 1A). Moreover, the median OS time in the MCV ≥84.2 group was 125 months, which was longer than that of patients with MCV <84.2 (median OS time, 73 months, p=0.023) (Figure 1B). In contrast, a shorter PFS time of patients with RDW ≥12.7 was detected compared to that of patients in the RDW <12.7 group (median PFS time, 24 months versus 48 months; p=0.007) (Figure 1C), and the median OS time was also shorter in the RDW ≥12.7 group than that in the other group (median OS time, 96 months versus not reached; p<0.001) (Figure 1D).
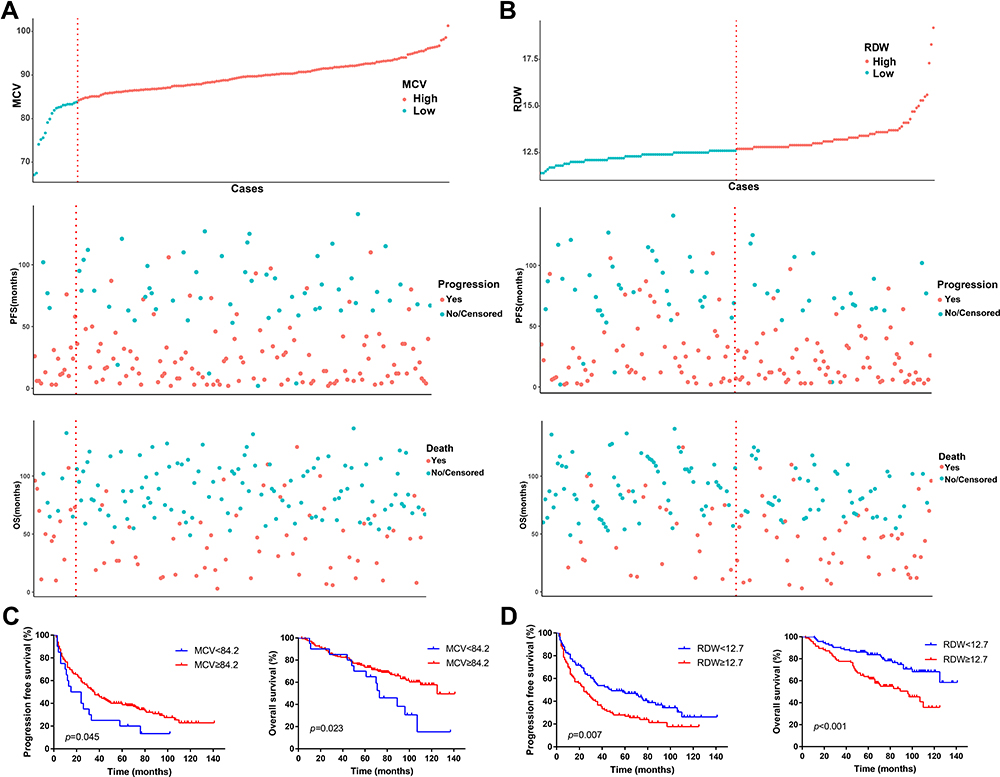 |
Figure 1 Levels of MCV and RDW were correlated with the prognosis of chordoma patients. (A and B) Distribution of MCV, RDW, recurrent status, survival status in 187 skull base chordoma patients. (C) Patients with lower MCV had shorter PFS and OS. (D) Patients with higher RDW had shorter PFS and OS. Abbreviations: MCV, mean corpuscular volume; RDW, red cell distribution width; PFS, progression-free survival; OS, overall survival. |
Considering the prognostic value of MCV and RDW, we then performed a subgroup analysis based on tumor pathological types. In classical chordoma, the median PFS time was shorter in patients with MCV <84.2, though the p value of the Log rank test was 0.095 (Figure 2A). No significant difference in PFS was observed in chondroid chordoma patients with different MCV levels (median PFS time, 15 months versus 60 months; p=0.959, Figure 2B). Similarly, there were no significant differences in OS time between different MCV groups in classical chordoma patients (median OS time, 73 months versus 125 months; p=0.150, Figure 2C) or chondroid chordoma patients (median OS time, 28 months versus not reached; p=0.246, Figure 2D), which may be explained by the few patients in groups (especially, only 2 chondroid chordoma patients in the MCV<84.2 group). In terms of RDW, a high level of RDW was not associated with shorter PFS time in classical chordoma patients (median PFS time, 24 months versus 35 months; p=0.088, Figure 2E), while the difference in chondroid patients towards statistical significance (median PFS time, 29 months versus 87 months; p=0.050, Figure 2F). In addition, a high level of RDW was significantly associated with poor OS in classical chordoma patients (median OS time, 70 months versus 125 months; p=0.001, Figure 2G) rather than chondroid chordoma patients (median OS time were all not reached; p=0.242, Figure 2H).
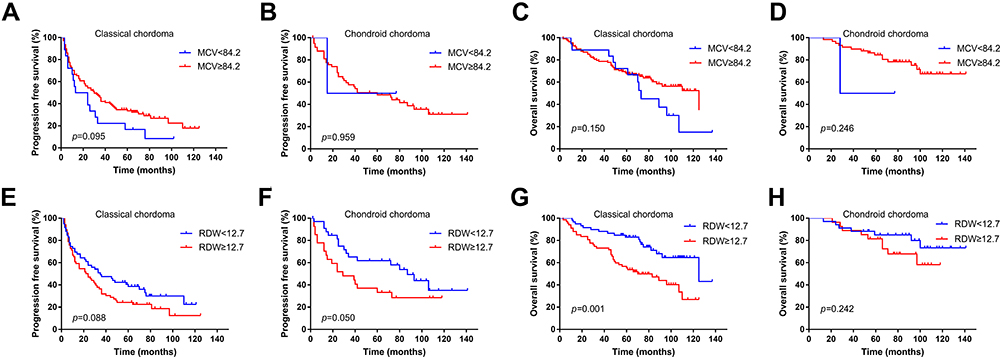 |
Figure 2 Kaplan–Meier curves of MCV or RDW in different pathological types of skull base chordoma patients. (A) PFS analysis of MCV in classical chordoma patients. (B) PFS analysis of MCV in chondroid chordoma patients. (C) OS analysis of MCV in classical chordoma patients. (D) OS analysis of MCV in chondroid chordoma patients. (E) PFS analysis of RDW in classical chordoma patients. (F) PFS analysis of RDW in chondroid chordoma patients. (G) OS analysis of RDW in classical chordoma patients. (H) OS analysis of RDW in chondroid chordoma patients. Abbreviations: MCV, mean corpuscular volume; RDW, red cell distribution width; PFS, progression-free survival; OS, overall survival. |
Multivariate Cox analysis of PFS showed that patients’ age (hazard ratio (HR), 1.837; 95% confidence interval (CI), 1.146–2.943; p=0.011), tumor blood supply (HR, 1.543; 95% CI, 1.038–2.294; p=0.032), Al-Mefty classification (HR, 1.547; 95% CI, 1.055–2.268; p=0.026), extent of resection (HR, 2.623; 95% CI, 1.536–4.479; p<0.001) and RDW (HR, 1.852; 95% CI, 1.268–2.703; p=0.001) were independent prognostic indicators, while MCV showed no significance (Table 2). In the univariate analysis of OS, MCV (p=0.026) and RDW (p<0.001) were associated with OS, and RDW (HR, 2.757; 95% CI, 1.675–4.539; p<0.001) rather than MCV was further identified as an independent predictor for OS (Table 3).
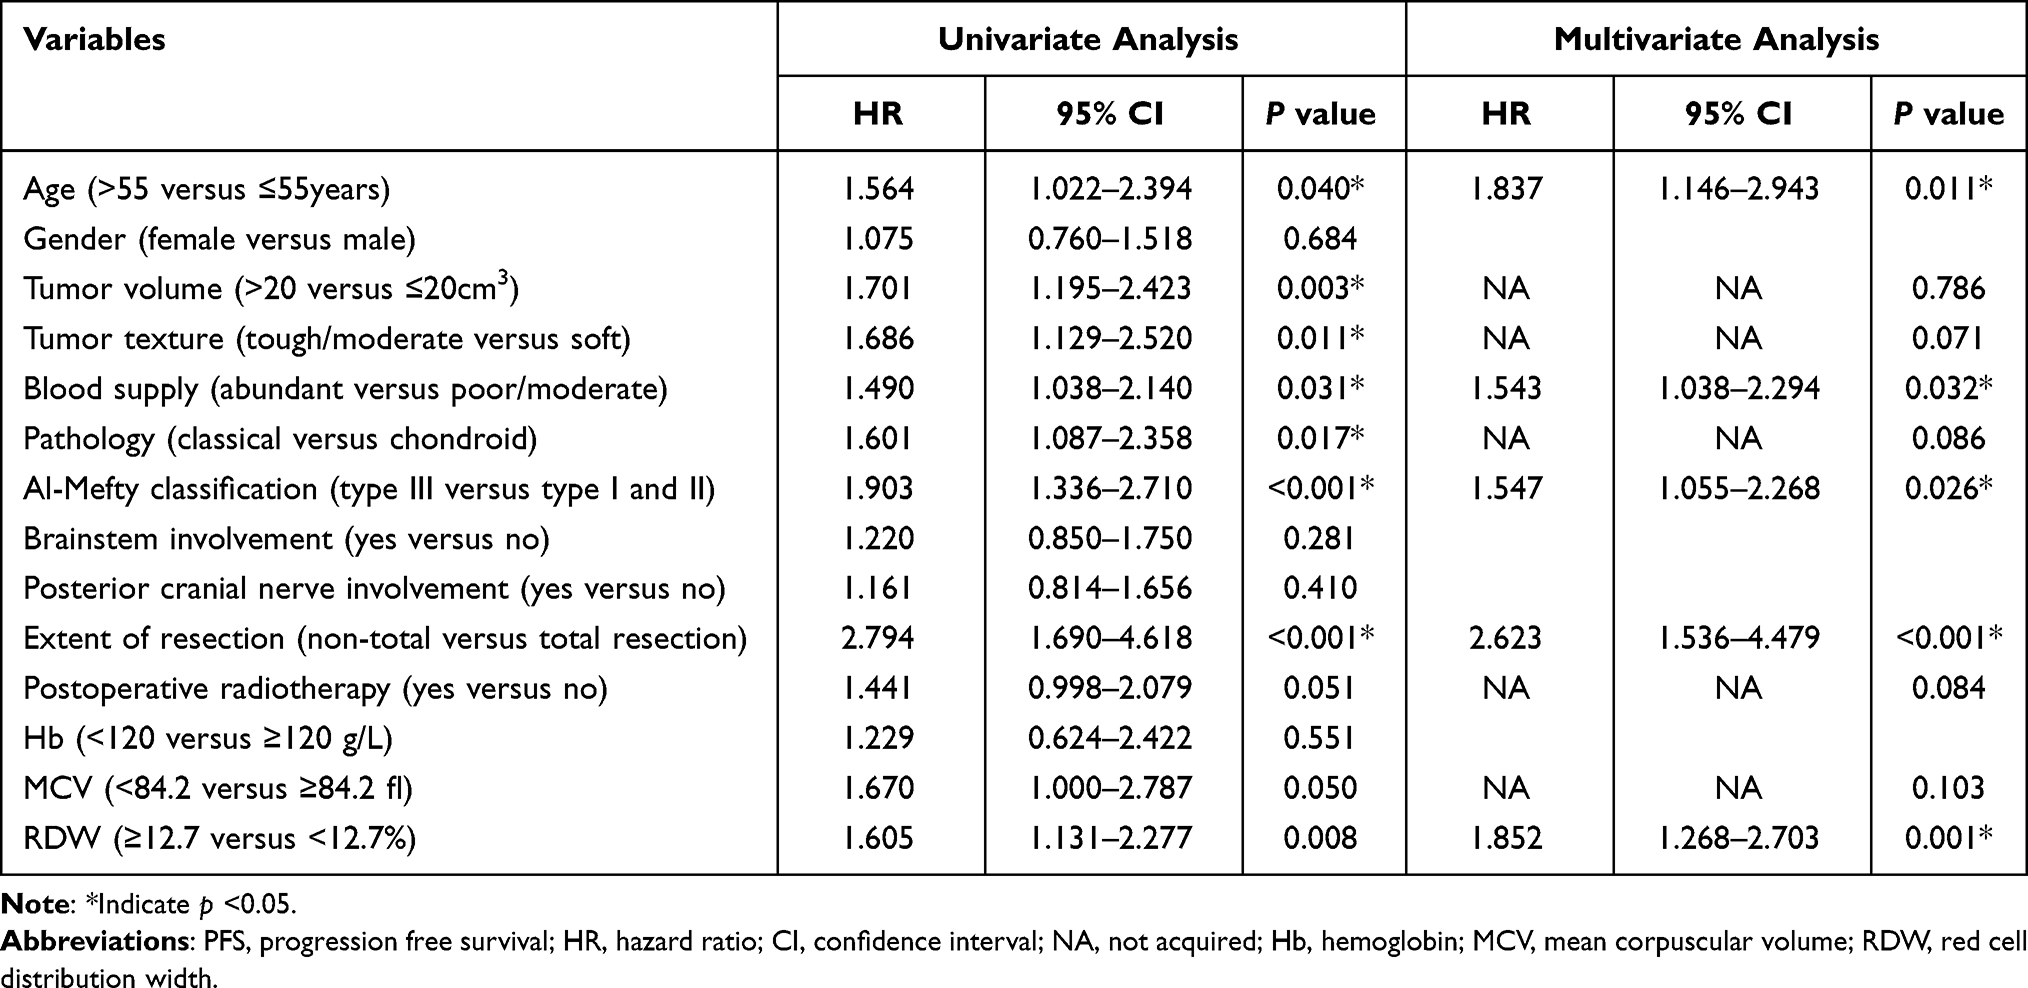 |
Table 2 Univariate and Multivariate Cox Analysis for PFS in Skull Base Chordoma |
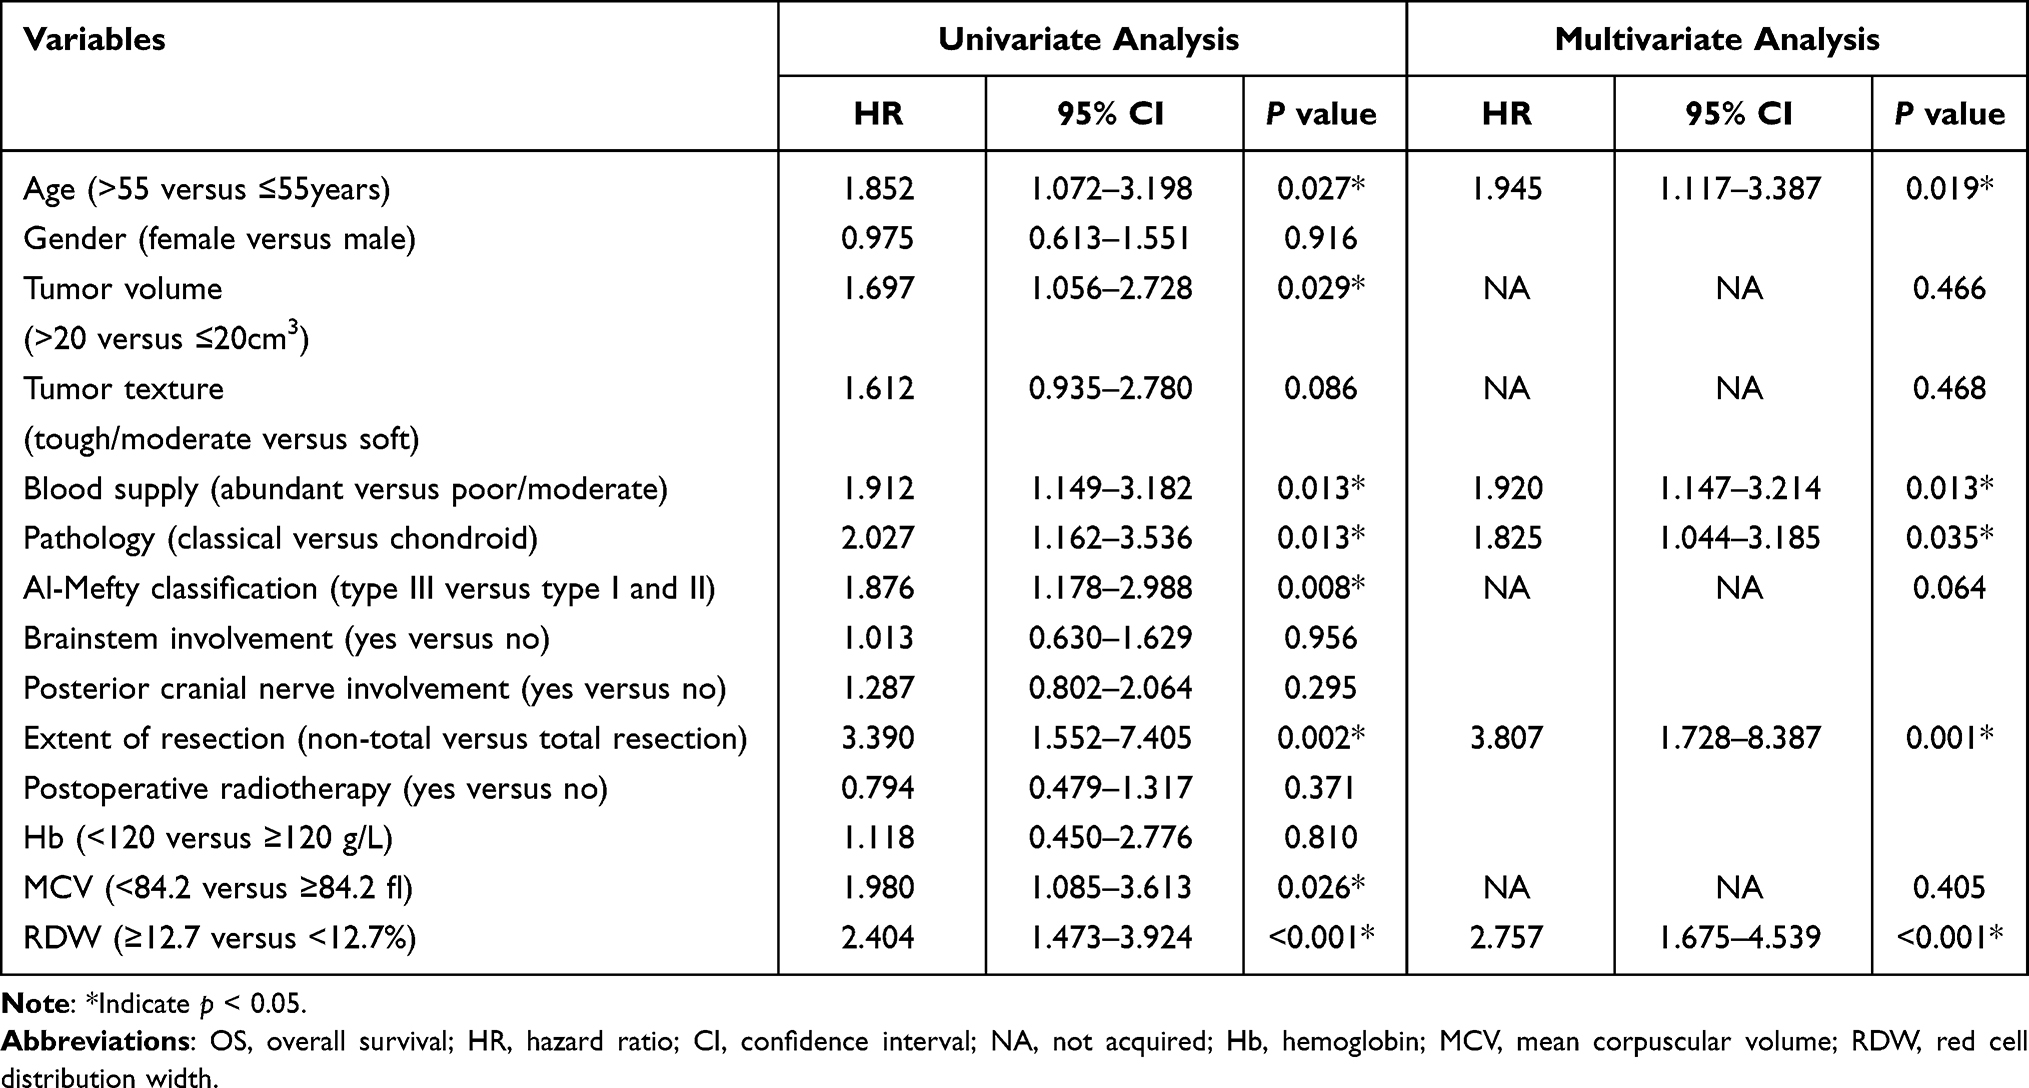 |
Table 3 Univariate and Multivariate Cox Analysis for OS in Skull Base Chordoma |
Establishment of the Nomogram for PFS and OS Prediction
We then developed the nomogram of PFS and OS including the above corresponding independent factors (Figure 3). The RDW-based nomogram showed adequate predictive accuracy for PFS (C-index, 0.684; 95% CI, 0.635–0.734) and OS (C-index, 0.744; 95% CI, 0.685–0.803). ROC curve analysis revealed that the nomogram showed more accuracy than the Al-mefty classification in predicting PFS (Figure 4A) and OS (Figure 4B). Besides, calibration curves indicated well credibility of the RDW-based nomogram (Figure 5A and B). In addition, decision curve analysis revealed that the nomogram had a higher net benefit after including RDW (Figure 5C and D), suggesting the potential clinical value of the RDW-based nomogram.
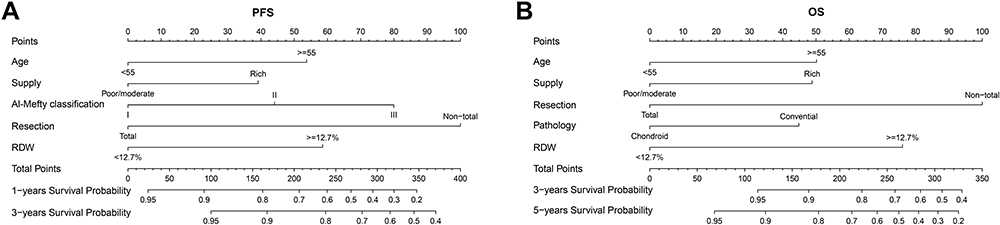 |
Figure 3 Development of nomogram based on independent prognostic variables for survival prediction. (A) PFS prediction. (B) OS prediction. Abbreviations: PFS, progression-free survival; OS, overall survival. |
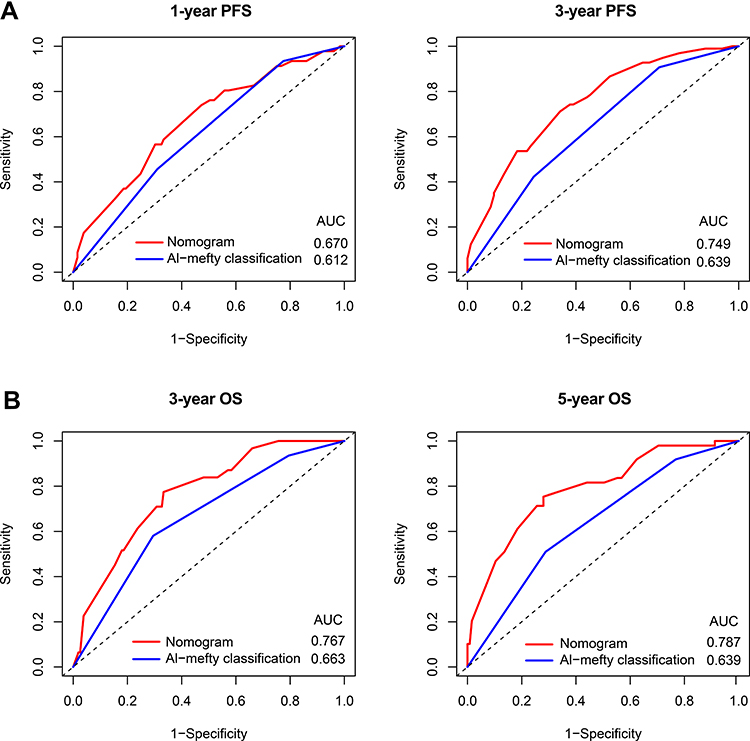 |
Figure 4 ROC curve of the nomogram and Al-mefty classification for survival prediction. (A) 1-year and 3-year PFS. (B) 3-year and 5-year OS. Abbreviations: ROC, receiver operating characteristic; PFS, progression-free survival; OS, overall survival; AUC, area under the curve. |
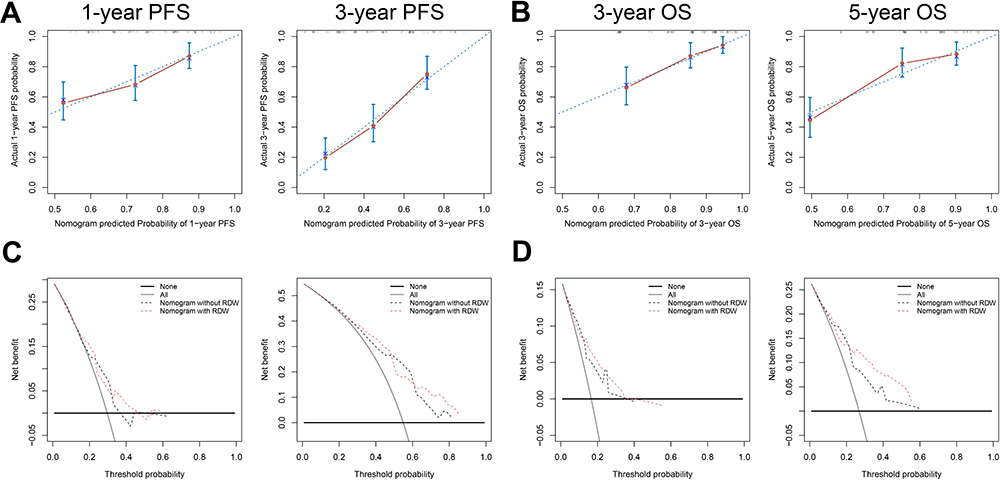 |
Figure 5 The nomogram showed adequate performance in survival prediction. The calibration curves indicated the agreement between the predicted and actual probability of PFS (A) and OS (B). The dashed blue line represents the actual probability of survival, the red dots and red lines represent the probability of survival predicted by the nomogram, and the solid blue lines represent the 95% confidence interval of the probability of survival predicted by the nomogram. Decision curve analysis of the nomogram for PFS (C) and OS (D). Abbreviations: PFS, progression-free survival; OS, overall survival. |
Discussion
To our knowledge, our study is the first report analyzing the prognostic roles of MCV and RDW in skull base chordoma, and we also investigated their correlations with clinical features of chordoma patients. We found that the level of preoperative MCV was negatively correlated with the level of RDW, and low MCV level was associated with the classical type of chordoma, while RDW was positively associated with patient age and tough texture. Besides, a low level of MCV and a high level of RDW were correlated with poor patient survival, and a high RDW level could independently predict adverse PFS and OS. Moreover, the nomogram based on RDW and clinicopathological parameters had competent performance in survival prediction. Our results indicated the potential impact of RDW on tumor progression and survival of skull base chordoma patients, identifying RDW-based nomograms serve as a practical and promising tool for patient risk stratification and may contribute to personalized decision-making.
The prognostic role of MCV seemed inconsistent in researches involving different cancer types. Nagai et al reported that in colorectal cancer patients, a low MCV level (MCV <80 fl) was associated with longer PFS time.14 Besides, one recent retrospective study showed the association between high MCV and poor prognosis in liver cancer.15 Moreover, several studies reported that MCV may relate to the risk of esophageal cancer, and an elevated MCV was observed in esophageal cancer patients and was identified as a potential risk factor of survival.26,27 In contrast, Qu et al demonstrated that low MCV could independently predict poor OS in lung cancer patients.28 In the current study, we found a low level of MCV was correlated with shorter PFS and OS time in skull base chordoma, though it was not significant in the multivariate analysis. Detailed explanations of why MCV showed seemly opposite prognostic values in different cancer patients remain unclear. It is suggested that the low level of MCV may correlate with potential hypoferric anemia, and anemia was identified as a valuable risk factor for poor outcomes in various cancers.29 However, some studies showed that a high MCV level was correlated with the lack of folic acid or vitamin B12, which may be related to potential malnutrition in patients.26 Malnutrition has been demonstrated with tumor progression and as an unfavorable prognostic factor in cancers.30,31
RDW, a potential inflammation-associated biomarker, was identified as a promising independent risk factor for outcomes in many malignancies.18,32 Koma et al reported that high RDW was correlated with several inflammatory indexes, and it acted as an adverse prognostic indicator for outcome in lung cancer.33 In accordance with previous studies, our data showed that high preoperative RDW could independently predict poor PFS and OS in primary skull base chordoma patients. Mechanisms of how RDW correlates with patient outcomes gain extensive attention in recent studies. Some studies indicated that there was a potential association between RDW level and several inflammatory markers. The increased synthesis of these factors which are vital for the inflammatory response, including interleukin-6 and tumor necrosis factor α, could lead to inhibition of iron metabolism, reduced response to erythropoietin of red blood cells, and sequent reduction of mature erythrocytes.34 Besides, studies showed that tumor necrosis factor α and interleukin-6 could promote tumorigenesis via participating in the growth of tumor cells and angiogenesis.35,36 In addition, relatively low levels of prealbumin and albumin, which were nutrition-associated indexes correlating with tumor progression in many cancers, were observed in patients with high RDW.37,38 Therefore, we hypothesized that the worse outcome in chordoma patients with high RDW may correlate with potential abnormal inflammatory response and malnutrition, and further studies revealing the associations between RDW and inflammatory markers or nutritional indexes in skull base chordoma are needed.
The current study has some limitations. First, due to the retrospective nature and single-center feature, future large-scale prospective researches involving multiple centers is warranted to confirm the cutoff values and clinical role of MCV and RDW in chordoma patients. Also, the clinical impact and prognostic performance of factors such as preoperative hematocrit (HCT) and postoperative RDW were not explored in our cohort.39,40 Finally, possible mechanisms through which MCV or RDW affected the survival of skull base chordoma were not involved in the current study.
Conclusions
In summary, our data demonstrated that MCV and RDW were associated with clinicopathological features and outcomes in skull base chordoma. Especially, RDW independently predicted worse PFS and OS, and the RDW-based nomogram may be helpful to individual outcome prediction in skull base chordoma patients.
Abbreviations
Hb, hemoglobin; MCV, mean corpuscular volume; RDW, red cell distribution width; PFS, progression-free survival; OS, overall survival; SD, standard deviation; C-index, concordance index; HR, hazard ratio; CI, confidence interval; ROC, receiver operating characteristic.
Data Sharing Statement
The data that support the findings of this study are included in the manuscript/supplementary material.
Ethics Approval and Informed Consent
The current study was approved by the Ethics Committee of Beijing Tiantan Hospital and carried out in keeping with the 1964 Declaration of Helsinki. In addition, informed consent was obtained from all participants, and we further analyzed the data anonymously.
Acknowledgments
We are grateful for the support of all patients.
Author Contributions
All authors made a significant contribution to the work reported, whether that is in the conception, study design, execution, acquisition of data, analysis, and interpretation, or in all these areas; took part in drafting, revising, or critically reviewing the article; gave final approval of the version to be published; have agreed on the journal to which the article has been submitted; and agree to be accountable for all aspects of the work.
Funding
This study was supported by the National Natural Science Foundation of China (82071559 and 82072804); Supported by Beijing Municipal Science & Technology Commission (Z171100000117002).
Disclosure
The authors declare no conflicts of interest.
References
1. Stacchiotti S, Sommer J. Building a global consensus approach to chordoma: a position paper from the medical and patient community. Lancet Oncol. 2015;16(2):e71–e83. doi:10.1016/S1470-2045(14)71190-8
2. Stiller CA, Trama A, Serraino D, et al. Descriptive epidemiology of sarcomas in Europe: report from the RARECARE project. Eur J Cancer. 2013;49(3):684–695. doi:10.1016/j.ejca.2012.09.011
3. Chugh R, Tawbi H, Lucas DR, Biermann JS, Schuetze SM, Baker LH. Chordoma: the nonsarcoma primary bone tumor. Oncologist. 2007;12(11):1344–1350. doi:10.1634/theoncologist.12-11-1344
4. Walcott BP, Nahed BV, Mohyeldin A, Coumans J-V, Kahle KT, Ferreira MJ. Chordoma: current concepts, management, and future directions. Lancet Oncol. 2012;13(2):e69–e76. doi:10.1016/S1470-2045(11)70337-0
5. Stacchiotti S, Longhi A, Ferraresi V, et al. Phase II study of imatinib in advanced chordoma. J Clin Oncol. 2012;30(9):914–920. doi:10.1200/JCO.2011.35.3656
6. Stacchiotti S, Tamborini E, Lo Vullo S, et al. Phase II study on lapatinib in advanced EGFR-positive chordoma. Ann Oncol. 2013;24(7):1931–1936. doi:10.1093/annonc/mdt117
7. Sen C, Triana AI, Berglind N, Godbold J, Shrivastava RK. Clival chordomas: clinical management, results, and complications in 71 patients. J Neurosurg. 2010;113(5):1059–1071. doi:10.3171/2009.9.JNS08596
8. Coussens LM, Werb Z. Inflammation and cancer. Nature. 2002;420(6917):860–867. doi:10.1038/nature01322
9. Diakos CI, Charles KA, McMillan DC, Clarke SJ. Cancer-related inflammation and treatment effectiveness. Lancet Oncol. 2014;15(11):e493–503. doi:10.1016/S1470-2045(14)70263-3
10. Yodying H, Matsuda A, Miyashita M, et al. Prognostic significance of neutrophil-to-lymphocyte ratio and platelet-to-lymphocyte ratio in oncologic outcomes of esophageal cancer: a systematic review and meta-analysis. Ann Surg Oncol. 2016;23(2):646–654. doi:10.1245/s10434-015-4869-5
11. Koh CH, Bhoo-Pathy N, Ng KL, et al. Utility of pre-treatment neutrophil-lymphocyte ratio and platelet-lymphocyte ratio as prognostic factors in breast cancer. Br J Cancer. 2015;113(1):150–158. doi:10.1038/bjc.2015.183
12. Allin KH, Bojesen SE, Nordestgaard BG. Baseline C-reactive protein is associated with incident cancer and survival in patients with cancer. J Clin Oncol. 2009;27(13):2217–2224. doi:10.1200/JCO.2008.19.8440
13. Salvagno GL, Sanchis-Gomar F, Picanza A, Lippi G. Red blood cell distribution width: a simple parameter with multiple clinical applications. Crit Rev Clin Lab Sci. 2015;52(2):86–105. doi:10.3109/10408363.2014.992064
14. Nagai H, Yuasa N, Takeuchi E, Miyake H, Yoshioka Y, Miyata K. The mean corpuscular volume as a prognostic factor for colorectal cancer. Surg Today. 2018;48(2):186–194. doi:10.1007/s00595-017-1575-x
15. Yoon HJ, Kim K, Nam YS, Yun JM, Park M. Mean corpuscular volume levels and all-cause and liver cancer mortality. Clin Chem Lab Med. 2016;54(7):1247–1257. doi:10.1515/cclm-2015-0786
16. Chen B, Ye B, Zhang J, Ying L, Chen Y. RDW to platelet ratio: a novel noninvasive index for predicting hepatic fibrosis and cirrhosis in chronic hepatitis B. PLoS One. 2013;8(7):e68780. doi:10.1371/journal.pone.0068780
17. Chen PC, Sung FC, Chien KL, Hsu HC, Su TC, Lee YT. Red blood cell distribution width and risk of cardiovascular events and mortality in a community cohort in Taiwan. Am J Epidemiol. 2010;171(2):214–220. doi:10.1093/aje/kwp360
18. Hu L, Li M, Ding Y, et al. Prognostic value of RDW in cancers: a systematic review and meta-analysis. Oncotarget. 2017;8(9):16027–16035. doi:10.18632/oncotarget.13784
19. Smirne C, Grossi G, Pinato DJ, et al. Evaluation of the red cell distribution width as a biomarker of early mortality in hepatocellular carcinoma. Dig Liver Dis. 2015;47(6):488–494. doi:10.1016/j.dld.2015.03.011
20. Jelkmann W. Proinflammatory cytokines lowering erythropoietin production. J Interferon Cytokine Res. 1998;18(8):555–559. doi:10.1089/jir.1998.18.555
21. Kiefer CR, Snyder LM. Oxidation and erythrocyte senescence. Curr Opin Hematol. 2000;7(2):113–116. doi:10.1097/00062752-200003000-00007
22. Li M, Bai J, Wang S, et al. Mean platelet volume and platelet distribution width serve as prognostic biomarkers in skull base chordoma: a retrospective study. BMC Cancer. 2020;20(1):988. doi:10.1186/s12885-020-07497-7
23. Al-Mefty O, Borba LA. Skull base chordomas: a management challenge. J Neurosurg. 1997;86(2):182–189. doi:10.3171/jns.1997.86.2.0182
24. Gui S, Zong X, Wang X, et al. Classification and surgical approaches for transnasal endoscopic skull base chordoma resection: a 6-year experience with 161 cases. Neurosurg Rev. 2016;39(2):
25. Camp RL, Dolled-Filhart M, Rimm DL. X-tile: a new bio-informatics tool for biomarker assessment and outcome-based cut-point optimization. Clin Cancer Res. 2004;10(21):7252–7259. doi:10.1158/1078-0432.CCR-04-0713
26. Yoshida N, Kosumi K, Tokunaga R, et al. Clinical importance of mean corpuscular volume as a prognostic marker after esophagectomy for esophageal cancer: a retrospective study. Ann Surg. 2020;271(3):494–501. doi:10.1097/SLA.0000000000002971
27. Pavanello S, Snenghi R, Nalesso A, Sartore D, Ferrara SD, Montisci M. Alcohol drinking, mean corpuscular volume of erythrocytes, and alcohol metabolic genotypes in drunk drivers. Alcohol (Fayetteville, NY). 2012;46(1):61–68. doi:10.1016/j.alcohol.2011.08.009
28. Qu X, Zhang T, Ma H, Sui P, Du J. Lower mean corpuscular hemoglobin concentration is associated with unfavorable prognosis of resected lung cancer. Fut Oncol. 2014;10(14):2149–2159. doi:10.2217/fon.14.121
29. Troppan KT, Melchardt T, Deutsch A, et al. The significance of pretreatment anemia in the era of R-IPI and NCCN-IPI prognostic risk assessment tools: a dual-center study in diffuse large B-cell lymphoma patients. Eur J Haematol. 2015;95(6):538–544. doi:10.1111/ejh.12529
30. von Meyenfeldt M. Cancer-associated malnutrition: an introduction. Eur J Oncol Nurs. 2005;9:S35–S38. doi:10.1016/j.ejon.2005.09.001
31. Sun K, Chen S, Xu J, Li G, He Y. The prognostic significance of the prognostic nutritional index in cancer: a systematic review and meta-analysis. J Cancer Res Clin Oncol. 2014;140(9):1537–1549. doi:10.1007/s00432-014-1714-3
32. Warwick R, Mediratta N, Shackcloth M, Shaw M, McShane J, Poullis M. Preoperative red cell distribution width in patients undergoing pulmonary resections for non-small-cell lung cancer. Eur J Cardio-Thor Surg. 2014;45(1):108–113. doi:10.1093/ejcts/ezt275
33. Koma Y, Onishi A, Matsuoka H, et al. Increased red blood cell distribution width associates with cancer stage and prognosis in patients with lung cancer. PLoS One. 2013;8:11. doi:10.1371/journal.pone.0080240
34. de Gonzalo-calvo D, de Luxán-delgado B, Rodríguez-González S, et al. Interleukin 6, soluble tumor necrosis factor receptor I and red blood cell distribution width as biological markers of functional dependence in an elderly population: a translational approach. Cytokine. 2012;58(2):193–198. doi:10.1016/j.cyto.2012.01.005
35. Guo Y, Xu F, Lu T, Duan Z, Zhang Z. Interleukin-6 signaling pathway in targeted therapy for cancer. Cancer Treat Rev. 2012;38(7):904–910. doi:10.1016/j.ctrv.2012.04.007
36. van Horssen R, Ten Hagen TL, Eggermont AM. TNF-α in cancer treatment: molecular insights, antitumor effects, and clinical utility. Oncologist. 2006;11(4):397–408. doi:10.1634/theoncologist.11-4-397
37. Forhecz Z, Gombos T, Borgulya G, Pozsonyi Z, Prohaszka Z, Janoskuti L. Red cell distribution width in heart failure: prediction of clinical events and relationship with markers of ineffective erythropoiesis, inflammation, renal function, and nutritional state. Am Heart J. 2009;158(4):659–666. doi:10.1016/j.ahj.2009.07.024
38. Gupta D, Lis CG. Pretreatment serum albumin as a predictor of cancer survival: a systematic review of the epidemiological literature. Nutri J. 2010;9(1):69. doi:10.1186/1475-2891-9-69
39. Shota S, Saito H, Kono Y, et al. Prognostic significance of pre- and post-operative red-cell distribution width in patients with gastric cancer. J Gastrointestinal Surg. 2019;24(5):1010–1017. doi:10.1007/s11605-019-04392-w
40. Chen B, Dai D, Tang H, et al. Pretreatment hematocrit is superior to hemoglobin as a prognostic factor for triple negative breast cancer. PLoS One. 2016;11(11):e0165133. doi:10.1371/journal.pone.0165133
 © 2021 The Author(s). This work is published and licensed by Dove Medical Press Limited. The
full terms of this license are available at https://www.dovepress.com/terms
and incorporate the Creative Commons Attribution
- Non Commercial (unported, 3.0) License.
By accessing the work you hereby accept the Terms. Non-commercial uses of the work are permitted
without any further permission from Dove Medical Press Limited, provided the work is properly
attributed. For permission for commercial use of this work, please see paragraphs 4.2 and 5 of our Terms.
© 2021 The Author(s). This work is published and licensed by Dove Medical Press Limited. The
full terms of this license are available at https://www.dovepress.com/terms
and incorporate the Creative Commons Attribution
- Non Commercial (unported, 3.0) License.
By accessing the work you hereby accept the Terms. Non-commercial uses of the work are permitted
without any further permission from Dove Medical Press Limited, provided the work is properly
attributed. For permission for commercial use of this work, please see paragraphs 4.2 and 5 of our Terms.