Back to Journals » Diabetes, Metabolic Syndrome and Obesity » Volume 15
High Prevalence of Abnormal Carcinoembryonic Antigen in Diabetic Inpatients with Poor Glycemic Control
Authors Liu XY ![]() , Jin C, Zhou Y
, Jin C, Zhou Y
Received 24 May 2022
Accepted for publication 27 July 2022
Published 4 August 2022 Volume 2022:15 Pages 2345—2352
DOI https://doi.org/10.2147/DMSO.S376024
Checked for plagiarism Yes
Review by Single anonymous peer review
Peer reviewer comments 2
Editor who approved publication: Dr Konstantinos Tziomalos
Xi-Yu Liu, Chai Jin, Yan Zhou
Department of Endocrinology, Dongyang People’s Hospital, Dongyang, Zhejiang, People’s Republic of China
Correspondence: Xi-Yu Liu, Email [email protected]
Introduction: Higher serum carcinoembryonic antigen (CEA) was found in diabetic patients rather than controls. However, the prevalence of abnormal CEA among diabetic inpatients with a large proportion of poor glycemic control is unclear.
Methods: A total of 385 diabetic inpatients were included in this study. We collected information from a large clinical database. Patients with malignant tumors were excluded by examination and follow-up.
Results: We found a surprisingly high prevalence (14.3%) of diabetic inpatients with CEA above normal. The proportion of patients with abnormal CEA was significantly different in subgroups with different blood glucose levels, 20.4% in the HbA1c ≥ 9% group, and 8.5% in the HbA1c < 9%, p = 0.000. We found that the CEA levels were correlated with age, body mass index and HbA1c. The regression coefficient of HbA1c was the highest, B = 0.284, p = 0.000. We also found that the CEA levels were higher in diabetic inpatients with BMI < 24 kg/m2 than the overweight or obesity patients. There was a significant difference in the insulin level and C peptide level between the elevated CEA group and the non-elevated CEA group.
Conclusion: The elevation of CEA is common in diabetic inpatients, especially those with poor hyperglycemia controlled (HbA1c ≥ 9%). The underlying mechanism may be related to glucose toxicity.
Keywords: diabetic patients, CEA, carcinoembryonic antigen, hyperglycemic
Introduction
Carcinoembryonic antigen (CEA) can be used for screening, diagnosis, and monitoring treatment effects in various kinds of malignant tumors. Testing for CEA in the blood is a recommended part of diagnosis and follow-up of cancers in clinical practice. However, the elevation of CEA is found in some non-malignant conditions, including chronic inflammatory state, hypothyroidism, bipolar disorder, and uremic patients under hemodialysis treatment.1–4
The global diabetes prevalence in adults in 2021 was estimated to be 10.5% (537 million) and diabetes-related health expenditures were estimated at 966 billion.5 The management of diabetes is a significant global challenge to societies. The risk of developing cancer in diabetic patients remains uncertain.6 However, it was showed that diabetic patients had significantly higher rates of elevated CEA than subjects without diabetes.7–9 We found that there was a short-term elevation of CEA in diabetic inpatients, and there was a significant difference in HbA1c between the elevated CEA group and the group with normal CEA.10 However, due to the insufficient number of patients, correlation analysis was not conducted in our last study. In this study, we expanded the sample size and performed correlation analysis to explore whether the CEA increase in diabetic inpatients was related to age, gender, blood pressure, lipid or other factors.
It was found that the increase in serum tumor markers was correlated with islet function in diabetic patients.11 Inflammation could be associated with the elevation of CEA in diabetic patients.12 In this study, we investigated whether inflammation and islet function were involved in the mechanism of CEA elevation in diabetic patients.
Methods
Study Design and Population
This was a single-center, retrospective and observational study. We analyzed data extracted from a clinical database containing all medical information of patients in our hospital. Our research was in compliance with the Helsinki Declaration. The study was approved by the Ethics Committee of Dongyang People’s Hospital, which waived the requirement for patient informed consent given the retrospective nature of the study. All researchers will keep patient information confidential to maintain the privacy of the participants.
We screened the records of 604 consecutive patients who were hospitalized in the endocrinology department of our hospital and the primary diagnosis was diabetes between January 1, 2019 and June 1, 2019. Among these, 436 patients had complete information, including diagnosis, type of diabetes, age, gender, body mass index (BMI), HbA1c, total cholesterol, triglyceride, LDL (low-density lipoprotein) cholesterol, HDL (high-density lipoprotein) cholesterol, uric acid, blood pressure, past history, personal history including smoking and alcohol drinking status, family history, liver function, kidney function and the CEA level. Thirty-one patients were excluded because of a history of tumor or being found to have a tumor. Nineteen patients were excluded because of liver or kidney insufficiency, and one patient was excluded because of pregnancy. Ultimately, a total of 385 patients were included in the study for statistical analysis.
Inclusion Criteria and Exclusion Criteria
The inclusion criteria were inpatients that had complete medical records and was diagnosed as diabetes according to the WHO standard. CEA was detected. All patients were observed for more than 1 year.
The exclusion criteria were as follows: (1) A history of any type of tumor. (2) Pregnant and lactating women. (3) Chronic kidney diseases with an estimated glomerular filtration rate (eGFR) < 60 mL/min/1.73 m2. (4) A history of liver cirrhosis or liver insufficiency with alanine aminotransferase 3 times higher than the upper limit of normal range. (5) A malignant tumor was found on examination or follow-up.
Detection Method
Blood CEA levels were measured using the electrochemiluminescence immunoassay13 (Roche Diagnostics, Germany). HbA1c was measured using the high-performance liquid chromatography14 (Bio-Rad Laboratories, France). Blood glucose, cholesterol, triglyceride, uric acid, liver function and kidney function were measured using Colorimetric/Fluorometric assay15,16 (Fujifilm Wako Pure Chemical Corporation, Japan). C-reactive protein (CRP) levels were measured using the immunoturbidimetric method. Glomerular filtration rate was calculated using MDRD formula. Insulin and C peptide levels were measured using the electrochemiluminescence method (Roche Diagnostics, Germany).
Statistical Analysis
All data were analyzed using the statistical software IBM SPSS Statistics 25.0. Continuous variable data were presented as means and standard deviations. Categorical variables are reported as frequencies or percentages. Independent sample t-test was used for comparison of continuous variables. Kruskal–Wallis was performed before an independent sample t-test between the groups. The rates between the two groups were compared using the Chi-square test. Linear regression analysis was used to identify the association between variables and the CEA levels. p value less than 0.01 or 0.05 was considered as significant.
Results
CEA Levels Under Different Blood Glucose Status and the Prevalence of Abnormal CEA in Diabetic Inpatients
A total of 385 diabetic inpatients were included in the study. The rate of diabetic inpatients with abnormal CEA (CEA level ≥5ng/mL) was 14.3% (55/385). To observe whether CEA levels were different under different blood glucose states, patients were divided into three groups according to their blood glucose level, the HbA1c < 7% group (group 1, with blood glucose at target), the 7% ≤ HbA1c < 9% group (group 2) and the HbA1c ≥ 9% group (group 3, with poorly glycemic control). The CEA levels were 2.72 ± 1.49 ng/mL in group 1 (n = 76), 2.88 ± 1.51 ng/mL in group 2 (n = 123), 3.76 ± 2.07 ng/mL in group 3 (n = 186). There was not a significant difference in CEA level between group 1 and group 2, p = 0.463. There was a significant difference in CEA level between group 2 and group 3, p = 0.000. It is shown in Figure 1.
 |
Figure 1 Group 1, the HbA1c<7% group (n=76, with blood glucose at target). Group 2, the 7% ≤ HbA1c < 9% group (n=123). Group 3, the HbA1c ≥ 9% group (n=186, with poorly glycemic control). There was not a significant difference in CEA level between group 1 and group 2, p = 0.463. There was a significant difference in CEA level between group 2 and group 3, p = 0.000. p value less than 0.01 was considered statistically significant. |
Therefore, we divided the patients into two groups (the HbA1c < 9% group and the HbA1c ≥ 9% group) to further explore the related factors of abnormal CEA level in diabetic inpatients. Basic demographic and clinical characteristics of participants are showed in Table 1. The prevalence of patients with abnormal CEA was significantly different in subgroups with different blood glucose status, 20.4% in the HbA1c ≥ 9% group, and 8.5% in the HbA1c < 9% group, p = 0.001. There was a significant difference in CEA level between the HbA1c < 9% group and the HbA1c ≥ 9% group, p = 0.000.
 |
Table 1 Basic Demographic, Clinical Characteristics and CEA Levels of Participants |
Correlation Analysis of CEA Level in Diabetic Inpatients
We further investigated whether the CEA level was related to other factors besides hyperglycemia. We conducted linear regression analysis, with CEA level as the dependent variable. We found that the CEA level was significantly correlated with age, BMI and HbA1c but were not correlated with sex, smoking or drinking state, blood pressure, uric acid, total cholesterol, triglycerides, serum creatinine, or liver function. The regression coefficient of HbA1c was the highest, B = 0.284, p = 0.000. It is shown in Table 2.
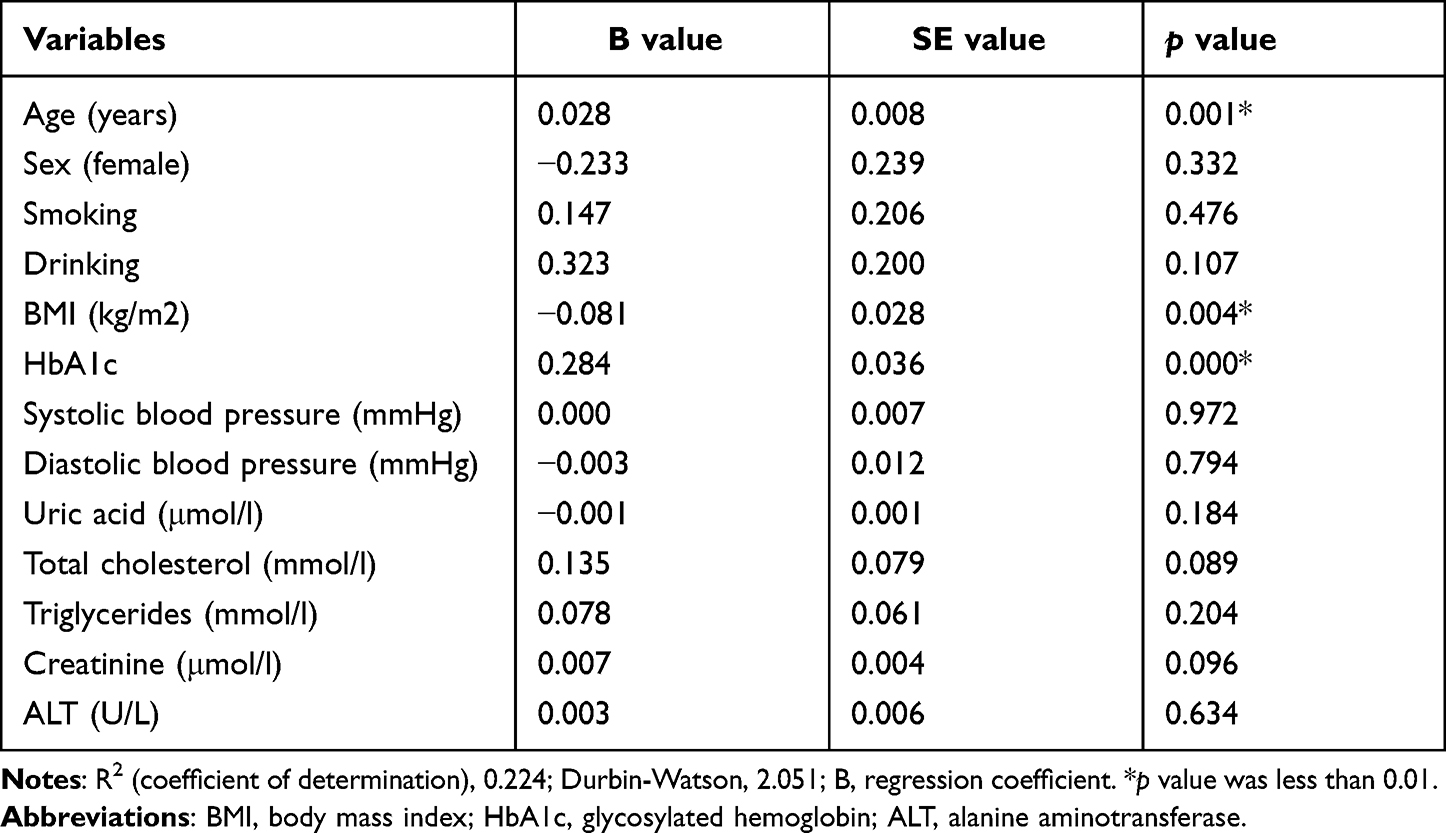 |
Table 2 Correlation Analysis of CEA Level in Diabetic Inpatients |
In order to analyze the influence of BMI on CEA level, patients were divided into three groups according to the BMI, the BMI < 24 kg/m2 group (group 1), the 24 ≤ BMI < 28 kg/m2 group (group 2, overweight) and the BMI ≥ 28 kg/m2 group (group 3, obesity). The CEA levels were 3.87 ± 2.21 ng/mL in group 1 (n= 143), 2.84 ± 1.23 ng/mL in group 2 (n = 173), 3.11 ± 2.04 ng/mL in group 3 (n = 69). There was a significant difference in CEA level between group 1 and group 2, p = 0.000. There was no significant difference in CEA level between group 2 and group 3, p = 0.296. There was a significant difference in CEA level between group 1 and group 3, p = 0.017. It is shown in Figure 2.
 |
Figure 2 Group 1 (n= 143), BMI<24 kg/m2. Group 2, the overweight group (n= 173), BMI ≥24 kg/m2 and < 28 kg/m2. Group 3, the obesity group (n= 69), BMI ≥ 28 kg/m2. There was a significant difference in CEA level between group 1 and group 2, p = 0.000. There was not a significant difference in CEA level between group 2 and group 3, p = 0.296. There was a significant difference in CEA level between group 1 and group 3, p = 0.017. p value less than 0.05 was considered statistically significant. |
In order to analyze the influence of age on CEA level, patients were divided into two groups according to their age, the old group (age ≥60 years old) and the non-old group (age <60 years old). The CEA levels were 3.5 ± 1.85 ng/mL in the old group, and 3.12 ± 1.85 ng/mL in the non-old group. There was no significant difference in CEA level between the old group and the non-old group. p = 0.053.
Mechanism Study
To investigate whether inflammation and islet function were involved in the mechanism of CEA elevation in diabetic patients, patients who were tested CRP, fasting insulin and fasting C-peptide levels were screened for this study. Those with diagnoses of acute inflammatory diseases were excluded. A total of 309 patients were enrolled in the mechanism study.
Patients were divided into two groups according the CEA levels, the elevated CEA group (CEA level ≥5 ng/mL, n = 42) and the non-elevated CEA group (CEA level was normal, n = 267). The CRP levels were 2.68 ± 3.52 mg/L in the non-elevated CEA group, 2.55 ± 3.72 mg/L in the elevated CEA group. There was not a significant difference in the CRP level between the above two groups, p = 0.825. The fasting insulin levels were 10.99 ± 13.31uU/mL in the non-elevated CEA group, 6.38 ± 9.16 uU/mL in the elevated CEA group, p = 0.031. It is shown in Figure 3. The fasting C peptide levels were 1.86 ± 1.00 ng/mL in the non-elevated CEA group, 1.36 ± 0.97 ng/mL in the elevated CEA group, p = 0.002. It is shown in Figure 4.
 |
Figure 3 The elevated CEA group (n=42), the CEA level ≥ 5ng/mL; the non-elevated CEA group (n=267), the CEA level < 5ng/mL. There was a significant difference in the insulin level between the elevated CEA group and the non-elevated CEA group. *p value was less than 0.05. |
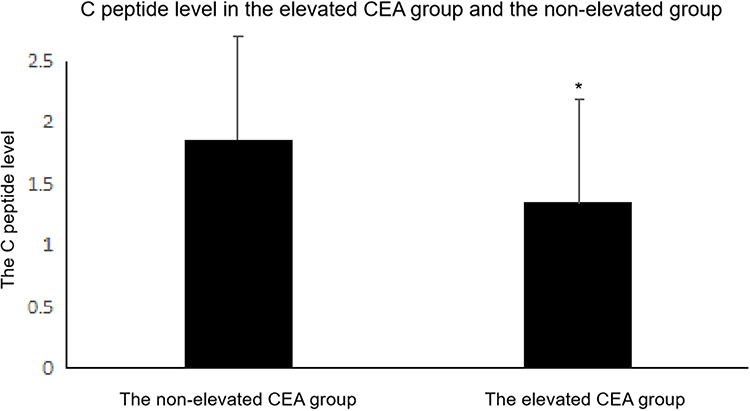 |
Figure 4 The elevated CEA group (n=42), the CEA level ≥ 5ng/mL; the non-elevated CEA group (n=267), the CEA level < 5ng/mL. There was a significant difference in the C peptide level between the elevated CEA group and the non-elevated CEA group. *p value was less than 0.05. |
Discussion
The serum carcinoembryonic antigen (CEA), a classic tumor marker, is widely used to screen and provide valuable prognostic information for cancers. It is over expressed in cancers of the colon, breast, lung and so on.17–19 However, increased CEA concentrations are also found in several non-malignant diseases.1–4 We found a surprisingly high percentage (14.3%) of diabetic inpatients with CEA above normal through screening for tumor markers, who were excluded from malignant tumors by examination and follow-up. The prevalence of patients with abnormal CEA was significantly different in subgroups with different blood glucose status, 20.4% in the HbA1c ≥ 9% group, and 8.5% in the HbA1c < 9% group. We further found that the CEA levels were correlated with age, BMI and HbA1c. The regression coefficient of HbA1c was the highest, B = 0.284, p = 0.000.
It was found that subjects with type 2 diabetes had significantly higher mean serum CEA than controls without diabetes and serum CEA levels correlated positively with HbA1c values.20 Soie Chung8 found that the CEA level was independently and positively correlated with glycemic control status in diabetes. The above studies were conducted to compare the CEA level between people with normal blood glucose and diabetic patients. Our study subjects were all hospitalized diabetic patients with a higher percentage of poor glycemic control (48.3% patients with HbA1c ≥ 9%). In our study, the proportion of patients with abnormal CEA was relatively high, 14.3% in the whole cohort of diabetic inpatients, and 20.4% in the HbA1c ≥ 9% group. There was a significant increased proportion of abnormal CEA in diabetic patients with poor glycemic control. This indirectly proves that CEA level is related to hyperglycemia. More importantly, our study found that abnormal CEA elevation without tumor progression was very common in diabetic inpatients. In previous studies, we found CEA returned to normal or became significantly reduced within 2 weeks after good glycemic control.10 Therefore, our study can remind clinicians that when the CEA level is above normal in diabetic patients, especially for those with HbA1c ≥ 9%, it may be related to poor glycemic control, and the CEA level can become normal or significantly reduced after good control of blood glucose, avoiding unnecessary panic and unnecessary tests about cancer.
The mechanism of the elevation of CEA in diabetic patients is still unclear and needs further study. In our study, the fasting insulin and C peptide levels were lower in the elevated CEA group than in the normal CEA group. Lipid peroxidation and oxidative stress were found to be correlated with the CEA level among diabetic patients.21 It was found that acute hyperglycemia was a direct trigger of oxidative stress.22 Islet function in the hyperglycemia environment of diabetes reduced markedly and was reversible if glucose returned to normal.23 Therefore, we speculate that oxidative stress and decreased levels of insulin and C-peptide are caused by glucose toxicity. We also found that the CEA levels were higher in diabetic inpatients with BMI < 24 kg/m2 than in overweight or obesity patients. Patients with severe hyperglycemia develop impaired sugar utilization, leading to weight loss, which in turn can lead to a decrease in BMI. Therefore, we speculate that glucose toxicity may be the direct cause of the elevation of CEA, and it can be reversed, but new experimental approaches must be conducted to test the hypothesis.
In general, our study indicated that the elevation of CEA was common in diabetic inpatients, especially those with poor hyperglycemia controlled (HbA1c ≥ 9%). The underlying mechanism may be related to glucose toxicity.
Clinical Perspectives
Diabetes-related health expenditures are very high. Diabetic inpatients are routinely screened for tumor markers. Our study revealed that the elevation of CEA was common in diabetic inpatients, especially those with poor hyperglycemia controlled (HbA1c ≥ 9%). The CEA level was significantly correlated with HbA1c. Our study indicated that it was better to re-check the CEA level after glucotoxic remission instead of extensive screening or trauma tests for cancer. Clinicians’ understanding of this phenomenon may avoid waste of medical resources and unnecessary panic of patients.
Data Sharing Statement
Data are openly available in a public repository that issues datasets with DOIs. The data that support the findings of this study are openly available in Figshare. DOI:10.6084/m9.figshare.19848850.
Funding
This work was supported by the grants from the project of science and technology of Jinhua (2022-3-029).
Disclosure
The authors report no conflicts of interest in this work.
References
1. Kwon YJ, Lee HS, Shim JY, Lee YJ. Serum carcinoembryonic antigen is positively associated with leukocyte count in Korean adults. J Clin Lab Anal. 2018;32(3):e22291. doi:10.1002/jcla.22291
2. Bertola G, Balza G, Oriani A, et al. Elevated concentration of serum carcinoembryonic antigen in hypothyroidism. Recenti Prog Med. 2004;95(4):204–206.
3. Kaplan I, Bulut M, Atli A, et al. Serum levels of carcinoembryonic antigen (CEA) in patients with bipolar disorder. Acta Neuropsychiatr. 2015;27(3):177–181. doi:10.1017/neu.2015.5
4. Docci D, Turci F, Pistocchi E. High levels of carcinoembryonic antigen (CEA) in the serum of uremic patients under hemodialysis treatment. Quad Sclavo Diagn. 1984;20(4):435–439.
5. Sun H, Saeedi P, Karuranga S, et al. IDF diabetes atlas: global, regional and country-level diabetes prevalence estimates for 2021 and projections for 2045. Diabetes Res Clin Pract. 2022;183:109119. doi:10.1016/j.diabres.2021.109119
6. Tsilidis KK, Kasimis JC, Lopez DS, et al. Type 2 diabetes and cancer: umbrella review of meta-analyses of observational studies. BMJ. 2015;350:g7607. doi:10.1136/bmj.g7607
7. Cheng Y-C, Li Y-H, Hsu C-Y, et al. Synergistic association of carcinoembryonic antigen and carbohydrate antigen 19-9 on the Risk of Abnormal Glucose Regulation. Diabetes Metab Syndr Obes. 2020;13:1933–1942. doi:10.2147/DMSO.S256223
8. Chung S, Lee Y, Roh EY. HbA1c showed a positive association with carcinoembryonic antigen (CEA) level in only diabetes, not prediabetic or normal individuals. J Clin Lab Anal. 2019;33(6):e22900. doi:10.1002/jcla.22900
9. Chen J, Tao F, Zhang B, et al. Elevated squamous cell carcinoma antigen, cytokeratin 19 fragment, and carcinoembryonic antigen levels in diabetic nephropathy. Int J Endocrinol. 2017;2017:5304391. doi:10.1155/2017/5304391
10. Liu X-Y. The high prevalence of short-term elevation of tumor markers due to hyperglycemia in diabetic patients. Diabetes Metab Syndr Obes. 2022;15:1113–1122. doi:10.2147/DMSO.S350599
11. Yu H, Li R, Zhang L, et al. Serum CA19-9 level associated with metabolic control and pancreatic beta cell function in diabetic patients. Exp Diabetes Res. 2012;2012:745189. doi:10.1155/2012/745189
12. Elimam H, Abdulla AM, Taha IM. Inflammatory markers and control of type 2 diabetes mellitus. Diabetes Metab Syndr. 2019;13(1):800–804. doi:10.1016/j.dsx.2018.11.061
13. Jeong S, Park MJ, Song W, et al. Current immunoassay methods and their applications to clinically used biomarkers of breast cancer. Clin Biochem. 2020;78:43–57. doi:10.1016/j.clinbiochem.2020.01.009
14. Bergman M, Abdul-Ghani M, DeFronzo RA, et al. Review of methods for detecting glycemic disorders. Diabetes Res Clin Pract. 2020;165:108233. doi:10.1016/j.diabres.2020.108233
15. Burchill MA, Finlon JM, Goldberg AR, et al. Oxidized low-density lipoprotein drives dysfunction of the liver lymphatic system. Cell Mol Gastroenterol Hepatol. 2021;11(2):573–595. doi:10.1016/j.jcmgh.2020.09.007
16. Dai B, Xu L, Jiankun X, et al. Synergistic effects of magnesium ions and simvastatin on attenuation of high-fat diet-induced bone loss. Bioact Mater. 2021;6(8):2511–2522. doi:10.1016/j.bioactmat.2021.01.027
17. Cai Z, Huang L, Chen Y, et al. CEA decline predicts tumor regression and prognosis in locally advanced rectal cancer patients with elevated baseline CEA. J Cancer. 2020;11(22):6565–6570. doi:10.7150/jca.49252
18. Nam SE, Lim W, Jeong J, et al. The prognostic significance of preoperative tumor marker (CEA, CA15-3) elevation in breast cancer patients: data from the Korean breast cancer society registry. Breast Cancer Res Treat. 2019;177(3):669–678. doi:10.1007/s10549-019-05357-y
19. Jiao Z, Cao S, Jianhua L, et al. Clinical associations of preoperative and postoperative serum CEA and lung cancer outcome. Front Mol Biosci. 2021;8:686313. doi:10.3389/fmolb.2021.686313
20. Zayed AA, Beano AM, Amer FN, et al. Serum levels of carcinoembryonic antigen in patients with type 2 diabetes. Endocr Pract. 2016;22(11):1310–1318. doi:10.4158/EP161221.OR
21. Hasan M, Mohieldein A. Association between serum carcinoembryonic antigen level and oxidative stress parameters among diabetic females. Int J Clin Exp Med. 2015;8(4):6489–6494.
22. Choi SW, Benzie IF, Ma SW, et al. Acute hyperglycemia and oxidative stress: direct cause and effect? Free Radic Biol Med. 2008;44(7):1217–1231. doi:10.1016/j.freeradbiomed.2007.12.005
23. Weir GC, Butler PC, Bonner-Weir S. The β-cell glucose toxicity hypothesis: attractive but difficult to prove. Metabolism. 2021;124:154870. doi:10.1016/j.metabol.2021.154870
 © 2022 The Author(s). This work is published and licensed by Dove Medical Press Limited. The
full terms of this license are available at https://www.dovepress.com/terms
and incorporate the Creative Commons Attribution
- Non Commercial (unported, 3.0) License.
By accessing the work you hereby accept the Terms. Non-commercial uses of the work are permitted
without any further permission from Dove Medical Press Limited, provided the work is properly
attributed. For permission for commercial use of this work, please see paragraphs 4.2 and 5 of our Terms.
© 2022 The Author(s). This work is published and licensed by Dove Medical Press Limited. The
full terms of this license are available at https://www.dovepress.com/terms
and incorporate the Creative Commons Attribution
- Non Commercial (unported, 3.0) License.
By accessing the work you hereby accept the Terms. Non-commercial uses of the work are permitted
without any further permission from Dove Medical Press Limited, provided the work is properly
attributed. For permission for commercial use of this work, please see paragraphs 4.2 and 5 of our Terms.