")
Back to Journals » Diabetes, Metabolic Syndrome and Obesity » Volume 14
Hepatic Knockdown of Endothelin Type A Receptor (ETAR) Ameliorates Hepatic Insulin Resistance and Hyperglycemia Through Suppressing p66Shc-Mediated Mitochondrial Fragmentation in High-Fat Diet-Fed Mice
Authors Feng L, Wang S, Chen F, Zhang C, Wang Q, Zhao Y, Zhang Z
Received 29 December 2020
Accepted for publication 23 February 2021
Published 2 March 2021 Volume 2021:14 Pages 963—981
DOI https://doi.org/10.2147/DMSO.S299570
Checked for plagiarism Yes
Review by Single anonymous peer review
Peer reviewer comments 3
Editor who approved publication: Dr Konstantinos Tziomalos
Li Feng,* Songhua Wang,* Feng Chen,* Cheng Zhang, Qiao Wang, Yuting Zhao, Zifeng Zhang
School of Life Science, Jiangsu Normal University, Xuzhou, Jiangsu, 221116, People’s Republic of China
*These authors contributed equally to this work
Correspondence: Zifeng Zhang 101 Shanghai Road, Xuzhou, Jiangsu Province, 221116, People’s Republic of China
Tel + 86 516 83403729
Email [email protected]
Background: Emerging evidence from animal studies and clinical trials indicates that systemic inhibition of endothelin1 (ET1) signaling by endothelin receptor antagonists improves pathological features of diabetes and its complications. It is indicated that endothelin type A receptor (ETAR) plays a major role in ET1-mediated pathophysiological actions including diabetic pathology. However, the effects as well as the mechanistic targets of hepatic ET1/ETAR signaling inhibition on the pathology of metabolic diseases remain unclear. This study aimed to investigate the beneficial effects as well as the underlying mechanisms of hepatic ETAR knockdown on metabolism abnormalities in high-fat diet (HFD)-fed mice.
Methods: Mice were fed a HFD to induce insulin resistance and metabolism abnormalities. L02 cells were treated with ET1 to assess the action of ET1/ETAR signaling in vitro. Liver-selective knockdown of ETAR was achieved by tail vein injection of adeno-associated virus 8 (AAV8). Systemic and peripheral metabolism abnormalities were determined in vivo and in vitro. Mitochondrial fragmentation was observed by transmission electron microscope (TEM) and mitoTracker red staining.
Results: Here we provided in vivo and in vitro evidence to demonstrate that liver-selective knockdown of ETAR effectively ameliorated hepatic insulin resistance and hyperglycemia in HFD-fed mice. Mechanistically, hepatic ETAR knockdown alleviated mitochondrial fragmentation and dysfunction via inactivating 66-kDa Src homology 2 domain-containing protein (p66Shc) to recover mitochondrial dynamics, which was mediated by inhibiting protein kinase Cδ (PKCδ), in the livers of HFD-fed mice. Ultimately, hepatic ETAR knockdown attenuated mitochondria-derived oxidative stress and related liver injuries in HFD-fed mice. These ETAR knockdown-mediated actions were confirmed in ET1-treated L02 cells.
Conclusion: This study defined an ameliorative role of hepatic ETAR knockdown in HFD-induced metabolism abnormalities by alleviating p66Shc-mediated mitochondrial fragmentation and consequent oxidative stress-related disorders and indicated that hepatic ETAR knockdown may be a promising therapeutic strategy for metabolic diseases.
Keywords: endothelin-1, endothelin type A receptor, 66-kDa Src homology 2 domain-containing protein, mitochondrial fragmentation, metabolism abnormality
Introduction
Endothelin1 (ET-1), a 21-amino acid vasoconstrictor peptide, has been implicated in a range of pathophysiological processes, such as vasoconstrictor tone, humoral homeostasis, neurotransmission, oxidative stress, inflammation and ER stress, which is mediated mainly through two G-protein coupled receptor subtypes, endothelin subtype A receptor (ETAR) and endothelin subtype B receptor (ETBR).1–3 The serum level of ET1 is significantly heightened in diabetic patients and experimental animals, which has recently been recognized as a potential contributing factor underlying the pathogenesis of diabetes and its complications.3–5 Systemic inhibition of ET1 signaling by endothelin receptor antagonists has been reported to improve pathological features of diabetes and its complications.6–9 Though the selective and dual antagonists of ETAR and ETBR have all been reported to improve pathological features of diabetes and its complications.6–9 Substantial evidence suggests that ETAR plays a major role in ET1-mediated pathophysiological actions including diabetic pathology.8–12 For example, ET1 promotes lipolysis, and suppresses insulin-stimulated glucose and long-chain fatty acid (LCFA) uptakes and adiponectin secretion in adipocytes, contributing to hyperlipidemia, hyperglycemia and insulin resistance, which was mainly mediated by ETAR and can be reversed by its selective antagonists.9 In muscle, ETAR selective antagonists abrogate the inhibitory effects of ET1 on cluster of differentiation 36 (CD36) expression and insulin-induced glucose uptake and insulin signaling, ameliorating atherosclerosis, hyperglycemia and insulin resistance.10,11 Especially, ET1 and ETAR or ETBR selective agonists augment glucose production in perfused rat liver, while ETAR selective antagonist, but not ETBR selective antagonist, prevents ET1-induced enhancement of hepatic glucose production.12 Moreover, ETAR selective antagonists abate hepatic steatosis and restore hepatic insulin signaling to improve whole-body glucose metabolism in diabetic animals.9 These studies indicate an important role of ET1/ETAR signaling in the pathogenesis of metabolic diseases. It has been well established that hepatic metabolic disorders lead to systemic metabolism abnormalities, such as hyperglycemia and hyperlipemia, which contribute to the pathogenesis of diabetes.13 Thus, hepatic ET1/ETAR signaling may play an important role in the pathogenesis of metabolism abnormalities; however, its definite effects as well as the underlying mechanisms remain unclear. Moreover, whether and how blocking hepatic ET1/ETAR signaling ameliorates metabolism abnormalities have never been investigated.
Mitochondria are essential for various cellular processes, such as bioenergetics, metabolism, signal transduction, Ca2+ homeostasis, stress response and apoptosis. As mitochondrion is a regulatory hub for bioenergetics and metabolism, its dysfunction has emerged as a key player in the pathogenesis of metabolic diseases.14 A functional mitochondrial network is maintained via a balance of mitochondrial fusion, fission, namely mitochondrial dynamics, and mitophagy.15 Mitochondrial fragmentation results from disrupted mitochondrial dynamics by unopposed fission and/or compromised fusion, leading to excessive ROS production, inflammation, declined ATP production and fatty acid oxidation, contributing to glucose and lipid metabolism disorders and insulin resistance.16,17 There is evidence that mitochondrial dysfunction is involved in ET1-mediated cellular injuries.18,19 ET1 restrains the key genes expression of mitochondrial electron transport chain and consequent bioenergetics in retinal ganglion cells (RGCs).18 A recent study indicates ET1 promotes vasoconstriction by increasing mitochondrial fission, which plays a major role in the pathogenesis of hypertension.19 However, whether and how mitochondrial fragmentation participates in the regulation of ET1/ETAR signaling on metabolism abnormalities has yet to be clarified.
66-kDa Src homology 2 domain-containing protein (p66Shc), a redox enzyme, plays a key role in the pathogenesis of mitochondrial dysfunctions in various pathophysiologic conditions.20,21 Moreover, p66Shc has also been well identified as an important contributor to diabetes and its complications.22,23 Thus, p66Shc is a crucial regulator of mitochondrial dysfunctions-mediated metabolic disorders. Based on these previous studies, we proposed that hepatic knockdown of ETAR improves hepatic insulin resistance and hyperglycemia via suppressing p66Shc-mediated mitochondrial fragmentation and consequent oxidative stress-related disorders in HFD-fed mice. The present study was designed to define these issues.
Materials and Methods
Mice and Treatments
All animal care and experimental procedures were conducted according to the guidelines for the care and use of laboratory animals (Chinese Ministry of Science and Technology) and were approved by the Institutional Animal Care and Use Committee of Jiangsu Normal University (Permit Number: 2020–0062).
Male C57BL/6J mice (6-week-old) were purchased from Hua-fu-kang Biological Technology Co. Ltd (Beijing, China). Mice were kept under a 12-h light/dark cycle with ad libitum access to rodent food and tap water. After two weeks of acclimation period, mice were randomly divided into four groups: Normal diet (ND)+negative control shRNA (shNC) group, ND+ETAR shRNA (shETAR) group, HFD+shNC group and HFD+shETAR group. Mice received a ND (10% of energy as fat; D12450B; Research Diets, New Brunswick, NJ, USA) or a HFD (60% of energy as fat; D12492; Research Diets) for 20 weeks. After 14 weeks of dietary manipulation, PHBAAV8-U6-MCS-CMV-ZsGreen vectors containing ETAR shRNA (Hanbio Biotechnology Co., Ltd, Shanghai, China) or negative control (Hanbio Biotechnology) were administrated to mice by a tail vein injection at doses of 1.5×10¹¹ vg/mouse. The ETAR siRNA sequence is as follows: 5′- GCCATTGAA ATCGTCTCCATCTGGA-3′.
After 20 weeks of dietary manipulation, anaesthetized mice were sacrificed. The liver, adipose tissues and blood were quickly collected for experiments or kept frozen at −80°C until use.
Glucose, Insulin and Pyruvate Tolerance Tests
After 4 weeks of AAV8 injection, glucose tolerance tests (GTT), insulin tolerance tests (ITT) and pyruvate tolerance tests (PTT) were performed every 4–5 days within 2 weeks. For GTT and PTT, mice were fasted for 16 h and received an oral administration of glucose (2 g/kg body weight) or intraperitoneal (i.p.) injection of pyruvate (2 g/kg body weight) respectively. Blood glucose values were assessed by tail venipuncture immediately before (0 min) and after (15, 30, 45, 60, 90, and 120 min). For ITT, mice were fasted for 6 h and received an i.p. injection of insulin (0.75 units/kg body weight). Blood glucose values were assessed immediately before (0 min) and after (15, 30, 60, 90, and 120 min).
Biochemical Analyses
For biochemical analyses, the blood and liver samples were collected at overnight fasting state. Blood glucose was monitored using an Ascensia Elite glucose meter (Bayer Corporation, Mishawaka, IN, USA) by tail venipuncture. Lipids were extracted from liver tissues and L02 cells using chloroform:methanol (2:1v/v) solution. The levels of serum, hepatic and intracellular triglyceride (TG) were measured with a corresponding LabAssay kit (Wako Chemicals, Richmond, VA, USA). The activities of serum alanine aminotransferase (ALT) were determined using a diagnostic kit (Jiancheng Institute of Biotechnology, Nanjing, China). β-hydroxybutyrate (β-OHB) in plasma and culture medium was measured using a beta-HB Fluorometric Assay Kit (Abcam, Cambridge, UK). All biochemical analyses were conducted according to the indicated manufacturer instructions.
Enzyme-Linked Immunosorbent Assay (ELISA)
The serum levels of ET1 and insulin were analyzed using the ELISA kits (mouse ET1 ELISA kit: (Invitrogen, Thermo Fisher Scientific, Carlsbad, CA, USA); mouse insulin ELISA kit: ALPCO Diagnostics, Windham, NH, USA) according to the manufacturer’s instructions.
Histopathological Analysis
Frozen liver sections were prepared and then stained with hematoxylin-eosin (Sigma-Aldrich, St. Louis, MO, USA) as previously described.24
Cell Culture and Treatment
The human normal liver cell line L02 cells (Shanghai Cell Bank of the Chinese Academy of Sciences, Shanghai, China) were maintained in Dulbecco’s modified eagle medium (DMEM; Gibco, Carlsbad, California, USA) supplemented with 10% heat-inactivated fetal bovine serum (FBS; Gibco, Carlsbad, California, USA), 100 units/mL penicillin, and 100 μg/mL streptomycin at 37°C, 5% CO2. 24 h after recombinant adenovirus infection, L02 cells were stimulated with 50nm ET1 (Sigma-Aldrich) for another 24 h, the dosage of ET1 was according to the previous studies.9,25
For genes knockdown, L02 cells were infected with recombinant adenovirus based on pHBAd-U6-CMV-GFP vector containing ETAR shRNA, protein kinase Cδ (PKCδ) shRNA, p66Shc shRNA or negative control shRNA at a multiplicity of infection of 100 for 48 h. For p66Shc overexpression, L02 cells were infected with recombinant adenovirus expressing pHBAd-MCMV-p66Shc or pHBAd-MCMV-GFP at a multiplicity of infection of 100 for 48 h. All recombinant adenovirus was designed and constructed by Hanbio Biotechnology Co., Ltd. (Shanghai, China). The shRNA target sequences are as follows: ETAR: 5ʹ-ACAATGACTTTGGCGTATTTC-3ʹ; p66Shc: 5ʹ-CCGCTTTGAAAGTGTCAGTCA-3ʹ; PKCδ: 5′-CAGAGCCTGTTGGGATATATC-3′.
For in vitro insulin signaling analysis, cells were stimulated with 100 nM insulin (Sigma-Aldrich) for 15 min.
Glucose Production Assay
L02 cells were transfected with Ad-shETAR or Ad-shNC for 24 h followed by being treated with or without ET1 (50nm/mL) for 24 h. L02 cells were incubated in Krebs-Ringer HEPES (KRH) buffer supplemented with or without gluconeogenic substrates (10 mM lactate and 5 mM pyruvate) for 6 h following being washed with PBS three times. Glucose concentrations in the medium were determined using a glucose assay kit (Sigma-Aldrich) and normalized to cellular protein.
Mitochondrial Morphology
The ultrathin sections (70 nm) of liver tissues were prepared and stained as described in our previous work.26 Images were captured using transmission electron microscope (TEM, FEI Tecnai™ G2 T12, USA) at 10,000 × magnification. Mitochondrial fragmentation was quantified by calculating the percentage of fragmented mitochondria in 10 random microscopic fields (100 μm2) per sample.
For observation of mitochondrial morphology in cells, L02 cells were seeded onto glass coverslips in 6-well plates and subjected to the indicated treatments. Then, cells were stained with 100 nM MitoTracker™ Red CMXRos (Invitrogen) for labeling mitochondria. The nucleus was visualized using 4, 6-diamidino-2-phenylindole (DAPI, Invitrogen). Images were acquired with a Leica TCS SP8 confocal microscope equipped with a Leica DMI 8 inverted microscope (Leica).
Assessment of Mitochondrial Function
The intact mitochondria were isolated from mouse livers or cells with a mitochondria isolation kit (Beyotime Institute of Biotechnology, Beijing, China) according to the manufacturer’s instructions. The mitochondrial membrane potential (Δψm) of isolated mitochondria was assessed by the 5,5ʹ,6,6ʹ-tetrachloro-1-1ʹ,3,3ʹ-tetraethylbenzimidazol-carbocyanine iodide (JC-1) staining method (Beyotime) as previously described.26 ATP content was measured with an ATP assay kit (Beyotime) according to the manufacturer’s instructions and normalized to cellular protein.
Analysis of Redox Status
ROS content of liver tissue was detected using 2ʹ, 7ʹ-dichlorodihydrofluorescein diacetate (H2-DCF-DA) as described in our previous study.24 For detection of mitochondrial ROS, cells seeded onto glass coverslips were stained with 5 μM MitoSOX Red (Invitrogen) for 20 min. DAPI (Invitrogen) was used to stain the nucleus.
The activity of manganese superoxide dismutase (MnSOD) in liver tissues and cells was assessed with a commercial assay kit (Jiancheng Institute of Biotechnology) following the manufacturer’s instructions.
Immunofluorescence Staining and Confocal Imaging
The liver tissue cryosections were prepared and subjected to triple immunofluorescence labelling as described in our previous work.27 The following primary antibodies (Abcam, Cambridge, MA, USA) were used: Rabbit-anti translocase of outer mitochondrial membrane 20 (TOM20) antibody (ab186735) 1:300 and mouse-anti p-p66Shc antibody (ab54518) 1:250. The secondary antibodies (Abcam) were as follows: goat anti-mouse IgG H&L (Alexa Fluor® 647) (ab150119) 1:1000 and goat Anti-Rabbit IgG H&L (Alexa Fluor® 568) (ab175698) 1:1000. The nucleus was visualized with DAPI (Invitrogen). Images were captured by a Leica TCS SP8 confocal microscope equipped with a Leica DMI 8 inverted microscope (Leica).
Quantitative Real-Time Polymerase Chain Reaction
Total RNA extraction, reverse transcription and real-time PCR were conducted as previously described.24 The primers used were: murine Tumor necrosis factor α (mTNF-α): Forward, 5′-TCTCATTCCTGCTTGTGG-3′, Reverse, 5′-ACTTGGTGGTTTG CTACG-3′; murine Interleukin-1β (mIL-1β): Forward, 5′-AAATACCTGTGGCCTTGGGC-3′, Reverse, 5′-CTTGGGATCCACACTCTCCAG-3′; murine Interleukin-6 (mIL-6): Forward, 5′-GGTACATCC TCGACGGCATCT-3′, Reverse, 5′-GTGCCTCTTTGCTGCTTTCAC-3′; murine β-actin, Forward: 5ʹ-TGCTGTCCC TGTATGCCTCTG-3ʹ, Reverse: 5ʹ- TTGATGTCACGCACGATTTCC-3ʹ; human TNF-α: Forward, 5′- GCTTGTTCCTCAGCCTCTTC −3′, Reverse, 5′-GGTTATCTCTCAGCTCCACGC −3′; human IL-1β: Forward, 5′-GCCCTAAACAGATGAAGTGCTC-3′, Reverse, 5′-GAACCAGC ATCTTCCTCAG-3′; human β-actin, Forward: 5ʹ- GAGACCTTCAACACCCCAGC −3ʹ, Reverse: 5ʹ- GCTCATTGCCAATGGTGATG −3ʹ. The comparative cycle threshold (Ct) method was used to relatively quantified mRNAs by normalizing target mRNA Ct values to those for β-actin.
Carnitine Palmitoyltransferase 1 (CPT1) Activity Assay
The CPT1 activities in liver tissues and cells were assessed spectrophotometrically according to the protocol described in previous studies.28,29 The protein lysates were incubated in the reaction buffer (20 mM Tris, pH 8.0, 1 mM EDTA) containing 1 mM 5, 5′-dithio-bis-(2-nitrobenzoic acid) (DTNB, Sigma) for 30 min at room temperature. Then, 100 μM palmitoyl-CoA (Sigma) and 5 mM L-carnitine (Sigma) were added to the reaction mixtures to start the reaction. The production of CoA-SH from palmitoyl-CoA was detected at 412 nm. The activity of CPT1 was presented as nmol CoA-SH released/min/mg protein.
Western Blot and Coimmunoprecipitation (Co-IP) Analysis
The extraction of cytosolic and mitochondrial protein was conducted using a mitochondria isolation kit (Beyotime Institute of Biotechnology) following the manufacturer’s instructions. Membrane-associated and cytosolic fractions were separated as previously described.30,31 Total protein extraction and Western blot analyses were performed as described in our previous work.24 Protein concentration was determined by a bicinchoninic acid assay kit (Pierce Biotechnology, Rockford, IL, USA). The following primary antibodies were used: Rabbit-anti p-insulin receptor β-subunit (IRβ) (Tyr1150/1151) (#3024), Rabbit-anti IRβ (#23413), Rabbit-anti p-protein kinase B (Akt) (Ser 473) (#9271), Rabbit-anti Akt (#9272), Rabbit-anti phosphoenolpyruvate carboxykinase (PEPCK) (#12940) and mouse-anti β-Actin (#3700) antibodies (Cell Signaling Technology, Inc., Beverly, MA, USA); Rabbit-anti Glucose-6-phosphatase (G6PC) antibody (PA5-42541, Invitrogen); Rabbit-anti ZsGreen antibody (632474, Clontech/Takara, Mountain View, CA, USA); Rabbit-anti ETAR (ab117521), Rabbit-anti TOM20 antibody (ab186735), mouse-anti p-p66Shc antibody (Ser 36) (ab54518), Rabbit-anti p66Shc (ab33770), Rabbit-anti Mitofusin 1 (Mfn1) (ab104274), Rabbit-anti Mitofusin 2 (Mfn2) (ab124773), Rabbit-anti dynamin-related protein 1 (DRP1) (ab184247), Rabbit-anti p-PKCδ (Thr 505) (ab60992) and Rabbit-anti PKCδ (ab182126) antibodies (Abcam, Cambridge, MA, USA). The secondary antibodies (Cell Signaling Technology) were as follows: Goat-anti rabbit (HRP-conjugated, #7074) and Horse-anti mouse (HRP-conjugated, #7076). The immunoreactive bands of proteins were quantified by Scion Image analysis software (Scion Corp., Frederick, MD, USA). The optical density (OD) was normalized to internal control (optical density detected protein/optical density internal control).
For Co-IP, equal amounts of proteins (1 mg) in liver tissues or cell lysates were incubated with mouse-anti p66Shc antibody (sc-967, Santa Cruz Biotechnology, CA, USA) overnight at 4°C following preclearing by protein A+G-sepharose beads (Santa Cruz Biotechnology). The immune complexes were incubated with protein A+G-sepharose beads followed by being washed four times and then were subjected to Western blot analysis with rabbit-anti p66Shc (ab33770) and rabbit-anti p-PKCδ (Thr 505) (ab60992) (Abcam).
Statistical Analyses
Data were expressed as the means ± standard deviation (SD) and analyzed using SPSS software version 22. Significant differences of data were assessed by two-tailed Student’s t-test (Comparison between two groups) and by one-way or two-way analysis of variance (ANOVA) followed by Tukey’s Honestly Significant Difference (HSD) post hoc test (more than two groups). Statistical significance was accepted at a value of p < 0.05.
Results
Hepatic Knockdown of ETAR Improves Hepatic Insulin Resistance and Hyperglycemia in HFD-Fed Mice
The serum level of ET1, as well as the protein expression of hepatic ETAR, was markedly augmented, indicating an upregulation of hepatic ET1/ETAR signaling in HFD-fed mice (Figure 1A and B). HFD resulted in an evident obesity (Supplementary Figure 1A–C) and hyperglycemia (Figure 1C), and observably elevated metabolic parameters including serum insulin (Figure 1D) and TG (triglycerides, the serum concentration of whom is associated with the development of metabolic diseases such as diabetes and cardiovascular disease. Supplementary Figure 1D) and hepatic TG (Its concentration is linked to hepatic steatosis and lipotoxicity. Supplementary Figure 1E) in mice. The striking impairments of glucose tolerance and systemic insulin sensitivity were observed in HFD-fed mice (Figure 1E and F). Moreover, the insulin signaling transduction was markedly disrupted as evidenced by a remarkable decrease in the phosphorylation of IR at Tyr1150/1151 and phosphorylation of Akt at Ser473 in the livers of HFD-fed mice (Figure 1G). Consequently, the blood glucose level upon pyruvate injection and the protein expression of gluconeogenic enzymes including PEPCK and G6PC were strikingly heightened (Figure 1H and I), indicating an enhanced gluconeogenesis in HFD-fed mouse livers.
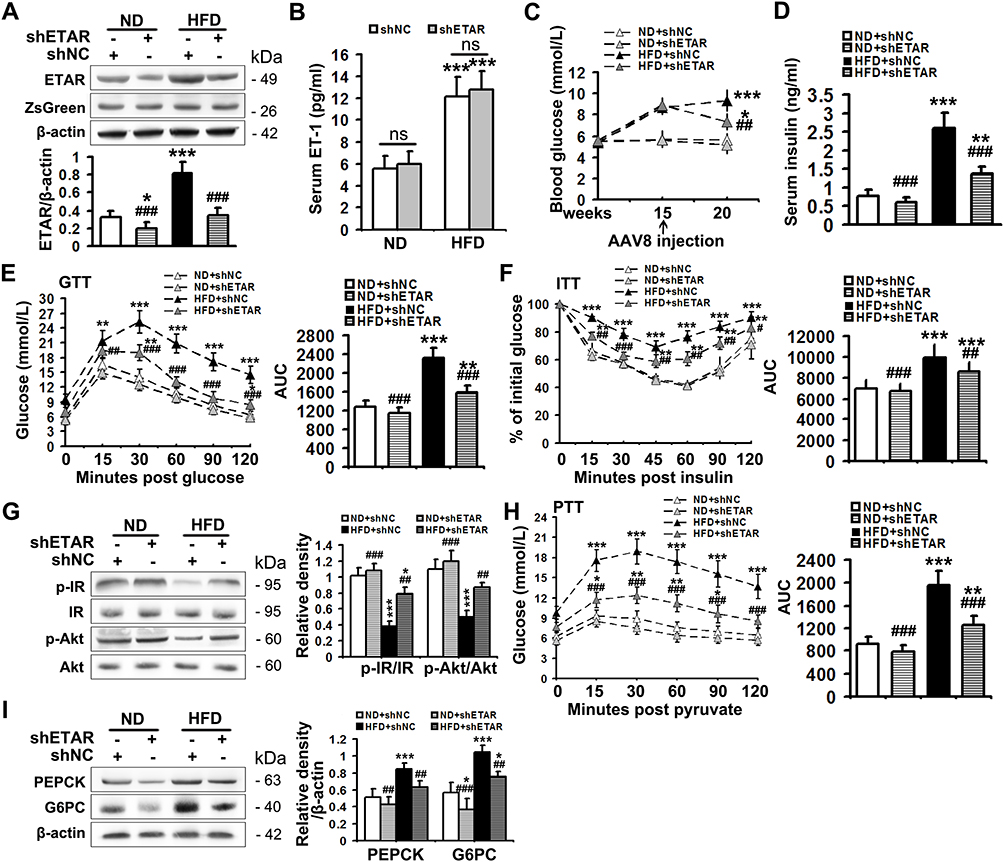 |
Figure 1 Hepatic knockdown of ETAR ameliorates hyperglycemia, hepatic insulin resistance and gluconeogenesis in HFD-fed mice. (A) Protein expression of ETAR in mouse livers, n=5. (B) Serum ET1 concentration in mice, n=5. (C) Fasting blood glucose in mice, n=10. (D) Fasting serum insulin in mice, n=5. (E) GTT and area under the curve (AUC) of blood glucose levels in mice, n=5. (F) ITT and AUC of blood glucose levels in mice, n=5. (G) Protein expression of the components of insulin signaling (p-IR and p-Akt) in mouse livers, n=3. (H) PTT and AUC of blood glucose levels in mice, n=5. (I) Protein expression of gluconeogenic enzymes (PEPCK and G6PC) in mouse livers, n=3. *P < 0.05, **P < 0.01, ***P < 0.001; #P < 0.05, ##P < 0.01, ###P < 0.001 versus the HFD + shNC group. |
To study the ameliorative role of hepatic inhibition of ETAR in hepatic insulin resistance and hyperglycemia, a liver-selective knockdown of ETAR by AAV8-mediated shRNA delivery was conducted in mice. AAV8-mediated ETAR shRNA delivery significantly abated the protein expression of ETAR in livers (Figure 1A), while caused a slight but non-significant decrease in ETAR protein expression in skeletal muscles and adipose tissues (Supplementary Figure 2), in both ND- and HFD-fed mice, suggesting an establishment of liver-specific ETAR knockdown. Hepatic ETAR knockdown did not notably influence the serum level of ET1 in both ND- and HFD-fed mice (Figure 1B). Noteworthily, hepatic ETAR knockdown ameliorated hyperglycemia without affecting body weight and the weights of epididymal white adipose tissue (eWAT), and inguinal WAT (iWAT) in HFD-fed mice (Figure 1C and Supplementary Figure 1A–C). These metabolic parameters (Serum insulin and TG and hepatic TG, Figure 1D and Supplementary Figure 1D and E), as well as the impairments of glucose tolerance and systemic insulin sensitivity (Figure 1E and F), were dramatically improved by hepatic ETAR knockdown in HFD-fed mice. Furthermore, hepatic ETAR knockdown effectively restored insulin signaling transduction and attenuated gluconeogenesis in the livers of HFD-fed mice (Figure 1G–I).
ETAR Knockdown Recovers Insulin Sensitivity and Diminishes Glucose Production in ET1-Treated Hepatocytes
The serum level of ET1 is pathologically elevated in clinical and experimental diabetes, contributing to both systemic and peripheral metabolism abnormalities.8–12,32 L02 cells were treated with ET1 to imitate the high ET1 circumstances in the livers of HFD-fed mice. To confirm the role of ETAR knockdown in improving hepatic insulin resistance and glucose production in HFD-fed mice in vitro, L02 cells were infected with adenoviral shRNAs to knockdown ETAR (Figure 2A: diminished ETAR protein levels by 70% in ET1-treated L02 cells). Insulin-stimulated Akt phosphorylation was notably reduced in ET1-treated L02 cells (Figure 2B), indicating an impaired insulin sensitivity. Noteworthily, ETAR knockdown restored insulin sensitivity in ET1-treated L02 cells (Figure 2B). Consequently, glucose productions were markedly increased by 57.62% in ET1-treated L02 cells (Figure 2C) compared to those of controls. Dramatically, ETAR knockdown lowered the glucose production in ET1-treated L02 cells (Figure 2C). Moreover, ET1 treatment strikingly elevated the protein expression of gluconeogenic enzymes in L02 cells, which was markedly suppressed by ETAR knockdown (Figure 2D).
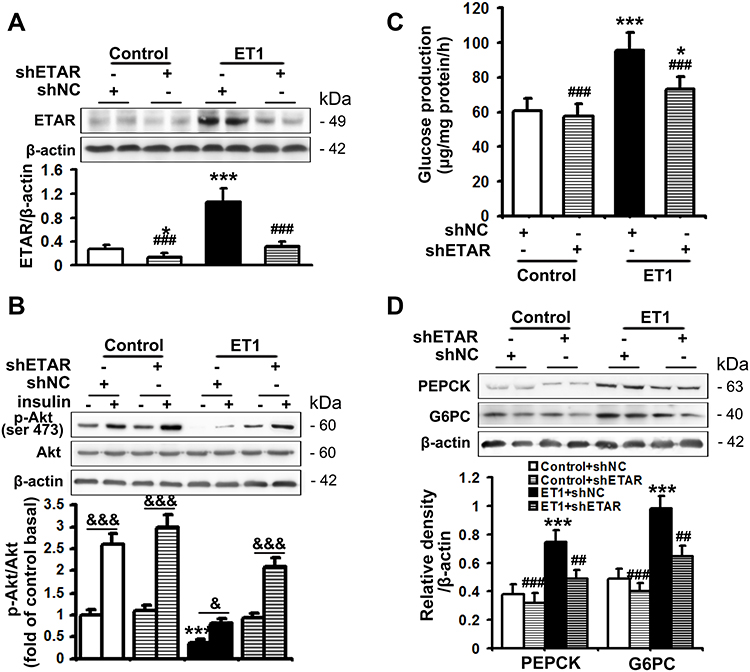 |
Figure 2 ETAR knockdown enhances insulin sensitivity and decreases glucose production in ET1-treated hepatocytes. L02 cells infected with Ad-shETAR were treated with 50nm ET1. (A) Protein expression of ETAR in L02 cells. (B) Analysis of insulin sensitivity in L02 cells. (C) Glucose production assay in L02 cells. (D) Protein expression of gluconeogenic enzymes (PEPCK and G6PC) in L02 cells. All of the values are expressed as the mean ± SD. *P < 0.05, ***P < 0.001 versus control cells; ##P < 0.01, ###P < 0.001 versus ET1-treated cells; &<0.05, &&&<0.001 versus the cells under basal conditions (without insulin). |
Hepatic Knockdown of ETAR Alleviates Mitochondrial Fragmentation and Dysfunction in the Livers of HFD-Fed Mice
Recently, mitochondrial dysfunction has been recognized as a potential driver of insulin resistance and the disorders of glucose and lipid metabolism during metabolic diseases.14 Thus, we evaluated the beneficial effects of hepatic knockdown of ETAR on mitochondrial functions in HFD-fed mice. We found a striking impairment of mitochondrial function occurred in the livers of HFD-fed mice, as indicated by a remarkable decrease in ΔΨm level and the consequent decline of ATP production (Figure 3A and B). Notably, ETAR knockdown improved these mitochondrial dysfunctions in the livers of HFD-fed mice (Figure 3A and B). In various tissues during diabetes, the mitochondrial network displays extensive fragmentation, which leads to mitochondrial dysfunction.16,17 TEM analysis showed that mitochondrial network was obviously fragmented in the livers of HFD-fed mice, which was dramatically ameliorated by ETAR knockdown (Figure 3C).
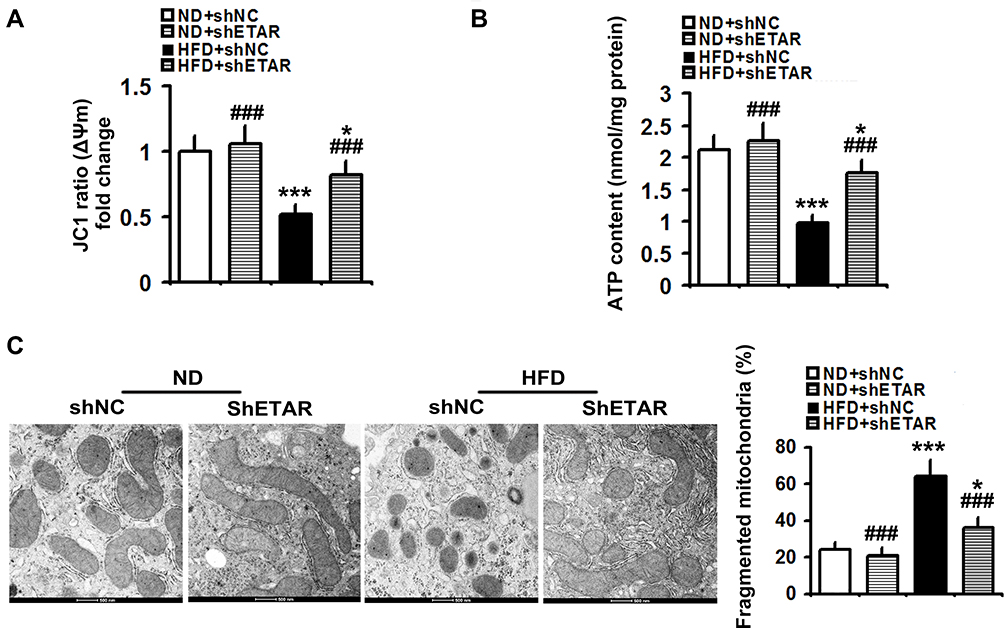 |
Figure 3 Hepatic knockdown of ETAR alleviates mitochondrial dysfunction and fragmentation in HFD-fed mouse livers (n=5). (A) Δψm level in mouse livers. (B) ATP content in mouse livers. (C) Mitochondrial fragmentation analysis by transmission electron microscopy (TEM) in mouse livers. All of the values are expressed as the mean ± SD. *P < 0.05, ***P < 0.001 versus the ND + shNC group; ###P < 0.001 versus the HFD + shNC group. |
Hepatic Knockdown of ETAR Inactivates p66Shc to Renew Mitochondrial Dynamics in the Livers of HFD-Fed Mice
Phosphorylation of p66Shc on serine 36 facilitates its translocation into mitochondrial intermembrane space to damage mitochondrial function.20,21 Both phosphorylated (Ser 36) and total p66Shc protein expressions were markedly augmented in the livers of HFD-fed mice (Figure 4A). Immunofluorescence staining showed that HFD observably promoted the colocalization of p-p66Shc (Ser 36) with TOM20 (mitochondrial marker) in the mouse livers (Figure 4B), indicating an enhanced mitochondrial translocation of p-p66Shc (Ser 36). Interestingly, ETAR knockdown notably lowered the protein expressions of phosphorylated p-p66Shc (Ser 36) and the mitochondrial translocation of p-p66Shc (Ser 36), while did not significantly influence total p66Shc levels, in the livers of HFD-fed mice (Figure 4A and B). Recent studies suggest that p66Shc is associated with mitochondrial dynamics disorders in diverse diseases.20,21 Mfn 1 and 2 are two key fusion protein localized to outer mitochondrial membrane (OMM) to mediate the latter fusion.15 DRP1 is a key pro-fission protein localized in the cytosol, which drives mitochondrial fission by recruiting to OMM to oligomerize and form Drp1 spiral structures.15 Thus, we determined the protein levels of these mitochondrial dynamics-modulating proteins to study whether mitochondrial dynamics disorders participate in the actions of ETAR knockdown. Observably, HFD caused a decrease in the protein expressions of Mfn1 and Mfn2 but increased the protein expressions of Drp1 in mouse livers (Figure 4C), suggesting a disruption in hepatic mitochondrial dynamics. Dramatically, ETAR knockdown recovered the protein expressions of Mfn1 and decreased the protein expressions of Drp1, while did not significantly influence the protein expressions of Mfn2 in the livers of HFD-fed mice (Figure 4C). These results suggested that Hepatic knockdown of ETAR might recover mitochondrial dynamics via enhancing mitochondrial fusion and interrupting mitochondrial fission.
 |
Figure 4 Hepatic knockdown of ETAR abates phosphorylation and mitochondrial translocation of p66Shc and restores mitochondrial dynamics in HFD-fed mouse livers. (A) Protein expression of phosphorylated (Ser 36) and total p66Shc in mouse livers, n=3. (B) The mitochondrial translocation of p-p66Shc (Ser 36) were determined by immunofluorescence staining in mouse livers, n=5. (C) Protein expression of mitochondrial dynamics-related proteins (Mfn1, Mfn2, Drp1 and TOM20) in mouse livers, n=3. All of the values are expressed as the mean ± SD. **P < 0.01, ***P < 0.001 versus the ND + shNC group; ##P < 0.01, ###P < 0.001 versus the HFD + shNC group. |
p66Shc Inactivation is Responsible for the Beneficial Effects of ETAR Knockdown on Mitochondrial Dynamics and Function in ET1-Treated Hepatocytes
To confirm the involvement of p66Shc in these above-mentioned regulatory effects of hepatic ETAR knockdown, L02 cells were co-infected with Ad-shETAR and Ad-p66Shc or infected with Ad-shp66Shc. Ad-p66Shc infection significantly augmented p66Shc and p-p66Shc protein levels in L02 cells infected with Ad-shETAR followed by ET1 treatment compared to that of controls (Figure 5A). ET1 treatment markedly interrupted mitochondrial dynamics evidenced by a decreased protein expression of Mfn1 and an increased protein expression of Drp1 in L02 cells (Figure 5A). Consequently, ET1 treatment largely augmented mitochondrial fragmentation in L02 cells (Figure 5B). Furthermore, ET1 treatment remarkably damaged the mitochondrial functions including ΔΨm and ATP production in L02 cells (Figure 5C and D). Dramatically, ETAR knockdown recovered the protein expression of these mitochondrial dynamics-modulating proteins to decrease mitochondrial fragmentation, thereby restoring these mitochondrial functions in ET1-treated L02 cells, which was notably abrogated by p66Shc overexpression (Figure 5A–D).
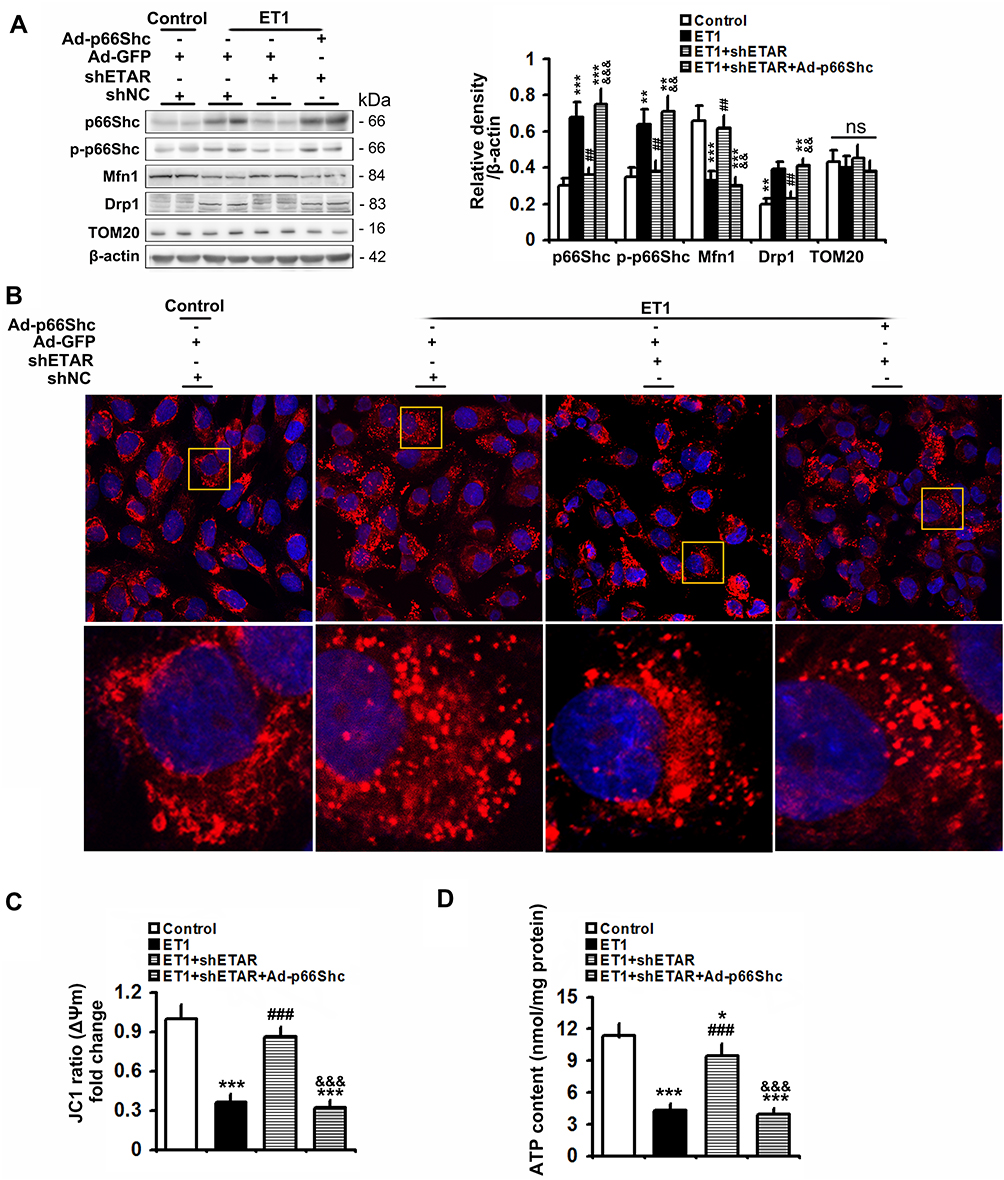 |
Figure 5 p66Shc overexpression abrogates the ameliorative effects of ETAR knockdown on mitochondrial dynamics disorders, fragmentation and dysfunctions in ET1-treated L02 cells. L02 cells were co-infected with Ad-shETAR and Ad-p66Shc followed by the treatment of 50nm ET1. (A) Protein expression of total p66Shc, p-p66Shc and mitochondrial dynamics-related proteins (Mfn1, Drp1 and TOM20) in L02 cells. (B) Mitochondrial fragmentation was determined by MitoTracker™ Red staining in L02 cells. (C) Δψm level in L02 cells. (D) ATP content in L02 cells. All of the values are expressed as the mean ± SD. *P < 0.05, **P < 0.01, ***P < 0.001 versus the control cells; ##P < 0.01, ###P < 0.001 versus the ET1-treated cells; &&<0.01, &&&<0.001 versus the cells treated with ET1 and shETAR. |
Ad-shp66Shc significantly reduced p66Shc and p-p66Sh protein levels by 75% and 66%, respectively, in ET1-treated L02 cells compared to controls (Figure 6A). Similar to the results of ETAR knockdown in cells, Ad-shp66Shc infection dramatically restored ET1-induced impairment of mitochondrial dynamics to diminish mitochondrial fragmentation, thereby renewing mitochondrial functions in L02 cells (Figure 6).
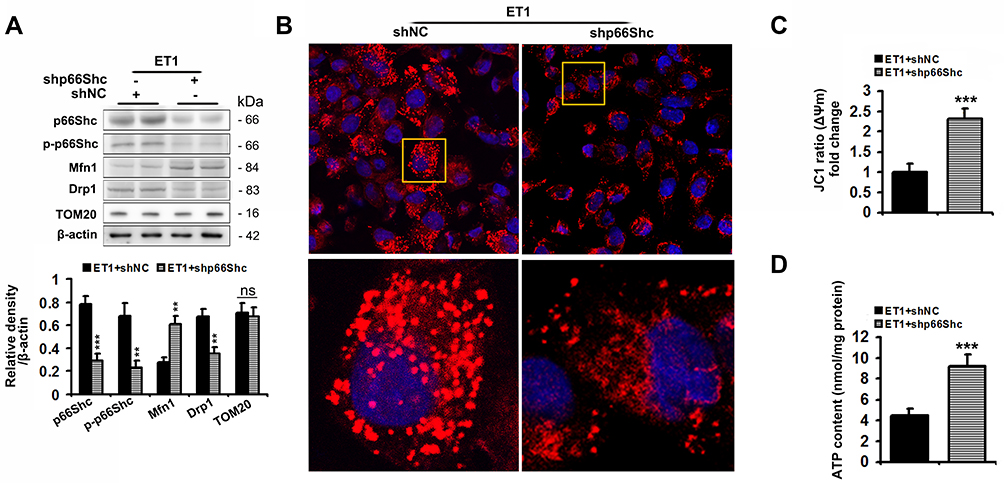 |
Figure 6 p66Shc knockdown alleviates the impairments of mitochondrial dynamics and functions, and mitochondrial fragmentation in ET1-treated L02 cells. L02 cells were infected with Ad-shp66Shc followed by the treatment of 50nm ET1. (A) Protein expression of total p66Shc, p-p66Shcand mitochondrial dynamics-related proteins (Mfn1, Drp1 and TOM20) in L02 cells. (B) Mitochondrial fragmentation was determined by MitoTracker™ Red staining in L02 cells. (C) Δψm level in L02 cells. (D) ATP content in L02 cells. All of the values are expressed as the mean ± SD. **P < 0.01, ***P < 0.001 versus the ET1-treated cells. |
These results indicated that ETAR knockdown improved mitochondrial dynamics and functions via inactivating p66Shc in ET1-treated L02 cells.
PKCδ Inhibition is Involved in ETAR Knockdown-Mediated Inactivation of p66Shc in HFD-Fed Mouse Livers and ET1-Treated Hepatocytes
PKCδ belongs to novel PKC isoforms, is a pivotal target molecule of ET1/ETR signaling, and has been reported to phosphorylate p66Shc and facilitate its mitochondrial translocation.33–35 Moreover, substantial evidence demonstrates PKCδ acts as an important regulator of mitochondrial functions, insulin resistance and metabolism abnormalities.36,37 Thus, PKCδ may be a mechanistic link between ET1/ETAR signaling and p66Shc-mediated mitochondrial dysfunction. We investigated whether PKCδ inhibition was involved in ETAR knockdown-mediated blocking phosphorylation and mitochondrial translocation of p66Shc in the livers of HFD-fed mice. We found that HFD largely promoted the membrane translocation of PKCδ, which was a marker for PKCδ activation, in mouse livers (Figure 7A). Then, HFD markedly enhanced the phosphorylation of PKCδ at Thr505, which was required for its activation in mouse livers (Figure 7A). Interestingly, ETAR knockdown observably repressed PKCδ activation, as evidenced by diminished membrane translocation and phosphorylation of PKCδ in HFD-fed mouse livers (Figure 7A). Co-IP analysis revealed that HFD significantly strengthened the interaction between p-PKCδ and p66Shc, which was markedly abated by ETAR knockdown, in mouse livers (Figure 7B), indicating a potential role of PKCδ inhibition in ETAR knockdown-mediated p66Shc inactivation.
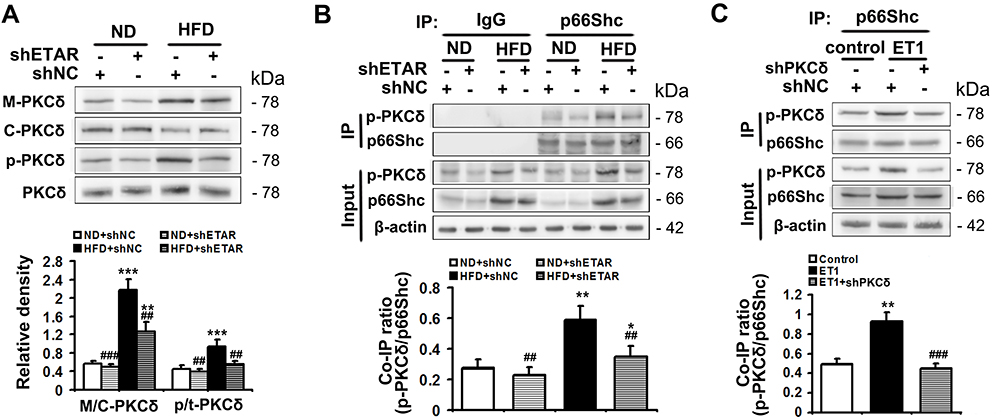 |
Figure 7 ETAR knockdown inhibits PKCδ to inactivate p66Shc in HFD-fed mouse livers and ET1-treated L02 cells. (A) Protein expression of membrane PKCδ and p-PKCδ (Thr505) in mouse livers, n=3. (B) The interaction between p-PKCδ and p66Shc in mouse livers, n=3. L02 cells were infected with Ad-shPKCδ followed by the treatment of 50nm ET1. (C) The interaction between p-PKCδ and p66Shc in L02 cells. All of the values are expressed as the mean ± SD. *P < 0.05, **P < 0.01, ***P < 0.001 versus the ND + shNC group or control cells; ##P < 0.01, ###P < 0.001 versus the HFD + shNC group or ET1-treated cells. |
To confirm the participation of PKCδ in the regulation of p66Shc, L02 cells were infected with Ad-shPKCδ followed by ET1 treatment. ET1 treatment notably heightened p-PKCδ and p-p66Shc levels (Supplementary Figure 3) and thereby elevated the co-IP of p-PKCδ and p66Shc (Figure 7C). Similar to the results of ETAR knockdown, Ad-shPKCδ dramatically decreased the protein expression of PKCδ, p-PKCδ and p-p66Shc in ET1-treated L02 cells (Supplementary Figure 3). Consequently, Ad-shPKCδ markedly suppressed the interaction between of p-PKCδ and p66Shc in ET1-treated L02 cells (Figure 7C).
Our findings indicated that ETAR knockdown inactivated p66Shc by suppressing PKCδ in HFD-fed mouse livers and ET1-treated L02 cells.
Hepatic Knockdown of ETAR Mitigates Mitochondria-Derived Oxidative Stress and Related Liver Injuries in HFD-Fed Mice
Mitochondrial dysfunction disrupts redox balance in mitochondria including excessive generation of ROS and impaired antioxidant system, resulting in cellular oxidative stress.38 Thus, we investigated whether ETAR knockdown influences oxidative stress in the livers of HFD-fed mice. We found that HFD triggered a pronounced oxidative stress, as evidenced by a remarkable elevation of ROS in mouse livers (Figure 8A). Moreover, the activity of MnSOD, a main mitochondrial antioxidant enzyme, was notably declined in the livers of HFD-fed mice (Figure 8B). Noteworthily, ETAR knockdown attenuated the severe oxidative stress by decreasing the levels of ROS and increasing MnSOD activity in HFD-fed mouse livers (Figure 8A and B). Furthermore, mitochondrial dysfunction contributes to the pathogenesis of inflammation, which drives insulin resistance.39 Then, we investigate whether ETAR knockdown affects inflammation in the livers of HFD-fed mice. In this study, HFD significantly strengthened the expression of inflammation-related genes including TNFα, IL-1β and IL-6 in mouse livers (Figure 8C). ETAR knockdown remarkably lowered the expression of these inflammation-related genes in the livers of HFD-fed mice (Figure 8C). HE staining also confirmed the occurrence of inflammation in HFD-fed mouse livers, which was effectively reversed by ETAR knockdown (Figure 8G). Moreover, mitochondrial dysfunction interrupts fatty acid β-oxidation, which leads to accumulation of TG, promoting the development of insulin resistance.40 Thus, we further investigate the regulation of ETAR knockdown on fatty acid β-oxidation in the livers of HFD-fed mice. HFD notably diminished the activity of CPT1, a rate-limiting enzyme of mitochondrial fatty acids transport for β-oxidation in mouse livers (Figure 8D). Moreover, the level of plasma β-OHB, a marker for hepatic fatty acid oxidation, was noteworthily decreased in HFD-fed mice (Figure 8E). Remarkably, ETAR knockdown recovered fatty acid oxidation in the livers of HFD-fed mice (Figure 8D and E). HFD-fed mice exhibited a significant liver injury including hepatocyte hypertrophy, cytoplasmic vacuolation, lipid accumulation and inflammation and elevated level of serum ALT (Figure 8F and G). ETAR knockdown effectively improved these liver injuries in HFD-fed mice (Figure 8F and G).
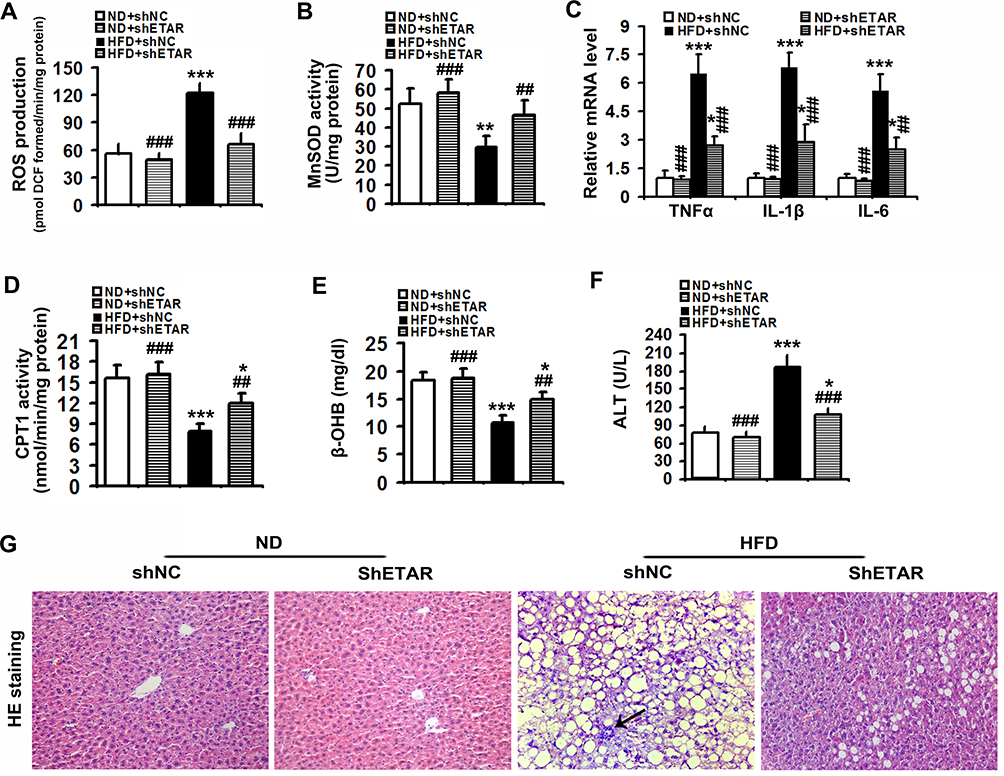 |
Figure 8 Hepatic knockdown of ETAR reduces mitochondria-derived oxidative stress and related injuries in HFD-fed mouse livers. (A) ROS production in mouse livers, n=5. (B) MnSOD activity in mouse livers, n=5. (C) Inflammation-related gene expression in mouse livers, n=3. (D) CPT1 activity in mouse livers, n=5. (E) Plasma β-OHB concentration in mice, n=5. (F) Serum ALT levels in mice, n=5. (G) H&E staining of liver sections in mice, n=5. 200 × magnification. Black arrows indicate inflammatory cells. All of the values are expressed as the mean ± SD. *P < 0.05, **P < 0.01, ***P < 0.001 versus the ND + shNC group; ##P < 0.01, ###P < 0.001 versus the HFD + shNC group. |
To confirm that ETAR knockdown attenuates oxidative stress, inflammation and restores fatty acid oxidation by suppressing p66Shc-mediated mitochondrial dysfunction, L02 cells were co-infected with Ad-shETAR and Ad-p66Shc followed by ET1 treatment. ET1 treatment induced a significant elevation of mitochondria-derived ROS and inflammation-related gene expressions and a decline of fatty acid oxidation in L02 cells (Figure 9). ETAR knockdown dramatically ameliorated oxidative stress, inflammation and fatty acid β-oxidation disorders in ET1-treated cells, which was markedly abrogated by Ad-p66Shc infection (Figure 9).
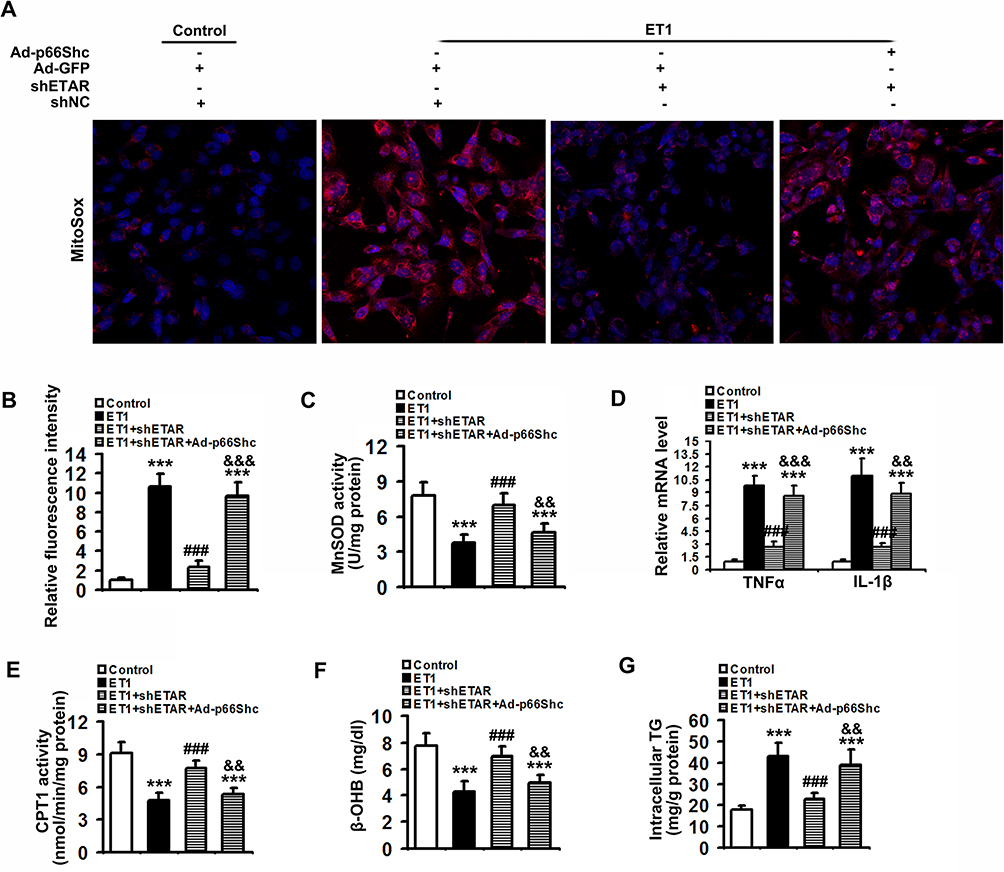 |
Figure 9 ETAR knockdown lessens mitochondria-derived oxidative stress and related injuries in ET1-treated L02 cells. L02 cells were co-infected with Ad-shETAR and Ad-p66Shc followed by the treatment of 50nm ET1. (A) and (B) Analysis of mitochondrial ROS production by MitoSox staining in L02 cells. (C) MnSOD activity in L02 cells. (D) Inflammation-related genes expression in L02 cells. (E) CPT1 activity in L02 cells. (F) β-OHB concentration of culture medium in L02 cells. (G) TG content in L02 cells. All of the values are expressed as the mean ± SD. ***P < 0.001 versus the control cells; ###P < 0.001 versus the ET1-treated cells; &&<0.01, &&&<0.001 versus the cells treated with ET1 and shETAR. |
Taken together, our results suggested that ETAR knockdown abated oxidative stress and inflammation, and renewed fatty acid oxidation by repressing p66Shc-mediated mitochondrial dysfunction in HFD-fed mouse livers and ET1-treated L02 cells.
Discussion
Emerging evidence from animal studies and clinical trials indicates a promising therapeutic potential of systemic ET1/ETAR blockage in diabetes and its complications.8–12 However, the beneficial effects as well as the mechanistic targets of hepatic ET1/ETAR signaling inhibition on the pathology of metabolic diseases remain unclear. Clarifying them helps to encourage the therapeutic applications of ET1/ETAR blockage in metabolic diseases. Here, we provided in vivo and in vitro evidence to reveal that liver-selective knockdown of ETAR effectively ameliorated hepatic insulin resistance and hyperglycemia by alleviating p66Shc-mediated mitochondrial fragmentation and consequent oxidative stress-related disorders in HFD-fed mice, which was mediated by inhibiting PKCδ. This study provided new mechanistic insights into hepatic ET1/ETAR signaling inhibition-mediated beneficial effects on diabetes pathology and suggested that hepatic knockdown of ETAR may be a promising therapeutic strategy for metabolic diseases.
As a primary metabolic organ, liver plays a central role in maintaining systemic glucose and lipid homeostasis. In this study, the impairments of glucose and insulin tolerance, as well as hyperglycemia, were markedly ameliorated by hepatic knockdown of ETAR in HFD-fed mice, indicating that hepatic ETAR knockdown improves systemic glucose metabolism and insulin sensitivity. Furthermore, our data showed that hepatic knockdown of ETAR significantly attenuated gluconeogenesis and lowered hepatic glucose production in vitro and in vivo. It has been well established that enhanced hepatic gluconeogenesis plays a crucial role in augmenting hepatic glucose production and consequent hyperglycemia, leading to systemic insulin resistance and metabolism abnormalities during diabetes.13,41 Nowadays, targeting hepatic glucose metabolism, gluconeogenesis in particular, has been identified as an appealing therapeutic strategy for metabolic diseases.13 Thus, diminishing gluconeogenesis-mediated hepatic glucose production might be a potential mechanism for hepatic ETAR knockdown-mediated improvement of hyperglycemia and systemic insulin resistance. Moreover, hepatic steatosis, as well as elevated serum TG, was notably reversed by hepatic knockdown of ETAR in HFD-fed mice. Hepatic steatosis and hyperlipemia increase the supply of gluconeogenic substrate and the generation of mitochondrial acetyl-CoA that is an activator of gluconeogenic enzyme pyruvate carboxylase (PC), promoting hepatic gluconeogenesis and hyperglycemia.42 In addition, our data showed that hepatic knockdown of ETAR dramatically restored insulin signaling in the livers of HFD-fed mice. It has been well established that insulin-mediated inhibition of gluconeogenesis is impaired and meanwhile gluconeogenic substrate supply is augmented under insulin resistance conditions, which strengthens hepatic glucose production and hyperglycemia.41,42 Taken together, hepatic ETAR knockdown may alleviate hyperglycemia by mitigating hepatic insulin resistance and gluconeogenesis-mediated glucose production in HFD-fed mice.
A wide range of physiological and pathological stimuli, such as nutrient excess, ectopic fat depots, senescence, obesity and diabetes, induce the disruption of mitochondrial dynamics, controlling mitochondrial morphology.15–17 In this study, extensive mitochondrial fragmentation and dysfunctions were occurred in the livers of HFD-fed mice and ET1-treated L02 cells, which was effectively attenuated by ETAR knockdown. In recent years, mitochondrial fragmentation, which is mainly caused by excessive mitochondrial fission and/or inefficient mitochondrial fusion, has been considered as a hallmark of mitochondrial dysfunction, involving in the pathogenesis of metabolic diseases.16,17 Thus, our findings indicated that inhibiting mitochondrial fragmentation-mediated dysfunctions played an important role in the beneficial effects of hepatic ETAR knockdown on metabolic disorders. The deficiency of mitochondrial fusion proteins in the liver, such as Mfn1, Mfn2, and optic atrophy 1 (OPA1), causing mitochondrial fragmentation, has been shown to promote glucose intolerance, hepatic gluconeogenesis and insulin resistance.43,44 Whereas mitochondrial fission proteins including DRP1, fission protein 1 (Fis1) and mitochondrial fission factor (Mff), which are elevated during diabetes, facilitate mitochondrial fragmentation to provokes mtROS production and insulin resistance.16,45 These studies highlight that the disruption of mitochondrial dynamics is crucial for mitochondrial fragmentation and dysfunction, contributing to metabolism abnormalities. In this study, the diminished protein expression of Mfn1 and augmented protein expression of Drp1 were effectively restored by ETAR knockdown in the livers of HFD-fed mice and ET1-treated L02 cells. These findings suggested that hepatic ETAR knockdown abated mitochondrial fragmentation partly by renewing mitochondrial dynamics. Then, we found that enhanced p66Shc activation was largely blunted by ETAR knockdown in the livers of HFD-fed mice and ET1-treated L02 cells. p66Shc has been implicated in damaging many aspects of mitochondrial function, such as ROS production, mitochondrial permeability transition, Ca2+ response, pro-apoptotic programme and bioenergetics.20,21,46 Recently, p66Shc has been demonstrated to be involved in driving the disruption of mitochondrial dynamics by augmenting Fis1 expression and directly interacts with it and lowering Mfn1 and Mfn2 expression, leading to mitochondrial fragmentation.20,21 Another pathway by which p66Shc disturbs mitochondrial dynamics is that p66Shc elevates mtROS production, which can exacerbate the disruption of mitochondrial dynamics.20,21,46 Furthermore, our results showed that p66Shc overexpression dramatically abrogated ETAR knockdown-recovered mitochondrial dynamics and functions, while p66Shc knockdown mimics the ameliorative effects of ETAR knockdown on mitochondrial dynamics and functions in ET1-treated L02 cells. Collectively, these findings indicated an important role of p66Shc inactivation in hepatic ETAR knockdown-mediated improvements of mitochondrial dynamics and functions.
PKCδ is a crucial target of ET1/ETR signaling mediating various physiopathological processes, such as glucose transport and glycolytic switch.34,47,48 Substantial evidence reveals that PKCδ, whose affinity for diacylglycerol (DAG) is twofold greater than conventional PKC isoforms’, has been well demonstrated to drive insulin resistance, gluconeogenesis, steatosis in the livers of diabetic animals.49,50 Especially, elevated expression of hepatic PKCδ, but not other novel PKCs including PKC ε, η, and θ, is positively related to metabolic abnormalities including hyperglycemia and hyperlipemia in obese diabetic patients.51 Thus, PKCδ is considered as a crucial target of ET1/ETR signaling for the pathology of metabolic diseases. In the present study, ETAR knockdown repressed HFD-induced PKCδ activation in mouse livers, suggesting a potential role of PKCδ inactivation in ETAR knockdown-mediated actions. Furthermore, ETAR knockdown largely restrained the interaction of PKCδ and p66Shc in HFD-fed mouse livers. Accumulating evidence indicates that PKCδ promotes the phosphorylation and mitochondrial translocation of p66Shc, leading to mitochondrial dysfunction.34,35 Our in vitro data also confirmed that PKCδ knockdown effectively abolished ET1-induced PKCδ and p66Shc activation and their interaction in L02 cells, which is similar to the action of ETAR knockdown. Thus, our findings indicated that inhibiting PKCδ was responsible for hepatic ETAR knockdown-mediated p66Shc inactivation in the livers of HFD-fed mice.
Oxidative stress, a primary consequence resulting from mitochondrial dysfunction, is a key contributor to the pathogenesis of metabolic diseases.38 During mitochondrial dysfunction, superfluous mtROS is generated from: 1) dysregulated electron transport chain (ETC), such as uncoupling of complexes I and III; 2) dysfunctional mitochondria-localized redox proteins (enzymes), such as p66shc, NADPH oxidase 4 (NOX4) and monoamine oxidase (MAO); 3) compromised mitochondrial antioxidant systems, such as SOD2 and peroxiredoxin/thioredoxin (Prx/Trx).38 In this study, our results showed that ETAR knockdown restored ΔΨm level and ATP production in HFD-fed mouse livers and ET-1treated L02 cells, indicating an improvement of ETC disorders. Moreover, the enhanced p66Shc activation was largely abated by ETAR knockdown in vivo and in vitro, indicating an improvement of dysregulated mitochondrial redox proteins. In addition, ETAR knockdown markedly recovered the activity of mitochondrial antioxidant enzyme SOD2. Thus, our findings indicated that hepatic ETAR knockdown attenuated mitochondria-derived oxidative stress through recovering above mentioned three pathways in the livers of HFD-fed mice. Oxidative stress can stimulate inflammatory response by irritating stress-activated kinases [eg c-Jun amino-terminal kinase (JNK)] and activating inflammatory transcription factors [eg nuclear factor-κB (NF-κB).52 Conversely, inflammatory cytokines and chemokines also trigger oxidative stress.52 In the present study, inflammatory response was notably alleviated by ETAR knockdown in HFD-fed mouse livers and ET1-treated L02 cells. It has been well established that chronic low-grade inflammation plays a pivotal role in the development and progression of metabolic diseases.53 Thus, hepatic ETAR knockdown may ameliorate metabolic disorders via restraining oxidative stress-inflammatory signaling. Compromised FFA oxidation commonly coexists with oxidative stress in livers under metabolic diseases, such as non-alcoholic fatty liver disease (NAFLD) and diabetes.54 It has been proposed that fatty acid β-oxidation is responsible for enhancing redox homeostasis by sustaining the tricarboxylic acid (TCA) cycle to increase the regeneration of NAPDH.55 Conversely, some downstream factors of oxidative stress including poly (ADP-ribose) polymerase 1 (PARP1) and p53 are documented to restrain fatty acid β-oxidation.56,57 In this study, the compromised fatty acid oxidation was markedly recovered by ETAR knockdown in HFD-fed mouse livers and ET1-treated L02 cells. Inhibition of FFA oxidation, which leads to the accumulation of lipid intermediates including DAG, long-chain fatty acyl-CoA and ceramide, has been linked to insulin resistance.58 Thus, our results suggested that restoring fatty acid oxidation participated in ETAR knockdown-mediated actions. In addition, our in vitro results showed that p66Shc overexpression abrogated the ameliorative effects of ETAR knockdown on oxidative stress, inflammation and fatty acid β-oxidation disorders in cells treated with ET1. Taken together, our findings indicated that hepatic ETAR knockdown improved metabolism abnormalities including insulin resistance and hyperglycemia via suppressing mitochondrial dysfunction-mediated oxidative stress and related disorders including inflammation and compromised fatty acid β-oxidation.
Conclusion
In conclusion, this study defined an ameliorative role of hepatic ETAR knockdown in HFD-induced metabolism abnormalities by mitigating p66Shc-mediated mitochondrial fragmentation and consequent oxidative stress and related disorders including inflammation and compromised fatty acid β-oxidation (Figure 10) and indicated hepatic ET1/ETAR signaling as a promising therapeutic target for metabolic diseases.
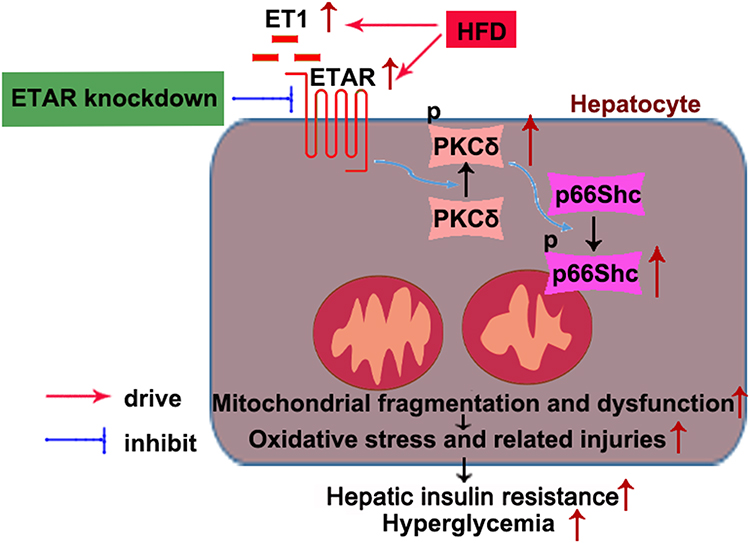 |
Figure 10 Schematic diagram representing an ameliorative role of hepatic ETAR knockdown in HFD-induced metabolism abnormalities in mice. |
Acknowledgments
Li Feng, Songhua Wang, and Feng Chen are co-first authors for this study.
Funding
This work is supported by the National Natural Science Foundation of China (81570531); Postgraduate Research & Practice Innovation Program of Jiangsu Province (KYCX20_2307, KYCX20_2293).
Disclosure
The authors report no conflicts of interest in this work.
References
1. Enevoldsen FC, Sahana J, Wehland M, Grimm D, Infanger M, Krüger M. Endothelin receptor antagonists: status quo and future perspectives for targeted therapy. J Clin Med. 2020;9(3):824. doi:10.3390/jcm9030824
2. Barton M, Yanagisawa M. Endothelin: 30 years from discovery to therapy. Hypertension. 2019;74(6):1232–1265. doi:10.1161/HYPERTENSIONAHA.119.12105
3. Jain A, Coffey C, Mehrotra V, Flammer J. Endothelin-1 traps as a potential therapeutic tool: from diabetes to beyond? Drug Discov Today. 2019;24(9):1937–1942. doi:10.1016/j.drudis.2019.07.008
4. Jenkins HN, Rivera-Gonzalez O, Gibert Y, et al. Endothelin-1 in the pathophysiology of obesity and insulin resistance. Obes Rev. 2020;21(12):e13086. doi:10.1111/obr.13086
5. Okamoto T, Koda M, Miyoshi K, et al. Antifibrotic effects of ambrisentan, an endothelin-A receptor antagonist, in a non-alcoholic steatohepatitis mouse model. World J Hepatol. 2016;8(22):933–941. doi:10.4254/wjh.v8.i22.933
6. Ahlborg G, Shemyakin A, Böhm F, Gonon A, Pernow J. Dual endothelin receptor blockade acutely improves insulin sensitivity in obese patients with insulin resistance and coronary artery disease. Diabetes Care. 2007;30(3):591–596. doi:10.2337/dc06-1978
7. Polak J, Punjabi NM, Shimoda LA. Blockade of endothelin-1 receptor type B ameliorates glucose intolerance and insulin resistance in a mouse model of obstructive sleep apnea. Front Endocrinol (Lausanne). 2018;9:280. doi:10.3389/fendo.2018.00280
8. Berthiaume N, Carlson CJ, Rondinone CM, Zinker BA. Endothelin antagonism improves hepatic insulin sensitivity associated with insulin signaling in Zucker fatty rats. Metabolism. 2005;54(11):1515–1523. doi:10.1016/j.metabol.2005.05.019
9. Ho PC, Tsui YC, Lin YW, Persaud SD, Wei LN. Endothelin-1 promotes cytoplasmic accumulation of RIP140 through a ET(A)-PLCβ-PKCε pathway. Mol Cell Endocrinol. 2012;351(2):176–183. doi:10.1016/j.mce.2011.12.003
10. Lteif A, Vaishnava P, Baron AD, Mather KJ. Endothelin limits insulin action in obese/insulin-resistant humans. Diabetes. 2007;56(3):728–734. doi:10.2337/db06-1406
11. Horinouchi T, Hoshi A, Harada T, et al. Endothelin-1 suppresses insulin-stimulated Akt phosphorylation and glucose uptake via GPCR kinase 2 in skeletal muscle cells. Br J Pharmacol. 2016;173(6):1018–1032. doi:10.1111/bph.13406
12. Cui TX, Iwai M, Hamai M, Shimazu T. Receptor subtype mediating the action of circulating endothelin on glucose metabolism and hemodynamics in perfused rat liver. Regul Pept. 1999;83(2–3):117–122. doi:10.1016/s0167-0115(99)00058-0
13. Rines AK, Sharabi K, Tavares CD, Puigserver P. Targeting hepatic glucose metabolism in the treatment of type 2 diabetes. Nat Rev Drug Discov. 2016;15(11):786–804. doi:10.1038/nrd.2016.151
14. Prasun P. Mitochondrial dysfunction in metabolic syndrome. Biochim Biophys Acta Mol Basis Dis. 2020;1866(10):165838. doi:10.1016/j.bbadis.2020.165838
15. Gerald W, Dorn II. Evolving concepts of mitochondrial dynamics. Annu Rev Physiol. 2019;81:1–17. doi:10.1146/annurev-physiol-020518-114358
16. Hammerschmidt P, Ostkotte D, Nolte H, et al. CerS6-derived sphingolipids interact with Mff and promote mitochondrial fragmentation in obesity. Cell. 2019;177(6):1536–1552.e23. doi:10.1016/j.cell.2019.05.008
17. Kulkarni SS, Joffraud M, Boutant M, et al. Mfn1 deficiency in the liver protects against diet-induced insulin resistance and enhances the hypoglycemic effect of metformin. Diabetes. 2016;65(12):3552–3560. doi:10.2337/db15-1725
18. Chaphalkar RM, Stankowska DL, He S, et al. Endothelin-1 mediated decrease in mitochondrial gene expression and bioenergetics contribute to neurodegeneration of retinal ganglion cells. Sci Rep. 2020;10(1):3571. doi:10.1038/s41598-020-60558-6
19. Chen C, Gao JL, Liu MY, et al. Mitochondrial fission inhibitors suppress endothelin-1-induced artery constriction. Cell Physiol Biochem. 2017;42(5):1802–1811. doi:10.1159/000479536
20. Zhan M, Usman I, Yu J, et al. Perturbations in mitochondrial dynamics by p66Shc lead to renal tubular oxidative injury in human diabetic nephropathy. Clin Sci (Lond). 2018;132(12):1297–1314. doi:10.1042/CS20180005
21. Pérez H, Finocchietto PV, Alippe Y, et al. p66Shc inactivation modifies RNS production, regulates Sirt3 activity, and improves mitochondrial homeostasis, delaying the aging process in mouse brain. Oxid Med Cell Longev. 2018;2018:8561892. doi:10.1155/2018/8561892
22. Kumar S, Kim YR, Vikram A, et al. Sirtuin1-regulated lysine acetylation of p66Shc governs diabetes-induced vascular oxidative stress and endothelial dysfunction. Proc Natl Acad Sci USA. 2017;114(7):1714–1719. doi:10.1073/pnas.1614112114
23. Yi H, Xu D, Wu X, Xu F, Lin L, Zhou HP. Isosteviol protects free fatty acid- and high fat diet-induced hepatic injury via modulating PKC-β/p66Shc/ROS and endoplasmic reticulum stress pathways. Antioxid Redox Signal. 2019;30(17):1949–1968. doi:10.1089/ars.2018.7521
24. Zhang ZF, Fan SH, Zheng YL, et al. Troxerutin improves hepatic lipid homeostasis by restoring NAD(+)-depletion-mediated dysfunction of lipin 1 signaling in high-fat diet-treated mice. Biochem Pharmacol. 2014;91(1):74–86. doi:10.1016/j.bcp.2014.07.002
25. Shemyakin A, Salehzadeh F, Esteves Duque-Guimaraes D, et al. Endothelin-1 reduces glucose uptake in human skeletal muscle in vivo and in vitro. Diabetes. 2011;60(8):2061–2067. doi:10.2337/db10-1281
26. Chen F, Feng L, Zheng YL, et al. 2, 2ʹ, 4, 4ʹ-tetrabromodiphenyl ether (BDE-47) induces mitochondrial dysfunction and related liver injury via eliciting miR-34a-5p-mediated mitophagy impairment. Environ Pollut. 2020;258:113693. doi:10.1016/j.envpol.2019.113693
27. Zhang ZF, Zhang YQ, Fan SH, et al. Troxerutin protects against 2,2ʹ,4,4ʹ-tetrabromodiphenyl ether (BDE-47)-induced liver inflammation by attenuating oxidative stress-mediated NAD+-depletion. J Hazard Mater. 2015;283:98–109. doi:10.1016/j.jhazmat.2014.09.012
28. Sun L, Marin de Evsikova C, Bian K, et al. Programming and regulation of metabolic homeostasis by HDAC11. EBioMedicine. 2018;33:157–168. doi:10.1016/j.ebiom.2018.06.025
29. Reis LMD, Adamoski D, Ornitz Oliveira Souza R, et al. Dual inhibition of glutaminase and carnitine palmitoyltransferase decreases growth and migration of glutaminase inhibition-resistant triple-negative breast cancer cells. J Biol Chem. 2019;294(24):9342–9357. doi:10.1074/jbc.RA119.008180
30. Petersen MC, Madiraju AK, Gassaway BM, et al. Insulin receptor Thr1160 phosphorylation mediates lipid-induced hepatic insulin resistance. J Clin Invest. 2016;126(11):4361–4371. doi:10.1172/JCI86013
31. Liu X, Fagotto F. A method to separate nuclear, cytosolic, and membrane-associated signaling molecules in cultured cells. Sci Signal. 2011;4(203):pl2. doi:10.1126/scisignal.2002373
32. Schneider JG, Tilly N, Hierl T, et al. Elevated plasma endothelin-1 levels in diabetes mellitus. Am J Hypertens. 2002;15(11):967–972. doi:10.1016/s0895-7061(02)03060-1
33. Rafikov R, Kumar S, Aggarwal S, et al. Endothelin-1 stimulates catalase activity through the PKCδ-mediated phosphorylation of serine 167. Free Radic Biol Med. 2014;67:255–264. doi:10.1016/j.freeradbiomed.2013.10.814
34. Zhang M, Li Y, Tang JJ, et al. Cigarette smoke induces mitochondrial dysfunction via PKCδ-p66Shc signaling pathway in human bronchial epithelial cells. Eur Respir J. 2018;52:PA4262. doi:10.1183/13993003.congress-2018.PA4262
35. Song P, Yang S, Xiao L, et al. PKCδ promotes high glucose induced renal tubular oxidative damage via regulating activation and translocation of p66Shc. Oxid Med Cell Longev. 2014;2014:746531. doi:10.1155/2014/746531
36. Li M, Vienberg SG, Bezy O, O’Neill BT, Kahn CR. Role of PKCδ in insulin sensitivity and skeletal muscle metabolism. Diabetes. 2015;64(12):4023–4032. doi:10.2337/db14-1891
37. Shabrova E, Hoyos B, Vinogradov V, et al. Retinol as a cofactor for PKCδ-mediated impairment of insulin sensitivity in a mouse model of diet-induced obesity. FASEB J. 2016;30(3):1339–1355. doi:10.1096/fj.15-281543
38. Bhatti JS, Bhatti GK, Reddy PH. Mitochondrial dysfunction and oxidative stress in metabolic disorders - A step towards mitochondria based therapeutic strategies. Biochim Biophys Acta Mol Basis Dis. 2017;1863(5):1066–1077. doi:10.1016/j.bbadis.2016.11.010
39. Geto Z, Molla MD, Challa F, Belay Y, Getahun T. Mitochondrial dynamic dysfunction as a main triggering factor for inflammation associated chronic non-communicable diseases. J Inflamm Res. 2020;13:97–107. doi:10.2147/JIR.S232009
40. Vankoningsloo S, Piens M, Lecocq C, et al. Mitochondrial dysfunction induces triglyceride accumulation in 3T3-L1 cells: role of fatty acid beta-oxidation and glucose. J Lipid Res. 2005;46(6):1133–1149. doi:10.1194/jlr.M400464-JLR200
41. Guo W, Li D, You Y, et al. Cystathionine γ-lyase deficiency aggravates obesity-related insulin resistance via FoxO1-dependent hepatic gluconeogenesis. FASEB J. 2019;33(3):4212–4224. doi:10.1096/fj.201801894R
42. Samuel VT, Shulman GI. Nonalcoholic fatty liver disease as a nexus of metabolic and hepatic diseases. Cell Metab. 2018;27(1):22–41. doi:10.1016/j.cmet.2017.08.002
43. Sebastián D, Hernández-Alvarez MI, Segalés J, et al. Mitofusin 2 (Mfn2) links mitochondrial and endoplasmic reticulum function with insulin signaling and is essential for normal glucose homeostasis. Proc Natl Acad Sci USA. 2012;109(14):5523–5528. doi:10.1073/pnas.1108220109
44. Mollica MP, Mattace RG, Cavaliere G, et al. Butyrate regulates liver mitochondrial function, efficiency, and dynamics in insulin-resistant obese mice. Diabetes. 2017;66(5):1405–1418. doi:10.2337/db16-0924
45. Lin HY, Weng SW, Chang YH, et al. The causal role of mitochondrial dynamics in regulating insulin resistance in diabetes: link through mitochondrial reactive oxygen species. Oxid Med Cell Longev. 2018;2018:7514383. doi:10.1155/2018/7514383
46. Giorgio M, Migliaccio E, Orsini F, et al. Electron transfer between cytochrome c and p66Shc generates reactive oxygen species that trigger mitochondrial apoptosis. Cell. 2005;122(2):221–233. doi:10.1016/j.cell.2005.05.011
47. Fong JC, Kao YS, Tsai HY, Chiou YY, Chiou GY. Synergistic effect of endothelin-1 and cyclic AMP on glucose transport in 3T3-L1 adipocytes. Cell Signal. 2004;16(7):811–821. doi:10.1016/j.cellsig.2003.12.004
48. Sun X, Kumar S, Sharma S, et al. Endothelin-1 induces a glycolytic switch in pulmonary arterial endothelial cells via the mitochondrial translocation of endothelial nitric oxide synthase. Am J Respir Cell Mol Biol. 2014;50(6):1084–1095. doi:10.1165/rcmb.2013-0187OC
49. Jayasinghe SU, Tankeu AT, Amati F. Reassessing the role of diacylglycerols in insulin resistance. Trends Endocrinol Metab. 2019;30(9):618–635. doi:10.1016/j.tem.2019.06.005
50. Kolczynska K, Loza-Valdes A, Hawro I, Sumara G. Diacylglycerol-evoked activation of PKC and PKD isoforms in regulation of glucose and lipid metabolism: a review. Lipids Health Dis. 2020;19(1):113. doi:10.1186/s12944-020-01286-8
51. Bezy O, Tran TT, Pihlajamäki J, et al. PKCδ regulates hepatic insulin sensitivity and hepatosteatosis in mice and humans. J Clin Invest. 2011;121(6):2504–2517. doi:10.1172/JCI46045
52. Jha JC, Ho F, Dan C, Jandeleit-Dahm K. A causal link between oxidative stress and inflammation in cardiovascular and renal complications of diabetes. Clin Sci (Lond). 2018;132(16):1811–1836. doi:10.1042/CS20171459
53. Saltiel AR, Olefsky JM. Inflammatory mechanisms linking obesity and metabolic disease. J Clin Invest. 2017;127(1):1–4. doi:10.1172/JCI92035
54. Kim MH, Seong JB, Huh JW, Bae YC, Lee DS, Lee D-S. Peroxiredoxin 5 ameliorates obesity-induced non-alcoholic fatty liver disease through the regulation of oxidative stress and AMP-activated protein kinase signaling. Redox Biol. 2020;28:101315. doi:10.1016/j.redox.2019.101315
55. Kalucka J, Bierhansl L, Conchinha NV, et al. Quiescent endothelial cells upregulate fatty acid β-oxidation for vasculoprotection via redox homeostasis. Cell Metab. 2018;28(6):881–894.e13. doi:10.1016/j.cmet.2018.07.016
56. Huang K, Du M, Tan X, et al. PARP1-mediated PPARα poly(ADP-ribosyl)ation suppresses fatty acid oxidation in non-alcoholic fatty liver disease. J Hepatol. 2017;66(5):962–977. doi:10.1016/j.jhep.2016.11.020
57. Derdak Z, Villegas KA, Harb R, Wu AM, Sousa A, Wands JR. Inhibition of p53 attenuates steatosis and liver injury in a mouse model of non-alcoholic fatty liver disease. J Hepatol. 2013;58(4):785–791. doi:10.1016/j.jhep.2012.11.042
58. Koh JH, Johnson ML, Dasari S, et al. TFAM enhances fat oxidation and attenuates high-fat diet-induced insulin resistance in skeletal muscle. Diabetes. 2019;68(8):1552–1564. doi:10.2337/db19-0088
 © 2021 The Author(s). This work is published and licensed by Dove Medical Press Limited. The full terms of this license are available at https://www.dovepress.com/terms.php and incorporate the Creative Commons Attribution - Non Commercial (unported, v3.0) License.
By accessing the work you hereby accept the Terms. Non-commercial uses of the work are permitted without any further permission from Dove Medical Press Limited, provided the work is properly attributed. For permission for commercial use of this work, please see paragraphs 4.2 and 5 of our Terms.
© 2021 The Author(s). This work is published and licensed by Dove Medical Press Limited. The full terms of this license are available at https://www.dovepress.com/terms.php and incorporate the Creative Commons Attribution - Non Commercial (unported, v3.0) License.
By accessing the work you hereby accept the Terms. Non-commercial uses of the work are permitted without any further permission from Dove Medical Press Limited, provided the work is properly attributed. For permission for commercial use of this work, please see paragraphs 4.2 and 5 of our Terms.