Back to Journals » Journal of Multidisciplinary Healthcare » Volume 14
Healthcare Facilities’ Satisfaction with the Ethiopian Pharmaceutical Supply Agency’s Pharmaceutical Logistics Services: An Exploratory Study
Authors Gizaw T ![]() , Bogale M, Melese D
, Bogale M, Melese D ![]()
Received 8 July 2021
Accepted for publication 20 August 2021
Published 27 August 2021 Volume 2021:14 Pages 2351—2360
DOI https://doi.org/10.2147/JMDH.S328396
Checked for plagiarism Yes
Review by Single anonymous peer review
Peer reviewer comments 2
Editor who approved publication: Dr Scott Fraser
Tafesse Gizaw,1 Mekonnen Bogale,2 Dejene Melese3
1Quantification and Market Shaping Office, Ethiopian Pharmaceuticals Supply Agency, Jimma, Ethiopia; 2College of Business and Economics, Jimma University, Jimma, Ethiopia; 3Department of Health Management and Policy, Faculty of Public Health, Jimma University, Jimma, Ethiopia
Correspondence: Tafesse Gizaw
Quantification and Market Shaping Office, Ethiopian Pharmaceuticals Supply Agency, PO Box 359, Jimma, Ethiopia
Email [email protected]
Purpose: The pharmaceutical logistics service is concerned with meeting the needs of customers in a public healthcare setting. When customers’ needs are addressed, they will be satisfied. As a result, the objective of this research was to identify major logistics factors that influence customer satisfaction in the Ethiopian pharmaceutical supply agency hubs, as well as to evaluate their satisfaction with the pharmaceutical logistics delivery process.
Methods: We conducted a cross-sectional study with 262 randomly selected pharmacy unit employees from healthcare facilities. The information was acquired using a pre-tested self-administered questionnaire, then analyzed using SPSS statistical software. We performed an exploratory factor analysis to determine relationships (between observed variables and factors) and used the results in the subsequent analysis. To identify the explanatory variables that can significantly predict the outcome variable, a multiple linear regression model is used. A confidence interval (CI) that did not include zero and a p-value of less than 5% were considered statistically significant.
Results: In terms of customer satisfaction, approximately 68% of respondents were satisfied with the pharmaceutical logistics services. Most pharmaceutical logistics service attributes, such as ordering procedure [β=0.075, 95% CI (0.005, 0.150)], personal contact quality [β=0.189, 95% CI (0.087, 0.240)], product availability [β=0.206, 95% CI (0.123, 0.303)], timeliness (β=0.192, 95% CI (0.099, 0.225)], order accuracy [β=0.190, 95% CI (0.097, 0.236)], order discrepancy handling [β=0.225, 95% CI (0.137, 0.287)], and complaint handling [β=0.177, 95% CI (0.089, 0.257)] had significant positive effects on satisfaction, explaining 72% of variations.
Conclusion: The study revealed that a notable proportion of customers feel dissatisfied with the pharmaceutical services they receive. To further satisfy pharmaceutical customers and maintain service competitiveness, proactive measures to improve pharmaceutical logistics service attributes should be implemented, and logistics managers at all levels should strive for operational excellence in light of ever-changing customer expectations.
Keywords: pharmaceutical logistics service, customer satisfaction, health facility, exploratory factor analysis, Ethiopian pharmaceutical supply agency
Introduction
Pharmaceutical logistics is a critical part of a well-functioning healthcare system.1,2 It is the process of planning, implementing, and managing the flow (or storage) of products, funds, and related information between the point of origin and the point of consumption in order to meet the needs of customers.3,4
Several studies have found that pharmaceutical logistics operations can enhance product value and end-user satisfaction by providing time and place utility.2,5,6 The studies demonstrate this by describing the seven rights of pharmaceutical logistics services: delivering the right product, in the right quantity, in the right location/condition, at the right time, at the right cost, with the right quality, and to the right patient.
To delineate the essence and timing of specific service delivery, pharmaceutical logistics services are usually analyzed by dividing their constituent components into three phases: (i)pre-transaction components that occur before the actual transactions take place (eg contact point quality, ordering process, system flexibility), (ii)transaction components that are directly related to the physical transaction (eg product availability, order status information, delivery reliability, and condition of goods), and (iii)post-transaction components involving elements that occur after the delivery has taken place (eg returns, complaints, invoicing accuracy).7–10
(Dis)satisfaction refers to a person’s feelings of disappointment (pleasure) as a result of comparing perceived results to expectations.11 When assessing the quality of healthcare services, customer satisfaction is one of the most important factors to consider.12,13 In pharmaceutical logistics management, customer satisfaction is described as a key performance indicator that measures the extent to which an organization’s goods, services, and capabilities meet or exceed the expectations (requirements) of its customers.14–16 Customers may be pleased when service delivery processes meet their expectations and requirements; otherwise, they may be dissatisfied. Most service providers are looking for methods to determine whether or not their customers are satisfied with their products or services. As a result, identifying (dis)satisfaction helps in the selection of service features most important to customer segments, the implementation of customer-centric campaigns or promotions, and the identification of areas for improvement that lead to customer churn.
Predominant pharmaceutical logistics studies have focused on the operational performance of firms.17–19 This is a significant research gap in terms of pharmaceutical logistics service attributes from the customer’s point of view.
The Ethiopian pharmaceuticals supply agency (EPSA) provides customer service in addition to a physical product, and to the best of our knowledge, no proof of customer satisfaction with pharmaceutical logistics service exists in Ethiopia. As a result, the aim of this study was to identify significant logistics factors influencing customers’ satisfaction in the EPSA hubs and to evaluate their satisfaction with the pharmaceutical logistics delivery process.
Our findings have implications for prioritizing pharmaceutical logistics service attributes that are essential to improving service delivery in EPSA hubs. The findings could help health managers, policymakers, stakeholders, and health professionals develop and evaluate pharmaceutical service delivery strategies aimed at increasing customer satisfaction in public health facilities.
Methods
Study Setting, Design, and Period
We conducted an institution-based case study at health facilities (HFs) served by the western EPSA. The western EPSA is comprised of the Jimma, Nekemte, and Gambella hubs. These hubs deliver health program commodities (donated in-kind or purchased by international agencies) directly to affiliated HFs. The facilities receive the commodities and provide them with proof of delivery (Model-19). The facilities, on the other hand, are expected to collect budget commodities from the hubs.20 We employed an explanatory research design. A cross-sectional study with a quantitative approach was conducted between January and February 2020.
Source Population
The study’s source population included all HFs in western Ethiopia, as well as health professionals working in these facilities. The catchment public facilities served in the hubs constituted the study population. We excluded respondents who were not present during data collection, as well as incomplete or inconsistent data.
Sample Size and Sampling Technique
We received a list of catchment HFs from the three EPSA hubs in the cluster. There were 337 public HFs in the Jimma hub, 256 in the Nekemte hub, and 31 in the Gambella hub. This provides a sampling frame of 624 public HFs in the study area. Using a single-population correction formula, 238 respondents were sampled, with a maximum variability of 50% at a 95% confidence interval. However, the final sample size was adjusted to 262, with a 10% increase to account for the possibility of non-response.
The respondents for the study were chosen using a multistage sampling process, as shown in Figure 1. The western EPSA cluster, one of Ethiopia’s seven EPSA clusters, was chosen at random in the first step. Second, we generate a random list of public HFs within branches in Microsoft Excel. The three EPSA hubs received a proportional share of the final sample size. To draw the required HFs inside hubs, we use a systematic probability sampling process. One health professional responsible for pharmaceutical logistics management who works at the selected public HFs was chosen as the study’s respondents in the final stage.
 |
Figure 1 The procedure used to choose the participants for the study (source: self-developed). |
Study Variables
The study’s dependent variable was customer satisfaction. A customer is defined in this study as a public organization that purchases or receives pharmaceuticals from EPSA (ie, a health facility – both a health center and a hospital). The study examined information quality, ordering procedure, personnel contact quality, product availability, order condition, timeliness, order accuracy, order discrepancy handling, and customer complaint handling as explanatory variables.
In this study, information quality is defined as the adequacy, completeness, and credibility of the information provided by the branches. The ordering procedure refers to the ease and convenience with which the branches receive orders. Personnel contact quality assesses the agency’s contact personnel’s knowledge, experience, and empathy for the customer’s situation.13
Product availability is operationalized in terms of stock availability and the ability of facilities to obtain desired order quantities from the agency. The ability of the agency to provide orders without any damage or loss is denoted as order condition. Timeliness refers to the agency’s ability to deliver orders on time and respond to special requests in a timely manner.13,21
Order accuracy was used to assess the agency’s ability to deliver the correct goods and quantities. Order discrepancy handling is described as the agency’s ability to address any discrepancies in orders after they have been delivered.13,15,22 We operationalized the handling of customers’ queries (claims, complaints, and questions) in the agency as customer complaint handling (Supplementary Data 1: Study variables and measured items).
Data Collection Instrument and Procedure
To collect data from respondents, we used a self-administered structured questionnaire. It was adapted from previous works and tailored to the local context and study objective.13,18,21,23 The questionnaire has three sections. The first section included demographic questions about gender, age, health facility type, profession, and experience in pharmaceutical logistics management. In the second section, pharmaceutical logistics service attribute questions on a 5-point Likert scale (1 – “strongly disagree” to 5 – “strongly agree”) were used. The third section was used to assess customer satisfaction questions using a 5-point Likert scale.
Data Quality Assurance
Twenty-three samples from outside the study area were used in a pilot study. Following the pilot study, minor changes were made to a few items to improve readability. Three druggists were recruited to assist with data collection. The purpose and method of data collection were explained to the druggists in each branch. One of the study’s investigators oversaw the data collection processes. Before entering the data, we checked it for accuracy, completeness, and other errors.
Data Processing and Statistical Analysis
EpiData software version 3.1 is used to clean, code, and enter the collated data. A statistical package of social science (IBM, Armonk, NY, USA) version 26.0 was used to evaluate the data using descriptive and inferential statistics. A descriptive frequency and percentage analysis was used to determine the socio-demographic characteristics of the respondents and the level of customer satisfaction in the pharmaceutical logistics service provision processes.
The underlying assumptions that have a significant effect on the ability to describe multivariate relationships were examined in this study. Its output revealed no violations of basic assumptions of statistical analysis. To determine relationships (between observed variables and factors) and use the results in multivariate analysis, an exploratory factor analysis (EFA) was performed. We used a principal component analysis (PCA) with an orthogonal “varimax” rotation and retained all factor coefficients equal to or greater than 0.4 to allow clear factor patterns.24–26 We examined the correlation matrix and the Kaiser-Meyer-Olkin (KMO), a measure of sampling adequacy, to ensure that the data are suitable for EFA. All factors with eigenvalues greater than one were extracted.
We used Cronbach’s alpha statistics to measure factor reliability after summarizing the significant factor loadings. A multiple linear regression model is used to identify the explanatory variables that can significantly predict the outcome variable. A confidence interval (CI) that did not include zero and a p-value of less than 5% were considered statistically significant.
Results
Socio-Demographic Characteristics of the Respondents
A total of 247 questionnaires were completed and returned, yielding a response rate of 94.3%. The majority of respondents were from health centers (93.1%), males (72.1%), and aged between 20 and 29 years (51.5%). About sixty-six percent of the study participants were pharmacy professionals. The vast majority (83.4%) had more than two years of work experience, and nearly all (93.9%) had purchased or received goods within the six months prior to the survey. Thus, respondents are more familiar with the agency’s logistics services and are in a better position to provide reliable data (Table 1).
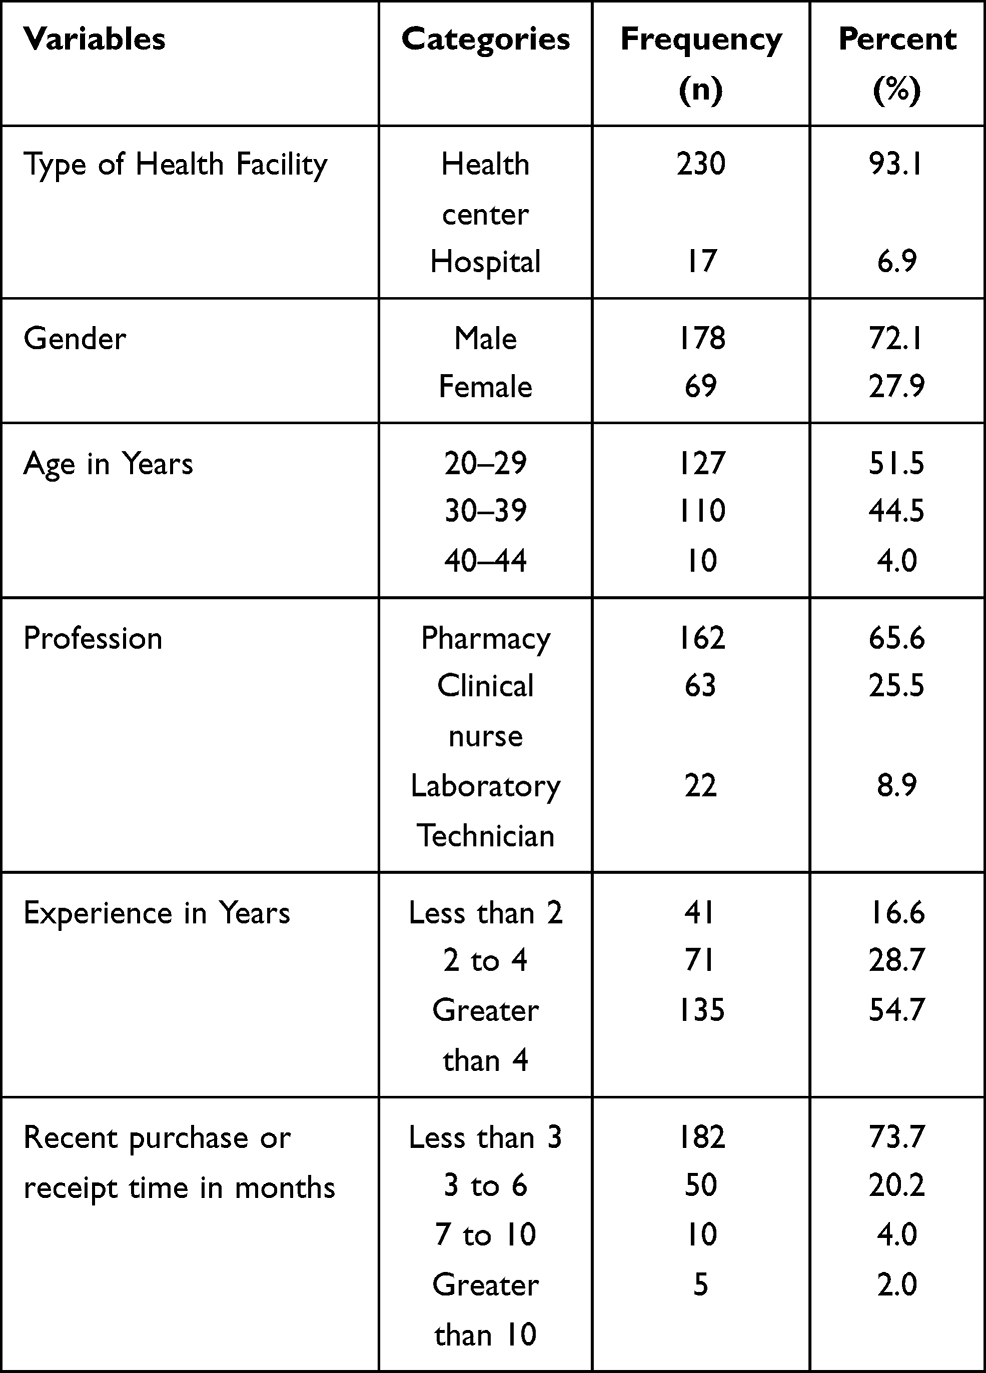 |
Table 1 Socio-Demographic Characteristics of the Respondents, 2020 (N = 247 HFs) |
The Healthcare Facility Satisfaction with Pharmaceutical Logistics Service Process
Using a 5-point Likert scale satisfaction questions (1 = “very dissatisfied”, 2 = “dissatisfied”, 3 = “neutral”, 4 = “satisfied”, and 5 = “very satisfied”), sampled health professionals were requested to rate the extent of their (dis)satisfaction with EPSA’s pharmaceutical logistics services attributes (PLSA). The result shows that the majorities (60%) of study participants were satisfied with the pre-transaction logistics services; 36% of respondents were satisfied with the transaction logistics services, and 48% of customers were satisfied with the post-transaction logistics services.
A notable proportion of customers were dissatisfied with logistics customer service (11.7% in the pre-transaction, 22.2% in the transaction, and 13% in the post-transaction phases). A substantial proportion of customers, 28.3% before the transaction, 41.7% during the transaction, and 39.7% after the transaction, chose the neutral response. Overall, the majority of customers (composite mean score = 3.398 = 68%) expressed satisfaction with the logistics services delivery process (Figure 2).
 |
Figure 2 Healthcare facility satisfaction with pharmaceutical logistics service processes, 2020 (N= 247). |
Results of Exploratory Factor Analysis
The KMO score of 0.828 indicated that the data were sufficient to proceed with factor analysis (EFA). Meanwhile, Bartlett’s test, another statistical test for the overall significance of correlations within a correlation matrix, revealed a statistically significant test of sphericity (app. Chi-square = 2846.37, degree of freedom = 351, p < 0.001), confirming that sufficient correlations exist among the variables to proceed with EFA.
After several iterations, all items (with the exception of order condition items, IQ_1, IQ_2, PC_4, and OA_4 - which were removed from the final PCA) had statistically significant factor loadings and loads into the designated variables. All components (variables) had at least three measured items with rotated factor loadings ranging from 0.50 to 0.87, which is greater than the recommended minimum of 0.5, and T_3 had cross-loadings with component-2. The analysis revealed the existence of eight components, which accounted for 68.22% of the total variance. The first component (order discrepancy handling) consisted of four (4) measured items with factor loadings ranged from 0.689 to 0.788, explained 26.16% of the total variance followed by 9.70% and 7.84%, respectively (Table 2).
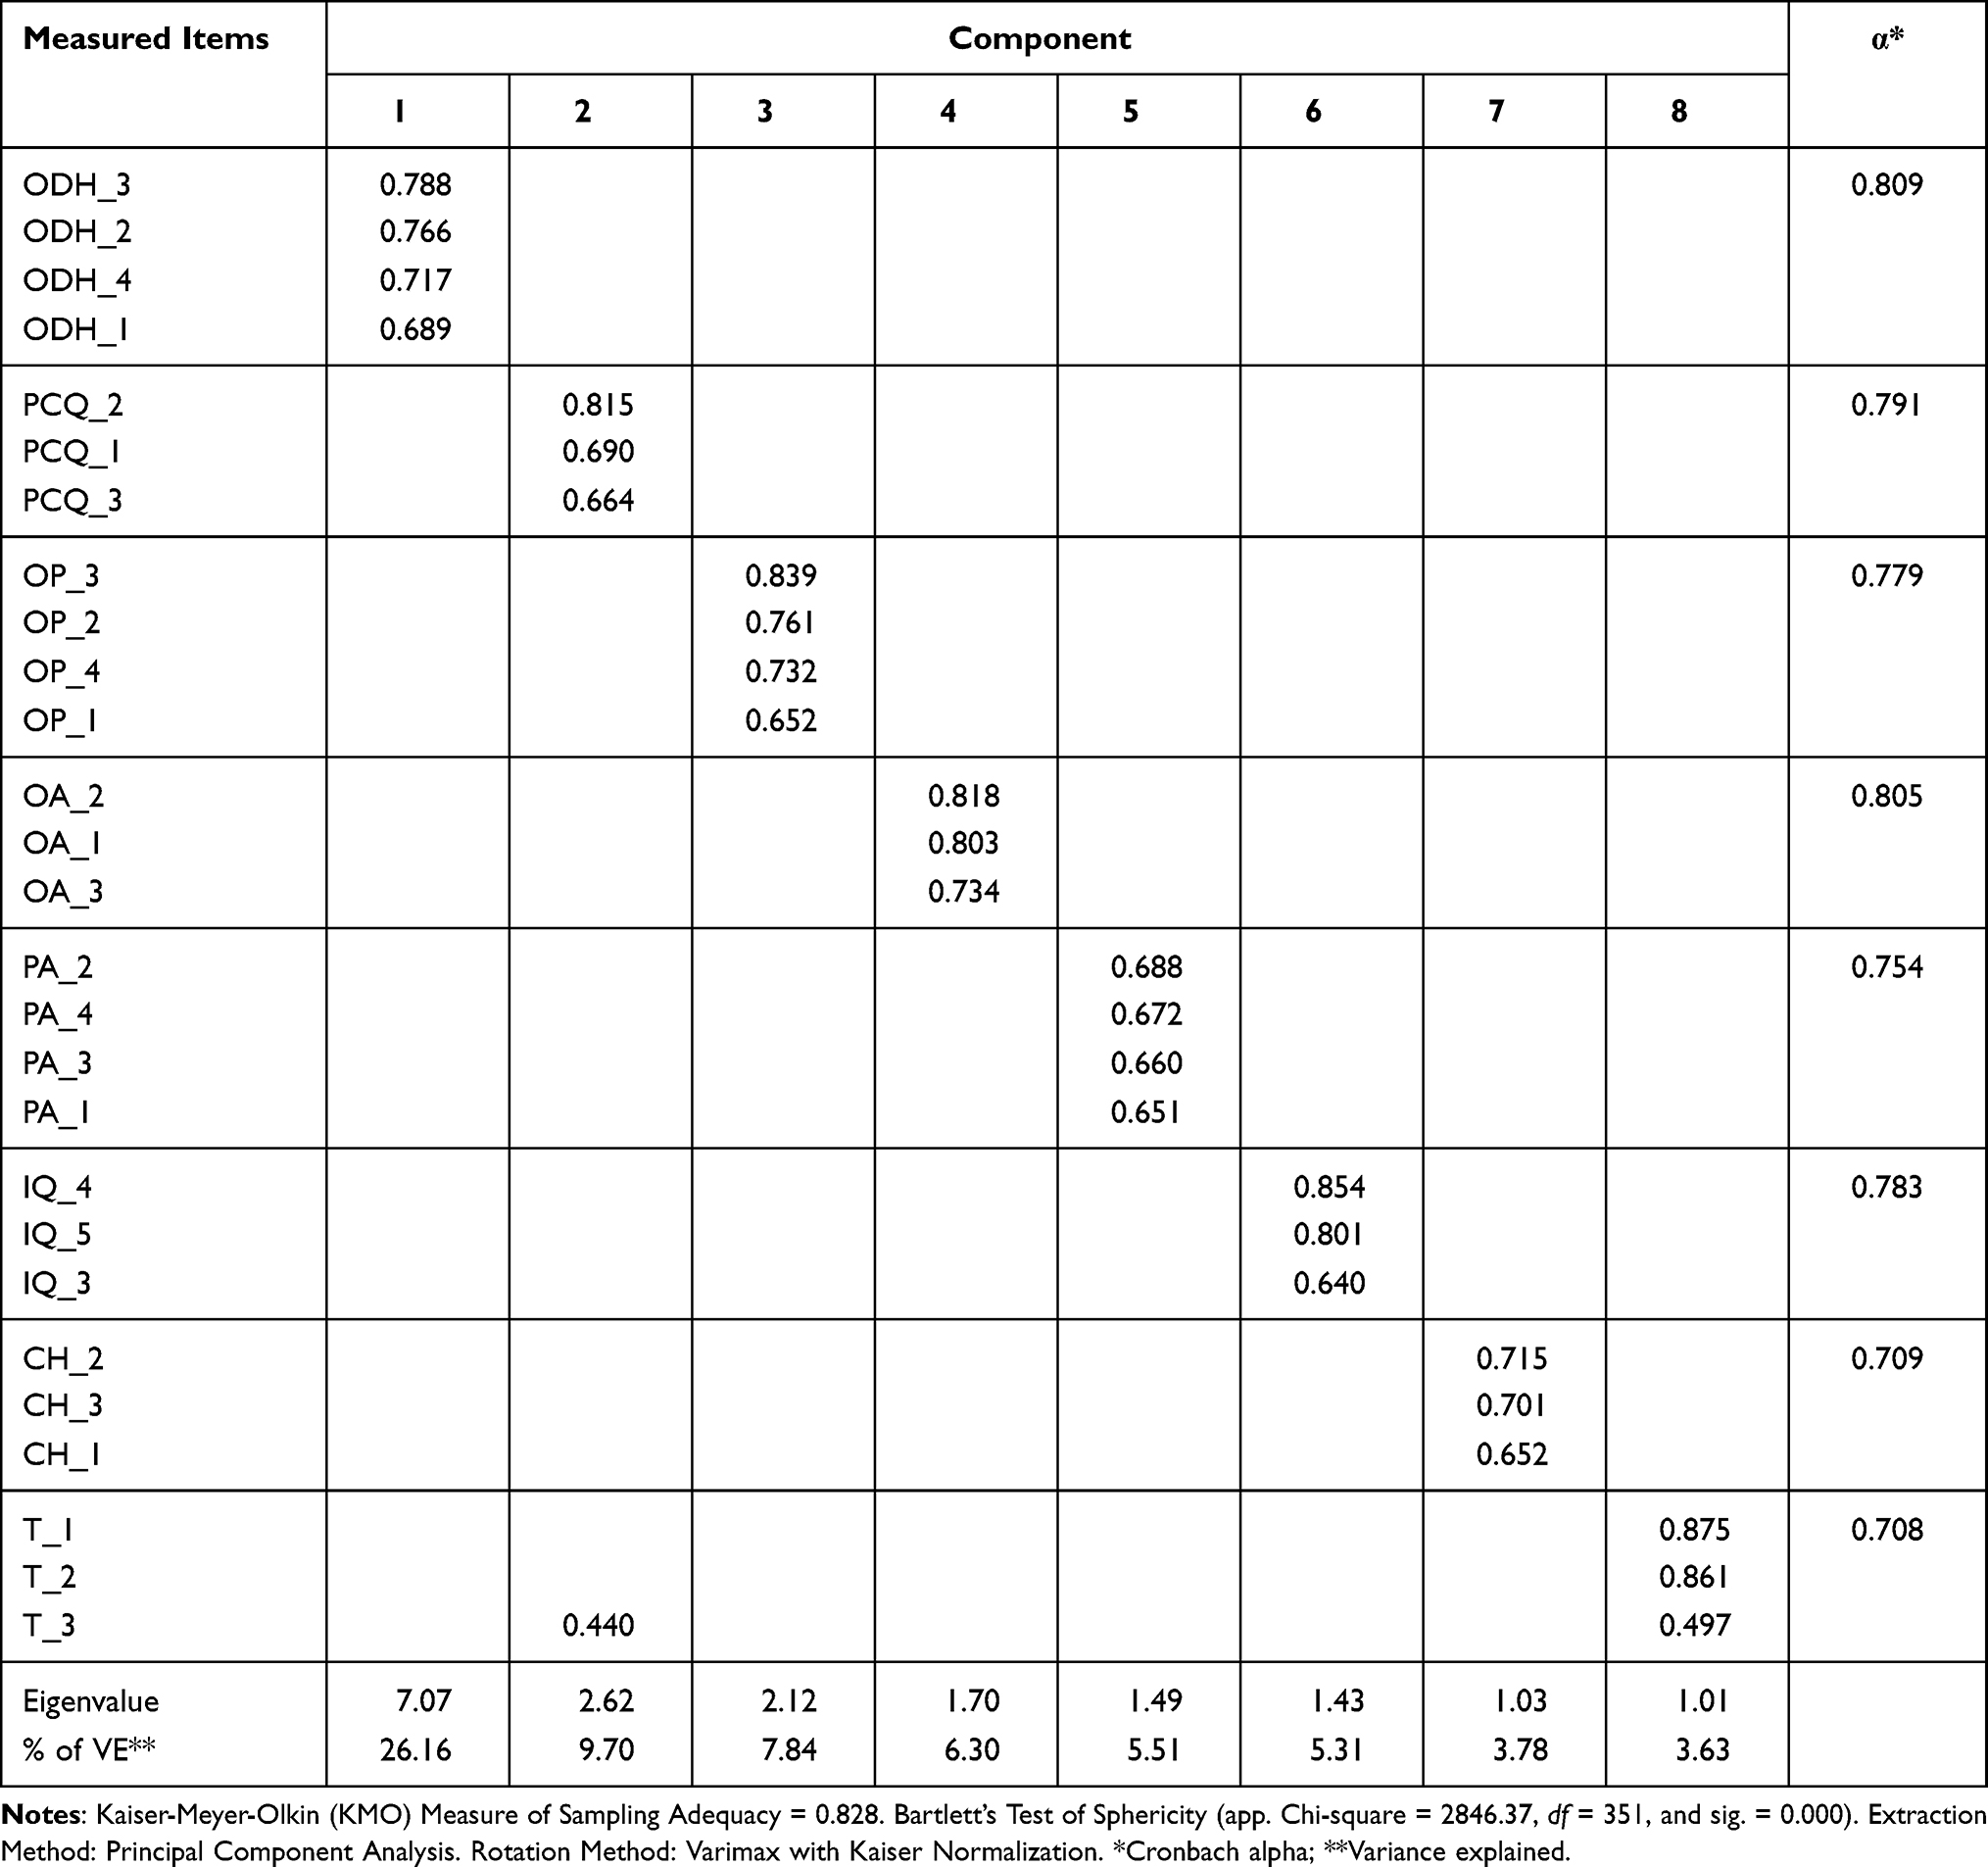 |
Table 2 Rotated Component Matrix, % of Variance Explained, KMO and Cronbach Alpha, 2020 |
Reliability of Components After EFA
Following the identification of the determinant items in the variables, the components were tested for internal reliability. After factor analysis, all PLSAs had Cronbach’s alphas above minimum recommended value (0.7), indicating the instrument’s reliability (Table 2).
Multiple Linear Regression Model
A multiple linear regression model was used to examine the influence of explanatory variables (information quality, ordering procedure, personnel contact quality, product availability, timeliness, order accuracy, order discrepancy handling, and complaint handling) that explain the outcome variable (satisfaction) significantly.
The multiple correlation coefficient (R = 0.854) in the Model summary (Table 3) indicates that there is a positive strong correlation between the independent variables and customer satisfaction. Analysis of variance (ANOVA) results from the regression of explanatory variables and customer satisfaction show that the relationship is highly significant (F (8, 238) = 80.219, p < 0.001).
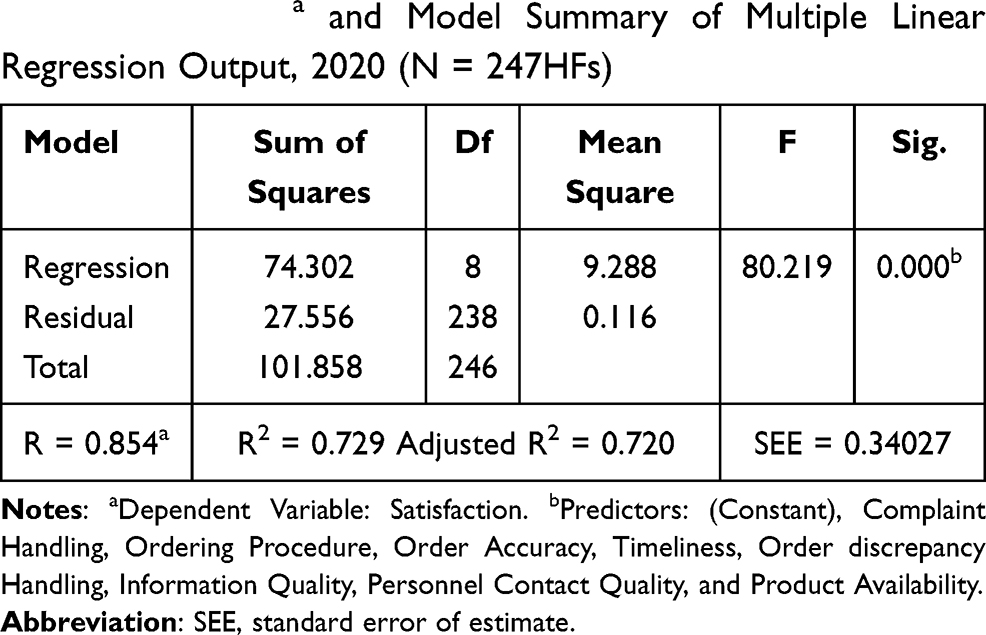 |
Table 3 ANOVAa and Model Summary of Multiple Linear Regression Output, 2020 (N = 247HFs) |
Because the coefficient of determination (R2) increases even when non-significant independent variables are included, the adjusted R2 is a more accurate estimate of R2 in the model. Thus, changes in pharmaceutical logistics service attributes accounted for 72% of the variations in customer satisfaction, leaving the remaining (28%) unexplained.
Table 4 exhibits regression coefficients with 95% confidence intervals (CI) based on predictor contributions to the dependent variable. The study shows ordering procedure [β=0.075, 95% CI (0.005, 0.150), p < 0.05], personnel contact quality [β=0.189, 95% CI (0.087, 0.240), p < 0.001], product availability [β=0.206, 95% CI (0.123, 0.303), p < 0.001], timeliness [β=0.190, 95% CI (0.099, 0.225), p < 0.001], order discrepancy handling [β=0.225, 95% CI (0.137, 0.287)], order accuracy [β=0.190, 95% CI (0.097, 0.236), p < 0.001], and complaint handling [β=0.177, 95% CI (0.089, 0.257), p < 0.001] had significant positive effects on customer satisfaction, whereas information quality [β=0.067, 95% CI (−0.011, 0.137), p > 0.05] had an insignificant positive effect on the predicted variable.
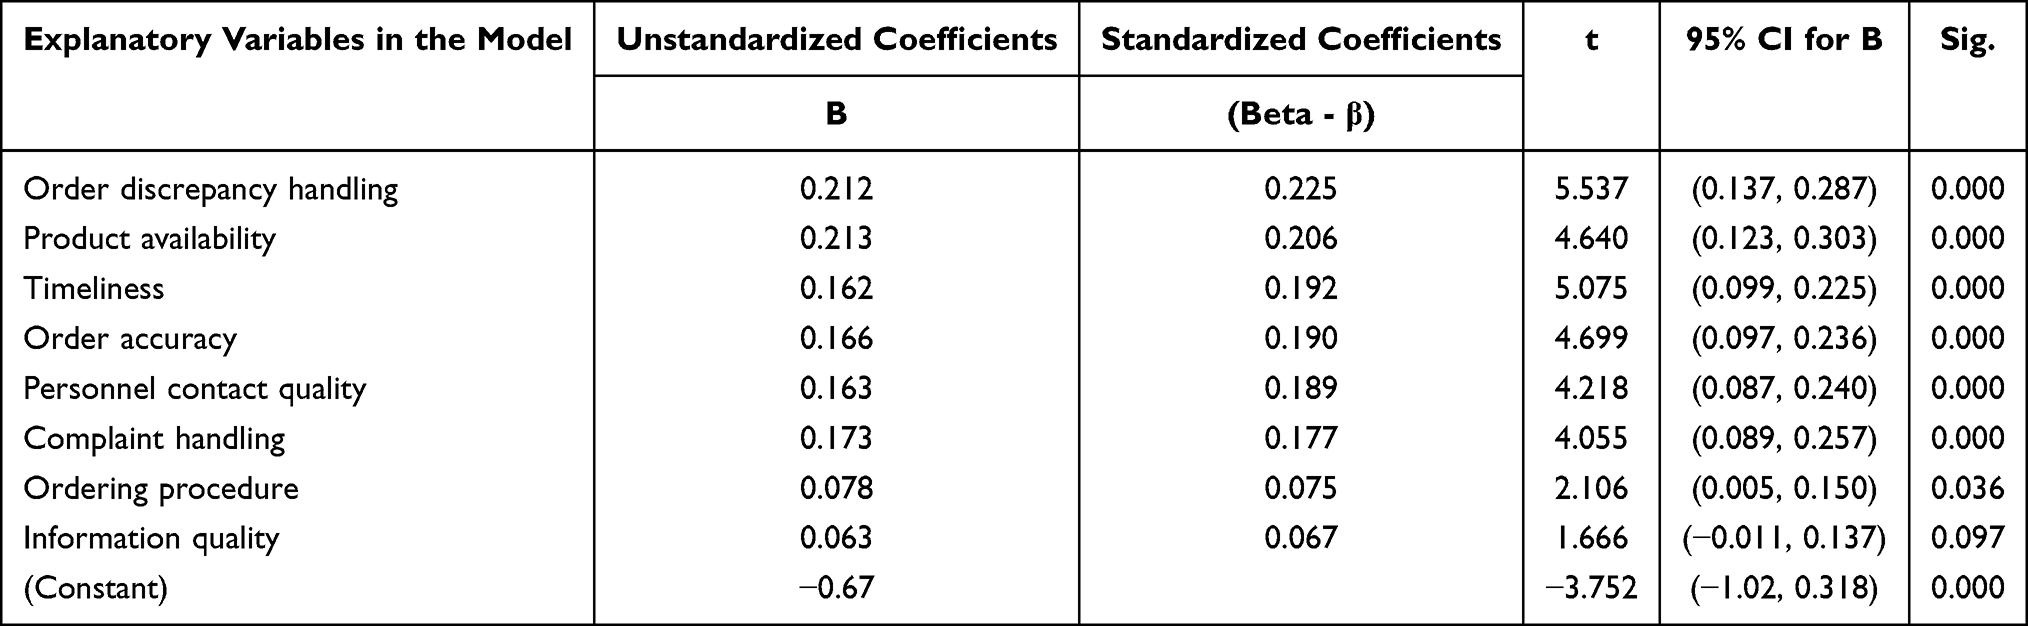 |
Table 4 Regression Coefficients Significance Tests, 2020 (N = 247 Public HFs) |
Discussion
The aim of the pharmaceutical logistics service is to meet the needs of the customers in public healthcare facilities. When customers’ needs are met, they will be satisfied with pharmaceutical logistics services.11,14,27 In this study, about 60%, 36%, and 48% of respondents expressed satisfaction with pre-transaction, during-transaction, and post-transaction pharmaceutical service delivery processes. This result coincides with the survey conducted in the medical logistics service companies in Lithuania.28 However, the result is below a survey conducted in Poland as 89%, 93%, and 76% of the respondents expressed satisfaction with pre-transaction, during the transaction, and after the transaction services respectively.8 The variation could be due to differences in the study setting, specific pharmaceutical logistics services provided, and study population characteristics.
Customer satisfaction is an assessment of how customers perceive pharmaceutical logistics performance, highlighting its strengths and informing the design of effective solutions for areas that require improvement. Measuring customer satisfaction assists in determining which areas are negatively impacting customers and leading to their turnover. To further satisfy pharmaceutical customers, maintain service competitiveness, and healthcare facility trust, proactive measures to improve pharmaceutical logistics service attributes should be implemented, and logistics managers at all levels should strive for operational excellence in light of ever-changing customer expectations.
Routine evaluation of pharmaceutical logistics activities is critical for achieving basic customer satisfaction and obtaining the seven logistics system rights. The study shows information quality (β=0.067), ordering procedure (β=0.075), and personnel contact quality (β=0.189) had positive effects with customer satisfaction. Most importantly, among pre-transaction PLSAs, personnel contact quality contributed the most (18.9%). Accordingly, it is clear that the quality of contact personnel has a significant impact on customer satisfaction when it comes to the delivery of pre-transaction pharmaceutical logistics services. Indeed, in the EPSA, one of the most important determinants in the delivery of pharmaceutical services is the quality of contact personnel, as most logistics operations involve personnel who frequently receive, process, and deliver customer orders, as well as understand their needs. As a result, a contact person who has the necessary training, skills, and experiences, as well as a genuine interest in resolving customer inquiries, is required to provide specific pharmaceutical logistics.
Stock availability and delivery reliability are the key aspects of an efficient pharmaceutical logistics system.6,10,15 In order to provide consistent, high-quality care, and manage top community pressing problems, the essential pharmaceuticals should be available and accessible at all times at healthcare facilities.3,6,29 In this study, product availability (β=0.206), and timeliness (β=0.190) had a significant (p < 0.001) positive effects with customer satisfaction. Healthcare facilities would be most satisfied when they acquired the right pharmaceuticals in the desired quantities and received them within the timeframe promised, according to the results. As a result, product availability and timeliness were predictors of healthcare satisfaction in EPSA hubs. To satisfy healthcare facilities, the agency should ensure that optimal quantities of products are available with little to no stockout in the inventory, and deliver products at the right time to meet ever-changing customer needs.
Due to significant cross-loading or low factor loading, the order condition variable (measured as products received after order placement are undamaged, conveniently packaged, and damages rarely occur as a result of transportation) was removed during factor analysis. According to the respondents’ ratings, the variable had no statistically determinant effect on customer satisfaction because changes in order condition were not associated with changes in customer satisfaction. This result is supported by Mentzer et al, 2001 as order condition does not drive customers’ satisfaction but only serves as the order qualifier.13 However, research conducted by Giovans and Tsoukatos, 2013 stated that order condition as a sub-dimension to outcome quality was significant to customer satisfaction.18 The differences in this study may be that customers will not receive damaged products during the receipt of goods, as well responsive to transport receipt products in good condition.
As expected, significant effects were obtained for order discrepancy handling (β=0.225), order accuracy (β=0.190), and complaint handling (β=0.177) with customer satisfaction. According to the findings, order discrepancy handling accounted for the highest proportion of all PLSAs, followed by product availability and timeliness. Thus, dealing with order discrepancies had a significant positive impact on customer satisfaction. To track progress and resolve problems, the agency should solicit continuous customer feedback. Thus, satisfactorily managing a customer’s complaints and queries should be an integral part of customer service provisions.
Conclusion
The majority of customers (60%) were pleased with the pre-transaction services, which were followed by the post-transaction phases (48%). More than two-thirds (68%) of customers were satisfied with the hubs’ overall pharmaceutical logistics services. According to the study, a notable proportion of customers (12%) feel dissatisfied with the pharmaceutical services they receive. As a result, the agency should devote more in this area in order to remain competitive in the service and retain customers.
Our findings revealed that the seven (7) variables ordering procedures, personal contact quality, product availability, timeliness, order accuracy, order discrepancy handling, and complaint handling as the most significant pharmaceutical logistics services attributes influenced customer satisfaction in the EPSA hubs.
Recommendation
Pharmaceutical logistics services are critical to achieving basic customer satisfaction in terms of obtaining the right pharmaceutical in the right quantity and condition, at the right time, for the right client. To this effect, collaborative stakeholder (the Ministry of Health, school of pharmacy, development partners) engagement in providing healthcare supply management training (in selection, quantification, and inventory management), technical support, and supportive supervision are helpful activities for the agency in improving pharmaceutical logistics attributes performance, and it may also foster a sense of shared responsibility for the healthcare logistics system.
Abbreviations
EFA, Exploratory factor analysis; EPSA, Ethiopian pharmaceutical supply agency; HFs, Health facilities; PCA, Principal component analysis; PLSA, Pharmaceutical logistics service attribute.
Data Sharing Statement
The data is available from the corresponding author upon reasonable request.
Ethics Approval and Consent to Participate
The study was conducted in accordance with the Declaration of Helsinki. The Research Ethics Committee (REC) of Jimma University, College of Business and Economics issued an ethical clearance letter. Ensuing permission was acquired from the facility-in-charge (Medical director, hospital or Head, health center) to gain access to study participants. Following a debriefing on the study’s objective, informed verbal consent was obtained in compliance with the REC-approved study protocol. Participants were also informed that they had the right to decline or withdraw from the study at any time.
Acknowledgments
We would like to thank the Jimma University, as well as the data collectors and respondents, for their kind cooperation, support, and assistance throughout the data collection process.
Funding
The costs of stationery and data gathering were provided by Jimma University. The university had no involvement in the writing, editing, approval, or publication of the work.
Disclosure
The authors report no conflicts of interest for this work.
References
1. Chen M-C, Hsu C-L, Lee L-H. Service quality and customer satisfaction in pharmaceutical logistics: an analysis based on kano model and importance-satisfaction model. Int J Environ Res Public Health. 2019;16:15–16. doi:10.3390/ijerph16214091
2. USAID | DELIVER PROJECT. The Logistics Handbook: A Practical Guide for the Supply Chain Management of Health Commodities; 2011.
3. Towards Access 2030. WHO essential medicines and health products strategic framework 2016–2030. Geneva; 2017. Available from: http://www.who.int/medicines/publications/%0ATowards_Access_2030_Final.pdf.
4. Council of Supply Chain Management Professionals (CSCMP). Supply chain management terms and glossary; 2018. Available from: https://cscmp.org/AsiCommon/Controls/BSA/Downloader.aspx.
5. Šalkovska J, Ribakova N, Vadims D. Marketing and logistics cooperation problems in Latvian companies. Procedia Soc Behav Sci. 2014;110:390–397. doi:10.1016/j.sbspro.2013.12.883
6. Management Science for Health. MDS-3: Managing Access to Medicines and Health Technologies. Arlington, USA; 2012.
7. Świtała M, Cichosz M, Joanna T. How to achieve customer satisfaction? Perspective of logistics outsourcing performance. LogForum. 2019;15(1):39–51. doi:10.17270/J.LOG.2019.316
8. Kotylak S, Michalowska M, Kulyk P. Assessment of customer satisfaction with logistics service in the light of the results of the research. Management. 2017;21(1):205–222. doi:10.1515/manment-2015-0089
9. Christopher M. Logistics and Supply Chain Management: Creating Value-Adding Networks.
10. Rushton A, Croucher P, Baker P. The Handbook of Logistics and Distribution Management.
11. Oliver RL. Satisfaction: A Behavioral Perspective on the Consumer.
12. Chinomona R, Dubihlela D. Does customer satisfaction lead to customer trust, loyalty and repurchase intention of local store brands? The case of gauteng province of South Africa. Mediterr J Soc Sci. 2014;5(9):23–32. doi:10.5901/mjss.2014.v5n9p23
13. Mentzer JT, Flint DJ, Hult GT. Logistics service quality as a segment-customized process. J Mark. 2001;65(4):82–104. doi:10.1509/jmkg.65.4.82.18390
14. Stopka O, Černá L, Vladislav Z. Methodology for measuring the customer satisfaction with the logistics services. Nase More. 2016;63(3):189–194. doi:10.17818/NM/2016/SI21
15. Chopra S, Meindl P. Supply Chain Management: Strategy, Planning, and Operation.
16. Wisner JD, Tan KC, Leong GK. Principles of Supply Chain Management: A Balanced Approach.
17. Boche B, Mulugeta T, Gudeta T. Assessment of inventory management practices at the Ethiopian pharmaceuticals supply agency, Addis Ababa, Ethiopia. Dove Press J Int Pharm Res Pract. 2020;9:176.
18. Giovans AN, Tsoukatos E. On the relationships between logistics service deliverables, customer satisfaction and loyalty in industrial supply chains. J Int Bus Entrep Dev. 2013;7(1):63. doi:10.1504/jibed.2013.052132
19. Shan H, Ying L, Jing S. Influence of supply chain collaborative innovation on sustainable development of supply chain: a Study on Chinese Enterprises. MDPI Sustain. 2020;12:1–19. doi:10.3390/su12072978
20. Ethiopian pharmaceuticals Supply Agency (PFSA). Integrated Pharmaceuticals Logistics System (IPLS) in Health Facilities of Ethiopia; 2017.
21. Bienstock CC, Mentzer JT, Monroe Murphy B. Measuring Physical Distribution Service Quality (PDSQ). J Acad Mark Sci. 1997;25(1):31–44. doi:10.1007/BF02894507
22. Giovanis AN, Tomaras P, Zondiros D. Suppliers logistics service quality performance and its effect on retailers’ behavioral intentions. Procedia Soc Behav Sci. 2013;73:302–309. doi:10.1016/j.sbspro.2013.02.056
23. Kamble SS
24. Tabachnick BG, Fidell LS. Using Multivariate Statistics.
25. Hair JF
26. Yockey RD. SPSS Demystified: A Simple Guide and Reference.
27. Querin F, Martin G. An analysis on the impact of logistics on customer service. J Appl Leadersh Manag. 2017;5:90–103.
28. Meidutė-Kavaliauskienė I, Aranskis A, Litvinenko M. Consumer satisfaction with the quality of logistics services. Procedia Soc Behav Sci. 2014;110:330–340. doi:10.1016/j.sbspro.2013.12.877
29. Birabwa C, Murison J, Evans V, et al. The availability of six tracer medicines in private medicine outlets in Uganda. J Pharm Policy Pract. 2014;7(18):1–8. doi:10.1186/s40545-014-0018-y
 © 2021 The Author(s). This work is published and licensed by Dove Medical Press Limited. The
full terms of this license are available at https://www.dovepress.com/terms
and incorporate the Creative Commons Attribution
- Non Commercial (unported, 3.0) License.
By accessing the work you hereby accept the Terms. Non-commercial uses of the work are permitted
without any further permission from Dove Medical Press Limited, provided the work is properly
attributed. For permission for commercial use of this work, please see paragraphs 4.2 and 5 of our Terms.
© 2021 The Author(s). This work is published and licensed by Dove Medical Press Limited. The
full terms of this license are available at https://www.dovepress.com/terms
and incorporate the Creative Commons Attribution
- Non Commercial (unported, 3.0) License.
By accessing the work you hereby accept the Terms. Non-commercial uses of the work are permitted
without any further permission from Dove Medical Press Limited, provided the work is properly
attributed. For permission for commercial use of this work, please see paragraphs 4.2 and 5 of our Terms.