")
Back to Journals » Clinical Epidemiology » Volume 15
Health Inequality in Eight Adverse Outcomes Over a 25-Year Period in a Multi-Ethnic Population in New Zealand Population with Impaired Glucose Tolerance and/or Impaired Fasting Glucose: An Age-Period-Cohort Analysis
Authors Wang Z, Yu D , Osuagwu UL , Pickering K, Baker J, Cutfield R, Cai Y, Orr-Walker BJ, Sundborn G, Zhao Z, Simmons D
Received 4 August 2023
Accepted for publication 23 November 2023
Published 6 December 2023 Volume 2023:15 Pages 1123—1143
DOI https://doi.org/10.2147/CLEP.S433714
Checked for plagiarism Yes
Review by Single anonymous peer review
Peer reviewer comments 2
Editor who approved publication: Professor Lars Pedersen
Zheng Wang,1,* Dahai Yu,1,2,* Uchechukwu Levi Osuagwu,3,4 Karen Pickering,5 John Baker,5,6 Richard Cutfield,5,7 Yamei Cai,1 Brandon J Orr-Walker,5,6 Gerhard Sundborn,8 Zhanzheng Zhao,1 David Simmons1,4
1Department of Nephrology, The First Affiliated Hospital, Zhengzhou University, Zhengzhou, 450052, People’s Republic of China; 2Primary Care Centre Versus Arthritis, School of Medicine, Keele University, Keele, ST5 5BG, UK; 3Translational Health Research Institute (THRI), Western Sydney University, Campbelltown, Sydney NSW, 2560, Australia; 4School of Medicine, Western Sydney University, Campbelltown, Sydney NSW, 2751, Australia; 5Diabetes Foundation Aotearoa, Otara, New Zealand; 6Department of Diabetes and Endocrinology, Counties Manukau Health, Auckland, New Zealand; 7Department of Diabetes and Endocrinology, Waitemata District Health Board, Auckland, New Zealand; 8Section of Pacific Health, The University of Auckland, Auckland, New Zealand
*These authors contributed equally to this work
Correspondence: David Simmons; Zhanzheng Zhao, Department of Nephrology, The First Affiliated Hospital Zhengzhou University, Zhengzhou, 450052, People’s Republic of China, Tel +6124620 3899 ; +86 13938525666, Fax +6124620 3890 ; +863716698 8753, Email [email protected]; [email protected]
Purpose: We aimed to examine socioeconomic inequality (SI) in cause-specific outcomes among adults with impaired glucose tolerance (IGT) and/or Impaired fasting glucose (IFG) in New Zealand (NZ) over 25 years.
Patients and Methods: A population-based open cohort was derived from Diabetes Care Support Service in NZ with national databases linkage. Patients aged ≥ 18 years with IGT and/or IFG were enrolled between 01/01/1994 and 31/07/2018 and followed up until death or 31/12/2018. Incident outcomes (all-cause, premature, cardiovascular, and cancer death; cardiovascular, myocardial infarction, stroke, heart failure, and end-stage kidney disease hospitalization) by demographic, anthropometric, socioeconomic status, clinical measurements, enrol-time-periods, and IGT/IFG were evaluated. Adjusted incidence rate ratios, absolute risk difference, and SI measurements (slope and relative index of inequality) were estimated using Age-Period-Cohort models.
Results: 29,894 patients (58.5 (SD 14.3) years mean age; 52.2% female) were enrolled with 5.6 (IQR: 4.4– 7.4) years of median follow-up. Mortality rates decreased, whereas hospitalization (except myocardial infarction) rates increased. SI was significant for each outcome. Higher mortality and hospitalization rates and worsened SI were common in men, older, the most deprived, and Māori patients, as well as patients with obesity, current smoking, with both IFG and IGT, and greater metabolic derangement (higher systolic blood pressure, lipids, and HbA1c, and lower level of mean arterial pressure).
Conclusion: Enhanced management strategies are necessary for people with IGT and/or IFG to address persisting SI, especially for men, older people, current smokers, NZ European and Māori patients, patients with obesity, or with any abnormal metabolic measurements.
Keywords: impaired glucose tolerance, impaired fasting glucose, New Zealand, Māori, ethnic disparity, socioeconomic inequality, mortality, cardiovascular diseases, heart failure, cancer, end-stage renal disease
Introduction
Impaired glucose tolerance (IGT) and/or impaired fasting glucose (IFG) are recognized as high-risk states for developing type 2 diabetes (T2D), characterized by elevated glucose levels that fall below the diagnostic threshold for T2D and are higher than normal.1–3 The prevalence of IGT worldwide in 2021 reached 9.1% (around 464 million) and is projected to be 10.0% (nearly 638 million) by 2045. The prevalence of IFG globally in 2021 was estimated to be 5.8% (about 298 million) and is predicted to be 6.5% (nearly 414 million) by 2045 (4–5). In New Zealand (NZ), during 2008–2009, 25.5% of people aged 15 years and over were found to have prediabetes based on HbA1c criteria.4 Notably, prediabetes, regardless of the specific definition used, has been significantly related with a higher risk of death,5 as well as an elevated risk of cardiovascular diseases and all-cause mortality in comparison with the general population.5
Despite the significant role impact of glucose regulation abnormalities and the established relationship between IFG/IGT and clinical outcomes broadly recognized in the overall population (7), the examination of enduring trends in specific health complications among those with IGT and/or IFG has not been widely pursued. While socioeconomic disparities in health outcomes, such as life expectancy, mortality, and hospitalization, are well documented in the overall population,6 it remains to be determined if similar patterns exist among individuals with IGT and/or IFG and whether these patterns have undergone changes over time. Current data reflecting contemporary trends in health outcomes for varied groups with IGT and/or IFG is essential for a deeper comprehension of the persistent socioeconomic gaps in health outcomes, aiding in the strategic development of community-tailored interventions (eg, anti-smoking initiatives) and healthcare strategies (such as diabetes screening programs), with particular attention to community deprivation levels. Furthermore, understanding cause-specific hospitalization rates for individuals with IGT and/or IFG is essential to address the projected rise in healthcare demands. In this study, we utilized linked data based on the Diabetes Care Support Service (DCSS) in Auckland, NZ, to investigate differences in cause-specific outcomes, explore the associations with long-term socioeconomic disparities, and identify trends among groups with incident IGT and/or IFG based on various demographic and clinical characteristics.
Material and Methods
Study Design and Data Sources
Our study employed a longitudinal open cohort design, utilizing data from the DCSS. It serves as an audit system initiated in 1991, tasked with overseeing the management of conditions like diabetes and elevated blood glucose levels, including type 1 and 2 diabetes, IGT, and IFG, across the southern, eastern, and western regions of Auckland. It aims primarily to amplify the caliber of healthcare services provided to people affected by these health issues.7 Data for our cohort were sourced from a variety of national databases, encompassing records of mortality, oncology registries, medication claims, and socio-economic information.
Our dataset, which spans several years, encapsulates extensive details on demographics, body measurements, lifestyle-related risk factors, clinical metrics, and therapeutic interventions. To ensure the reliability of our data, we instituted an extensive validation regime, including checks such as enumeration verification, internal quality assurance protocols, auditor verification, periodic and random testing, as well as rigorous evaluations for data anomalies, sorting inconsistencies, and redundancy elimination.8–10
In 1996, the DCSS received its ethical endorsement from the North Health Ethics Committee under the protocol number 92/006. This followed the foundation's approval for its research aims in 1992. The New Zealand Health Disability Ethics Committee granted approval for our study, including a waiver of individual informed consent, on March 25, 2019. All data analyzed in this study were anonymized, and we conducted the research in accordance with relevant guidelines and regulations. This research was performed in alignment with the ethical principles set forth in the Declaration of Helsinki.
Study Population
The cohort for the current study was comprised of individuals with IGT and/or IFG aged 18 years and older, enrolled between 1st January 1994 and 31st July 2018.
Exposure
The study pinpointed instances of IFG and/or IGT based on primary care records, which underwent validation by trained diabetes auditors. Patients without diabetes but with a fasting plasma glucose level ranging from 6.1 to less than 7.0 mmol/L, alongside a 2-hour plasma glucose level of less than 7.8 mmol/L were classified as having IFG alone. Those without diabetes and with 2-hour plasma glucose level from 7.8 up to less than 11.1 mmol/L and with fasting plasma glucose level less than 7.0 mmol/L11 were categorized as having either IGT alone or IGT/IFG if IFG was present. All eligible patients incorporated in this study had an HbA1c level below 48 mmol/mol (equivalent to 6.5%).
Baseline characteristics encompassed demographic factors (such as age and gender), body metrics (body mass index (BMI), waist circumstance, blood pressure), lifestyle risk factor (smoking status), clinical measurements (glycated haemoglobin [HbA1c], total cholesterol [TC], low-density lipoprotein cholesterol [LDL-C], triglyceride, high-density lipoprotein cholesterol [HDL-C]), and clinical treatments (antihypertensive, statin, and antiplatelet or anticoagulant therapies).
The stratification of patients was based on sex, age group (above/below median: ≤55 years and >55 years); ethnicity (NZ European [NZE], Māori, Pasifika, Other ethnic group [due to small numbers in each group], socioeconomic status, enrolment year (1994–2008 and 2009–2018) based on 2008 being the median enrolment year), obesity status (categorized as either below or above a BMI of 30 kg/m2), smoking habits, systolic blood pressure (SBP) (classified as either below or above 130 mmHg), total cholesterol (TC) (classified as either below or above 5.0 mmol/L), triglyceride (TG) (less than 1.8 mmol/L and 1.8 mmol/L or higher), HbA1c (values less than 43 mmol/mol (6.1%) and values of 43 mmol/mol (6.1%) or above), hyperglycaemic type (only having IFG, only having IGT, and having IFG + IGT). Moreover, the study defined mean arterial pressure (MAP) as one-third of systolic blood pressure plus two times diastolic blood pressure, with a median split at less than 96 mmHg and 96 mmHg or greater.
Due to limited outcomes recorded in patients aged <30 years and the sample size of patients aged more than 85, these two age strata were excluded from the analysis.
Individual socioeconomic levels were gauged using the NZDep2013 Index, a measure that quantifies deprivation for each small area or meshblock in NZ typically including about 81 people.12 To ensure the power for statistical analysis, we regrouped the Index of Multiple Deprivation (IMD) deciles into five categories: the least deprived (deciles 1–2), moderately deprived (deciles 3–4 and 5–6), and the most deprived (deciles 7–8 and 9–10 according to NZDep2013 scores).7
Outcomes
The study collected and assessed mortality rates, both overall and premature mortality (PM) rates (deaths occurring before the age of 65) along with specific mortality due to cancer and cardiovascular causes. Additionally, we examined hospital admission frequencies, particularly those resulting from cardiovascular complications, stroke, myocardial infarctions, heart failure, cancer, and end-stage kidney disease (ESRD). Patient death data were obtained from the national death registry encompassing all recorded fatalities in NZ. This database provided both the date and the medical cause of death for each study participant, facilitating mortality analyses. Hospital admissions post-enrollment were documented, and this information was obtained from the comprehensive National Hospital Database, which includes details of all inpatient stays. The main cause of hospitalization was recorded for each patient, and the total number of hospital admissions per patient was tallied, with follow-up until death or December 31, 2018 (the last outcome collection date).
Statistical Analysis
In our statistical analysis, we employed descriptive statistics, using numbers and percentages to represent binary variables, and measures such as standard deviation (SD) or interquartile range (IQR) for the continuous variables. We analyzed the death and hospitalization incidence, presenting these rates along with their 95% confidence intervals (Cis) for the entire study population, delineated first by the enrollment period—prior to and post-2008—and then by various demographic strata including age, gender, socioeconomic status, ethnicity, tobacco use, SBP, BMI, cholesterol levels, triglycerides, and HbA1c levels.
To assess the influence of age, time period, and birth cohort on health events throughout the study duration (1994–2018), we applied the Age-Period-Cohort framework. Recognizing that the birth cohort is calculated as the duration of the study minus the patient’s age, and conventional regression methods fall short in isolating the unique effects due to the overlap between age, period, and cohort influences, we adopted a dual-pronged approach to bolster the robustness of our findings.13 First, this included the implementation of a drift component to account for the linear trend observed in health event rates, thereby sidestepping dependencies not distinctly assignable to either the period or cohort. Subsequently, we analyzed deviations from this linear trend (described as curvature), attributable exclusively to period or cohort influences without being confined by model limitations. Health event occurrences were estimated with parametric smooth functions using natural splines with designated knots for age, enrollment period, and cohort factors to identify any nonlinear relationships.
To investigate relative and absolute differences in total and cause-specific hospitalization rates among groups, we used Poisson regression models to calculate adjusted incidence rate ratios (IRR) and adjusted absolute risk difference (ARD) with 95% CIs. These statistics were presented in two forms: without adjustment and adjusted for all covariates (ie, age-group, sex, socioeconomic status, ethnicity, enrollment year, smoking status, BMI, SBP, MAP, TC, TG, and HbA1c). For overall differences between groups, each older age group was compared with the youngest age group (<55 years; reference), women with men (reference), most deprived socioeconomic status (IMD=5) with the least deprived socioeconomic status (IMD=1; reference), Māori, Pasifika, and other ethnic group with NZE (reference), ex-smoking and current smoking with non-smoking (reference), higher SBP (SBP≥130 mmHg) with lower SBP (SBP<130 mmHg), higher MAP (MAP≥96 mmHg) with lower MAP (MAP<96 mmHg), higher TC (TC≥5.0 mmol/L) with lower TC (TC<5.0 mmol/L), higher TG (TG≥1.8 mmol/L) with lower TG (TG<1.8 mmol/L), higher HbA1c (HbA1c≥43 mmol/mol / 6.1%) with lower HbA1c (HbA1c<43 mmol/mol/6.1%), IGT and IFG+IGT with the IFG group, and enrol cohort 2009–2018 with 1994–2008. The proportion of missing covariate data varied from 0.8% to a worst-case scenario of 8% of cohort members. To address this, 8 imputed datasets were generated using multiple imputation with chained equations, from which the final adjusted estimations were derived.
To measure socioeconomic inequality in mortality and hospitalization rates for each IMD (1–5), we used rates adjusted for covariates to estimate both the slope index of inequality (SII) and relative index of inequality (RII) (as detailed in Supplemental Method Note).14 These measures summarized inequality in a population-weighted, regression-based model,15,16 both overall and stratified by age group, sex, ethnic group, IGT and/or IFG, enrol-time-period, smoking status, BMI, SBP, MAP, TC, TG, and HbA1c levels. An SII value of zero indicates no inequality, while positive values point to a higher concentration of outcomes in more deprived areas, and negative values indicate the opposite. Similarly, an RII value of one suggests no inequality, with values greater than one pointing to a higher concentration of outcomes in more deprived areas, and values less than one indicating a higher concentration in less deprived areas.
We also conducted age-period-cohort analyses by age group, sex, socioeconomic status, smoking status, ethnicity, smoking status, BMI, SBP, MAP, TC, TG, HbA1c, IGT, and/or IFG, and enrol-time-period as a sensitivity analysis to measure the impact of confounders at the population level. We used bootstrapping methods with 10,000 resamples to calculate confidence intervals for IRR, ARD, and RII. Statistical significance was assessed with a two-tailed P-value threshold of 0.05, using Stata MP 18.0 for all statistical computations.
Results
We identified 29,894 patients with IGT and/or IFG enrolled in the DCSS over the 25-year study period, of whom 15,617 (52.2%) were female, with an average age of 58.4 years, and a median follow-up time of 5.6 years. Of the study population, 15,258 (51.0%), 4123 (13.8%), 5781 (19.3%), 4732 (15.8%) were NZE, Māori, Pasifika, and other ethnicities, respectively. Table 1 shows the individuals characteristics by gender, socioeconomic status (least and most deprived group), and enrolment period; Supplemental Table 1 presents the characteristics by ethnic group. The likelihood of belonging to the most deprived socioeconomic group was found to be higher among female participants and those enrolled more recently. Smoking prevalence was predominantly higher among male participants, the most deprived population, the recent enrolment period, and Māori. Higher prevalence of obesity was found in women, deprived group, recent enrolment year, Māori, and Pasifika groups. SBP was higher in the least deprived population, earlier enrolment period (<2008), and NZE group. TC, low-density lipoprotein cholesterol, and TG were higher in the most deprived population and in earlier enrolment period (<2008). MAP was similar between men and women, as well as between the least and most deprived groups. It was higher in the earlier enrollment period (≤1999) and remained consistent across the different categories of IGT and/or IFG. HbA1c was higher in the most deprived group, Māori, and Pasifika groups. Antihypertensive treatments and statin treatments were more likely to be taken in males, the least deprived group, group enrolled in recent enrolment period, Māori, and Pasifika groups.
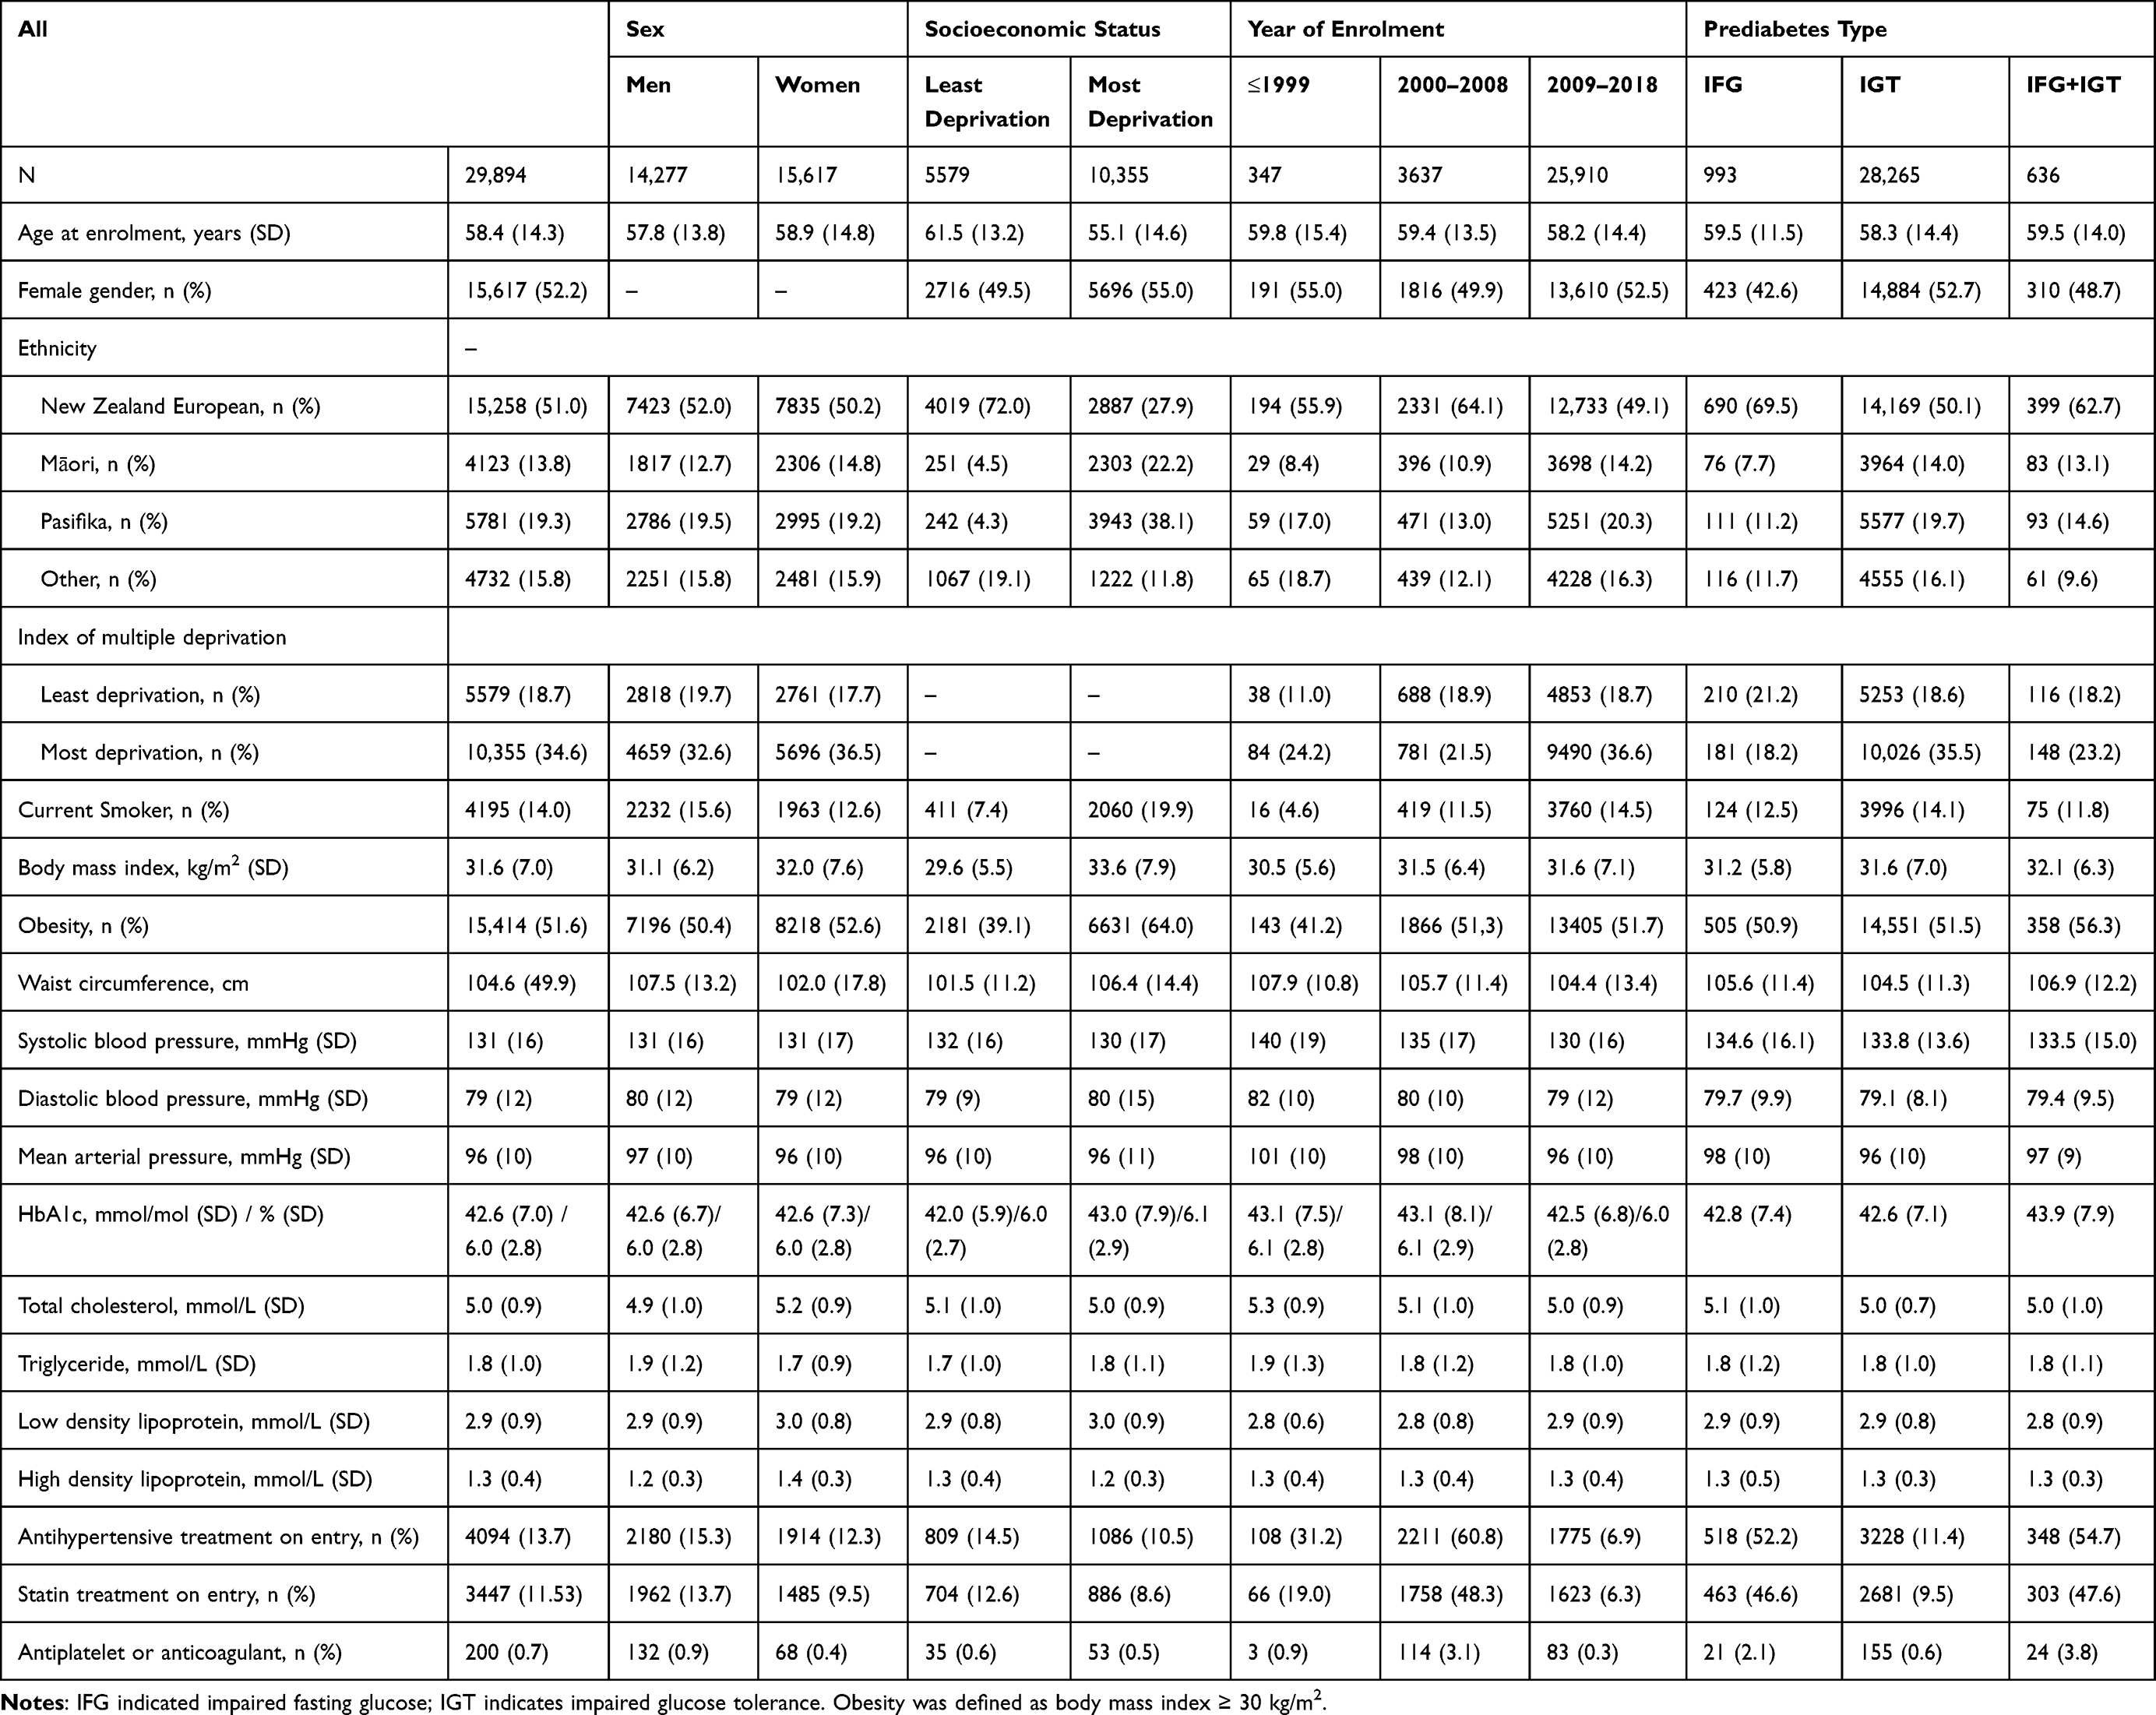 |
Table 1 Characteristics of Patients with Impaired Glucose Tolerance and/or Impaired Fasting Glucose at Enrolment to the Diabetes Care Support Service, by Overall, Sex, Socioeconomic Status, and Year of Enrolment |
Supplemental Table 2 shows the rates for outcomes overall. Temporal trends of mortality rates and hospital admission rates revealed by the age-period-cohort models with adjustment for age and birth-cohort effects (Figure 1) were similar. Mortality rates (either all-cause, premature, or cause-specific mortality) decreased over the study period; cardiovascular, stroke, heart failure, cancer, and ESRD hospital admission rates increased in 1994–2018, whereas myocardial infarction increased between 1994 and 2008 and decreased in 2009–2018. These shifts over time were consistent across variables such as age-group, gender, ethnicity, socioeconomic-status, obesity status, SBP, TC, TG, HbA1c levels, IGT and/or IFG, and MAP (Supplemental Figures 1–10).
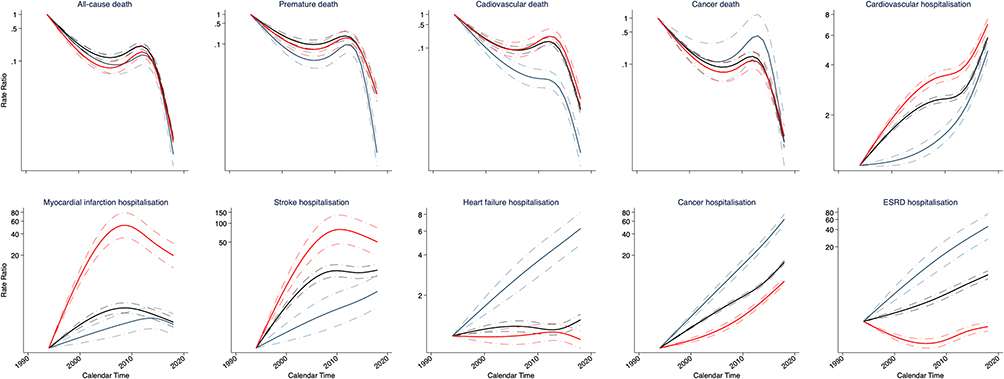 |
Figure 1 Adjusted rates ratio for rates trends of clinical outcomes in a New Zealand population with impaired glucose tolerance and or impaired fasting glucose enrolled to the Diabetes Care Support Service between 1994 and 2018, by overall, least, and most deprived socioeconomic status. Rates in 1994 in each population (overall, least and most deprived population) was used a reference for rates ratio in each category. Age and birth cohort effects were adjusted by use of age-period-cohort models. Solid lines indicate point estimations and shaded areas indicate the 95% CIs. Black, red and blue line indicates overall, most, and least deprived population, respectively. |
In each enrol time period (1994–2008 and 2009–2018), patients with male gender, older age, obesity, current smoking status, higher level of SBP, MAP, TC, TG, and were typically more susceptible to elevated mortality and hospital admissions. Mortality and hospital admission rates exhibited variations among ethnic groups; Māori patients experienced the highest rates of all-cause, premature, and cancer-related mortality, while the NZE population showed the greatest cardiovascular mortality rates. For hospital admissions, Māori patients had more frequent admissions for cancer and ESRD, and NZE patients had more admissions for myocardial infarction and stroke. Notably, the rate of heart failure-related hospital admissions was predominant in Pasifika patients between 1994 and 2018, then shifted to Māori patients in the period from 2009 to 2018 (Supplemental Table 2).
Figure 2 displays the age-adjusted mortality and hospital admission rates for the entire cohort as well as for the groups at both ends of the socioeconomic spectrum – the least and the most deprived. Adjusted all-cause mortality rates and hospital admission rates all increased with age. Adjusted rates were higher in the most deprived groups (Figure 2), men (Supplemental Figure 11), the obesity group (Supplemental Figure 12), current smokers (Supplemental Figure 13), patients with higher level of SBP (Supplemental Figure 14), patients with higher level of total cholesterol (Supplemental Figure 15), patients with higher level of TG (Supplemental Figure 16), and patients with higher level of HbA1c (Supplemental Figure 17). There were some variations in the age-specific adjusted rates by ethnic group (Supplemental Figure 18): for adjusted all-cause mortality rates, Māori patients tended to have the highest estimates especially in those older than 50 years; For adjusted premature mortality, Māori patients tended to have the highest estimates especially among those older than 40 years; for adjusted cardiovascular death, younger than 45 years or older than 65 years, highest estimation was found in Māori patients, in 45–65 years, in Pasifika patients; for cancer death, younger than 40 years, Pasifika patients tended to have higher rates, and older than 40 years, Māori patients tended to have higher estimates; for each hospital admission rates, the highest adjusted rate was found in Māori patients at each age. Following the adjustment for cohort and period effects, individuals with elevated MAP demonstrated higher rates of all-cause mortality and premature mortality, as well as heart failure hospitalization. Those with lower MAP levels exhibited increased rates of cardiovascular, myocardial infarction, and cancer hospitalization. Adjusted rates for cardiovascular and cancer mortality, stroke, and ESRD hospitalization showed no significant differences, particularly after 40 years of age (Supplemental Figure 19).
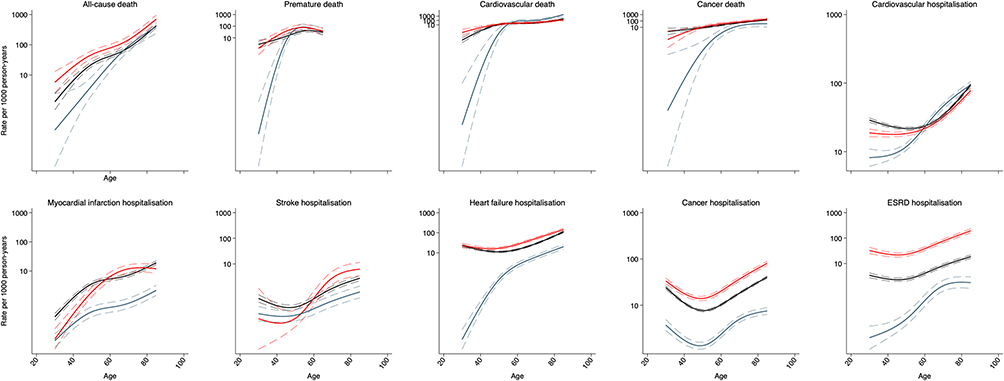 |
Figure 2 Adjusted incidence rate (per 1000 person-years) of clinical outcomes in a New Zealand population with impaired glucose tolerance and or impaired fasting glucose enrolled to the Diabetes Care Support Service between 1994 and 2018, by overall, least, and most deprived socioeconomic status. Patients were aged 30–85 years (30–65 for premature mortality). Period and birth cohort effects were adjusted by use of age-period-cohort models. Solid lines indicate point estimations and shaded areas indicate the 95% CIs. Black, red and blue line indicates overall, most, and least deprived population, respectively. |
When comparing with the IFG group to the IGT group, the latter exhibited a lower adjusted risk of all-cause, premature, and cancer mortality, and IFG+IGT group showed a reduced risk of premature mortality. Relative to the IFG group, both IGT and IFG+IGT groups had greater risk of hospitalization due to cardiovascular diseases, myocardial infarction, heart failure, and cancer (Table 2; Figure 3).
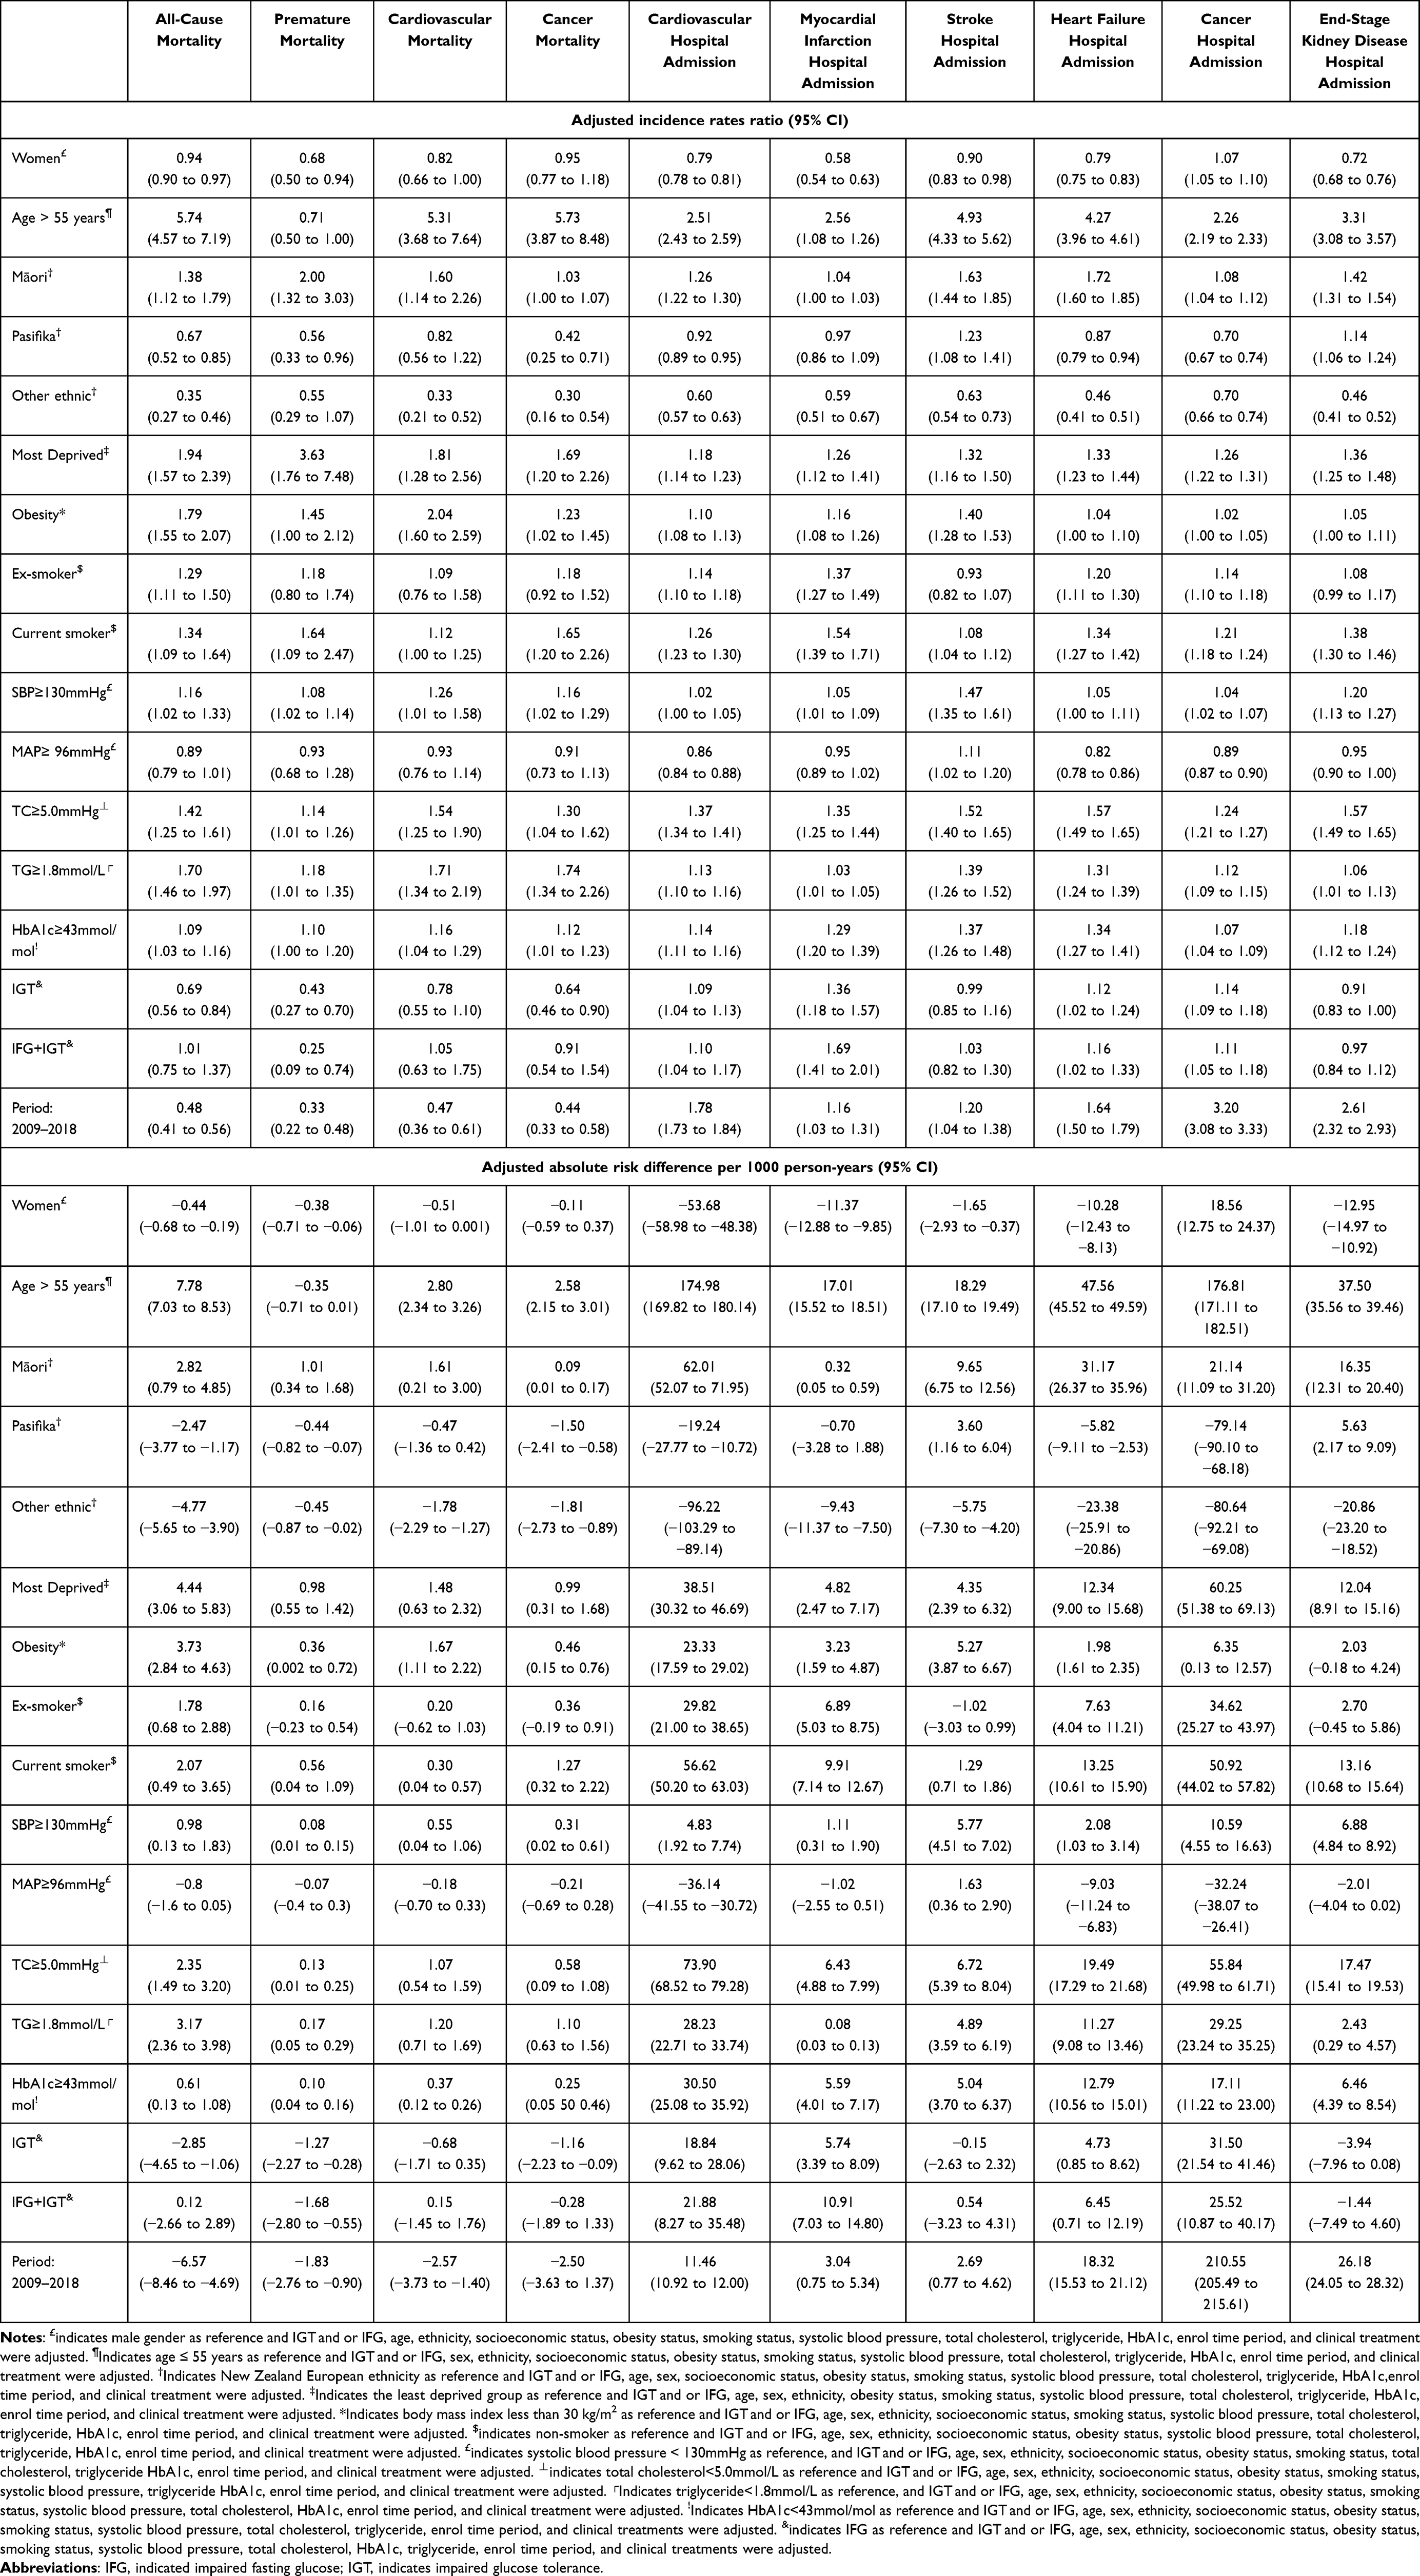 |
Table 2 Adjusted Incidence Rates Ratio and Absolute Risk Differences for Clinical Outcomes in Patients with Impaired Glucose Tolerance and/or Impaired Fasting Glucose in New Zealand Between 1994–2018 |
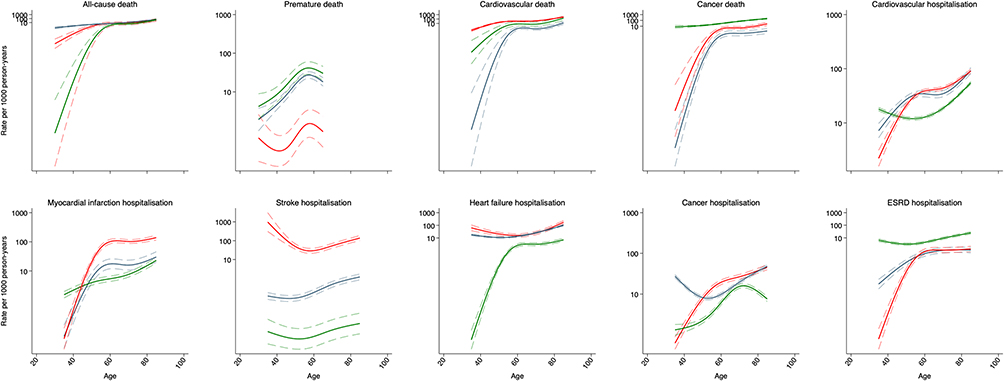 |
Figure 3 Adjusted incidence rate (per 1000 person-years) of clinical outcomes in patients having impaired glucose tolerance, impaired fasting glucose or both between 1994 and 2018. Patients were aged 30–85 years. Period and birth cohort effects were adjusted by use of age-period-cohort models. Solid lines indicate point estimations and shaded areas indicate the 95% CIs. Green, blue, and red line indicates IFG, IGT and IFG+IGT, respectively. IFG indicated impaired fasting glucose. IGT indicates impaired glucose tolerance. |
Consistent socioeconomic inequalities in clinical outcomes were observed. Patients from the most deprived group were more likely to experience higher adjusted risks for each clinical outcome when contrasted with those from the least deprived group. Gender-based differences were apparent as well; women had a lower adjusted risk for most outcomes, with the exception of cancer mortality. Age disparities were also evident; patients over 55 years of age, in comparison to those 55 years and younger, were generally at a higher risk for most outcomes except for premature mortality. Compared with NZE patients, Māori patients had a greater risk of each outcome, while Pasifika patients had a reduced risk of all-cause, premature, cancer mortality, as well as for hospital admissions for cardiovascular diseases, heart failure, and cancer, yet they faced a higher risk of stroke and ESRD hospital admission. Patients from other ethnic groups had a lower risk of each outcome besides premature mortality (Table 2).
Each high-risk (vs low risk) group had a greater risk for each outcome, including those with obesity, currently smoking patients, patients with higher SBP, TC, TG, and HbA1c, and patients with lower MAP. Compared with the enrol time period 1994–2008, the adjusted risks for enrol time period 2009–2018 were lower for mortality but higher for hospitalizations (Table 3). Estimations between complete case analysis and imputed analysis are shown in Supplemental Table 3.
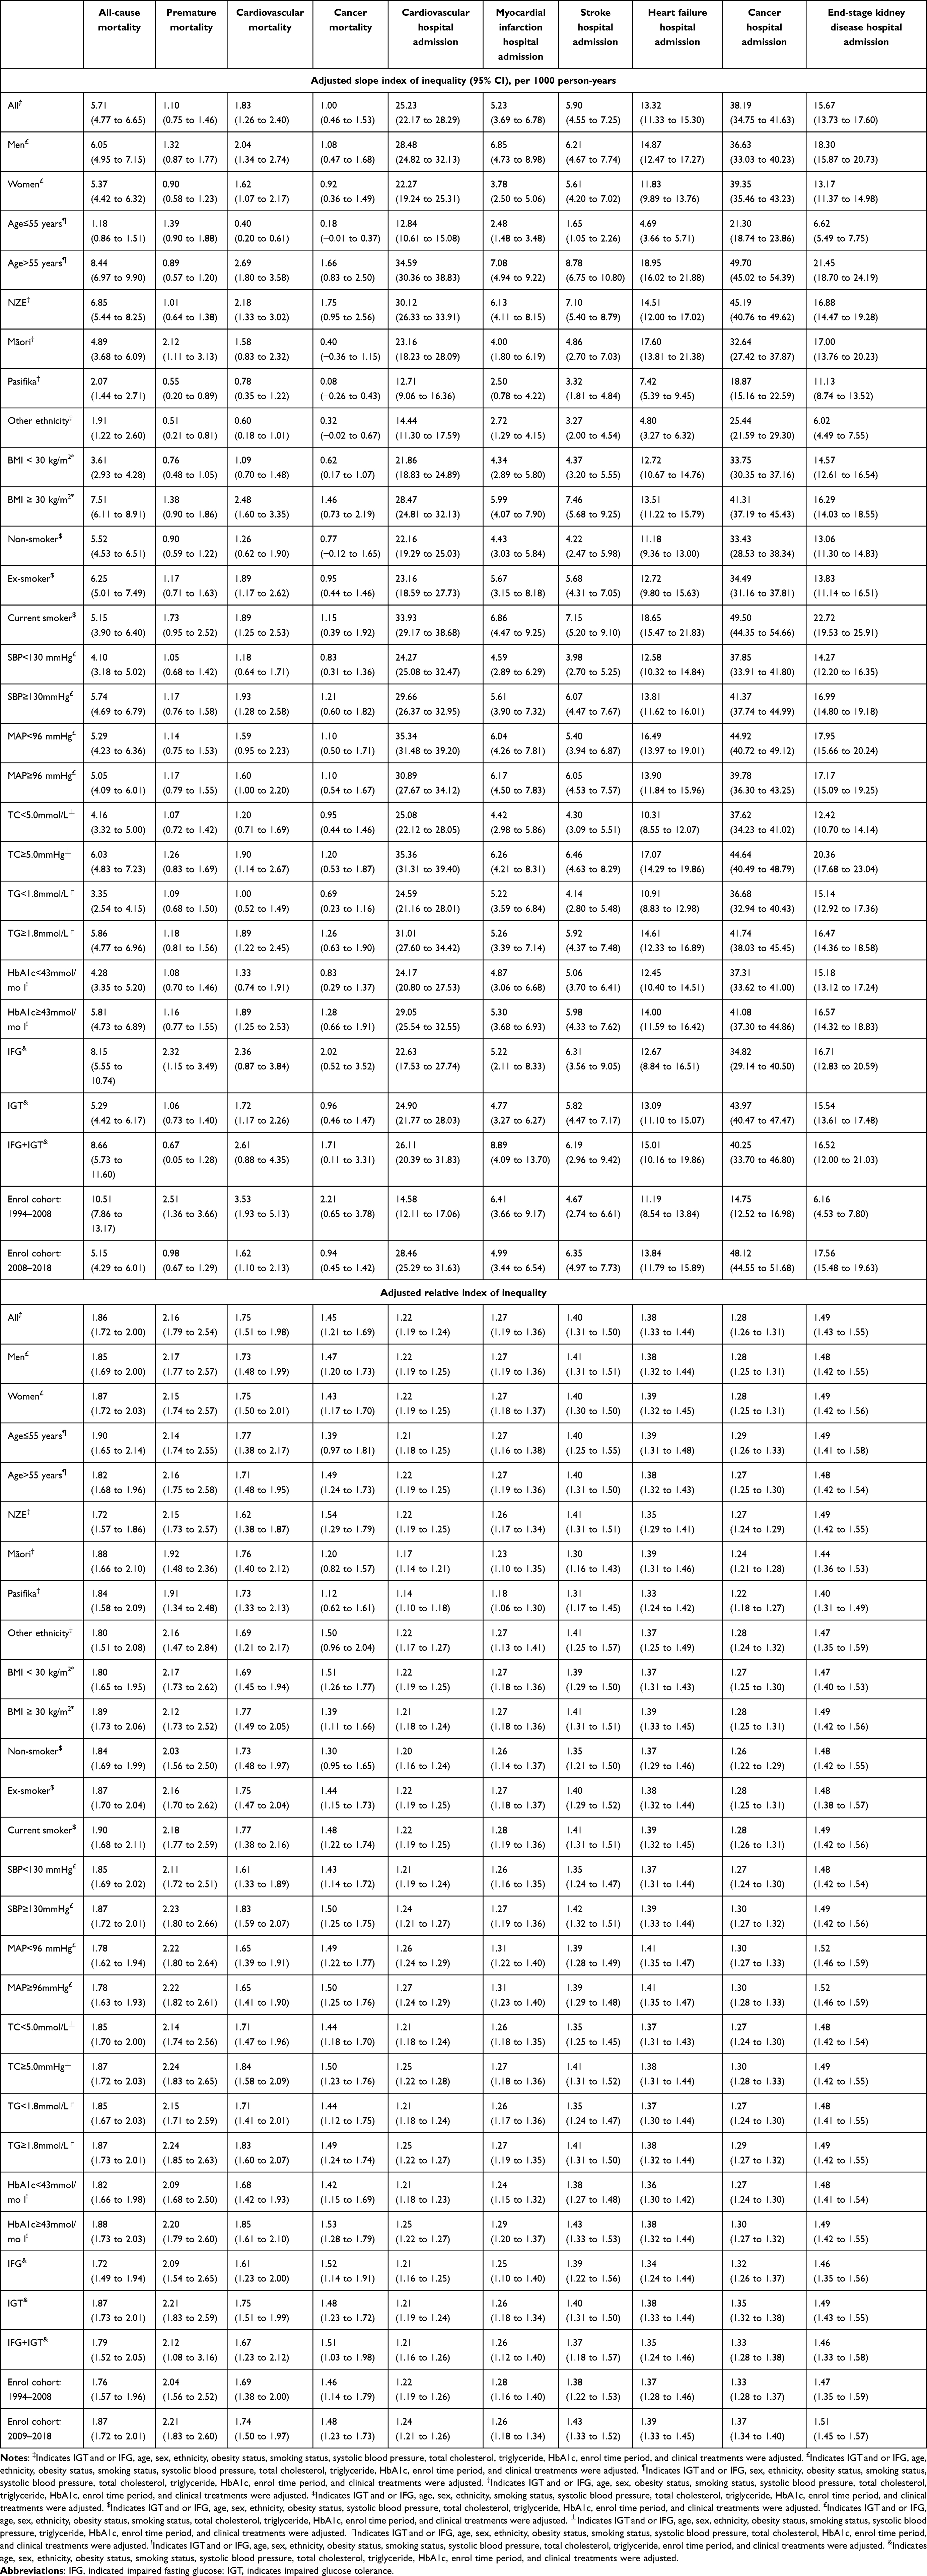 |
Table 3 Adjusted Slope and Relative Index of Inequality in Clinical Outcomes Among Patients with Impaired Glucose Tolerance and/or Impaired Fasting Glucose in New Zealand Between 1994 and 2018 |
Upon controlling for factors such as age, gender, ethnicity, obesity status, smoking habits, SBP, MAP, TC, TG, HbA1c, clinical treatments, enrol time period, and IGT and/or IFG, the persistent socioeconomic inequalities measured by SII and RII in each outcome were identified (Table 3). SII and RII in each outcome were widened in men, patients ≥55 years, NZE patients, patients with obesity, current smoking patients, patients with higher clinical measurements, and patients in the IFG+IGT group. Both SII and RII narrowed for mortality rates and widened for hospitalization rate in the enrol time period 2009–2018 compared with those in the enrol time period 1994–2008 except for myocardial infarction hospitalization, which narrowed in the enrol time period 2009–2018 (Table 3).
Discussion
Main Findings
Our study provides the first assessment for outcomes in patients with IGT and/or IFG in NZ between 1994 and 2018. Hospital admission for CVD, cancer, and ESRD in NZ population with IGT and/or IFG increased. In contrast, there was a decline in mortality rates, both overall and for specific causes, over the last 25 years. Greater mortality and hospitalization rates persisted over the 25 years among the older age groups, men, Māori patients, current smoking patients, patients with both IFG and IGT, and patients with greater metabolic disturbances on entry. Socioeconomic disparities persisted for each outcome over the 25 years and widened among those who were older patients, of NZE descent, currently smoking on entry and those with greater metabolic disturbances on entry. Although the case cohort was derived from New Zealand, particularly the steady findings related to the slope index of inequality, offer insights that could be used to project the health burden in this population and emphasize the importance of implementing population-level prevention strategies for individuals with IGT and/or IFG worldwide.
Strength and Limitation
The research boasts considerable strengths, being the most extensive cohort study on individuals with impaired fasting glucose and/or impaired glucose tolerance in New Zealand, encompassing a broad analysis of ten critical health outcomes over a quarter-century. The inclusion of all patients from the participating clinics ensures a comprehensive dataset. The tracking of all incident outcomes through national databases lends robustness and validity to the findings, including hospital admissions and mortality specific to certain causes. The clinical recording and diagnostic precision for these outcomes have been previously established for various health conditions, utilizing primary ICD codes known for their accuracy.7 The study encounters certain challenges due to the heterogeneity in the Māori, Pacific, European, Asian, and other ethnic groups within New Zealand, which introduces complexity in defining ethnicity when multiple ancestries are present and could lead to potential misclassification of self-reported factors like smoking habits. Additionally, the participating general practices, while capturing a substantial proportion of Pacific and Māori populations as well as European individuals potentially at higher risk of cardiovascular complications, may not fully mirror the socio-economic and ethnic diversity of the broader New Zealand population, particularly outside of the Auckland region.17
Metabolic measures were taken at the point of entry into the DCSS and may not capture lifetime exposure and varied degrees of exposure to risk factors like smoking. The Index of Multiple Deprivation (IMD), which is based on meshblocks of 81 households to gauge socio-economic status, might not accurately reflect the individual ethnic groups or the socio-economic status of a person and their family, as it is based on documented residency that could differ from actual living arrangements, especially for those who spend significant time living elsewhere within extended family settings. However, our prior research indicates that socio-economic status among the majority of DCSS cohort members has remained relatively stable from 2001 to 2016.11 The current study revealed elevated adjusted risks of outcomes in the population aged over 55 years, potentially influenced by estrogenic levels. However, estrogenic level data were unavailable in this study. Future research incorporating estrogenic data is warranted to thoroughly investigate the associations between age and outcomes.
The absence of family history or genetic factors related to CVD, cancer, and ESRD in the current study is a notable limitation. To comprehensively explore the associations identified, future studies incorporating data on family history or genetic variants related to the outcomes are warranted.
Interpretation and Implications
Previous studies have consistently demonstrated higher mortality rates among patients with prediabetes (IFG, or IGT, or defined by HbA1c), including elevated all-cause,5 cardiovascular,5,18 and cancer mortality.19 Notably, the Atherosclerosis Risk in Communities Study found individuals with prediabetes defined by HbA1c had notably higher all-cause and cardiovascular mortality rates,20 compared to our cohort. While our group, aged over 55 years in 2009–2018, experienced lower all-cause mortality (9.34/1000 person-years) and cardiovascular mortality (3.39/1000 person-years), disparities might be attributed to age, period effect and comorbidity difference between the two cohorts. Few researches have examined temporal trends in mortality of all-cause and cause-specific deaths in a specific population having IGT and/or IFG. Our study revealed a significant decrease in rates of all-cause, premature, cardiovascular, and cancer deaths over the past two decades, reflecting advancements in effective treatments for cardiovascular disease (eg, antihypertensive treatments and statin)21 and effective screening programs with early interventions for cancers.22
Previous extensive meta-analyses have delved into the distinct influences of IFG and IGT on CVD and all-cause death in comparison to people with normal glucose tolerance.23–25 Notably, the DECODA (Diabetes Epidemiology: Collaborative analysis of Diagnostic criteria in Asia) and DECODE (Diabetes Epidemiology: Collaborative analysis of Diagnostic criteria in Europe) studies have particularly pinpointed IGT, not IFG, as a significant indicator of CVD and all-cause mortality, independent of fasting blood glucose.23,24 The AusDiab study also found a correlation between IGT and all-cause mortality, whereas IFG was separately associated with all-cause and CVD mortality.26 Instead of extending this existing knowledge, our study focuses on a substantial, multi-ethnic population with IFG and/or IGT. It seeks to compare the risk of hospitalization between individuals with IFG and those with IGT, as well as those with IFG+IGT. Notably, our findings reveal that both individuals with IGT and those with combined IFG+IGT are at a heightened risk for cardiovascular hospitalization than those with IFG alone.
Few previous studies have addressed the trend in hospital admission rates in populations with IGT and/or IFG. Significant increases in each specific cause hospital admission rate were revealed by the present study. Likewise, only a handful of prior investigations have explored the variances in outcomes between male and female individuals within the distinct population groups exhibiting IGT and/or IFG across any duration. The current study revealed a 6% decrease in all-cause mortality risk and 32% decreased in premature mortality risk for women compared with men, after adjustment for covariates. No significant statistical difference in cardiovascular and cancer mortality between men and women was found. Lower risks of hospital admissions due to CVD, MI, stroke, heart failure, and ESRD were found in women compared with men after adjusting for covariates. Women had a 7% of increased risk of hospital admission (19/1000 person-years absolute risk difference) due to cancer. The mechanism behind this well-known sex difference for outcomes in patients with IFG and/or IGT includes clinical, behavioural, biological, endocrine, and socioeconomic factors that warrant further investigation.27 In a previous study on DCSS, higher rates of hospitalization and other complications were observed among the population with T2D, leading to a recommendation for integrated care and new anti-diabetes treatments.9 However, in this specific population with IGT and/or IFG, an increased incidence of adverse outcomes were also found. Use of metformin can reduce the progression from IGT to T2D, although lifestyle is generally more effective.28 However, health policymakers should also consider implementing strategies that support more intensive CVD reduction, including more attention to screening for incident T2D and CVD risk factors in people with IGT and/or IFG.
In the general NZ population, it has been estimated that about one in five deaths in NZ is directly attributable to smoking. Similarly, in the current study, increased risk of mortality and hospital admissions were found in current smoking patients compared with those non-smoking patients. However, only 14% of the cohort were current smokers on entry and while this proportion dropped over time, smoking cessation remains an important strategy for preventing CVD.29
A previous study has established that both Mean Arterial Pressure and Glycated Hemoglobin are significant indicators for cardiovascular hospitalizations in those with type 2 diabetes.30 In our analysis of individuals IGT and/or IFG, a reduced risk of clinical outcomes was noted in participants with a higher MAP within the type 2 diabetes subset. Associations were found between both high and low levels of HbA1c and an escalated risk of cardiovascular hospitalization. Particularly in the population with IGT and/or IFG, an increased risk was specifically tied to higher HbA1c levels, which aligns with previous observations in prediabetic individuals,31 underlining the critical role of glycemic management in this group.
Other studies in the general New Zealand population have uncovered a socioeconomic gradient in all-cause mortality, particularly between 2001 and 2004, for individuals aged 65 years and older, with the most deprived group experiencing higher rates of all-cause mortality when compared to their least deprived counterparts.32 Few studies have addressed this issue in the specific population with IGT and/or IFG over an extended period. In our study, with adjustment of covariates, 1.94-fold of all-cause mortality risk among the most deprived group was revealed with reference to the least deprived group between 1994 and 2018. Significant socioeconomic disparity in mortality and hospital admission was also identified in the population with IGT and/or IFG by the current study.
Socioeconomic inequalities in health were measured by directly comparing the health outcomes between the least and the most deprived group without considering the population structure by socioeconomic levels. The SII and RII as the population-weighted and regression-based measurements used in the current study overcame this problem. Furthermore, instead of using the raw or standardized rates, SII and RII were estimated based on multi-covariates adjusted rates.
The adjusted SII revealed the persistent overall socioeconomic inequality in all clinical outcomes in the population with IGT and/or IFG, which was narrowed in recent years for mortality and significantly widened for hospital admissions. Across ethnic groups, the widened socioeconomic inequalities were very common in NZE for most outcomes except premature mortality. Socioeconomic inequality in outcomes also widened in men, elder group, obese patients, current smoking patients, and patients with higher levels of clinical measurements. Based on the current findings, health equality national policies might need to pay more attention to the population with IGT and/or IFG.
Conclusion
In conclusion, over the past two decades, mortality has decreased and hospital admission increased in the NZ population with IGT and/or IFG. The long-standing socioeconomic inequalities in mortality and hospital admissions within the NZ population with IGT and/or IFG are a significant and ongoing public health issue.
The gap in mortality and hospital admissions due to socioeconomic disparities has notably widened among older adults, male individuals, those who smoke, and those with both IFG and IGT, as well as those presenting with significant metabolic imbalances. The ongoing nature of these disparities in clinical outcomes indicates a need for foundational lifestyle interventions aimed at halting the progression to type 2 diabetes within this specific cohort, particularly among those from socio-economically disadvantaged groups. Additionally, there is a need for improved cardiovascular management for individuals with IGT and/or IFG who have already developed type 2 diabetes.
Acknowledgments
The authors thank the participating GPs, audit nurses, and the DCSS executive group for their invaluable support.
Funding
The DCSS was funded by the New Zealand Ministry of Health through Counties Manukau District Health Board. The funders had no role in the study design, data collection, data analysis, data interpretation, or writing of the report.
Disclosure
The authors declare that they have no competing interests.
References
1. Vas PRJ, Alberti D, Edmonds ME. Prediabetes: moving away from a glucocentric definition. Lancet Diabetes Endocrinol. 2017;5(11):848–849. doi:10.1016/S2213-8587(17)30234-6
2. Tabak AG, Herder C, Rathmann W, Brunner EJ, Kivimaki M. Prediabetes: a high-risk state for diabetes development. Lancet. 2012;379(9833):2279–2290. doi:10.1016/S0140-6736(12)60283-9
3. Beulens J, Rutters F, Ryden L, et al. Risk and management of pre-diabetes. Eur J Prev Cardiol. 2019;26(2_suppl):47–54. doi:10.1177/2047487319880041
4. Coppell KJ, Mann JI, Williams SM, et al. Prevalence of diagnosed and undiagnosed diabetes and prediabetes in New Zealand: findings from the 2008/09 Adult Nutrition Survey. N Z Med J. 2013;126(1370):23–42.
5. Cai X, Zhang Y, Li M, et al. Association between prediabetes and risk of all cause mortality and cardiovascular disease: updated meta-analysis. BMJ. 2020;370:m2297. doi:10.1136/bmj.m2297
6. Mackenbach JP, Valverde JR, Bopp M, et al. Determinants of inequalities in life expectancy: an international comparative study of eight risk factors. Lancet Public Health. 2019;4(10):e529–e537. doi:10.1016/S2468-2667(19)30147-1
7. Yu D, Zhao Z, Osuagwu UL, et al. Ethnic differences in mortality and hospital admission rates between Maori, Pacific, and European New Zealanders with type 2 diabetes between 1994 and 2018: a retrospective, population-based, longitudinal cohort study. Lancet Glob Health. 2021;9(2):e209–e217. doi:10.1016/S2214-109X(20)30412-5
8. Robinson T, Simmons D, Scott D, et al. Ethnic differences in Type 2 diabetes care and outcomes in Auckland: a multiethnic community in New Zealand. N Z Med J. 2006;119(1235):U1997.
9. Simmons D, Kirkwood M, Maxwell S, Weblemoe T, Gatland BA, Richards D. Community networking as a means for identifying people with diabetes in a rural, predominantly bicultural community in New Zealand. N Z Med J. 1999;112(1096):361–363.
10. Simmons D, Fleming CE, Cutfield R, Patel A, Innes J, Wellingham J. The diabetes care support service for general practitioners in Auckland. N Z Med J. 1997;110(1038):48–50.
11. Cosentino F, Grant PJ, Aboyans V, et al. 2019 ESC guidelines on diabetes, pre-diabetes, and cardiovascular diseases developed in collaboration with the EASD. Eur Heart J. 2020;41(2):255–323. doi:10.1093/eurheartj/ehz486
12. Atkinson J, Salmond C, Crampton P. NZDep2013 index of deprivation. Available from: https://www.otago.ac.nz/wellington/otago069936.pdf.
13. Carstensen B. Age-period-cohort models for the Lexis diagram. Stat Med. 2007;26(15):3018–3045. doi:10.1002/sim.2764
14. Yu D, Jordan KP, Wilkie R, et al. Persistent inequalities in consultation incidence and prevalence of low back pain and osteoarthritis in England between 2004 and 2019. Rheumatol Adv Pract. 2022;7(1):rkac106. doi:10.1093/rap/rkac106
15. Regidor E. Measures of health inequalities: part 2. J Epidemiol Community Health. 2004;58(11):900–903. doi:10.1136/jech.2004.023036
16. Moreno-Betancur M, Latouche A, Menvielle G, Kunst AE, Rey G. Relative index of inequality and slope index of inequality: a structured regression framework for estimation. Epidemiology. 2015;26(4):518–527. doi:10.1097/EDE.0000000000000311
17. Yu D, Osuagwu UL, Pickering K, et al. Adverse clinical outcomes attributable to socioeconomic and ethnic disparities among people with type 2 diabetes in New Zealand between 1994–2018: a multiple linked cohort study. Clin Epidemiol. 2023;15:511–523. doi:10.2147/CLEP.S402307
18. Pavlovic A, Polovina M, Ristic A, et al. Long-term mortality is increased in patients with undetected prediabetes and type-2 diabetes hospitalized for worsening heart failure and reduced ejection fraction. Eur J Prev Cardiol. 2019;26(1):72–82. doi:10.1177/2047487318807767
19. Zhou XH, Qiao Q, Zethelius B, et al. Diabetes, prediabetes and cancer mortality. Diabetologia. 2010;53(9):1867–1876. doi:10.1007/s00125-010-1796-7
20. Tang O, Matsushita K, Coresh J, et al. Mortality implications of prediabetes and diabetes in older adults. Diabetes Care. 2020;43(2):382–388. doi:10.2337/dc19-1221
21. Mensah GA, Wei GS, Sorlie PD, et al. Decline in cardiovascular mortality: possible causes and implications. Circ Res. 2017;120(2):366–380. doi:10.1161/CIRCRESAHA.116.309115
22. Shieh Y, Eklund M, Sawaya GF, Black WC, Kramer BS, Esserman LJ. Population-based screening for cancer: hope and hype. Nat Rev Clin Oncol. 2016;13(9):550–565. doi:10.1038/nrclinonc.2016.50
23. DECODE Study Group, the European Diabetes Epidemiology Group. Glucose tolerance and cardiovascular mortality: comparison of fasting and 2-hour diagnostic criteria. Arch Intern Med. 2001;161(3):397–405. doi:10.1001/archinte.161.3.397
24. Nakagami T; DECODA Study Group. Hyperglycaemia and mortality from all causes and from cardiovascular disease in five populations of Asian origin. Diabetologia. 2004;47(3):385–394. doi:10.1007/s00125-004-1334-6
25. Coutinho M, Gerstein HC, Wang Y, Yusuf S. The relationship between glucose and incident cardiovascular events. A metaregression analysis of published data from 20 studies of 95,783 individuals followed for 12.4 years. Diabetes Care. 1999;22(2):233–240. doi:10.2337/diacare.22.2.233
26. Barr EL, Zimmet PZ, Welborn TA, et al. Risk of cardiovascular and all-cause mortality in individuals with diabetes mellitus, impaired fasting glucose, and impaired glucose tolerance: the Australian Diabetes, Obesity, and Lifestyle Study (AusDiab). Circulation. 2007;116(2):151–157. doi:10.1161/CIRCULATIONAHA.106.685628
27. Harreiter J, Fadl H, Kautzky-Willer A, Simmons D. Do women with diabetes need more intensive action for cardiovascular reduction than men with diabetes? Curr Diab Rep. 2020;20(11):61–62. doi:10.1007/s11892-020-01348-2
28. Knowler WC, Barrett-Connor E, Fowler SE, et al. Reduction in the incidence of type 2 diabetes with lifestyle intervention or metformin. N Engl J Med. 2002;346(6):393–403. doi:10.1056/NEJMoa012512
29. Hackshaw A, Morris JK, Boniface S, Tang J, Milenkovic D. Low cigarette consumption and risk of coronary heart disease and stroke: meta-analysis of 141 cohort studies in 55 study reports. BMJ. 2018;360:j5855. doi:10.1136/bmj.j5855
30. Yu D, Zhao Z, Simmons D. Interaction between mean arterial pressure and HbA1c in prediction of cardiovascular disease hospitalisation: a population-based case-control study. J Diabetes Res. 2016;2016:8714745. doi:10.1155/2016/8714745
31. Vistisen D, Witte DR, Brunner EJ, et al. Risk of cardiovascular disease and death in individuals with prediabetes defined by different criteria: the Whitehall II study. Diabetes Care. 2018;41(4):899–906. doi:10.2337/dc17-2530
32. Jatrana S, Blakely T. Ethnic inequalities in mortality among the elderly in New Zealand. Aust N Z J Public Health. 2008;32(5):437–443. doi:10.1111/j.1753-6405.2008.00276.x
 © 2023 The Author(s). This work is published and licensed by Dove Medical Press Limited. The full terms of this license are available at https://www.dovepress.com/terms.php and incorporate the Creative Commons Attribution - Non Commercial (unported, v3.0) License.
By accessing the work you hereby accept the Terms. Non-commercial uses of the work are permitted without any further permission from Dove Medical Press Limited, provided the work is properly attributed. For permission for commercial use of this work, please see paragraphs 4.2 and 5 of our Terms.
© 2023 The Author(s). This work is published and licensed by Dove Medical Press Limited. The full terms of this license are available at https://www.dovepress.com/terms.php and incorporate the Creative Commons Attribution - Non Commercial (unported, v3.0) License.
By accessing the work you hereby accept the Terms. Non-commercial uses of the work are permitted without any further permission from Dove Medical Press Limited, provided the work is properly attributed. For permission for commercial use of this work, please see paragraphs 4.2 and 5 of our Terms.