")
Back to Journals » International Journal of Chronic Obstructive Pulmonary Disease » Volume 13
Health characteristics of patients with asthma, COPD and asthma–COPD overlap in the NHANES database
Authors Llanos JP , Ortega H , Germain G, Duh MS , Lafeuille MH, Tiggelaar S, Bell CF, Hahn B
Received 6 March 2018
Accepted for publication 23 July 2018
Published 12 September 2018 Volume 2018:13 Pages 2859—2868
DOI https://doi.org/10.2147/COPD.S167379
Checked for plagiarism Yes
Review by Single anonymous peer review
Peer reviewer comments 3
Editor who approved publication: Dr Richard Russell
Jean-Pierre Llanos,1 Hector Ortega,2 Guillaume Germain,3 Mei Sheng Duh,4 Marie-Helene Lafeuille,3 Sean Tiggelaar,3 Christopher F Bell1, Beth Hahn1
1US Medical Affairs, GSK, Research Triangle Park, NC, USA; 2US Medical Affairs, GSK, La Jolla, CA, USA; 3Groupe d’Analyse, Ltée, Montréal, QC, Canada; 4Analysis Group, Inc., Boston, MA, USA
Introduction: Asthma and COPD have overlapping characteristics. As there are limited data on whether asthma–COPD overlap (ACO) represents a distinct condition, this study aimed to determine the similarities and differences of ACO with asthma and COPD.
Methods: US population-based, cross-sectional study using National Health and Nutrition Examination Survey data (2009–2012) compared participants with ACO vs those with asthma or COPD, each as mutually exclusive disease states. Demographics, health status, disability/limitations, health care resource utilization, clinical characteristics, and peripheral blood eosinophil counts were analyzed.
Results: A total of 1,609, 479, and 299 participants with asthma, COPD, and ACO, respectively, were included. An age-matched asthma subgroup included 299 participants from the asthma group. Compared with asthma and COPD, participants with ACO had worse health status, increased disease burden, and more comorbid conditions. The ACO, vs age-matched asthma subgroup, had lower percent predicted prebronchodilator forced expiratory volume in 1 second (82.1% vs 88.0%; P=0.017). The ACO group had significantly more asthma attacks in the past year than the age-matched asthma subgroup (49.8% vs 38.4%; P<0.001). The ACO group had more participants with postbronchodilator forced expiratory volume in 1 second <80% predicted (52.1%) vs COPD (30.8%; P=0.003) and more participants with blood eosinophil counts ≥400 cells/µL (16.9%) vs COPD (9.5%; P=0.007) and the asthma subgroup (6.7%; P=0.014).
Conclusion: The ACO group represents an important subset of patients with chronic respiratory disease with an increased burden of disease over asthma and COPD individually. Early identification of this population will enable appropriate therapeutic interventions in a timely manner.
Keywords: lung function, health status, eosinophils, asthma attack, respiratory disease
Introduction
Both asthma and COPD are heterogeneous diseases.1,2 Participants with characteristics of both diseases are classified as having asthma–COPD overlap (ACO).3–5 The 2018 Global Initiative for Asthma (GINA) describes ACO as being characterized by persistent airflow limitation with several features of asthma (ie, current or historical variability of airway limitation, personal and/or family history of asthma, allergies, and symptoms that are partially but significantly reduced by treatment) and COPD (ie, age of onset ≥40 years, associated with progression, chest X-ray with severe hyperinflation, additional COPD-like changes, and comorbidities that contribute to impairment).1,6 Generally, participants with ACO experience more frequent exacerbations, poorer quality of life, more progressive lung function deterioration, and elevated health care utilization in comparison to asthma or COPD alone.1 It is acknowledged that ACO could consist of a number of separate clinical phenotypes; each characterized by different underlying mechanisms.1,7 For instance, participants could have a form of ACO that is more similar to asthma or COPD.8 In recognition of this, the term asthma–COPD overlap syndrome is no longer used in major consensus reports.1
There is currently a lack of evidence for the formulation of treatment guideline recommendations, such as GINA, for patients presenting with ACO. This is mainly due to clinical studies excluding participants meeting the description of ACO.1,7,9 To increase the evidence base for ACO, several studies have aimed to characterize ACO using national health survey data, including the Medical Expenditure Panel Survey (MEPS) in the US,10 the Danish National Patients Registry,11 and the West Sweden Asthma Study.12 While these studies have provided knowledge about the prevalence, patient characteristics, and health care utilization of ACO, they do not provide large datasets of clinical data for an in-depth characterization of ACO and its clinical differences and similarities to asthma and COPD.
The National Health and Nutrition Examination Survey (NHANES) is a nationally representative sample that captures data on self-reported illnesses and health status.13 NHANES provides a yearly representative sample of the US population of approximately 5,000 people, combining data from interviews and physical examinations, and represents a unique dataset for an increased understanding of ACO as compared with asthma and COPD.13 Using NHANES data, this study aimed to compare characteristics, including blood eosinophil counts, of participants with ACO to participants with asthma or COPD only.
Materials and methods
Study design
This was a US-based population, cross-sectional study (GSK ID: HO-16–17440) to evaluate individuals from 3 mutually exclusive cohorts: participants with asthma, COPD, and ACO. The study used deidentified data obtained from NHANES collected during 2 cycles: 2009–2010 and 2011–2012. The NHANES sub-datasets that were used for the study included the demographic, laboratory, physical examination, and questionnaire sub-datasets.
The NHANES database contains a nationally representative sample of the US population, using a four-stage probability sampling design to select its participants from the noninstitutionalized US population.14,15 The design consists of selecting primary sampling units (PSUs), dividing PSUs into segments, listing households within each segment, randomly drawing from the households, and, finally, randomly selecting individuals (within designated age–sex–race/ethnicity screening subdomains) from households. The NHANES data contained sample weights for each 2-year survey that considered oversampling and other potential issues, such as survey nonresponse, post-stratification, and sampling errors.
Information included in the database covers detailed demographic, socioeconomic, dietary, and health-related data including prescription drugs and laboratory measures, such as blood eosinophil counts. Participants with recent chest pain, problems with forceful expiration, the need for supplemental oxygen, recent heart attack, stroke, and tuberculosis exposure among others were excluded from the spirometry tests.
Ethics approval and informed consent
The study did not involve primary data collection, nor did it require access to identifiable personal information. As such, the study was exempt from Institutional Review Board review. The data was obtained secondarily from previously conducted National Health and Nutrition Examination Surveys in the United States. Those surveys each had their own separate Institutional Review Board approval process and the surveys are referenced in the manuscript. All data were deidentified, and thus informed consent was not required.
Participants
The initial inclusion criteria for the analysis included participants ≥12 years of age with ≥1 eosinophil count recorded in the NHANES laboratory dataset. Three mutually exclusive groups were defined within the analysis population as follows: 1) asthma: participants ≥12 years of age that a) reported ever being told by a doctor or other health professional that they had or still have asthma or b) had an episode of asthma or an asthma attack during the past 12 months; 2) COPD: participants ≥40 years of age that a) had spirometry-defined COPD using the 2016 Global Initiative for Chronic Obstructive Lung Disease16 clinical diagnosis standards, requiring participants to have a forced expiratory volume in 1 second (FEV1)/forced vital capacity (FVC) ratio <0.70 after inhaling β2-adrenergic bronchodilator medication, b) reported ever being told they had emphysema, or c) reported ever being told they had chronic bronchitis (smoking history was not used to define COPD); and 3) ACO: participants ≥40 years of age who met the clinical criteria for both asthma and COPD (at least 1 characteristic from each definition). An age-matched subgroup of the asthma group was also selected to ensure any differences between groups could not be attributed to age differences; the median age was used in age-matching. More specifically, propensity scores were calculated using a multivariable logistic regression model, in which the probability of being in the ACO group was modeled using age. Estimated propensity scores were divided in intervals of 2% (ie, calipers) based on percentiles of the propensity score distribution. Per caliper of 2%, all participants in the ACO group were matched 1:1 to participants in the asthma group by random selection without replacement. Participants were excluded from COPD spirometry testing if they had current chest pain or a physical problem with forceful expiration, were taking supplemental oxygen, had recent surgery of the eye, chest, or the abdomen; had a recent heart attack, stroke, tuberculosis exposure, or had recently coughed up blood. In addition, participants with a personal history of detached retina or a collapsed lung were also excluded.
Study cohort characteristics
The asthma, COPD, and ACO groups were compared according to demographic characteristics (including sex, age, and race); health status; disability/limitations; health care resource utilization (HCRU; including asthma exacerbations, doctor visits, hospital visits, or emergency room visits); clinical characteristics (comorbid conditions, respiratory health, questionnaire responses, and spirometry measures); and laboratory evaluations (peripheral blood eosinophil counts).
Statistical analysis
Descriptive statistics included mean, standard deviation, and median values for continuous data, and frequencies and proportions for categorical data. Statistical comparisons between groups of interest used χ2 tests for categorical variables and Student’s t-tests for continuous variables. All statistics and comparisons were weighted to account for the NHANES complex survey design. All statistical tests were 2-sided and were conducted using Statistical Analysis System (SAS) software, version 9.3 or later (SAS Institute, Cary, NC, USA).
Results
Study population and participant demographics
Data for 20,293 participants were collected. Of these, 13,089 participants were ≥12 years of age and had ≥1 blood eosinophil counts available. Within this population, 1,609 participants met the definition for asthma only, 479 for COPD only, and 299 for ACO (Figure 1). Table 1 shows the proportion of patients who met the asthma and COPD criteria for ACO.
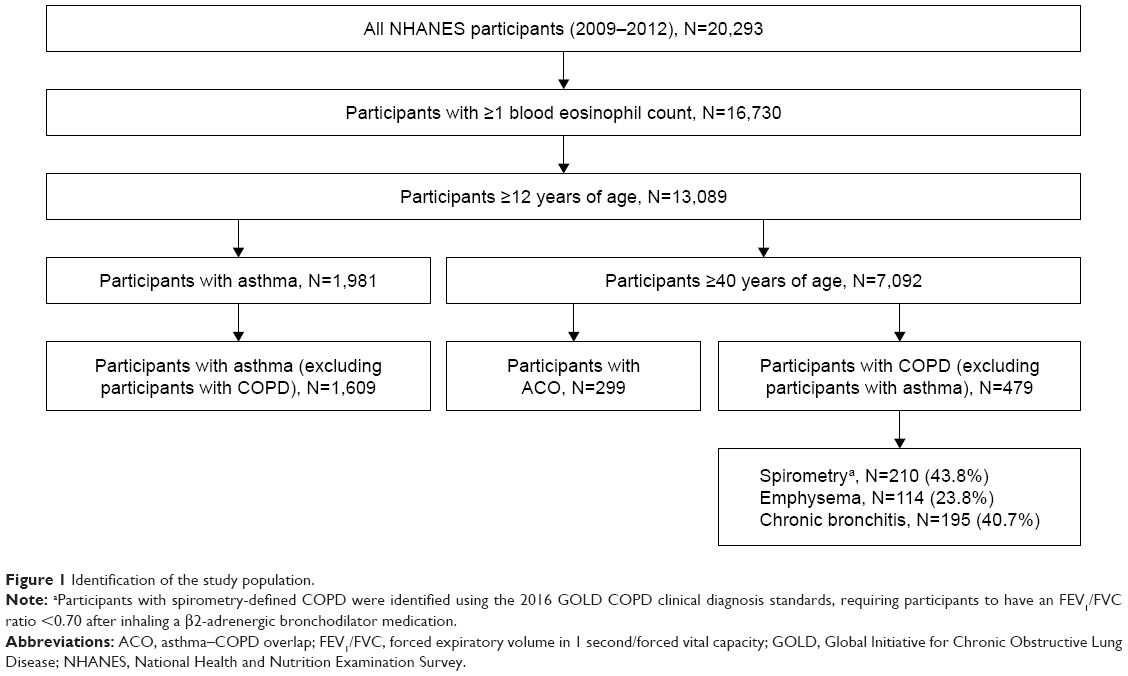 | Figure 1 Identification of the study population. |
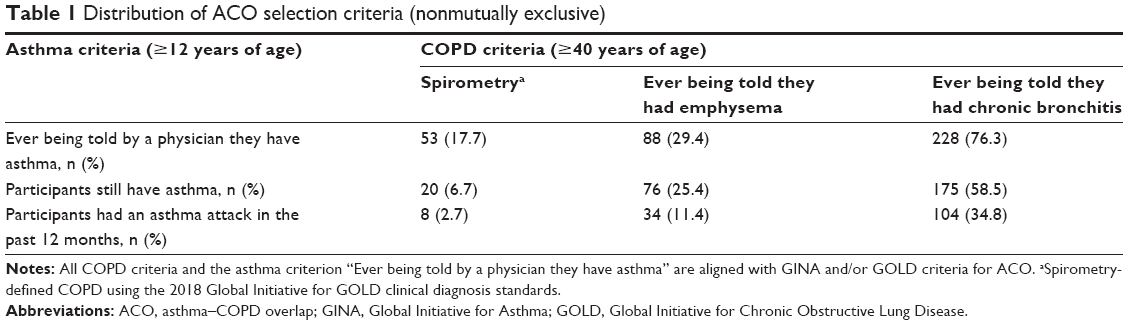 | Table 1 Distribution of ACO selection criteria (nonmutually exclusive) |
As expected, the mean age was significantly higher for the ACO vs the asthma group but similar to the COPD group. To enable comparisons across a standardized age, an asthma subgroup age-matched to the ACO group was also used and comprised 299 participants. The percentage of males in the ACO group was relatively similar to the asthma groups, but was significantly smaller vs the COPD group. Race composition differed between the ACO and the asthma groups, with the asthma group having fewer participants identified as White and more nonWhite races; however, it did not differ in the ACO group vs the asthma subgroup. Although body mass index (BMI) was clinically similar across the 3 groups, the slight increase in the ACO group was significant vs the asthma group but not significant vs the COPD group. The ACO group had a nonsignificant lower BMI vs the age-matched asthma subgroup. The asthma and COPD groups had a mean BMI within the overweight range, whereas the ACO group and asthma subgroup were within the obese range. The asthma subgroup had fewer participants with Medicare coverage vs the ACO group; however, Medicare coverage in the ACO group was similar to the COPD group (Table 2).
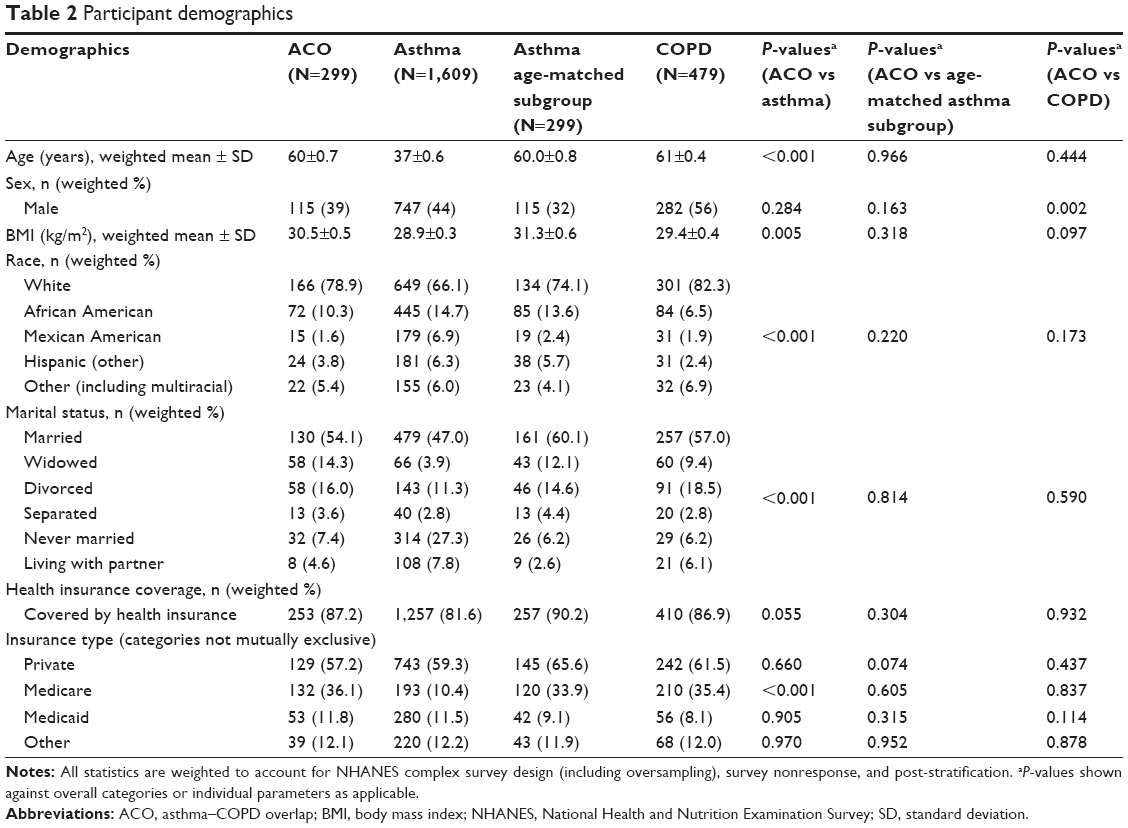 | Table 2 Participant demographics |
Health status and disease burden
The health status distributions between the ACO group vs the asthma and COPD groups were found to be significantly different; however, the differences between the ACO group and the asthma subgroup were not significant. More specifically, a greater proportion of the ACO group described their general health status as poor compared with the 2 asthma groups and the COPD group (Table 3). The ACO group also reported more days of poor physical health within the last 30 days, compared with all the other groups. A similar pattern was observed for days of inactivity due to poor physical/mental health within the last 30 days.
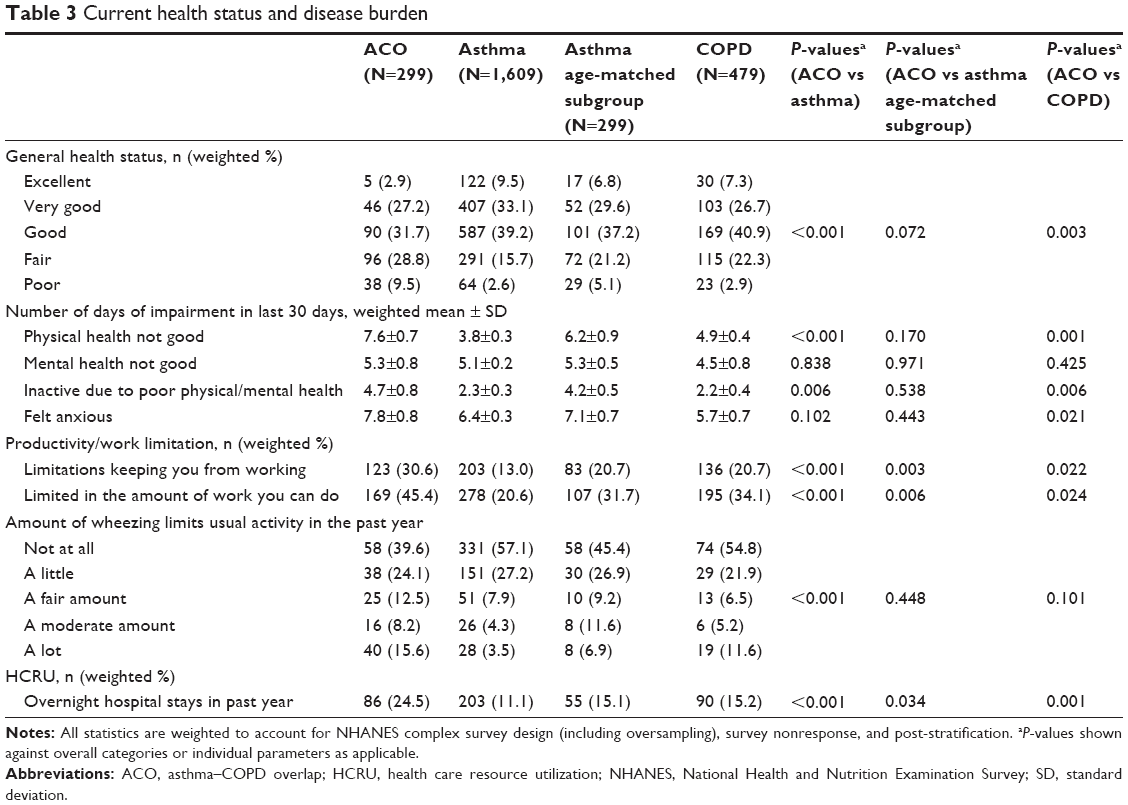 | Table 3 Current health status and disease burden |
Productivity was significantly lower in the ACO group than in any of the other groups (Table 3). In the ACO group, more participants reported limitations that kept them from working than participants with asthma (including the age-matched subgroup) or COPD. Moreover, participants with ACO were more limited in the amount of work they could do vs participants with asthma and COPD. Activity limitations due to wheezing/whistling were reported by a significantly higher proportion of participants in the ACO group than the asthma group; there was no difference in activity limitations due to wheezing/whistling in the ACO group vs the asthma subgroup.
Overall, the number of times that participants with ACO received health care in the past year was significantly higher than participants from the asthma and COPD groups compared with the ACO group (Figure 2). Of note, this difference was not significant for participants with ACO vs the asthma subgroup. Overnight hospital stays were experienced by significantly more participants with ACO than participants with asthma, including the asthma subgroup, or COPD.
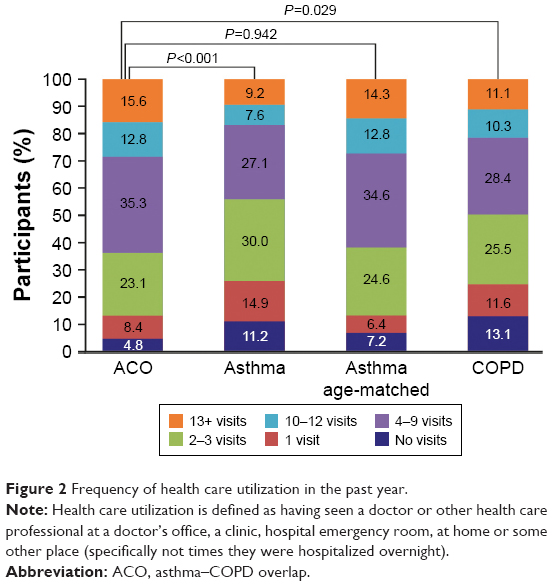 | Figure 2 Frequency of health care utilization in the past year. |
Clinical characteristics
Comorbid conditions, including diabetes, coronary heart disease, stroke, and kidney disease, were significantly more common in the ACO group compared with the asthma and COPD groups (Table 4). This was also the case for the asthma subgroup, with the exception of kidney disease. Hypertension was also more prevalent in the ACO group compared with all the other groups, although the difference was only significant for the asthma group.
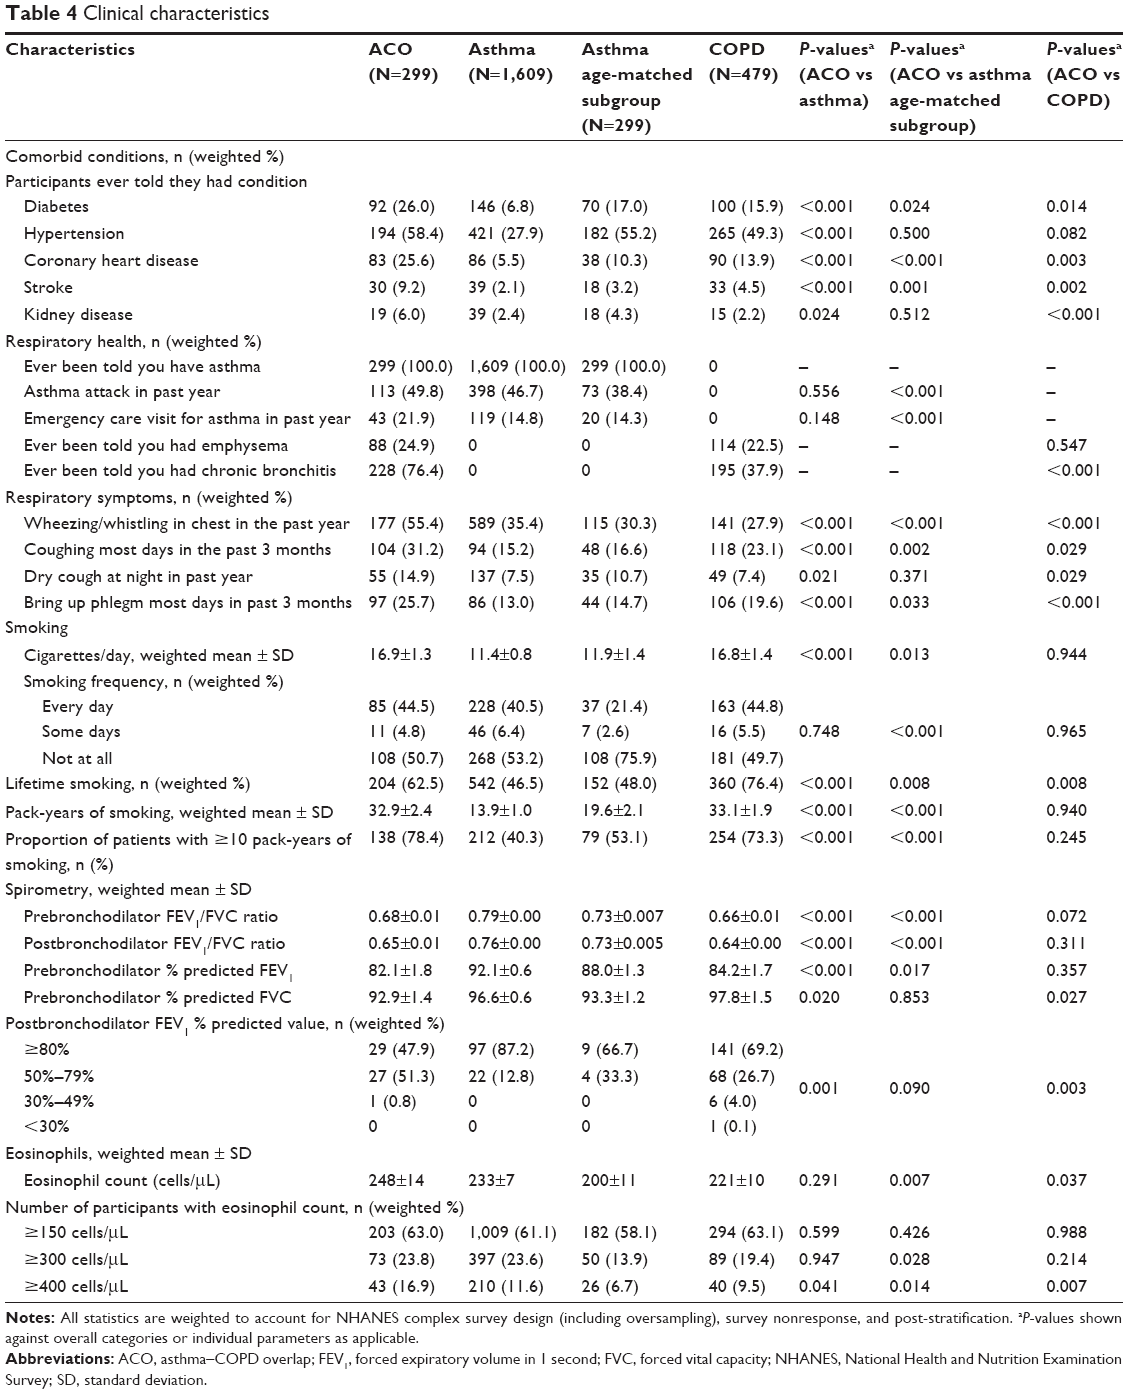 | Table 4 Clinical characteristics |
A greater proportion of the ACO group reported chronic bronchitis compared with the COPD group. Respiratory symptoms (wheezing/whistling, cough, and phlegm) were significantly more frequent in the ACO group than other groups (Table 4), with the exception of dry coughing at night, which although more frequent was not significantly different in the ACO group vs the asthma subgroup. Participants with ACO, on average, smoked significantly more cigarettes/day and had more pack-years than participants in the asthma group and in the asthma subgroup; however, there were no differences vs the COPD group. Of interest, mean airway reversibility was relatively similar across the 4 groups, 219 mL for ACO, 285 mL for the asthma group, 282 mL for the asthma subgroup, and 210 mL for the COPD group. The prebronchodilator percent predicted FEV1, a measure of airway obstruction, was lower in the ACO group than in the asthma group and asthma subgroup, but similar to the COPD group (Figure 3, Table 4). The prebronchodilator percent predicted FVC was lower in the ACO group than in all the other groups, although the difference was not significant vs the asthma subgroup.
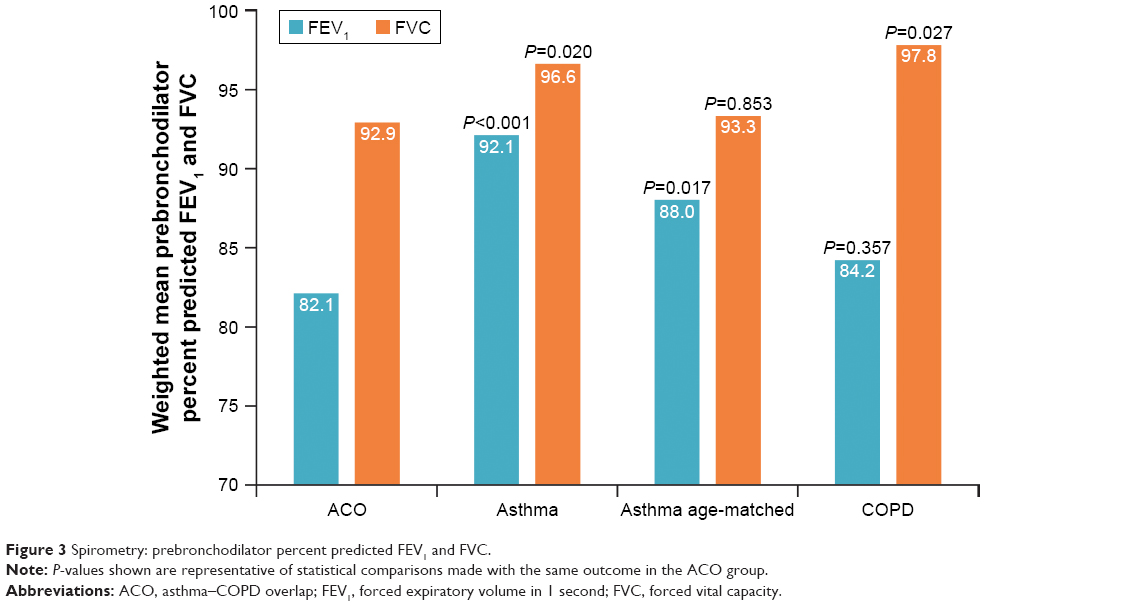 | Figure 3 Spirometry: prebronchodilator percent predicted FEV1 and FVC. |
Mean eosinophil counts did not differ significantly between the ACO and asthma groups, but were statistically significantly higher in the ACO group vs the COPD group and vs the asthma subgroup (Table 4). Furthermore, a significantly greater proportion of participants in the ACO group had eosinophil counts ≥400 cells/μL compared with either the asthma (including the asthma subgroup) or COPD groups (Table 4).
Discussion
Using data obtained from the NHANES survey collected between 2009 and 2012, this study found that participants with ACO had greater disease severity and burden, worse health status, more HCRU, lower lung function, and a higher proportion of comorbidities than participants with asthma or COPD. These results confirm those found in comparative studies from the US10,17,18 and 2 Scandinavian studies.11,12 While participants with ACO shared similarities with asthma and COPD, ACO did not appear to be more similar to 1 condition over the other. The results of the current study suggest that ACO represents an important subset of patients with chronic respiratory disease that is more severe than asthma or COPD alone.
Previous studies have shown that patients with ACO have poorer health status and an increased disease burden in comparison with patients with asthma or COPD alone.1,7,9 In this study, more participants with ACO than participants with asthma or COPD considered their health status poor, although the difference was not significant in the ACO group vs the asthma subgroup. Moreover, the ACO group had more HCRU and more overnight hospital stays in the prior year than the asthma or COPD groups; of note, there was no significant difference in the frequency of HCRU between the ACO group and the asthma subgroup. The COPD Gene Study and MEPS study also identified that patients with ACO had significantly worse health status, as measured by the St George’s Respiratory Questionnaire and Short Form 12, Version 2 Health Survey, respectively, than those with asthma or COPD only.10,17 Furthermore, the MEPS study also demonstrated that disease burden, measured by patient need for respiratory health care, was significantly increased in ACO compared with asthma and COPD.10 Although these studies used different measures to determine health status and disease burden than the current study, the similarity of the results between the 2 studies emphasizes the severity of ACO in comparison with asthma or COPD alone in the US population.
In this study, participants with ACO showed clinical characteristics of both asthma and COPD. In particular, participants with ACO experienced a number of symptoms common to COPD, including cough and phlegm and persistent airway limitation.2 However, more participants with ACO had moderate-to-very severe lung function (postbronchodilator FEV1 <80% predicted; 52.1%) compared with participants with COPD (30.8%). The ACO group also presented common features of asthma including similar proportion of participants with asthma attacks, airway reversibility after use of bronchodilators, and wheezing. Similar mixed asthma and COPD clinical features were observed in the cross-sectional West Sweden Asthma Study.12 These participants with ACO experienced signs of coughing, phlegm, and limited airflow along with signs of asthma, including recurrent and persistent wheezing.12 Together, the data indicate that ACO shares some characteristics of both COPD and asthma, yet has other characteristics indicating a disease burden that is greater than that found in the individual diseases alone.
Studies indicate that ACO is associated with an increased prevalence of comorbidities in comparison with asthma and COPD.19 Similar results were found in the current study; more participants with ACO had diabetes, coronary (ischemic) heart disease, stroke, and kidney disease than participants with asthma or COPD alone. The only exception was hypertension, which was similar between the ACO and COPD groups – affecting approximately 50% of participants. Previous studies have shown that hypertension is the most common comorbidity in COPD, occurring in more than half of patients2,20 and that prevalence rates of hypertension in ACO can reach 63%–66%.19 This suggests that patients with ACO may share the same propensity to cardiovascular disease as COPD.2 In contrast, only approximately 30% of the asthma group experienced hypertension. This may be due to age, as the younger participants in the asthma group (mean: 37 years) would be less likely to have age-associated comorbidities, such as hypertension,21 that would be found in the ACO and COPD groups with older participants (mean: 60–61 years). Indeed, the proportion of older patients in the asthma subgroup (mean age: 60 years) with hypertension was similar to those found in the ACO and COPD groups.
Exacerbation rates are associated with blood eosinophil counts, rising with increasing blood eosinophil counts in both asthma and COPD.22,23 This suggests that eosinophils are involved with the underlying pathological processes of asthma, COPD, and ACO.22,24–26 In this study, the ACO group had similar mean eosinophil counts to the asthma and COPD groups and a significantly higher count vs the asthma subgroup (Table 4). There was also a higher proportion of participants with blood eosinophil counts ≥400 cells/μL in the ACO group compared with all other groups (Table 4). This result suggests that eosinophils may underlie the increased frequency of severe exacerbations seen in ACO, at least in some individuals.17 Further investigation of the role of eosinophils in ACO may allow for more targeted disease management and guideline recommendations, which are valuable given the current disease burden of these patients.
The limitations of the current study derive primarily from the limitations of NHANES. As this study was cross-sectional, it only provides information on the COPD and asthma populations at a specific point in time, in the year prior to the survey. In this analysis, the number of times that participants with ACO received health care in the past year was significantly higher than participants from both asthma groups and the COPD group. Therefore, participants with ACO would be more likely to have additional conditions (comorbidities) or be exposed to additional treatments, than those with asthma or COPD. Consequently, causality cannot be assessed; therefore, the findings of the study may only be interpreted as correlations. Additionally, most data points collected by the NHANES are based on self-reports from the study participants and may be biased. The accuracy of the self-reported data was not verified or verifiable through medical records or other sources. As a result, the definitions used to classify these 3 groups could have underestimated the true prevalence of these conditions. The diagnostic criteria present in the NHANES survey questions do not cover the full criteria listed in the GINA guidelines; therefore, limited diagnostic criteria for COPD and asthma were used to inform a diagnosis of ACO in this study. Currently, there is no standardized definition for ACO; diagnostic criteria for ACO is an evolving concept that is under debate. The identification of groups was based on self-reported answers to the NHANES survey questions. Furthermore, the severity of disease was not assessed. Nonetheless, the criterion chronic bronchitis was used as one of the defining features of COPD in this study as the GINA guidelines identified it as a feature that favors a diagnosis of typical COPD over typical asthma. Finally, as this analysis only described characteristics for participants with ≥1 blood eosinophil result, there is a potential for selection bias for participants with severe disease for any given diagnostic as they may have had a more complete laboratory workup. However, this could also apply for all three diagnostics, and only 18% of participants were excluded due to missing or inexistent laboratory data.
Conclusion
Using the NHANES datasets, this study shows that ACO shares characteristics of both asthma and COPD, but is associated with greater disease burden and severity, worse health status, more HCRU, lower lung function, and higher incidence of comorbidities than asthma or COPD alone. The increased blood eosinophil counts in the ACO group relative to the asthma and COPD groups warrant further investigation. These results suggest that ACO represents an important subgroup that requires early identification and intervention with tailored therapies.
Acknowledgments
BH takes full responsibility for the data and analysis. Editorial support (in the form of writing assistance, including development of the initial draft, assembling tables and figures, collating authors comments, grammatical editing and referencing) was provided by Mary E Morgan, PhD, at Fishawack Indicia Ltd, UK, and was funded by GSK. This study was funded by GSK (HO-16-17440). Prior abstract publication/presentation: Hahn B, Lafeuille M-H, Bell C, Llanos J-P, Duh MS, Germain G, Tiggelaar S, Ortega H. Comparison of Health Characteristics in Subjects with Asthma, COPD and Asthma–COPD Overlap using the NHANES Database. CHEST 2017; 152 4 (Supplement): A816.
Author contributions
J-PL, HO, GG, MSD, M-HL, CFB, and BH contributed to the conception and/or design of the study. GG, MSD, and M-HL contributed to data acquisition. J-PL, GG, MSD, M-HL, CFB, and BH contributed to the data analysis and/or interpretation of the data. All authors contributed toward data analysis, drafting and revising the paper and agree to be accountable for all aspects of the work.
Disclosure
J-PL, HO, CFB, and BH are GSK employees and own stock in GSK. GG, MSD, and M-HL are employees of Analysis Group, Inc., a consulting company that has received research funds from GSK. The authors report no other conflicts of interest in this work.
References
Global Initiative for Asthma. Global Strategy for Asthma Management and Prevention; 2018. Available from: http://ginasthma.org/2018-gina-report-global-strategy-for-asthma-management-and-prevention/. Accessed March 2, 2018. | ||
Global Initiative for Chronic Obstructive Lung Disease. Global Strategy for the Diagnosis, Management and Prevention of Chronic Obstructive Pulmonary Disease. Gaithersberg, MD: GOLD; 2018. Available from: http://goldcopd.org/gold-reports/. Accessed March 2, 2018. | ||
Inoue H, Nagase T, Morita S, Yoshida A, Jinnai T, Ichinose M. Prevalence and characteristics of asthma-COPD overlap syndrome identified by a stepwise approach. Int J Chron Obstruct Pulmon Dis. 2017;12:1803–1810. | ||
Bonten TN, Kasteleyn MJ, de Mutsert R, et al. Defining asthma-COPD overlap syndrome: a population-based study. Eur Respir J. 2017;49(5):1602008. | ||
Jo YS, Lee J, Yoon HI, Kim DK, Yoo CG, Lee CH. Different prevalence and clinical characteristics of asthma-chronic obstructive pulmonary disease overlap syndrome according to accepted criteria. Ann Allergy Asthma Immunol. 2017;118(6):696.e1–703.e1. | ||
Global Initiative for Asthma and Global Initiative for Chronic Obstructive Lung Disease. Diagnosis of Diseases of Chronic Airflow Limitation: Asthma, COPD and Asthma-COPD Overlap Syndrome (ACOS); 2015. Available from: http://ginasthma.org/wp-content/uploads/2016/01/ACOS_2015.pdf. Accessed March 2, 2018. | ||
Woodruff PG, van den Berge M, Boucher RC, et al. American Thoracic Society/National Heart, Lung, and Blood Institute asthma-chronic obstructive pulmonary disease overlap workshop report. Am J Respir Crit Care Med. 2017;196(3):375–381. | ||
van den Berge M, Aalbers R. The asthma-COPD overlap syndrome: how is it defined and what are its clinical implications? J Asthma Allergy. 2016;9:27–35. | ||
Hines KL, Peebles RS Jr. Management of the asthma-COPD overlap syndrome (ACOS): a review of the evidence. Curr Allergy Asthma Rep. 2017;17(3):15. | ||
Vaz Fragoso CA, Murphy TE, Agogo GO, Allore HG, Mcavay GJ. Asthma-COPD overlap syndrome in the US: a prospective population-based analysis of patient-reported outcomes and health care utilization. Int J Chron Obstruct Pulmon Dis. 2017;12:517–527. | ||
Baarnes CB, Andersen ZJ, Tjønneland A, Ulrik CS. Incidence and long-term outcome of severe asthma-COPD overlap compared to asthma and COPD alone: a 35-year prospective study of 57,053 middle-aged adults. Int J Chron Obstruct Pulmon Dis. 2017;12:571–579. | ||
Ekerljung L, Mincheva R, Hagstad S, et al. Prevalence, clinical characteristics and morbidity of the Asthma-COPD overlap in a general population sample. J Asthma. 2018;55(5):461–469. | ||
National Center for Health Statistics. National Health and Nutrition Examination Survey: Overview; 2015–2016. Hyattsville, MD: National Center for Health Statistics. Available from: https://wwwn.cdc.gov/nchs/data/nhanes/2015-2016/documents/2015-16_NHANES_Overview.pdf. Accessed March 2, 2018. | ||
Curtin LR, Mohadjer LK, Dohrmann SM, et al. National Health and Nutrition Examination Survey: sample design, 2007–2010. Vital Health Stat 2. 2013;160:1–23. | ||
Johnson CL, Dohrmann SM, Burt VL, Mohadjer LK. National health and nutrition examination survey: sample design, 2011–2014. Vital Health Stat 2. 2014;162:1–33. | ||
Global Initiative for Chronic Obstructive Lung Disease. Global Strategy for Diagnosis, Management, and Prevention of COPD. Gaithersberg, MD: GOLD; 2016. Available from: http://goldcopd.org/global-strategy-diagnosis-management-prevention-copd-2016/. Accessed March 2, 2018. | ||
Hardin M, Silverman EK, Barr RG, et al. The clinical features of the overlap between COPD and asthma. Respir Res. 2011;12:127. | ||
Pleasants RA, Ohar JA, Croft JB, et al. Chronic obstructive pulmonary disease and asthma-patient characteristics and health impairment. COPD. 2014;11(3):256–266. | ||
Nielsen M, Bårnes CB, Ulrik CS. Clinical characteristics of the asthma-COPD overlap syndrome – a systematic review. Int J Chron Obstruct Pulmon Dis. 2015;10:1443–1454. | ||
Divo M, Cote C, de Torres JP, et al. Comorbidities and risk of mortality in patients with chronic obstructive pulmonary disease. Am J Respir Crit Care Med. 2012;186(2):155–161. | ||
Rodriguez BL, Labarthe DR, Huang B, Lopez-Gomez J. Rise of blood pressure with age. New evidence of population differences. Hypertension. 1994;24(6):779–785. | ||
Ortega HG, Yancey SW, Mayer B, et al. Severe eosinophilic asthma treated with mepolizumab stratified by baseline eosinophil thresholds: a secondary analysis of the DREAM and MENSA studies. Lancet Respir Med. 2016;4(7):549–556. | ||
Pavord ID, Chanez P, Criner GJ, et al. Mepolizumab for eosinophilic chronic obstructive pulmonary disease. N Engl J Med. 2017;377(17):1613–1629. | ||
Vedel-Krogh S, Nielsen SF, Lange P, Vestbo J, Nordestgaard BG. Blood eosinophils and exacerbations in chronic obstructive pulmonary disease. The Copenhagen General Population Study. Am J Respir Crit Care Med. 2016;193(9):965–974. | ||
Tran TN, Zeiger RS, Peters SP, et al. Overlap of atopic, eosinophilic, and TH2-high asthma phenotypes in a general population with current asthma. Ann Allergy Asthma Immunol. 2016;116(1):37–42. | ||
Goto T, Camargo CA Jr, Hasegawa K. Fractional exhaled nitric oxide levels in asthma-COPD overlap syndrome: analysis of the National Health and Nutrition Examination Survey, 2007–2012. Int J Chron Obstruct Pulmon Dis. 2016;11:2149–2155. |
 © 2018 The Author(s). This work is published and licensed by Dove Medical Press Limited. The full terms of this license are available at https://www.dovepress.com/terms.php and incorporate the Creative Commons Attribution - Non Commercial (unported, v3.0) License.
By accessing the work you hereby accept the Terms. Non-commercial uses of the work are permitted without any further permission from Dove Medical Press Limited, provided the work is properly attributed. For permission for commercial use of this work, please see paragraphs 4.2 and 5 of our Terms.
© 2018 The Author(s). This work is published and licensed by Dove Medical Press Limited. The full terms of this license are available at https://www.dovepress.com/terms.php and incorporate the Creative Commons Attribution - Non Commercial (unported, v3.0) License.
By accessing the work you hereby accept the Terms. Non-commercial uses of the work are permitted without any further permission from Dove Medical Press Limited, provided the work is properly attributed. For permission for commercial use of this work, please see paragraphs 4.2 and 5 of our Terms.