")
Back to Journals » Diabetes, Metabolic Syndrome and Obesity » Volume 15
Gut Microbiota Signature of Obese Adults Across Different Classifications
Authors Hu J , Guo P, Mao R, Ren Z, Wen J, Yang Q , Yan T, Yu J, Zhang T, Liu Y
Received 25 August 2022
Accepted for publication 28 October 2022
Published 29 December 2022 Volume 2022:15 Pages 3933—3947
DOI https://doi.org/10.2147/DMSO.S387523
Checked for plagiarism Yes
Review by Single anonymous peer review
Peer reviewer comments 2
Editor who approved publication: Dr Konstantinos Tziomalos
Junqing Hu,1,2,* Pengsen Guo,1,* Rui Mao,3,* Zhengyun Ren,1,4 Jun Wen,1,4 Qin Yang,1,5 Tong Yan,1 Jiahui Yu,1 Tongtong Zhang,1,2 Yanjun Liu1
1Center of Gastrointestinal and Minimally Invasive Surgery, Department of General Surgery, the Third People’s Hospital of Chengdu, Affiliated Hospital of Southwest Jiaotong University, Chengdu, People’s Republic of China; 2Medical Research Center, the Third People’s Hospital of Chengdu, Affiliated Hospital of Southwest Jiaotong University, Chengdu, People’s Republic of China; 3Department of Dermatology, Xiangya Hospital, Central South University, Changsha, People’s Republic of China; 4College of Medicine, Southwest Jiaotong University, Chengdu, People’s Republic of China; 5Department of General Surgery, the Third People’s Hospital of Chengdu, Affiliated Hospital of Southwest Jiaotong University, Chengdu, People’s Republic of China
*These authors contributed equally to this work
Correspondence: Tongtong Zhang, Center of Gastrointestinal and Minimally Invasive Surgery, Department of General Surgery, & Medical Research Center, the Third People’s Hospital of Chengdu, Chengdu, People’s Republic of China, Email [email protected]; Yanjun Liu, Center of Gastrointestinal and Minimally Invasive Surgery, Department of General Surgery, the Third People’s Hospital of Chengdu, No. 82, Qinglong Street, Qingyang District, Chengdu, 610031, People’s Republic of China, Emai l [email protected]
Purpose: Obesity is currently a major global public health issue. It has been shown by many that gut microbiota and microbial factors regulate the pathogenesis of obesity and metabolic abnormalities, but little is known about their roles in the different degrees of obesity. Here, we sought to investigate the microbial signatures of obesity of various severities.
Patients and Methods: We did this by characterizing the intestinal microbiome signature in a Chinese cohort of obese patients and healthy controls using 16S rRNA gene sequencing. To this end, obesity was sub-divided into four subgroups, including “Overweight”, Class I, Class II, and Class III obesity, based on body mass index (BMI).
Results: Microbial diversity decreased in obese subjects, and the reduction trend was correlated with the severity of obesity. We detected an expansion of Escherichia shigella in obese patients compared to healthy controls. The family Eubacterium coprostanoligenes and Tannerellaceae, the genera Eubacterium coprostanoligenes, Lachnospiraceae NK4A136, Parabacteroides, and Akkermansia, and the species Prevotella copri were microbial biomarkers of healthy people. Gammaproteobacteria and Enterobacterales were biomarkers of being “Overweight”. Erysipelatoclostridiaceae was a biomarker of Class I obesity. The class Bacilli and the order Lactobacillales were both biomarkers of Class II obesity. Negativicutes was a biomarker of Class III obesity. We further established relationships between this microbiome data and other biochemical data, including albumin, low-density lipoprotein (LDL), high-density lipoprotein (HDL), vitamin folic acid (FA) and vitamin B12 (VB12), and Interleukin-6 (IL-6) levels. Function prediction results showed a marked energy metabolism dysbiosis in obesity, especially in patients with Class III obesity.
Conclusion: These results suggested that people with different levels of obesity had distinct gut microbial signatures. Decreased microbial diversity, depletion of some specific taxa, and deviation in potential functions mirrored the severity of obesity in this cohort.
Keywords: body mass index, degree of obesity, fecal microbiota, 16S rRNA sequencing
Introduction
As a major modern global health issue, unhealthy weight such as overweight and obesity has been shown to be driven by multiple complex factors in China.1 Overweight and obesity have been evinced to contribute to 11.1% of deaths associated with non-communicable diseases (NCDs) in 2019, which in turn resulted in substantial national health expenditure for the management of NCDs (Institute for Health Metrics and Evaluation. http://ghdx.healthdata.org/gbd-results-tool [Accessed Dec 21, 2021]).2 Obesity is a complicated dysfunction of appetite regulation and energy metabolism regulated by unique biological factors. It is generally accepted that obesity in adults can be classified into 3 types (class I, II, and III), based on body mass index (BMI) cutoffs according to the National Heart, Lung, and Blood Institute (NHLBI, https://www.nhlbi.nih.gov/health/educational/lose_wt/BMI/bmi_dis.htm [accessed Dec 21, 2021]) and the World Health Organization (WHO).3 Unfortunately, similar definitions in China are lacking. With the degree or severity of obesity increasing in subjects, it can be estimated that the disease risk for type 2 diabetes (T2D), hypertension, cardiovascular diseases (CVD), and mortality will increase. These diseases are linked with deviations in gut microbiota, as is obesity.4 Thus, researchers have focused on excavating the microbiota traits from different severities of obese populations.
For years, significant evidence has indicated that gut microbiota, in particular bacteria, play a central role in human diseases and wellness, due to their huge genomic content and metabolic complement.4,5 The microbiota present in the human body now seems to have the potential to provide innovative biomarkers of many diseases, including obesity. Accordingly, characterizing microbial biomarkers from microbiota profiles has great potential for translational and precision medicine.6 The gut microbiome has been extensively studied over the past years with regards to obesity, while many works have only considered BMI classes in their study designs for distinguishing between obese, overweight, and lean subjects.7–9 Previous studies have reported that the gut microbiota in obese subjects were markedly worse than those in overweight and lean control subjects.7,9 However, to our knowledge, the gut microbiota alterations in subjects with different degrees of obesity have not yet been extensively studied.
In this context, we tested the hypothesis that the more severe obesity was, the worse the gut microbiota would be in a Chinese cohort as assessed by 16S rRNA metagenomic sequencing. Fecal samples were collected from normal and obese individuals. Obesity was further classified into “Overweight”, Class I, Class II, and Class III groups according to WHO criteria. Blood samples were also collected from obese patients to analyze obesity-related biochemical data and its association with microbiome profiles. Our results demonstrated the relationship of gut microbiota alterations to the severity of obesity and shed light on potential microbiome-focused strategies for the prevention or treatment of different degrees of obesity.
Materials and Methods
Study Participants and Design
According to the China National Nutrition and Health Survey (CNNHS) data, a BMI of ≥ 28 kg/m2 in Chinese adults indicates obesity.1 We studied fecal microbiota in 92 subjects including a total of 36 normal people and 56 obese patients whose ages ranged from 18 to 52 years. The obese patients were hospitalized patients (BMI ≥ 28 kg/m2) before bariatric surgery at the Third People’s Hospital of Chengdu, Chengdu, China between September 2019 and October 2020. Most of them presented obesity-related comorbidities, such as type 2 diabetes (10 / 56), hypertension (13 / 56), hyperuricemia (30 / 56), hyperlipoidemia (18 / 56), fatty liver (53 / 56), and obstructive sleep apnea syndrome (41 / 56). Normal control subjects were healthy volunteers. Subjects less than 18 years of age were excluded from this study. Fecal samples were collected and transported immediately to the laboratory and stored at −80°C. Blood was taken from obese patients in order to assess blood albumin, uric acid (UA), alanine aminotransferase (ALT), glycated hemoglobin (HbA1c), aspartate transaminase (AST), cholesterol, triglyceride (TG), folic acid (FA), high-density lipoprotein (HDL), low-density lipoprotein (LDL), homocysteine (Hcy), and creatinine (Cr) levels, in addition to other metrics (Table 1). Based on the BMI classification criteria of obesity from the WHO, we sub-grouped the obese subjects into “Overweight” (N = 6), Class I (N = 20), Class II (N = 14), and Class III (N = 16) (Table 1). Thus, we sought to gain a profound understanding of obesity-related microbiota.
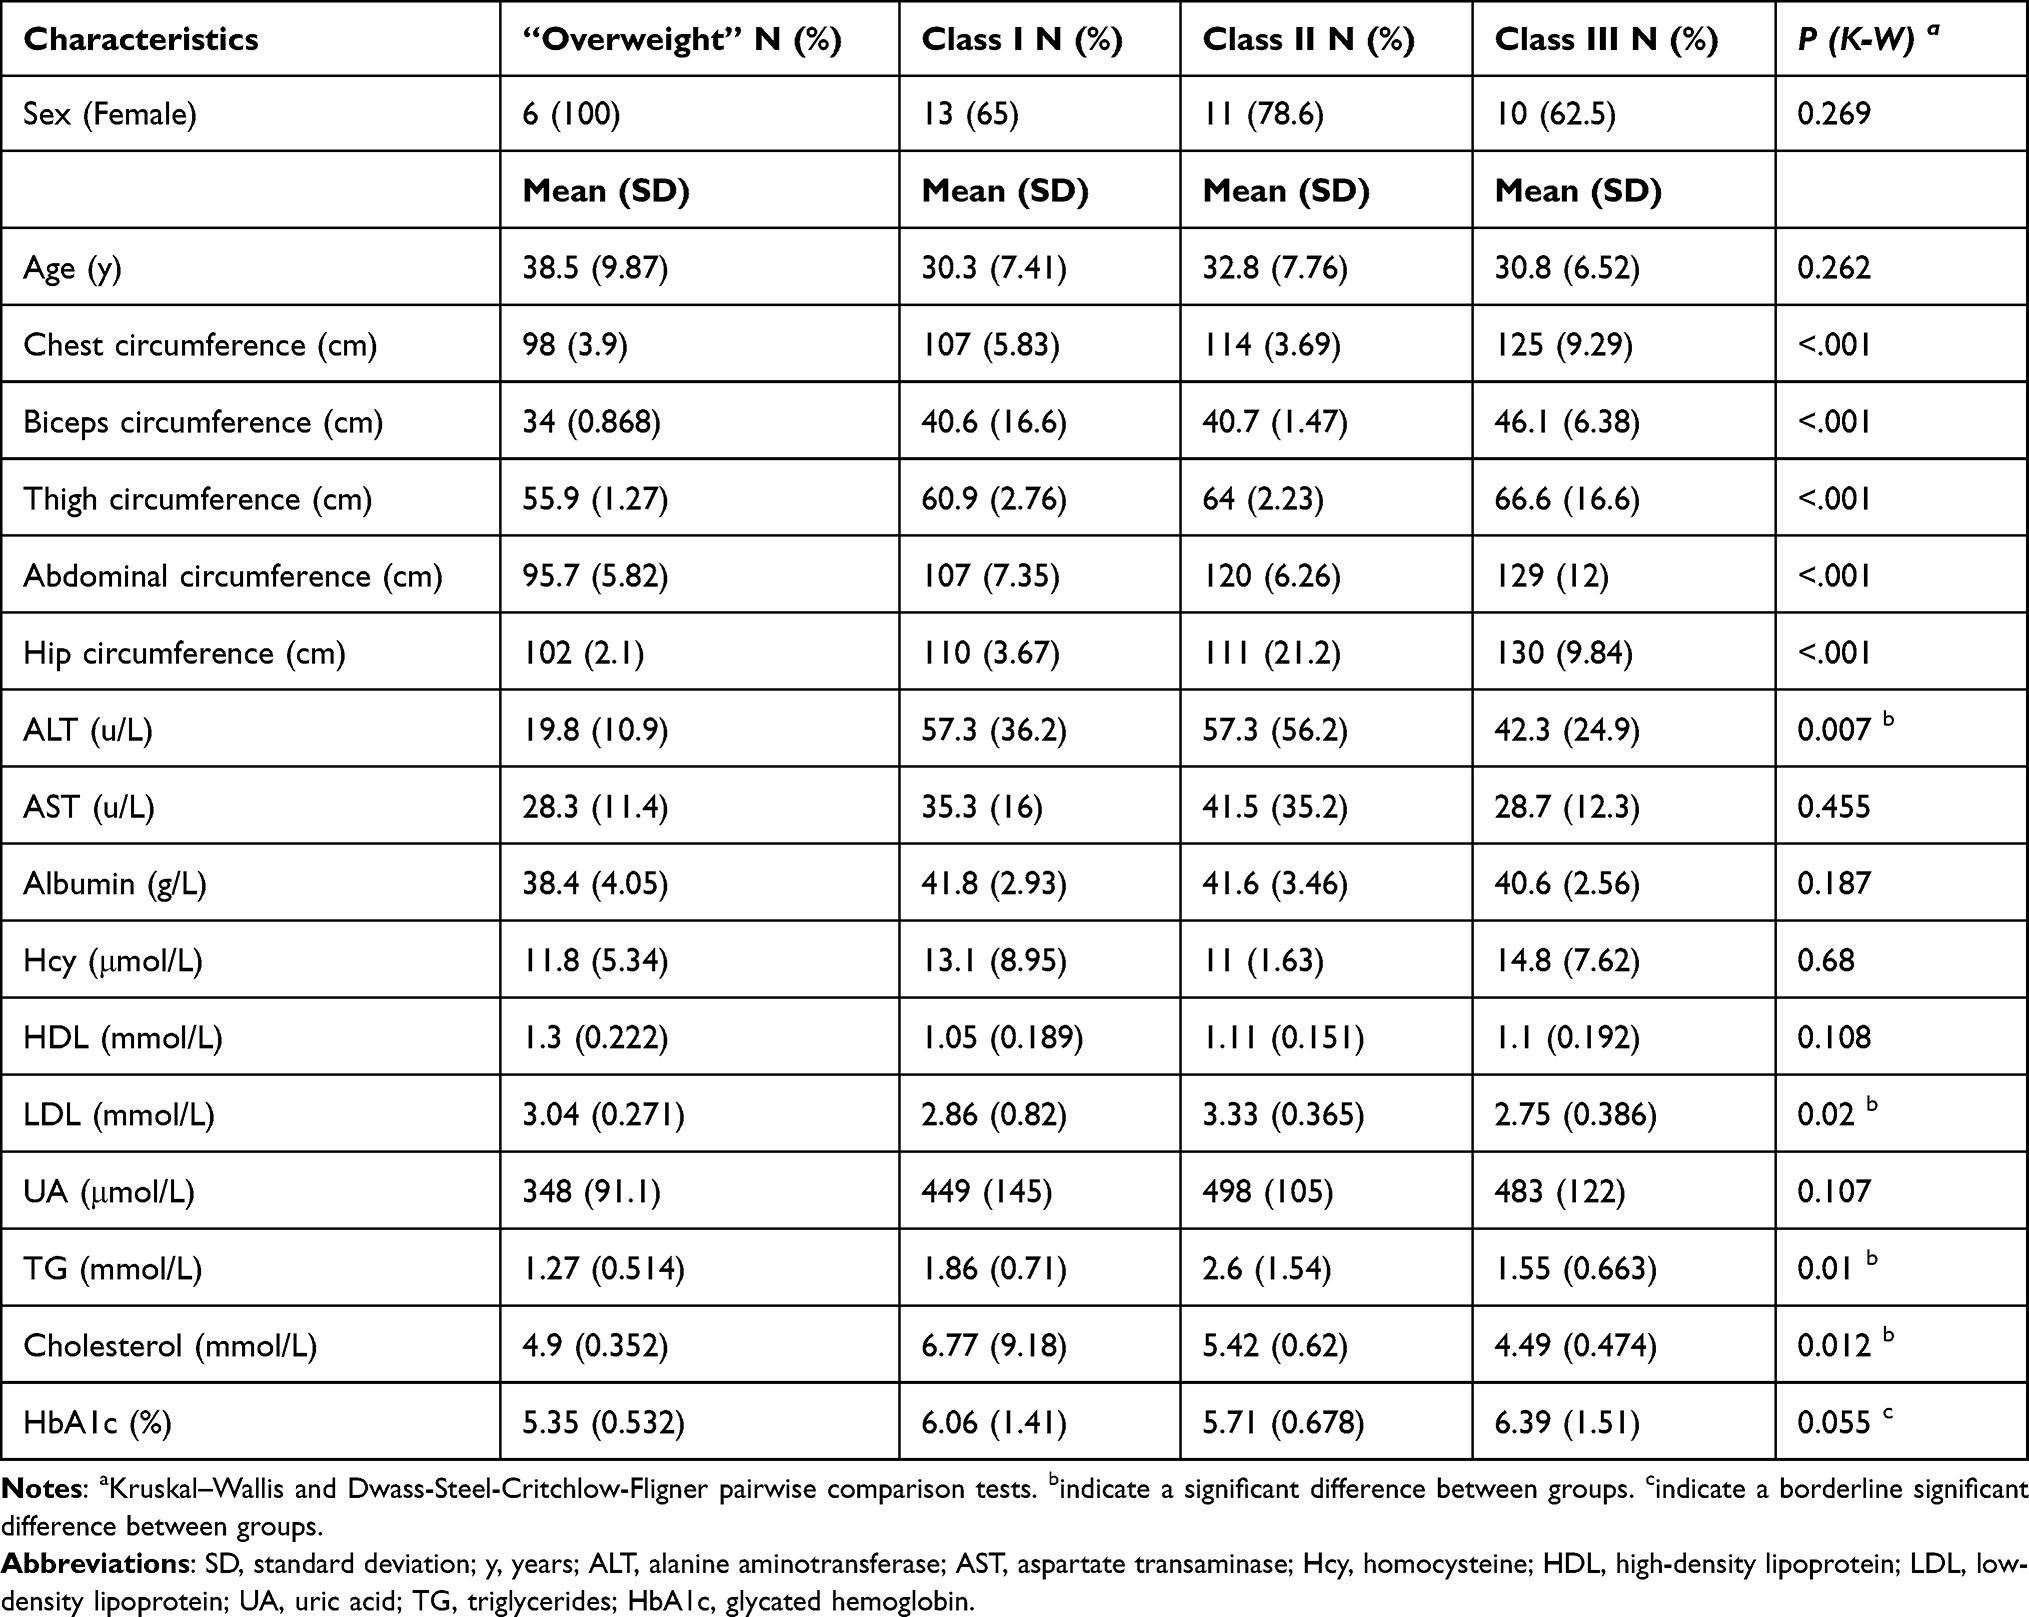 |
Table 1 Baseline Patient Characteristics by Obesity Category |
Ethics Approval
All content involving human participants in this research complies with the ethical standards of the Declaration of Helsinki. This study was approved by the Institutional Ethics Review Board of the Third People’s Hospital of Chengdu (record #: 2018S75; Chengdu, Sichuan, China), and was conducted following the Chinese ethical guidelines for human genome/gene research.
Fecal DNA Extraction and Sequencing
Total genome DNA from fecal samples was extracted using the hexadecyl trimethyl ammonium bromide (CTAB)/sodium dodecyl sulfate (SDS) method. DNA concentration and purity were monitored using 1% agarose gels. Based one concentration, DNAs were diluted to 1 ng/μL using sterile water. The 16S rRNA gene V3–V4 region was amplified using a specific primer (341F: CCTAYGGGRBGCASCAG; 806R: GGACTACNNGGGTATCTAAT) with unique barcodes. All PCR reactions used Phusion® High-Fidelity PCR Master Mix (New England Biolabs). Sequencing was performed on an Illumina HiSeq2500 platform and 250 bp paired-end reads were generated.
Microbial Data Processing and Analysis
Reads were processed and analyzed using QIIME 2 2022.210 and the R microeco package (v0.9.0) in R 4.1.011 (R Core Team 2021). Raw sequence data were demultiplexed and quality filtered using the q2‐demux plugin, followed by denoising with DADA212 (via q2‐dada2). All amplicon sequence variants (ASVs) were aligned with mafft13 (via q2‐alignment) and used to construct a phylogenic tree with fasttree214 (via q2‐phylogeny). For the taxonomic assignment, the weighted SILVA 138 99% OTUs classifier15 was used (via q2-feature-classifier).16 The file2meco package (https://github.com/ChiLiubio/file2meco) was used for data input from QIIME2. The PICRUSt2 (v2.5.0) (Phylogenetic Investigation of Communities by Reconstruction of Unobserved States) workflow was applied for the prediction of metagenome functions of microbiota.17 Correlation network was constructed using the weighted gene co-expression network analysis (WGCNA) method by microeco. Visualization of this network was conducted using Gephi (v0.9.2).18
Statistical Analysis
The differences in predicted function outcomes between the groups were compared using STAMP software v2.1.3 (https://beikolab.cs.dal.ca/software/STAMP). Two-sided Welch’s t-tests and Benjamini-Hochberg FDR correction were used for two-group analysis. A Kruskal–Wallis H-test with Tukey-Kramer post-hoc test and Eta-squared effect size (P < 0.001, Effect size > 0.40) were utilized for multiple group analysis. The other statistical analyses were included in microeco. The LDA score cutoff was set to 4.0 in LEfSe biomarkers analysis. The clinical data of obese patients was analyzed using the open-source software jamovi v2.2.5 with Kruskal–Wallis and Dwass-Steel-Critchlow-Fligner pairwise comparisons tests.
Results
General and Clinical Data on Obesity
There were no significant differences between the four obesity subgroups in terms of sex or age. Chest circumference, bicep circumference, thigh circumference, abdominal circumference, and hip circumference parameters were markedly different between the four groups. The clinical biochemical data, such as ALT, AST, HDL, LDL, UA, TG, cholesterol, and HbA1c levels are shown in Table 1 and Supplementary Table 1. The concentrations of ALT, LDL, TG, and Cholesterol differed significantly between these four groups. These results reflected a lipid metabolism dysfunction in the different degrees of obesity.
Alterations of Microbiota Pattern in Obese Subjects
We first assessed the microbial changes between healthy and obese subjects. The Shannon diversity was significantly decreased in obese subjects, which was accompanied by a very huge community structural shift as depicted by principal coordinate analysis (PCoA) of the unweighted Unifrac distance (Figure 1A and 1B, Supplementary Figure 1A). Next, to analyze the unique and shared features of healthy controls and obese patients, we performed a Venn analysis using groups at the ASV level. Notably, there were no shared ASVs, and the obesity and healthy individuals possessed 6336 (74%) and 10,373 (26%) unique ASVs, respectively (Figure 1C). Thus, we further analyzed the composition of unique ASVs at the species level, and the abundance of Citrobacter europaeus, Bacteroides ovatus, Bacteroides uniformis, Eubacterium rectale, Blautia wexlerae, Bacteroides vulgatus, and Prevotella copri divisions dominated the microbiota (Figure 1D). Interestingly, one genus, Escherichia shigella, was the sole microbial biomarker in obese subjects and three genera, Eubacterium coprostanoligenes, Lachnospiraceae NK4A136, and Parabacteroides in healthy subjects were identified by both LEfSe (Figure 1E) and random forest (RF) generation (Supplementary Figure 1B). Furthermore, the potential beneficial microbiota Akkermansia, Prevotella, and Butyricicoccus were microbial markers in healthy controls based on RF outcomes (Supplementary Figure 1B).
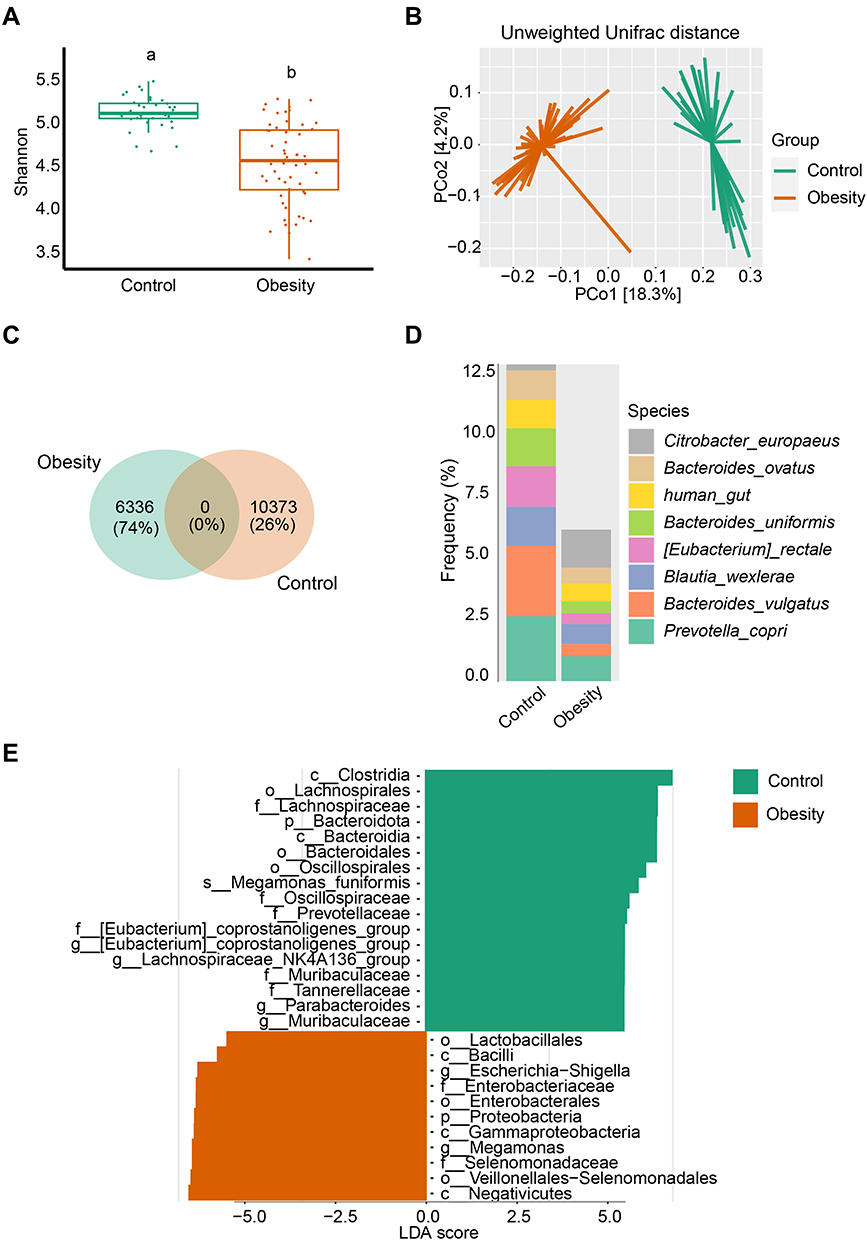 |
Figure 1 Marked microbiota dysbiosis in obesity. (A) Microbial diversity was estimated based on Shannon index in healthy controls (n = 36) and obese (n = 56) subgroups. Different lowercase letters indicate significant differences (P < 0.05). (B) Based on the Unweighted Unifrac distance, PCoA was used to show beta diversity between the groups. (C) Venn diagram of shared or unique ASVs between healthy controls and obese patients. (D) Relative frequency of the top 8 species in the healthy control and obesity subgroups. (E) Microbial biomarker analysis between the groups by Linear discriminant analysis effect size (LEfSe) analysis, LDA score > 4.0. |
Characterization of Microbiota in Various Severities of Obesity
As shown in Figure 2A, in considering of the degree of obesity, the microbial alpha diversity reduced as the severity of obesity increased. The Class III group ranked lowest in Shannon diversity. Except for the Class I and “Overweight” groups, the Class II and Class III groups showed no statistical difference, while the other paired groups showed a significant difference in terms of their Shannon index. PCoA of the unweighted Unifrac distances also demonstrated that the degree of obesity shifted the community structure, although the “Overweight” group showed no difference compared to the Class I, Class II, and Class III groups (Figure 2B, Supplementary Figure 2A). These results demonstrated that the degree of obesity had a profound effect on microbial community diversity.
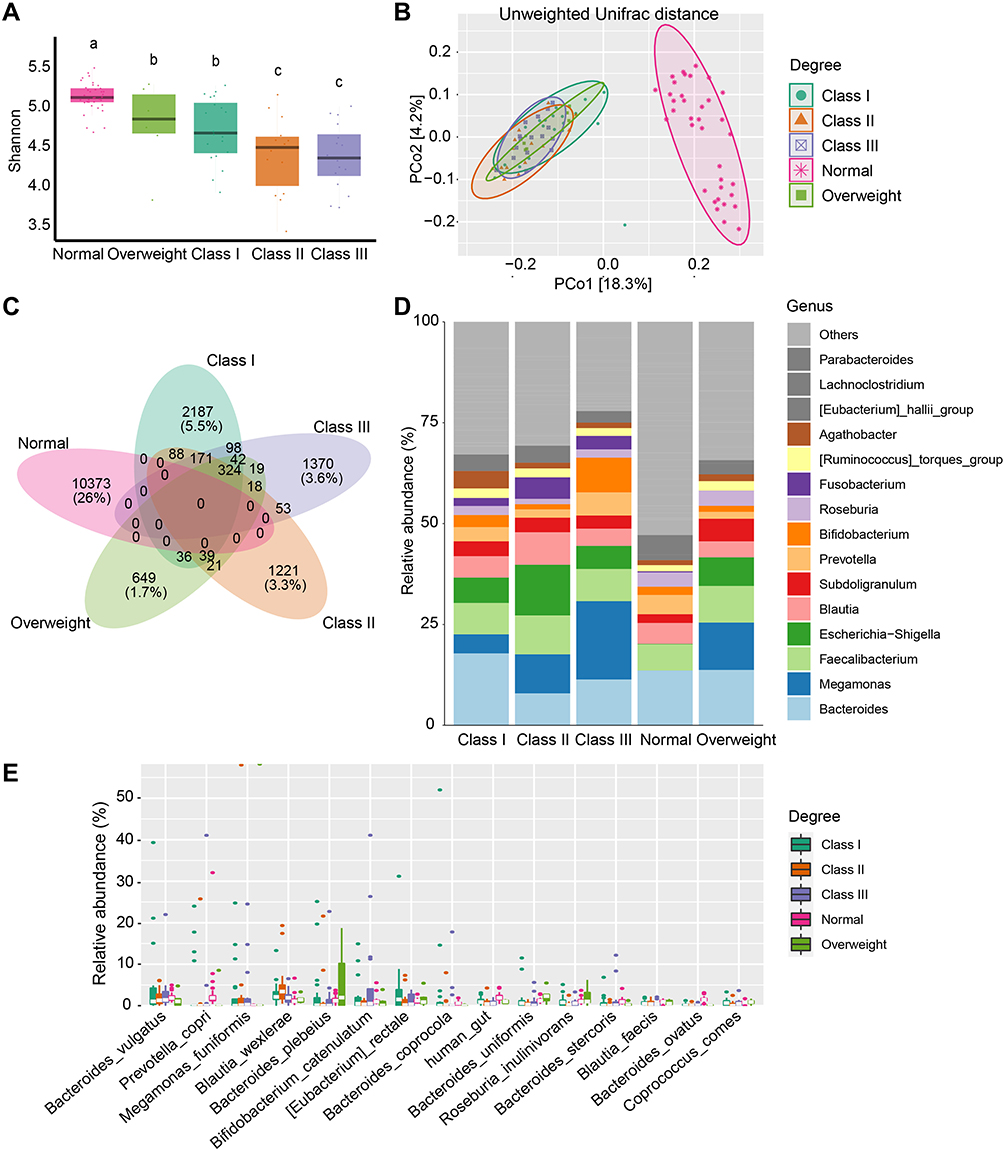 |
Figure 2 Microbial changes between different degrees of obesity. (A) Shannon diversity in subjects from the Normal, “Overweight”, Class I, Class II, and Class III obesity groups. Different lowercase letters indicate significant differences (P < 0.05). (B) Beta diversity of Unweighted Unifrac distances in patients from different groups based on PCoA. (C) Venn diagram of shared or unique ASVs between the 5 groups. (D) Bar plot of the mean relative abundance of top 15 genera between different groups. (E) Top 15 taxonomic species are shown for different degrees of obesity. |
Similarly, all four obesity subgroups and the normal group had no shared ASVs. In contrast, the four subgroups had 324 shared ASVs. The numbers of unique ASVs present in the “Overweight”, Class I, Class II, and Class III groups were 649, 2187, 1221, and 1370, respectively. However, the shared ASVs between these groups were small (Figure 2C). The most dominant genera were Bacteroides, Faecalibacterium, Megamonas, Escherichia Shigella, Blautia, Subdoligranulum, Prevotella, Bifidobacterium, Roseburia, and Fusobacterium (Figure 2D, Supplementary Figure 2B). At the species level, Megamonas funiformis, Bacteroides plebeius, Bacteroides vulgatus, Blautia wexlerae, Prevotella copri, and Bifidobacterium catenulatum were the predominant microbial species (Figure 2E).
Furthermore, LEfSe and RF were applied to investigate the different biomarkers between healthy subjects and the four obesity subgroups (Figure 3A and 3B). Prevotellaceae, Prevotella, Prevotella copri, among others, were significantly increased in normal people identified by LEfSe. We also found that Akkermansiaceae, Akkermansia, Bacteroides ovatus, and Dorea formicigenerans were biomarkers of normal people by RF analysis. Meanwhile, the family Eubacterium coprostanoligenes and Tannerellaceae, and the genera Eubacterium coprostanoligenes, Lachnospiraceae NK4A136, and Parabacteroides were identified by both methods. Based on LEfSe and RF, Gammaproteobacteria and Enterobacterales were biomarkers for the “Overweight” group. Only one taxon, Erysipelatoclostridiaceae, was characterized by RF, while no other biomarker was identified through the LEfSe analysis of data from Class I obesity patients. Both methods revealed that the class Bacilli and the order Lactobacillales were biomarkers of Class II obesity. The bacterial class Negativicutes was a biomarker of Class III obesity as depicted by LEfSe and RF.
 |
Figure 3 Microbial biomarkers and correlation with different degrees of obesity. (A and B) Biomarker analysis between groups by LEfSe, LDA score > 4.0 (A), and RF (B). |
Taxa correlation network analysis is a useful approach for studying the co-occurrence patterns in microbial ecology. We therefore constructed a network based on the WGCNA method, as shown in Supplementary Figure 3. The network included 848 nodes and 2524 edges. In this network, all taxa/ASVs (node) were divided into 158 modules (communities). As assigned to Firmicutes, Bacteroidota, Proteobacteria, and Actinobacteriota, these nodes revealed a positive correlation (data not shown).
Correlation Between Microbiota and Biochemical Data in Obesity
We next explored the biochemical data from obese subjects and whether this data had an association with microbiota signatures. We found that the concentrations of TG and C-Peptide were negatively correlated with microbial alpha diversity (Simpson, Shannon, InvSimpson, Chao1, ACE, Observed Features, and Fisher), especially C-Peptide levels (Figure 4A). Additionally, the concentrations of ALT, AST, FA, and HDL were slightly positively correlated with the alpha diversity, although this was not significant (Figure 4A). Redundancy Analysis (RDA) was also performed at the genus level (Supplementary Figure 4A). Megamonas, Bifidobacterium, Blautia, Escherichia Shigella, Bacteroides, Fusobacterium, Faecalibacterium, Romboutsia, Subdoligranulum, and Agathobacter were found to be related to these biochemical factors. As such, these biochemical factors might be influenced by these taxa. For instance, Escherichia shigella seemed to influence the albumin and LDL levels in obesity. Next, we were interested in which species were associated with these clinic biochemical data (Figure 4B). Lactobacillus iners were found to be significantly positively correlated with the concentration of HDL. Parasutterella secunda, Butyrivibrio crossotus, and Clostridium saccharogumia were significantly positively correlated with FA levels. Moreover, Lactococcus lactis was significantly positively correlated with VB12 levels. Streptococcus parasanguinis was significantly positively correlated with IL6 levels. Regression analysis was then applied, and we found that TG level and microbial Bray-Curtis distance had a positive relationship in the “Overweight” group (Supplementary Figure 4B).
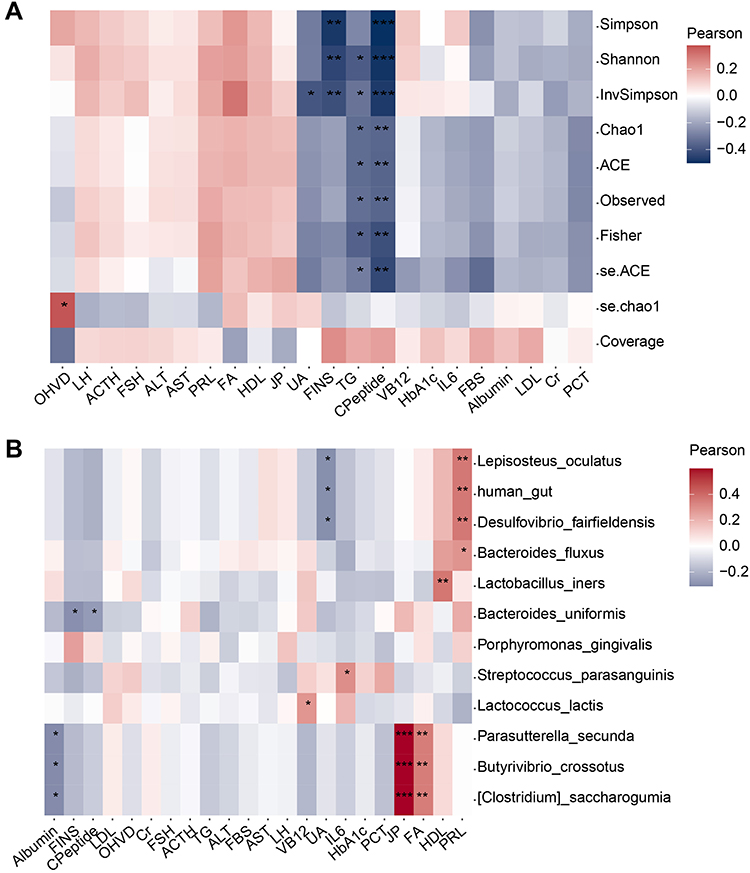 |
Figure 4 Relationship within microbiota and obese clinic traits in obesity. (A) Relationship between clinic data and alpha diversity. (B) Correlation analysis between clinic data and some important taxa, as detected in RF biomarker analysis. * P < 0.05, ** P < 0.01, *** P < 0.001. |
Changes in Potential Microbial Functions in Different Degrees of Obesity
The potential microbial alterations within different classifications of obesity severity were also investigated (Figure 5). One key pathway in obesity was TCA cycle VII (acetate-producers), which showed a degree-specific increasing trend (Figure 5A and B). An unexpected and interesting pathway in obesity was taxadiene biosynthesis (engineered), which was shown to be involved in the biosynthesis of the anticancer drug taxol (Figure 5A and C). The pathways related to polyamine biosynthesis in obesity included the superpathway of polyamine biosynthesis I (Figure 5A and E) / II (Figure 5A and D) and the superpathway of arginine and polyamine biosynthesis (Figure 5A and F). In addition, pathways for the biosynthesis of several amino acids were significantly upregulated in obesity, including the L-phenylalanine (PWY-6628, Figure 5A and H), L-tyrosine (PWY-6630, Figure 5A and G), and arginine pathways. Notably, all obesity Class I, Class II, and Class III groups were significantly higher than normal controls in all pathways mentioned above. Meanwhile, the Class III group was significantly higher than the Class I group in the pathways of TCA cycle VII (acetate-producers), the superpathway of polyamine biosynthesis I, the superpathway of L-tyrosine biosynthesis, and the superpathway of L-phenylalanine biosynthesis. However, the pathways of the urea cycle and octane oxidation were overrepresented in the normal group relative to all of the obesity subgroups.
 |
Figure 5 Alterations in the predicted metagenome functions in different obesity classes. (A) Heatmap of significantly different pathways between different groups. P < 0.001, Effect size > 0.4. (B-H) Key pathways in obesity: TCA cycle VII (acetate-producers) (B), taxadiene biosynthesis (engineered) (C), superpathway of polyamine biosynthesis II (D), superpathway of polyamine biosynthesis I (E), superpathway of arginine and polyamine biosynthesis (F), superpathway of L-tyrosine biosynthesis (G), and superpathway of L-phenylalanine biosynthesis (H). |
Correlation Between Baseline Microbiota and Weight Loss Achievement After Bariatric Surgery
The Spearman correlation between the relative abundance of microbiota and the percentage of excess weight loss (%EWL) 6 and 12 months (1 year) after surgery was assessed. Members of the family Comamonadaceae and the genus Paraprevotella exhibited a positive correlation with both %EWL 6 months and 1 year after surgery. The species Parabacteroides johnsonii, the family Leuconostocaceae, and an unknown member from the genus Leuconostoc were positively correlated with %EWL 6 months after surgery (Figure 6A, Supplementary Table 2). On the contrary, Oscillibacter, UCG−005, Flavonifractor, Eubacterium ruminantium group, Dialister pneumosintes, Lactobacillus ruminis, and Bacteroides fragilis presented a negative correlation with weight loss (Figure 6A, Supplementary Table 2). Furthermore, the receiver operating characteristic (ROC) curve analysis demonstrated that a member from Oscillibacter had the best accuracy (AUC = 0.6114). The AUC for the genus UCG−005 reached 0.5995 (Figure 6B).
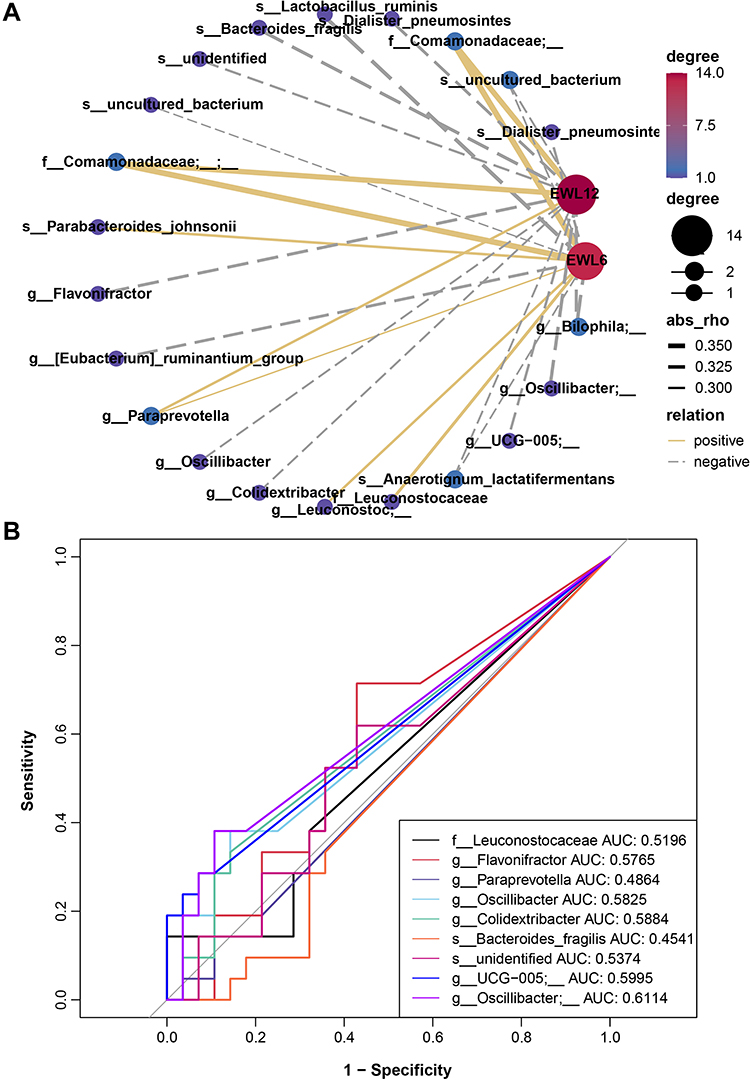 |
Figure 6 Correlation between baseline gut microbiota and weight loss achievement after bariatric surgery. (A) Spearman correlation network of microbiota and weight loss. Node and edge sizes indicate the degree and absolute values of the correlation, respectively. Edges represent the interaction between nodes, and negative and positive correlations are denoted by dashed gray lines and solid yellow lines, respectively. (B) Receiver operating characteristic (ROC) analysis of the microbiota signature for the relationship of microbiota and weight loss. |
Discussion
Although gut bacteria have been well-studied in terms of global obesity, there still is an unclear understanding of the microbial alterations in relation to the degree of obesity. In the current study, we sequenced 16S rRNA amplicons from participants with different degrees of obesity as well as healthy controls. In the context of marked dysbiosis with altered bacterial diversity, abundance, and potential functions seen in obesity and different classifications, we provide important evidence that suggests that it is very necessary for researchers to further classify obese populations in terms of microbiota. However, the challenge remains in terms of how we classify this data scientifically, meaningfully, and statistically.
Many studies have linked an altered gut microbiome to obesity. The gut microbiome in obesity has been characterized by lower diversity, which is consistent with the present study.19 Notably, our study demonstrated that the more severe obesity was, the lower the bacterial diversity was. No shared features were seen between obese patients and healthy people, and even among the obesity subgroups there were modest common features. Our Venn diagram results seemed to be odd, thus larger populations are needed to further verify our findings. Regardless, the bacterial phyla mainly consisted of Firmicutes, Bacteroidota, Proteobacteria, and Actinobacteriota, irrespective of the patient. The difference was represented mostly in the abundance of Firmicutes and Bacteridota (somewhere in the ratio of the Firmicutes/Bacteridota).20 Fewer Bacteridota were observed in obese patients, but the relative abundance of Firmicutes was much similar. To date, research on the gut microbiome profiles in obese and non-obese subjects has reported conflicting findings.19 Due to the recently updated release of taxonomic references (Silva v138), the current study more accurately explored the bacterial composition at all taxonomic levels, especially at the species level.
Akkermansiaceae and Akkermansia were markedly increased in healthy subjects compared to any classifications of obesity. Indeed, interventional studies with certain Akkermansia muciniphila strains have shown an anti-obesogenic effect in both humans and rodents.21,22 Moreover, a lack or decreased abundance of A. muciniphila could mirror a thin mucus layer and thus, an increased translocation of pro-inflammatory bacterial toxins, potentially leading to metabolic disturbances.23,24 In addition, Prevotellaceae, Prevotella, and Prevotella copri were also markedly abundant in healthy subjects. The genus Prevotella is part of the family Prevotellaceae, and P. copri is the most recognized and relevant member of human gut Prevotella spp.25 In non-Western populations, Prevotella spp. tend to dominate gut microbiota.26–28 A study including over 1000 persons revealed Prevotella copri to be potentially beneficial in glucose homeostasis and host metabolism.29 These results can explain the bloom of Akkermansia and Prevotella copri in healthy controls due to their benefits for health. In addition, Bacteroides ovatus is known to be a prominent member of human Bacteroidales spp, and were found to be increased in healthy subjects in the present study. This species can extensively utilize polysaccharides in a pattern of commensalism with other species.30 In gnotobiotic animals, Horvath and colleagues31 very recently found Bacteroides ovatus to be a producer of short-chain fatty acids (SCFAs), which are not only linked to immune function but also involved in nervous system modulation. Furthermore, Bacteroides ovatus was also recently identified to induce the production of gut IgA, and eventually benefit host gut homeostasis and immune health.32 Inconsistent with the current study, Dorea formicigenerans previously considered a biomarker of obesity, was significantly abundant in healthy subjects.33
Overall, our work identified Escherichia shigella as a biomarker of obesity, which was recently reported to have an association with nonalcoholic fatty liver disease (NAFLD).34 This can be explained by the fact that almost all obesity patients recruited in the current study had fatty liver comorbidities. Supporting our results that Gammaproteobacteria and Enterobacterales were biomarkers of the “Overweight” group, the most diverse class of gram-negative bacteria was Gammaproteobacteria, and this included several human pathogens. Moreover, Enterobacterales is a large order of intestinal bacteria belonging to the Gammaproteobacteria. Class I obesity could be characterized by an enrichment in Erysipelatoclostridiaceae. Members of Erysipelatoclostridiaceae have been shown to be associated with infectious diseases. Known as lactic acid bacteria (LAB), the order Lactobacillales ferments carbohydrates into lactic acid. Thus, they are generally considered probiotics. However, the enrichment in Lactobacillales was observed in Class II obesity patients. A diet intervention study in animals demonstrated that insoluble dietary fiber (soybean) could increase the relative abundance of potentially beneficial Lactobacillales in high-fat diet-induced obesity mice.35 Additionally, Bacilli was also a biomarker of Class II obesity, which is usually associated with the spoilage of food resulting in potential pathogens. Importantly, these results suggest that this result may be an effect of diet. Several studies have shown that the class Negativicutes is enriched in advanced NAFLD or cirrhosis patients.36–38 This shift was consistent with our studies of microbial populations in Class III obesity with fatty liver, which indicated that the patients from this group may have worse fatty livers than other patients. A very new study also provides key evidence that a high abundance of Negativicutes represents the high severity of steatosis.39
In this study, we established some relationships between the microbiota and biochemical data, such as albumin, LDL, HDL, vitamins FA and VB12, and IL6. The gut microbiota supplies its host with energy by releasing enzymes and metabolites such as short-chain fatty acids (SCFAs), amino acids, bile acids (BAs), vitamins, succinate, branched-chain amino acids (BCAAs), and lipopolysaccharide (LPS).40,41 In the current study, the biomarker Escherichia shigella was shown to have a connection with albumin and LDL in obesity, while Lactobacillus iners was shown to be connected with the concentration of HDL. Folic acid is an important substrate for the synthesis of methyl donors and as an essential water-soluble vitamin metabolized by the intestinal microbiome and the human body.42 Additional folic acid supplementation can attenuate liver injury under a high-fat diet (HFD), and ameliorate liver lipid accumulation.43,44 Thus, Parasutterella secunda, Butyrivibrio crossotus, and Clostridium saccharogumia, which are related to FA, might be potential targets for regulating the production of FA to ameliorate fatty liver. Vitamin B12 is an important nutrient for humans and animals, and acts as a key coenzyme in numerous mitochondrial and cytosolic pathways.45 Lactococcus lactis was shown to be significantly positively correlated with VB12. Li et al46 revealed the anti-inflammatory potential of the Streptococcus parasanguinis, which exhibited a significantly positive correlation with IL6 in our study.
All ASVs were related to 398 pathways in total. When we filtered by the P value (P < 0.001), there were 123 marked microbial pathways among the different degrees of obesity and healthy people (data not shown). Then, with further filtering (effect size > 0.4), 14 significant pathways were identified. Generally speaking, functions of energy metabolism dysbiosis were marked in obesity, especially in Class III obesity. It has been well-documented that obesity can be characterized by a dysfunction of energy metabolism. The TCA pathway is very common, existing in all aerobic living organisms and even in some anaerobic bacteria. For instance, acetic acid bacteria can oxidize ethanol to acetate. A study has reported the presence of the pathway TCA cycle VII (acetate-producers) in diverse bacterial groups, including microbial symbionts of humans.47 In addition, polyamine biosynthesis is a key microbial pathway in obesity, and has been shown to be vital for survival. In line with this, polyamine biosynthesis is a proper target for drug design in bacteria targeting obesity.48 L-tyrosine and its precursor L-phenylalanine are in high demand in microbiota in obesity. Accordingly, tyrosine might be a potential therapy for cognitive and mood problems associated with the maintenance of reduced body weight in the treatment of obesity.49 This suggests a potential microbial response for preventing weight gain in obese people.
The correlation results of the baseline microbiota and weight loss indicated that preoperative gut microbiota could affect bariatric surgery outcomes. In particular, members of Comamonadaceae were positively correlated with weight loss. Betaproteobacteria survive on copious amounts of organic nutrients, whereas Comamonadaceae showed a positive correlation with weight loss. A recent study using Mendelian randomization analysis established a significant causal effect between Oscillibacter and decreasing blood triglyceride.50 In comparison, our results indicate that this baseline gut taxon was negatively correlated with weight loss. It is possible that its abundance may pronouncedly increase after surgery, although this assumption requires further verification. Recently, Zhang et al reported that the baseline gut microbiota could serve as a positive predictor to predict weight loss after dietary intervention.51 As such, we believe that baseline gut microbiota has the potential to serve as a guide for clinical applications to develop more effective weight loss strategies.
However, we also must acknowledge the several limitations of our study. The current study was an in silico microbiota analysis of bacterial abundance levels based on 16S rRNA gene sequencing. Thus, such in silico-based microbiota inferences need further functional verification. Meanwhile, to understand the functional interaction of microbiota in diseases, we require comprehensive approaches like meta-proteomics and meta-metabolomics for more direct data on the functional properties of the microbiome. In addition, due to our study design, we could not separate cause from consequence. Importantly, detailed diet questionnaires should be included to explore any dietary effects. Longitudinal studies and larger cohorts with well-documented disease characteristics are therefore warranted in the future.
Conclusion
In summary, our work demonstrated that different degrees of obesity have distinct gut microbial signatures. Decreasing microbial diversity, depletion of some specific taxa, and deviation in the potential functions all reflected the severity of obesity. Members of genera Eubacterium coprostanoligenes, Lachnospiraceae NK4A136, Akkermansia, and Parabacteroides might be potential taxa for intervening in obesity regarding different degrees of obesity. Furthermore, three species, Prevotella copri, Bacteroides ovatus, and Dorea formicigenerans also showed great potential to regulate obesity. In contrast, a strategy that targets the inhibition of certain taxa in different obesity groups might be another way to improve obesity.
Data Sharing Statement
The raw sequence data reported in this study have been deposited in the Genome Sequence Archive in the National Genomics Data Center (NGDC), China National Center for Bioinformation/Beijing Institute of Genomics, Chinese Academy of Sciences (GSA: CRA007762). They are available at https://ngdc.cncb.ac.cn/gsa.
Acknowledgments
We respectfully acknowledge our participants, who selflessly helped to complete this project.
Author Contributions
All authors have contributed significantly to the work reported, whether that is in the conception, study design, execution, acquisition of data, analysis and interpretation or in all these areas; they have participated in drafting, revising, or critically reviewing the article; they approved the final version to be published; they have agreed on the journal to which the article has been submitted; and they agree to be accountable for all aspects of the work.
Funding
Funds to support this work were provided by the National Natural Science Foundation of China [82170887 to LYJ]; Chengdu High-level Key Clinical Specialty Construction Project [LYJ]; and the Science and Technology Project of The Health Planning Committee of Sichuan Municipality [20PJ211 to YQ].
Disclosure
The authors report no conflicts of interest in this work.
References
1. Pan X-F, Wang L, Pan A. Epidemiology and determinants of obesity in China. Lancet Diabetes Endocrinol. 2021;9(6):373–392. doi:10.1016/S2213-8587(21)00045-0
2. Qin X, Pan J. The Medical Cost Attributable to Obesity and Overweight in China: estimation Based on Longitudinal Surveys. Health Econ. 2016;25(10):1291–1311. doi:10.1002/hec.3217
3. WHO. Obesity: preventing and managing the global epidemic. Report of a WHO consultation. World Health Organ Tech Rep Ser. 2000;894:i–xii, 1–253.
4. de Vos WM, Tilg H, Van Hul M, Cani PD. Gut microbiome and health: mechanistic insights. Gut. 2022;71(5):1020–1032. doi:10.1136/gutjnl-2021-326789
5. Fan Y, Pedersen O. Gut microbiota in human metabolic health and disease. Nat Rev Microbiol. 2021;19(1):55–71. doi:10.1038/s41579-020-0433-9
6. Manor O, Dai CL, Kornilov SA, et al. Health and disease markers correlate with gut microbiome composition across thousands of people. Nat Commun. 2020;11(1):5206. doi:10.1038/s41467-020-18871-1
7. Bervoets L, Van Hoorenbeeck K, Kortleven I, et al. Differences in gut microbiota compos between obese and lean children. Gut Pathog. 2013;5:10. doi:10.1186/1757-4749-5-10
8. Koliada A, Syzenko G, Moseiko V, et al. Association between body mass index and Firmicutes/Bacteroidetes ratio in an adult Ukrainian population. BMC Microbiol. 2017;17(1):120. doi:10.1186/s12866-017-1027-1
9. Yun Y, Kim HN, Kim SE, et al. Comparative analysis of gut microbiota associated with body mass index in a large Korean cohort. BMC Microbiol. 2017;17(1):151. doi:10.1186/s12866-017-1052-0
10. Bolyen E, Rideout JR, Dillon MR, et al. Reproducible, interactive, scalable and extensible microbiome data science using QIIME 2. Nat Biotechnol. 2019;37(8):852–857. doi:10.1038/s41587-019-0209-9
11. Liu C, Cui Y, Li X, Yao M. microeco: an R package for data mining in microbial community ecology. FEMS Microbiol Ecol. 2021;97:2. doi:10.1093/femsec/fiaa255
12. Callahan BJ, McMurdie PJ, Rosen MJ, Han AW, Johnson AJ, Holmes SP. DADA2: high-resolution sample inference from Illumina amplicon data. Nat Methods. 2016;13(7):581–583. doi:10.1038/nmeth.3869
13. Katoh K, Misawa K, Kuma K, Miyata T. MAFFT: a novel method for rapid multiple sequence alignment based on fast Fourier transform. Nucleic Acids Res. 2002;30(14):3059–3066. doi:10.1093/nar/gkf436
14. Price MN, Dehal PS, Arkin AP. FastTree 2--approximately maximum-likelihood trees for large alignments. PLoS One. 2010;5(3):e9490. doi:10.1371/journal.pone.0009490
15. Kaehler BD, Bokulich NA, McDonald D, Knight R, Caporaso JG, Huttley GA. Species abundance information improves sequence taxonomy classification accuracy. Nat Commun. 2019;10(1):4643. doi:10.1038/s41467-019-12669-6
16. Bokulich NA, Kaehler BD, Rideout JR, et al. Optimizing taxonomic classification of marker-gene amplicon sequences with QIIME 2’s q2-feature-classifier plugin. Microbiome. 2018;6(1):90. doi:10.1186/s40168-018-0470-z
17. Douglas GM, Maffei VJ, Zaneveld JR, et al. PICRUSt2 for prediction of metagenome functions. Nat Biotechnol. 2020;38(6):685–688. doi:10.1038/s41587-020-0548-6
18. Bastian M, Heymann S, Jacomy M. Gephi: an Open Source Software for Exploring and Manipulating Networks. Int AAAI Conf Weblogs Soc Media. 2009;3(1):548.
19. Pinart M, Dotsch A, Schlicht K, et al. Gut Microbiome Composition in Obese and Non-Obese Persons: a Systematic Review and Meta-Analysis. Nutrients. 2021;14:1. doi:10.3390/nu14010012
20. Magne F, Gotteland M, Gauthier L, et al. The Firmicutes/Bacteroidetes Ratio: a Relevant Marker of Gut Dysbiosis in Obese Patients? Nutrients. 2020;12:5. doi:10.3390/nu12051474
21. Depommier C, Everard A, Druart C, et al. Supplementation with Akkermansia muciniphila in overweight and obese human volunteers: a proof-of-concept exploratory study. Nat Med. 2019;25(7):1096–1103. doi:10.1038/s41591-019-0495-2
22. Plovier H, Everard A, Druart C, et al. A purified membrane protein from Akkermansia muciniphila or the pasteurized bacterium improves metabolism in obese and diabetic mice. Nat Med. 2017;23(1):107–113. doi:10.1038/nm.4236
23. Brahe LK, Le Chatelier E, Prifti E, et al. Specific gut microbiota features and metabolic markers in postmenopausal women with obesity. Nutr Diabetes. 2015;5(6):e159–e159. doi:10.1038/nutd.2015.9
24. Cani PD, Depommier C, Derrien M, Everard A, de Vos WM. Akkermansia muciniphila: paradigm for next-generation beneficial microorganisms. Nat Rev Gastroenterol Hepatol. 2022.
25. Tett A, Pasolli E, Masetti G, Ercolini D, Segata N. Prevotella diversity, niches and interactions with the human host. Nat Rev Microbiol. 2021;19(9):585–599. doi:10.1038/s41579-021-00559-y
26. De Filippo C, Cavalieri D, Di Paola M, et al. Impact of diet in shaping gut microbiota revealed by a comparative study in children from Europe and rural Africa. Proc Natl Acad Sci U S A. 2010;107(33):14691–14696. doi:10.1073/pnas.1005963107
27. Smits SA, Leach J, Sonnenburg ED, et al. Seasonal cycling in the gut microbiome of the Hadza hunter-gatherers of Tanzania. Science. 2017;357(6353):802–806. doi:10.1126/science.aan4834
28. Yatsunenko T, Rey FE, Manary MJ, et al. Human gut microbiome viewed across age and geography. Nature. 2012;486(7402):222–227. doi:10.1038/nature11053
29. Asnicar F, Berry SE, Valdes AM, et al. Microbiome connections with host metabolism and habitual diet from 1098 deeply phenotyped individuals. Nat Med. 2021;27(2):321–332. doi:10.1038/s41591-020-01183-8
30. Rakoff-Nahoum S, Foster KR, Comstock LE. The evolution of cooperation within the gut microbiota. Nature. 2016;533(7602):255–259. doi:10.1038/nature17626
31. Horvath TD, Ihekweazu FD, Haidacher SJ, et al. Bacteroides ovatus colonization influences the abundance of intestinal short chain fatty acids and neurotransmitters. iScience. 2022;25(5):104158. doi:10.1016/j.isci.2022.104158
32. Yang C, Mogno I, Contijoch EJ, et al. Fecal IgA Levels Are Determined by Strain-Level Differences in Bacteroides ovatus and Are Modifiable by Gut Microbiota Manipulation. Cell Host Microbe. 2020;27(3):467–475 e466. doi:10.1016/j.chom.2020.01.016
33. Companys J, Gosalbes MJ, Pla-Paga L, et al. Gut Microbiota Profile and Its Association with Clinical Variables and Dietary Intake in Overweight/Obese and Lean Subjects: a Cross-Sectional Study. Nutrients. 2021;13:6. doi:10.3390/nu13062032
34. Xin FZ, Zhao ZH, Liu XL, et al. Escherichia fergusonii Promotes Nonobese Nonalcoholic Fatty Liver Disease by Interfering With Host Hepatic Lipid Metabolism Through Its Own msRNA 23487. Cell Mol Gastroenterol Hepatol. 2022;13(3):827–841. doi:10.1016/j.jcmgh.2021.12.003
35. Wang B, Yu H, He Y, et al. Effect of soybean insoluble dietary fiber on prevention of obesity in high-fat diet fed mice via regulation of the gut microbiota. Food Funct. 2021;12(17):7923–7937. doi:10.1039/D1FO00078K
36. Iebba V, Guerrieri F, Di Gregorio V, et al. Combining amplicon sequencing and metabolomics in cirrhotic patients highlights distinctive microbiota features involved in bacterial translocation, systemic inflammation and hepatic encephalopathy. Sci Rep. 2018;8(1):8210. doi:10.1038/s41598-018-26509-y
37. Loomba R, Seguritan V, Li W, et al. Gut Microbiome-Based Metagenomic Signature for Non-invasive Detection of Advanced Fibrosis in Human Nonalcoholic Fatty Liver Disease. Cell Metab. 2017;25(5):1054–1062.e1055. doi:10.1016/j.cmet.2017.04.001
38. Oh TG, Kim SM, Caussy C, et al. A Universal Gut-Microbiome-Derived Signature Predicts Cirrhosis. Cell Metab. 2020;32(5):878–888 e876. doi:10.1016/j.cmet.2020.06.005
39. Zeybel M, Arif M, Li X, et al. Multiomics Analysis Reveals the Impact of Microbiota on Host Metabolism in Hepatic Steatosis. Adv Sci. 2022;9(11):2104373. doi:10.1002/advs.202104373
40. Fetissov SO. Role of the gut microbiota in host appetite control: bacterial growth to animal feeding behaviour. Nat Rev Endocrinol. 2017;13(1):11–25. doi:10.1038/nrendo.2016.150
41. Han H, Yi B, Zhong R, et al. From gut microbiota to host appetite: gut microbiota-derived metabolites as key regulators. Microbiome. 2021;9(1):162. doi:10.1186/s40168-021-01093-y
42. Ebaid H, Bashandy SA, Alhazza IM, Rady A, El-Shehry S. Folic acid and melatonin ameliorate carbon tetrachloride-induced hepatic injury, oxidative stress and inflammation in rats. Nutr Metab. 2013;10(1):20. doi:10.1186/1743-7075-10-20
43. Ojeda ML, Rua RM, Nogales F, Díaz-Castro J, Murillo ML, Carreras O. The Benefits of Administering Folic Acid in Order to Combat the Oxidative Damage Caused by Binge Drinking in Adolescent Rats. Alcohol Alcoholism. 2016;51(3):235–241. doi:10.1093/alcalc/agv111
44. Xin FZ, Zhao ZH, Zhang RN, et al. Folic acid attenuates high-fat diet-induced steatohepatitis via deacetylase SIRT1-dependent restoration of PPARalpha. World j Gastroenterol. 2020;26(18):2203–2220. doi:10.3748/wjg.v26.i18.2203
45. Balabanova L, Averianova L, Marchenok M, Son O, Tekutyeva L. Microbial and Genetic Resources for Cobalamin (Vitamin B12) Biosynthesis: from Ecosystems to Industrial Biotechnology. Int J Mol Sci. 2021;22:9. doi:10.3390/ijms22094522
46. Li S, Li N, Wang C, et al. Gut Microbiota and Immune Modulatory Properties of Human Breast Milk Streptococcus salivarius and S. parasanguinis Strains. Front Nutr. 2022;9:798403. doi:10.3389/fnut.2022.798403
47. Kwong WK, Zheng H, Moran NA. Convergent evolution of a modified, acetate-driven TCA cycle in bacteria. Nat Microbiol. 2017;2:17067. doi:10.1038/nmicrobiol.2017.67
48. Gevrekci A. The roles of polyamines in microorganisms. World J Microbiol Biotechnol. 2017;33(11):204. doi:10.1007/s11274-017-2370-y
49. Hao S, Avraham Y, Bonne O, Berry EM. Separation-induced body weight loss, impairment in alternation behavior, and autonomic tone: effects of tyrosine. Pharmacol Biochem Behav. 2001;68(2):273–281. doi:10.1016/S0091-3057(00)00448-2
50. Liu X, Tong X, Zou Y, et al. Mendelian randomization analyses support causal relationships between blood metabolites and the gut microbiome. Nat Genet. 2022;54(1):52–61. doi:10.1038/s41588-021-00968-y
51. Zhang S, Wu P, Tian Y, et al. Gut Microbiota Serves a Predictable Outcome of Short-Term Low-Carbohydrate Diet (LCD) Intervention for Patients with Obesity. Microbiology Spectrum. 2021;9(2):e0022321. doi:10.1128/Spectrum.00223-21
 © 2022 The Author(s). This work is published and licensed by Dove Medical Press Limited. The full terms of this license are available at https://www.dovepress.com/terms.php and incorporate the Creative Commons Attribution - Non Commercial (unported, v3.0) License.
By accessing the work you hereby accept the Terms. Non-commercial uses of the work are permitted without any further permission from Dove Medical Press Limited, provided the work is properly attributed. For permission for commercial use of this work, please see paragraphs 4.2 and 5 of our Terms.
© 2022 The Author(s). This work is published and licensed by Dove Medical Press Limited. The full terms of this license are available at https://www.dovepress.com/terms.php and incorporate the Creative Commons Attribution - Non Commercial (unported, v3.0) License.
By accessing the work you hereby accept the Terms. Non-commercial uses of the work are permitted without any further permission from Dove Medical Press Limited, provided the work is properly attributed. For permission for commercial use of this work, please see paragraphs 4.2 and 5 of our Terms.