Back to Journals » Nature and Science of Sleep » Volume 12
Gradually Increased Interhemispheric Functional Connectivity During One Night of Sleep Deprivation
Authors Zhu Y ![]() , Ren F, Zhu Y, Zhang X, Liu W, Tang X, Qiao Y, Cai Y, Zheng M
, Ren F, Zhu Y, Zhang X, Liu W, Tang X, Qiao Y, Cai Y, Zheng M
Received 30 June 2020
Accepted for publication 30 October 2020
Published 23 November 2020 Volume 2020:12 Pages 1067—1074
DOI https://doi.org/10.2147/NSS.S270009
Checked for plagiarism Yes
Review by Single anonymous peer review
Peer reviewer comments 3
Editor who approved publication: Dr Steven Shea
Yuanqiang Zhu, 1,* Fang Ren, 1,* Yuanju Zhu, 2,* Xiao Zhang, 1 Wenming Liu, 3 Xing Tang, 1 Yuting Qiao, 3 Yanhui Cai, 3 Mingwen Zheng 1
1Department of Radiology, Xijing Hospital, Fourth Military Medical University, Xi’an, Shaanxi, People’s Republic of China; 2Institute of Medicinal Chemistry, School of Pharmacy, Shandong University, Jinan, Shandong, People’s Republic of China; 3Department of Psychiatry, Xijing Hospital, Fourth Military Medical University, Xi’an, Shaanxi, People’s Republic of China
*These authors contributed equally to this work
Correspondence: Yuanqiang Zhu; Mingwen Zheng
Department of Radiology, Xijing Hospital, Fourth Military Medical University, No. 127 West Changle Road, Xi’an 710032, People’s Republic of China
Tel/Fax +86-29-8477-5415
Email [email protected]; [email protected]
Background: It is well known that circadian rhythms and sleep homeostasis contribute to a pronounced trough in sleepiness and behavioral performance at night. However, the underlying neuroimaging mechanisms remain unclear. How brain-function connectivity is modulated during sleep deprivation (SD) has been rarely examined.
Methods: By increasing the number of scanning sessions during SD, the current study used voxel-mirrored homotopic connectivity (VMHC) to investigate dynamic changes in interhemispheric communication during one night of SD. Every 2 hours from 10 pm to 06 am (session 1, 10 pm; session 2, 12 am; session 3, 2 am; session 4, 4 am; session 5, 6 am), functional magnetic resonance–imaging data and Stanford Sleepiness Scale (SSS) scores were collected from 36 healthy participants with intermediate chronotype. Dynamic changes in SSS scores and VMHC were determined using one-way repeated-measure ANOVA with the false discovery–rate method to correct for multiple comparisons.
Results: Significant time effects for VMHC were found mainly in the bilateral thalamus, bilateral superior temporal gyrus, and bilateral precentral gyrus. SSS scores and VMHC in these areas were both found to be monotonously increased during SD. Furthermore, significant positive associations were found between SSS valu and VMHC values in the left superior temporal and right superior gyri.
Conclusion: These findings might represent the dynamic modulation of circadian rhythm merely or the interaction effects of both circadian rhythm and sleep homeostasis on interhemispheric connectivity within the thalamus, default-mode network, and sensorimotor network. Our study provides more comprehensive information on how SD regulates brain connectivity between hemispheres and adds new evidence of neuroimaging correlates of increased sleepiness after SD.
Keywords: sleep deprivation, resting-state functional MRI, voxel-mirrored homotopic connectivity, Stanford Sleepiness Scale, dynamic changes
Corrigendum for this paper has been published
Introduction
Sleep deprivation (SD) is becoming increasingly common in our hectic society.1 Understanding the consequences of SD and neuroimaging mechanisms is of great importance.2,3 Previous task and resting-state functional magnetic resonance imaging (rs-fMRI) studies have verified extensive voxel-level and network-level brain-function alterations after SD,4,5 largely covering the frontal lobe, thalamus, default-mode network and frontoparietal network. However, SD-related alterations in functional interactions among cerebral hemispheres have been rarely examined. As one of the most salient characteristics of intrinsic brain-function architecture, interhemispheric homotopic functional connectivity reflects the importance of interhemispheric communication for the integration of emotional, cognitive, motor, and sensory information.6 Functional homotopy is the high degree of synchrony in patterns of spontaneous activity between homotopic regions in each brain hemisphere. Voxel-mirrored homotopic connectivity (VMHC) is a recently validated reliable and reproducible rs-fMRI metric approach. In contrary to other rs-fMRI indices, such as amplitude of low-frequency fluctuation and regional homogeneity, which are direct measures of spontaneous local activity, VMHC quantifies the resting-state functional connectivity between each voxel in one hemisphere and its corresponding voxel in the opposite hemisphere.7 Our previous work has demonstrated that VMHC is severely affected after SD and suggested that increased VMHC might reflect a complementary mechanism that allows humans to adaptively increase interhemisphere interactions to cope with the reduced alertness induced by long-term wakefulness.8
However, higher observed VMHC reflects the outcome of SD on between-hemisphere connections, rather than the modulation process. Sleep and brain functions are modulated by interactions between circadian and homeostasis pressure.9,10 We have indicated that cerebral responses to cognitive functions are differently modulated during one night of SD. The cerebral response to slowest sustained attention was monotonically increased within the default-mode network, while the cerebral response to fastest sustained attention showed an inverted-U curve within the higher-association cortex,11 but how SD affects the interhemispheric connectivity during one night of SD remains unclear. Therefore, in the present study we used repeated rs-fMRI scanning (five sessions: 10 pm, 12 am, 2 am, 4 am, 6 am) to investigate dynamic changes in interhemispheric communication during one night of SD for healthy controls with intermediate chronotype (neither morning type nor evening type) and to explore possible neuroimaging mechanisms of increased sleepiness during SD. It is worth noting that this is a further analysis of previously analyzed and reported data.11
Methods
Subjects
All experimental procedures were carried out in accordance with the Declaration of Helsinki. Heathy participants were recruited from universities and the local community by advertisement. Inclusion criteria wereright-handedness, 18–40 years old, normal IQ, and no MRI contraindications. Exclusion criteria were alcohol or drug abuse, present or past neurological or psychiatric diseases, sleep disorders, and claustrophobia. As the study was about the circadian process, we used the Munich Chronotype Questionnaire to recruit participants with intermediate chronotype only.12 Finally, 40 subjects participated in the study. Their chronotype was further validated using core body temperature recorded by a wireless integrated physiological monitor (VitalSense; Mini Mitter, Bend, OR, USA).13 All participants gave written informed consent approved by the local research ethics committee of Xijing Hospital.
Sleep-Deprivation Experiment
All participants came to the laboratory twice. During the first visit, they were briefed about the experimental protocol and signed the informed consent. They were asked to keep normal sleep habits for 1 week before the SD and provided a wrist Actiwatch (Philips Respironics, Mini Mitter) to record their sleep patterns. During the second visit, they were asked to report to the laboratory no later than 6 pm Afternoon naps were not allowed on the day before SD. Two participants in pairs took part in the SD experiment each night. During the experiment, they were allowed to read, watch TV, and surf the internet. Strenuous activities were not allowed and beverages with caffeine were not allowed during the entire experiment. Two research assistants accompanied and monitored to prevent them from falling sleep. Every 2 hours from 10 pm to 6 am, (session 1, 10 pm; session 2, 12 am; session 3, 2 am; session 4, 4 am; session 5, 6 am), participants were instructed to lie down in the MR scanner for rs-fMRI data collection. After each scan, they completed the Stanford Sleepiness Scale (SSS) questionnaire by choosing one of seven statements that best described their current state of alertness.
MRI Data Collection
All MRI data were collected using a 3 T Discovery 750 MR scanner (General Electric, Milwaukee, WI, USA). During scanning, all participants were instructed to keep their eyes open, let the mind wander, and stay awake. Parameters for rs-fMRI images were gradient echo–planar imaging sequence 210 images, echo time 30 milliseconds, repetition time 2 seconds, data matrix 64×64, 33 slices, and field of view 240 mm×240 mm. Before the first rs-fMRI scan, a high-resolution T1 image was collected for anatomical reference (3-D Bravo T1-weighted sequence): repetition time 8.2 milliseconds, matrix 256 ×256, slice thickness 1 mm, echo time 3.2 milliseconds, field of view 256×256 mm2, and 196 slices.
MRI Data Analysis
Preprocessing analyses of rs-fMRI data and calculation of VMHC were similar to our previous study.8 The first ten images were discarded for MRI data stability. The remaining 200 images were then slice timing–corrected and realigned to the first image, during which the average frame-wise displacement was obtained and then used as a covariate in subsequent statistical analysis. Four participants were excluded from further processing, as their head motions exceeded either 2° or 2 mm. Therefore, the final sample size of the current study was 36 participants. As VMHC is sensitive to head motion, Friston 24 parameters were used to regress their effects. To further reduce the effects of nuisance factors, signals from cerebrospinal fluid and white matter were also regressed. Then, a Dartel toolbox was used to normalize the data into Montreal Neurological Institute space,14 and the resulting images were finally smoothed with a 6 mm (full width at half-maximum) Gaussian kernel and band pass–filtered (0.01–0.08 Hz). rs-fMRI data preprocessing and VMHC computation were all based on DPABI 4.0 (http://rfmri.org/DPABI) software. Before calculation, all preprocessed rs-fMRI data were transformed into the group-specific symmetric template, then for each subject VMHC was computed as a Pearson correlation coefficient between each pair of mirrored-voxel time series (between each voxel and its corresponding voxel in the opposite hemisphere). Correlation coefficients were finally Fisher z–transformed to improve normality.
Statistical Analysis
Differences in SSS scores were determined using one-way repeatedmeasure ANOVA with α=0.05, multiple comparisons for posthoc analysis between sessions were carried out with α=0.05 with Bonferroni correction. Based on the statistical module in the DPABI software, differences in VMHC were also determined with one-way repeated measure ANOVA with an α=0.05. The false discovery rate was used to correct for multiple comparisons (F-test), with the statistical threshold set at a positive false-discovery rate <0.05 across the whole brain (bilaterally). In order to elucidate possible neuroimaging mechanisms of increased sleepiness during SD, we extracted VMHC values in each significant region for each patient and examined Pearson associations between VMHC and SSS scores using SPSS 18.0. Significance was set at p<0.05, Bonferroni-corrected (ie, p<0.05/6=0.008).
Results
A total of 36 participants successfully completed the SD experiment. Mid-sleep time on free days (corrected by sleep debt on work days) obtained from the Munich Chronotype Questionnaire and the time of core body–temperature minimum showed no differences (4:27 am vs 4:14 am, t=0.25; p<0.001), which confirmed that participants recruited in the current study were all intermediate chronotype. Sleep diaries and the Actiwatch confirmed that all participants had good habitual sleep (7.3±1.5 hours per night, range 6–9 hours). Detailed demographic and sleep-pattern information is shown in Table 1.A significant time effect for SSS scores was revealed by ANOVA (F4,140=44.5, p<0.001). Post-hoc analysis indicated significant pairwise differences: between session 1 and sessions 2–5, between session 2 and sessions 1, 3, 4, and 5, between session 3 and sessions 1, 2, 4, and 5, between session 4 and sessions 1–3, and between session 5 and sessions 1–3. Results are shown in Figure 1. Monotonous increasing linearity was found for SSS scores (R2=0.94, p<0.005).
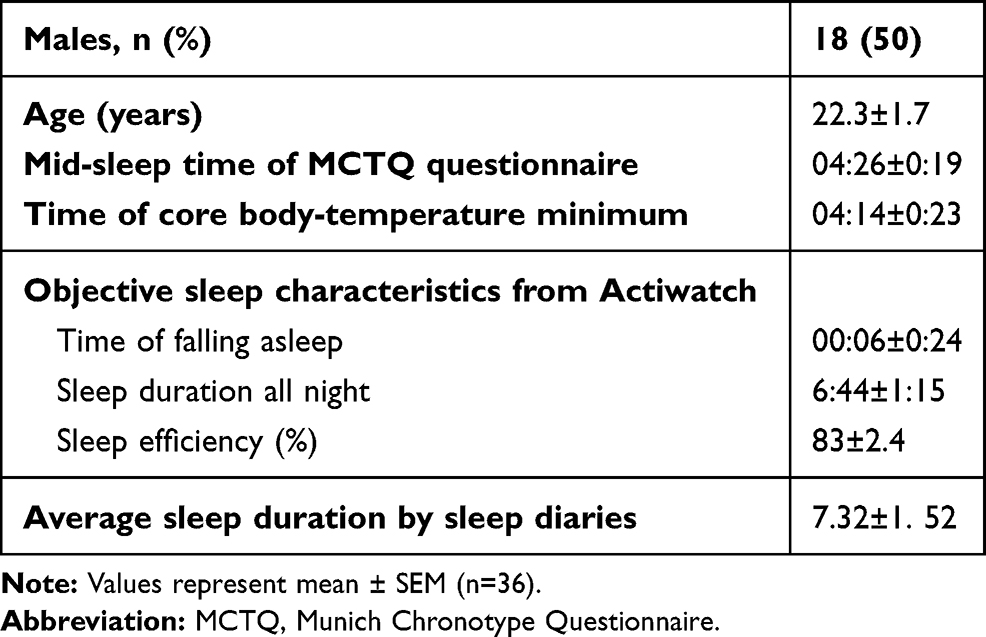 |
Table 1 Demographic characteristics, Stanford Sleepiness Scale, and objective sleep measures |
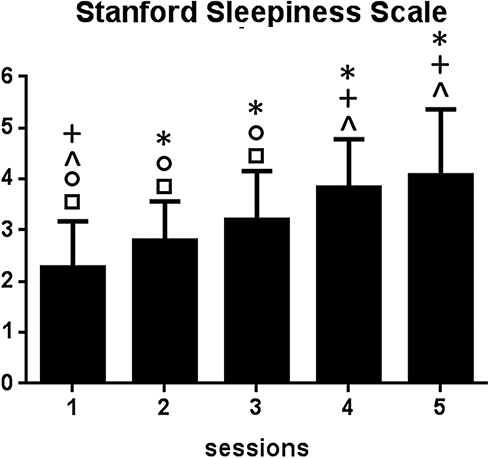 |
Figure 1 Significant time effects for Stanford Sleepiness Scale scores. *Significant difference between labeled session and session 1 (eg, session 4 with asterisk indicates a significant difference in Stanford Sleepiness Scale scores between sessions 4 and 1); +significant difference between labeled session and session 2; ^significant difference between labeled session and session 3; ○significant difference between labeled session and session 4; □significant difference between labeled session and session 5. |
A significant time effect for VMHC was also revealed by ANOVA: significant differences across sessions were found within the bilateral thalamus, bilateral superior temporal gyrus, and bilateral precentral gyrus. Results are shown in Figure 2A–C. According to the networks brought up by Yeo et al15 the bilateral superior temporal gyrus and bilateral precentral gyrus were found to be located within the default-mode network and sensorimotor network (Figure 2D). To investigate the precise time courses of VMHC changes across sessions, the mean VMHC value within each region was extracted and plotted against session number. The SPSS curve-fit function also indicated monotonous increasing linearity for all six regions (thalamus, R2=0.91, p<0.005; superior temporal gyrus, R2=0.91, p<0.005; precentral gyrus, R2=0.90, p<0.005). Furthermore, significant positive associations were found between SSS scores and VMHC in the left superior temporal gyrus and right superior gyrus (r=0.41, p<0.001; Figure 3).
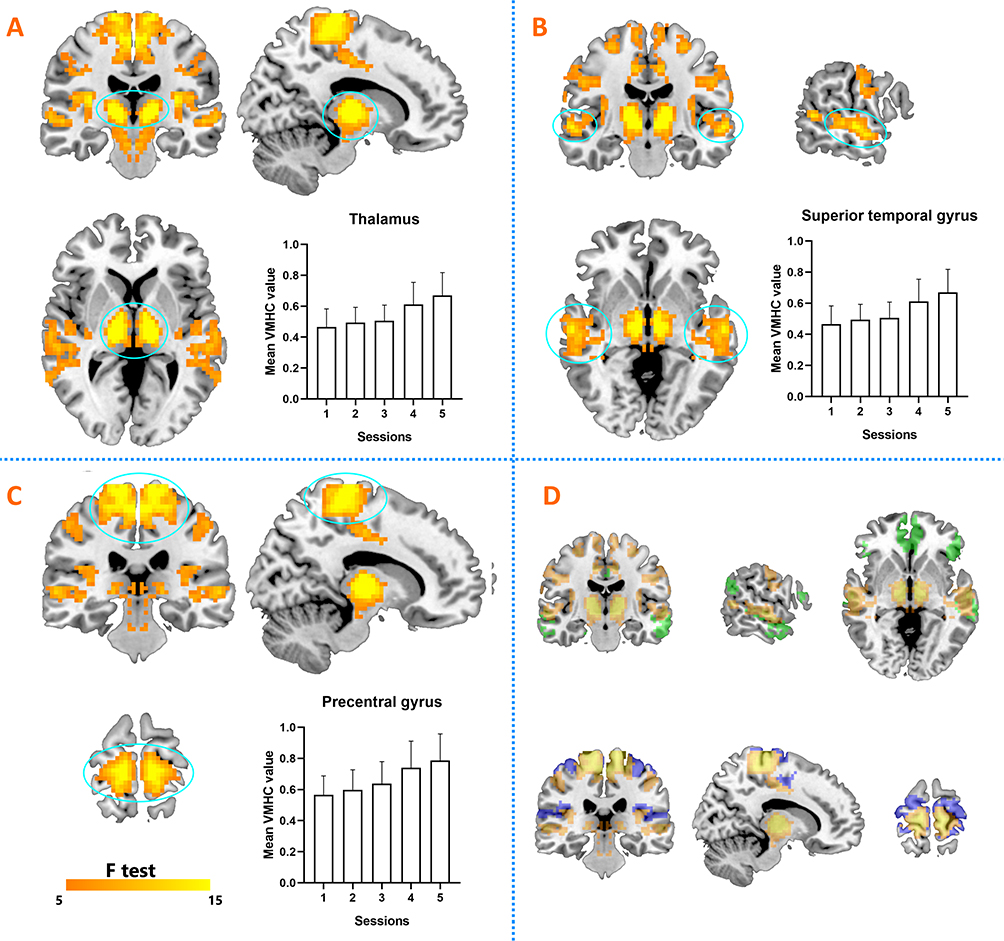 |
Figure 2 Significant time effects for VMHC (ANOVA). (A) ANOVA results for bilateral thalamus and time course during sleep deprivation. (B) ANOVA results for bilateral superior temporal gyrus and time course during sleep deprivation. (C) ANOVA results for bilateral precentral gyrus and time course during sleep deprivation. (D) Default-mode network and sensorimotor network marked green and blue, respectively. |
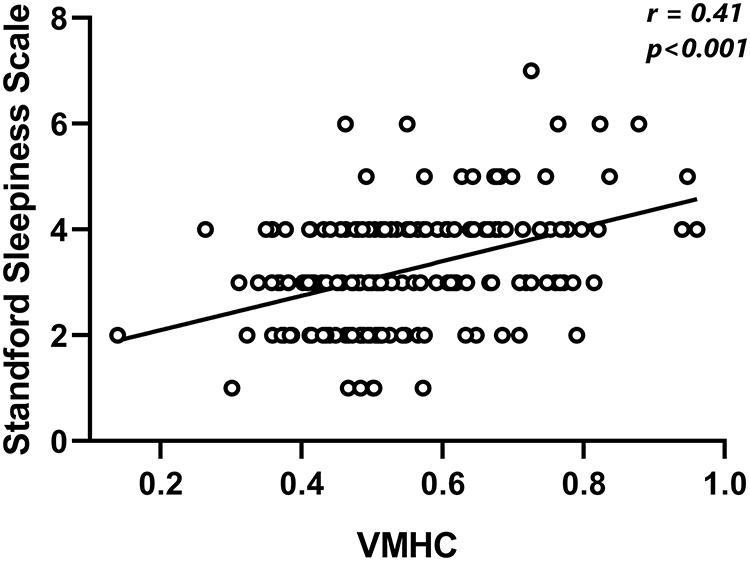 |
Figure 3 Positive correlation between VMHC in bilateral superior temporal gyrus and Stanford Sleepiness Scale score. |
Discussion
Sleepiness and behavioral performance at night are modulated by the interactions of circadian and sleep-homeostasis mechanisms. Few studies have focused on the cerebral correlates of this phenomenon. Identifying how intrinsic brain-function connectivity is affected during SD at night is not only of great interest for sleep–wake research but also in the context of shiftwork and sleep restriction. In the present study, monotonically increased interhemisphere interactions were found during one night of SD, with mainly the thalamus, default-mode network, and sensorimotor network implicated. Furthermore, significant positive correlations were found between sleepiness and VMHC in the superior temporal cortex. To our knowledge, this is the first study to investigate the dynamic modulation of SD on VMHC.
VMHC has been broadly used to reveal aberrant interhemispheric functional connectivity in various brain disorders, such as insomnia,16 schizophrenia,17 and nicotine addiction.6 Using repeated fMRI scanning, we found significant alterations in VMHC during one night of SD, which indicated that functional interhemispheric communication was severely affected by SD. This is reasonable, as interhemispheric interaction relies on white-matter commissural fibers, such as corpus callosum and interthalamus adhesions. The integrity of these fibers has been demonstrated in our previous study to be associated with resilience to SD-induced cognitive declines,18 ie, the higher the fractional anisotropy, the better the cognitive performance after SD. Most imaging studies of SD typically conduct two imaging sessions in each subject. One session is performed after rested wakefulness and the other after SD. By comparing the differences in neural activation between these two sessions, researchers have proposed many explanations, expanding our understanding of the neurocognitive consequences of SD. However, the observed alterations in VMHC after SD in our previous study described modulated interhemispheric connectivity, rather than the process of modulation.8 A clearer and more complete understanding of neural changes associated with the process of SD can be obtained by increasing observation sessions during SD. In comparison with our previous finding, the present study has greatly enriched and expanded our understanding of the influences of SD on interhemispheric interactions in that a gradually ascending curve was found for VMHC. By increasing the number of observations, we provide more comprehensive information on the dynamic modulation of SD on between-hemisphere functional connectivity.
Increased thalamic responses were frequently observed after SD, and most studies have indicated that enhanced responses reflect a compensation for the detrimental effects of accumulating sleep debt.19,20 However, as indicated by Muto et al, subcortical responses within the thalamus and head of the caudate nucleus show strong circadian modulation, but no significant influence on sleep debt. Therefore, the rise in VMHC observed within the thalamus might reflect the effect of circadian rhythm more than the effect of sleep homeostasis. Muto et al indicated that dynamic increased activation within the thalamus during SD showed a highly positive correlation with mean melatonin levels, which ascended linearly during the night.9 This is consistent with our study: activation in the thalamus was monotonically increased during the whole night, in contrast to several cortical areas that were affected by the interaction effects of circadian rhythm and sleep homeostasis, ie, a fast increase during the early night with dramatic decrease during the late night.11 Consistently with previous studies, the current study found no correlation between thalamus activation and SSS scores, which suggested that sleep debt might show little effect on subcortical brain structures.6 Therefore, the thalamus could serve as a foci of interest when investigating disorders with abnormal circadian rhythms.
As the superior temporal gyrus is a core region of the default mode network, the rise of VMHC observed within it might reflect disrupted disengagement in the default-mode network when sleepiness increased. Previous studies using independent-component analysis and seed-based approaches have identified abnormal functional connectivity within the default-mode network and between the default-mode network and other brain networks.15,21 Our previous study found that the activation pattern to slowest sustained attention within the default-mode network increased linearly, which indicated increasingly poor efficiency of task disengagement during SD.11 Furthermore, significant positive correlations were found between VMHC within the superior temporal gyrus and SSS scores. This can partially explain the neuroimaging mechanism of increased sleepiness during SD. Consistently with the current findings, our previous study suggested that the higher negative correlation with the default-mode network, the better the working memory maintained during SD.10 Therefore, the activation pattern within the default-mode network could serve as a biomarker of sleepiness degree during SD, and participants who maintain stable default-mode activation during SD might show little cognitive vulnerability after SD.
As the precentral gyrus is an important part of the sensorimotor network, the increased VMHC found in itmight indeed reflect a compensatory role during SD. Basic sensory and motor functions require coordination of the left and right sides of the brain. However, when higher-order cortex regions activate poorly after SD,22 brain regions within the sensorimotor network needs to strengthen the connectivity between the two hemispheres to cope with the decreased whole-brain efficiency induced by sleepiness. However, increased activity accounting for compensation needs to meet at least two prerequisites.23 Firstly, there should be available evidence that enhanced activation is related to the supply–demand gap. Secondly, there should be beneficial effects of enhanced activation on cognitive function. In the current study, no negative correlation was found between increased VMHC in the precentral gyrus and increased sleepiness during SD; therefore, the neuroimaging correlates underlying the compensatory mechanism after SD need further exploration.
The present study has several limitations. First, the sample was relatively small and the age distribution too young. This is because participants were hard to recruit. Second, microsleep was not easy to avoid during the entire experiment, but two research assistants were on hand to prevent participants from falling asleep. Furthermore, before scanning, participants were urged repeatedly to stay awake, during scanning they were asked to keep their eyes open, and after the scanning they all confirmed no sleep. In addition, during scanning, heart rate and breathing frequency were collected at the same time, which verify they were not asleep. Finally, as most participants’ sleep-onset time was around midnight (6±24 minutes), the first scanning session (10 pm) might not be accounted as SD; therefore, observations at this session should be interpreted with caution.
Conclusion
By increasing the number of scans, our study comprehensively described the dynamic regulation of SD on functional connection between the left and right hemispheres. Monotonically increased VMHC was within the thalamus, default-mode network, and sensorimotor network, which represents the modulation of circadian rhythm only or the interaction effects of both circadian rhythm and sleep homeostasis. We provide new information on how SD regulates brain connectivity between the hemispheres during SD and add new evidence of neuroimaging correlates of increased sleepiness after SD.
Acknowledgments
All volunteers are thanked for their participation of the study. This study was financially supported by the National Natural Science Foundation of China under grant 81801772.
Disclosure
The authors report no conflicts of interest for this work.
References
1. Basner M, Asch DA, Shea JA, et al. Sleep and alertness in a duty-hour flexibility trial in internal medicine. N Engl J Med. 2019;380:915–923. doi:10.1056/NEJMoa1810641
2. Basner M, Rao H, Goel N, Dinges DF. Sleep deprivation and neurobehavioral dynamics. Curr Opin Neurobiol. 2013;23:854–863. doi:10.1016/j.conb.2013.02.008
3. Maire M, Reichert C, Gabel V, et al. Sleep ability mediates individual differences in the vulnerability to sleep loss: evidence from a PER3 polymorphism. Cortex. 2014;52:47–59. doi:10.1016/j.cortex.2013.11.008
4. Long Z, Cheng F. Age effect on functional connectivity changes of right anterior insula after partial sleep deprivation. Neuroreport. 2019;30:1246–1250. doi:10.1097/WNR.0000000000001347
5. Teng J, Ong JL, Patanaik A, et al. Vigilance declines following sleep deprivation are associated with two previously identified dynamic connectivity states. NeuroImage. 2019;200:382–390. doi:10.1016/j.neuroimage.2019.07.004
6. Yu D, Yuan K, Bi Y, et al. Altered interhemispheric resting-state functional connectivity in young male smokers. Addict Biol. 2018;23:772–780. doi:10.1111/adb.12515
7. Zuo X, Kelly C, Martino AD, et al. Growing together and growing apart: regional and sex differences in the lifespan developmental trajectories of functional homotopy. J Neurosci. 2010;30:15034–15043. doi:10.1523/JNEUROSCI.2612-10.2010
8. Zhu Y, Feng Z, Xu J, et al. Increased interhemispheric resting-state functional connectivity after sleep deprivation: a resting-state fMRI study. Brain Imaging Behav. 2016;10:911–919. doi:10.1007/s11682-015-9490-5
9. Muto V, Jaspar M, Meyer C, et al. Local modulation of human brain responses by circadian rhythmicity and sleep debt. Science. 2016;353:687–690. doi:10.1126/science.aad2993
10. Zhu Y, Xi Y, Sun J, et al. Neural correlates of dynamic changes in working memory performance during one night of sleep deprivation. Hum Brain Mapp. 2019;40:3265–3278. doi:10.1002/hbm.24596
11. Zhu Y, Xi Y, Fei N, et al. Dynamics of cerebral responses to sustained attention performance during one night of sleep deprivation. J Sleep Res. 2018;27:184–196.
12. Roenneberg T, Merrow M. The circadian clock and human health. Curr Biol. 2016;26:R432–R443. doi:10.1016/j.cub.2016.04.011
13. Darwent D, Zhou X, Den Heuvel CJV, Sargent C, Roach G. The validity of temperature-sensitive ingestible capsules for measuring core body temperature in laboratory protocols. Chronobiol Int. 2011;28:719–726. doi:10.3109/07420528.2011.597530
14. Song K, Li J, Zhu Y, et al. Altered small-world functional network topology in patients with optic neuritis: A resting-state fMRI study. bioRxiv. 2020;141432. doi:10.1101/2020.06.09.141432
15. Yeo B, Tandi J, Chee MW. Functional connectivity during rested wakefulness predicts vulnerability to sleep deprivation. Neuroimage. 2015;111:147–158. doi:10.1016/j.neuroimage.2015.02.018
16. Dai X, Liu B, Ai S, et al. Altered inter-hemispheric communication of default-mode and visual networks underlie etiology of primary insomnia: altered inter-hemispheric communication underlie etiology of insomnia. Brain Imaging Behav. 2019;1–15.
17. Chang X, Xi Y, Cui L, et al. Distinct inter-hemispheric dysconnectivity in schizophrenia patients with and without auditory verbal hallucinations. Sci Rep. 2015;5:11218. doi:10.1038/srep11218
18. Zhu Y, Wang L, Xi Y, et al. White matter microstructural properties are related to inter-individual differences in cognitive instability after sleep deprivation. Neuroscience. 2017;365:206–216. doi:10.1016/j.neuroscience.2017.09.047
19. Chee MW, Chuah LY. Functional neuroimaging insights into how sleep and sleep deprivation affect memory and cognition. Curr Opin Neurol. 2008;21(4):417–423. doi:10.1097/WCO.0b013e3283052cf7
20. Chee MW, Tan JC. Lapsing when sleep deprived: neural activation characteristics of resistant and vulnerable individuals. Neuroimage. 2010;51(2):835–843.21. doi:10.1016/j.neuroimage.2010.02.031
21. De Havas JA, Parimal S, Soon CS, Chee MWL. Sleep deprivation reduces default mode network connectivity and anti-correlation during rest and task performance. NeuroImage. 2012;59:1745–1751. doi:10.1016/j.neuroimage.2011.08.026
22. Chee MWL, Chuah YML. Functional neuroimaging and behavioral correlates of capacity decline in visual short-term memory after sleep deprivation. Proc Natl Acad Sci U S A. 2007;104:9487–9492. doi:10.1073/pnas.0610712104
23. Cabeza R, Albert M, Belleville S, et al. Maintenance, reserve and compensation: the cognitive neuroscience of healthy ageing. Nat Rev Neurosci. 2018;19:701–710. doi:10.1038/s41583-018-0068-2
 © 2020 The Author(s). This work is published and licensed by Dove Medical Press Limited. The
full terms of this license are available at https://www.dovepress.com/terms
and incorporate the Creative Commons Attribution
- Non Commercial (unported, 3.0) License.
By accessing the work you hereby accept the Terms. Non-commercial uses of the work are permitted
without any further permission from Dove Medical Press Limited, provided the work is properly
attributed. For permission for commercial use of this work, please see paragraphs 4.2 and 5 of our Terms.
© 2020 The Author(s). This work is published and licensed by Dove Medical Press Limited. The
full terms of this license are available at https://www.dovepress.com/terms
and incorporate the Creative Commons Attribution
- Non Commercial (unported, 3.0) License.
By accessing the work you hereby accept the Terms. Non-commercial uses of the work are permitted
without any further permission from Dove Medical Press Limited, provided the work is properly
attributed. For permission for commercial use of this work, please see paragraphs 4.2 and 5 of our Terms.