Back to Journals » Diabetes, Metabolic Syndrome and Obesity » Volume 13
Genetic Association of SH2B1 Gene Polymorphisms in Jordanian Arab Patients with Type 2 Diabetes Mellitus
Authors AL-Eitan LN ![]() , Aman H, Alkhatib R
, Aman H, Alkhatib R ![]() , Alghamdi MA
, Alghamdi MA ![]()
Received 13 January 2020
Accepted for publication 5 May 2020
Published 22 May 2020 Volume 2020:13 Pages 1825—1834
DOI https://doi.org/10.2147/DMSO.S245843
Checked for plagiarism Yes
Review by Single anonymous peer review
Peer reviewer comments 2
Editor who approved publication: Dr Konstantinos Tziomalos
Laith N AL-Eitan,1,2 Hatem Aman,2 Rami Alkhatib,1,2 Mansour A Alghamdi3
1Department of Applied Biological Sciences, Jordan University of Science and Technology, Irbid 22110, Jordan; 2Department of Biotechnology and Genetic Engineering, Jordan University of Science and Technology, Irbid 22110, Jordan; 3College of Medicine, King Khalid University, Abha 61421, Saudi Arabia
Correspondence: Laith N AL-Eitan
Department of Applied Biological Sciences, Jordan University of Science and Technology, P.O. Box 3030, Irbid 22110, Jordan
Tel +962 2 7201000
Fax +962 2 7201071
Email [email protected]
Objective: To investigate the genotypic and allelic association of Src homology 2 B adapter protein 1 (SH2B1) gene polymorphisms with type 2 diabetes mellitus (T2DM) in Jordanian patients.
Patients and Methods: Three hundred patients were screened, but only 200 adult Jordanian patients diagnosed with T2DM (53.5% male and 46.5% female) have participated in this study. Blood samples were collected from both patients and healthy individuals for DNA extraction according to well-established procedures. Exon 1 and exon 9 of the SH2B1 gene were sequenced using an efficient and sensitive DNA sequencing method in order to identify specific single nucleotide polymorphisms (SNPs) in the SH2B1 gene associated with T2DM. Genetic and haplotype correlation analysis was performed for the chosen SNPs to detect any association if existent. In addition, SNPStats Web Tool and Hardy–Weinberg equilibrium (HWE) analyses for the genotype distribution were used. The significance was determined according to the P-value, and the level of significance taken as P < 0.05. The normality of the data distribution was statically analysed by the Shapiro–Wilk test with a P-value > 0.05. Also, the patient’s characteristics and clinical data about all participants were mentioned.
Results: Two novel variations were present in the SH2B1 gene in Jordanian patients with T2DM: c.827C>G and c.2026G>A, and previously reported five SNPs: rs146946750, rs565131715, rs370302573, rs143212778, rs200470848. Our results showed a strong genetic association of rs565131715 SNP polymorphism within the SH2B1 gene in T2DM patients (χ2 test, P < 0.001). Additionally, rs143212778 SNP presented a genetic correlation with T2DM patients (χ2 test, P = 0.035) as compared to control individuals. GTACG haplotype of SH2B1 has a highly significant association with responders (P< 0.0001).
Conclusion: Our findings indicated a strong association between the rs565131715 polymorphism and the risk of T2DM among the Jordanian population. Moreover, our data showed that the rs143212778 polymorphism significantly elevated the danger of T2DM among this population. This study reveals the first data regarding the SH2B1 gene polymorphisms in Jordanian patients of Arab descent with diabetes.
Keywords: SH2B1, type 2 diabetes mellitus, Jordan, Arab
Introduction
Diabetes mellitus (DM) is a genetically inherited disorder that involves two major types: type 1 and type 2 diabetes. The understanding of diabetes mellitus epidemiology and genetics has recently improved.1 The prevalence of this disease is almost 85% worldwide and affects a very large proportion of people, including both young and older individuals.2 Type 2 diabetes mellitus (T2DM) is a complex disorder that is affected by both environmental and genetic factors.3,4 One of the most important environmental factors includes the high-level intake of food calorie and an inactive lifestyle.5,6
Gene variations contribute crucially to increasing the risk of diabetes, especially T2DM. Recently, researchers have the ability to examine the whole genome in order to identify SNPs more instantly in population with larger sample sets. For instance, genome scan studies have been recently performed in order to determine the major susceptibility genes that are associated with T2DM. The genetic factors involved in the pathogenesis of T2DM have been reported in several genetic epidemiological studies.7,8 There are many T2DM susceptibility gene variants that are relatively common in the population, and each one contributes a modest effect on the danger of the disease.7,8 For example, many recent genetic studies have shown that the Src homology 2 B adapter protein 1 (SH2B1) gene and its polymorphisms have a major role in developing T2DM.8 SH2B1 gene is located on chromosome 16p 11.2 and encoded SH2B adapter protein 1 in humans.9,10 SH2B1 acts as an adapter protein for many ligands, such as insulin, leptin, platelet-derived growth factor (PDGF), Glial cell-derived Neurotrophic Factor (GDNF), Insulin-like Growth Factor 1 (IGF1), Nerve Growth Factor (NGF), fibroblast growth factor and prolactin that activate either receptor tyrosine kinases or cytokine receptors associated with Janus kinases (JAK).10
In this study, we aimed to investigate the genetic association of SH2B1 gene polymorphisms with susceptibility to the T2DM in the Jordanian population by detecting and characterizing the different variations within the SH2B1 gene in T2DM patients and healthy participants.
Patients and Methods
Subjects
A retrospective matched case–control study was conducted between 2014 and 2015 at King Abdullah University Hospital (KAUH) and the Health Centre of Jordan University of Science and Technology (JUST), Irbid, Jordan. Written informed consent was obtained from all participants included in the study. Inclusion criteria included diagnosis with T2DM more than 6 months earlier and commencement of treatment at the KAUH diabetes clinic, living in Jordan and being 30 years of age or older. We excluded patients with type 1 diabetes, pregnant women and patients with comorbid conditions such as cancer, new-onset diabetes after organ transplant, or a recent cardiovascular event within the 3 months prior to the beginning of the study. Initially, 300 patients were screened, but only 200 adult Jordanian patients diagnosed with T2DM with an age ranged between (40–60) years (53.5% male and 46.5% female) were participated in this study. All Patients fulfilled the inclusion criteria and genotyped successfully (Figure 1). In addition to patients, 200 healthy Jordanian individuals have participated as controls. Several matched parameters between patients and controls such as age, gender and body mass index (BMI) were taken in full consideration. Clinical and demographic data of both patients and controls were collected and summarized in AL-Eitan et al,4 using a 4-section questionnaire designed specifically for the study and in concordance with the guidelines and definitions of the World Health Organization (WHO) and the American Diabetes Association (ADA). The Institutional Review Board (IRB) of the Jordan University of Science and Technology approved this study on 28/1/2014 with approval number 73/9/2014. This study was also conducted in accordance with the Declaration of Helsinki.
 |
Figure 1 Flowchart of T2DM patients. |
DNA Isolation and Genotyping
Genomic DNA was extracted within 1 week of blood collection via commercially available Puregene Blood Core Kit B (Qiagen, Valencia, CA) according to the manufacturer’s instructions. DNA yield was measured using the NanoDrop ND-1000 spectrophotometer (NanoDrop Technology, Wilmington, DC, USA). DNA was amplified using specific primers to the SH2B1 gene; primers were designed online using primer 3 software (http://primer3.ut.ee/). Additional information on primers and PCR products are shown in Table S1. Candidate SH2B1 gene polymorphisms of interest are also shown in Table S2 and (Figure 2). The polymerase chain reaction (PCR) was optimized for DNA amplification and the optimal annealing temperature of 60°C was used. The amplification protocol is summarized in Table S3. The PCR product was visualized on 2% agarose gel (Promega Corporation, Madison, Wisconsin, USA). Five microliters of each PCR product and 5 µL of 1 KB ladders (Thermo Scientific, MA, USA) were loaded into wells of 2% agarose gel. Three microliters of 10 mg/mL Ethidium Bromide (Bio Basic Inc., Ontario, Canada) was added to the gel to stain the DNA band for visualization. The gel was run using 1X Tris borate EDTA (TBE) running buffer (prepared from 10X TBE: 108 g of Tris, 55 g of Boric Acid, 40 mL of EDTA 0.5 M, dissolved in up to 2 L distilled water) using electrical current source of 150 V for 45 mins. Gel documentation was done under ultraviolet (UV) transilluminator supplied with a gel documentation system (Bio-Rad, Hercules, CA, USA).
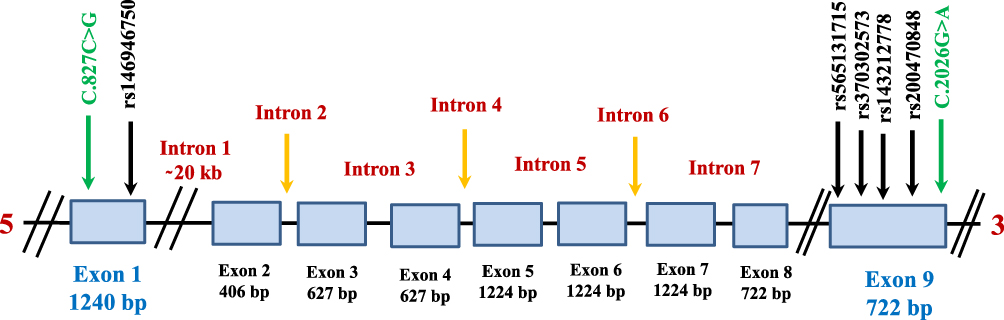 |
Figure 2 Schematic structure of the human SH2B1 gene. The positions of the seven SNPs genotyped and their dbSNP IDs are also shown. |
The PCR product size has been measured by matching the known band size of the ladder. PCR product has been purified to remove unwanted PCR components by using the EZ-10 Spin Column PCR Product Purification Kit (Bio Basic Inc., Ontario, Canada) according to the manufacturer’s instructions. After purification of the PCR product, the samples were ready for sequencing reaction protocol. The PCR-sequencing products were cleaned to remove small molecules from nucleic acids. The cleaning up of the PCR-sequencing was performed according to the manufacturer’s instructions by a special cleaning kit (Promega Corporation, Madison, WI, USA). Then, the sample was either directly loaded on the genetic analyzer (Applied Biosystems, Foster City, CA, USA) or stored at −20°C.
Chromatogram Analysis
Gene sequences chromatograms were analyzed using Chromas Pro software v.1 (USA). Samples were compared to the reference sequence (Ensembl ID: ENSG00000178568) obtained from the Ensembl genome browser (http://www.ensembl.org/index.html) to search for abnormalities, deletions, insertions, substitutions or heterozygosity.
Statistical Analysis
Genetic and haplotype correlation analyses were performed for the chosen SNPs to detect any association if existent. For more confirmation, SNPStats Web Tool (https://www. snpstats.net/start.htm) and Hardy–Weinberg equilibrium (HWE) values were applied for the genotype distribution and the minor allelic frequency (MAF). As appropriate, clinical variables (eg HbA1c (%), total cholesterol (mmol/L), HDL cholesterol (mmol/L), LDL cholesterol (mmol/L), triglyceride (mmol/L) or creatinine (umol/l)) were compared using Pearson’s chi-squared test, t-test, and ANOVA F-test.The significance was determined according to the P-value, the level of significance taken as P< 0.05. The normality of the data distribution was statically analysed by the Shapiro–Wilk test with a P-value >0.05.
Results
Gel Electrophoresis
The amplified fragments for genotyping C.827C>G and rs146946750 SNPs within exon 1 (1240 bp) and C.2026G>A, rs565131715, rs370302573, rs143212778, and rs200470848 SNPs within exon 9 (722 bp) are presented in Figure 3.
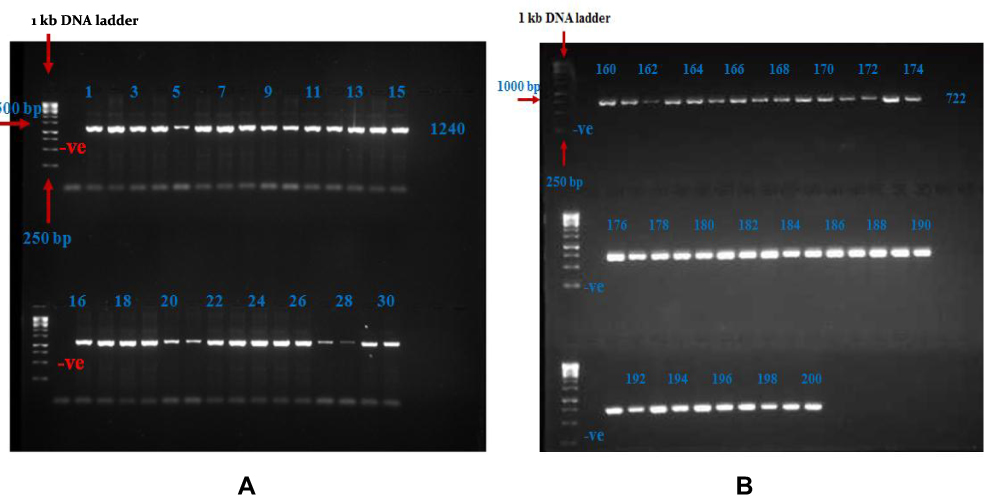 |
Figure 3 Gel Electrophoresis Results. (A) Separation of PCR products of SH2B1 gene by 2% agarose gel for exon1. The first lane from the left corresponds to the 1 kb DNA ladder. Lane –Ve: represent of negative blank. Lanes 1–30: the 1240 bp amplified product for samples that represent the DNA samples for T2DM patients. (B) Separation of PCR products of SH2B1 gene by 2% agarose gel for exon9. The first lane from the left corresponds to the 1 kb DNA ladder. Lane –Ve: represent of negative blank. Lanes 160–200: the 722 bp amplified product for samples that represent the DNA samples for T2DM patients. |
SH2B1 Gene Sequencing Analysis
This genetic analysis revealed two SNPs in exon 1; one of them was novel. The other five SNPs were genotyped for exon 9; one of them was novel. The (C) nucleotide at position 827 in the revised Cambridge reference sequence (rCRS) was substituted with a (G) nucleotide, resulting in G827C novel polymorphism, and the (G) nucleotide at position 2026 in the rCRS was substituted with an (A) nucleotide, resulting in G2026A novel polymorphism for exon 9 (Figure 4). Five SNPs for exon 9 and two SNPs for exon 1 were also genotyped and detected in all participants (Figure 4).
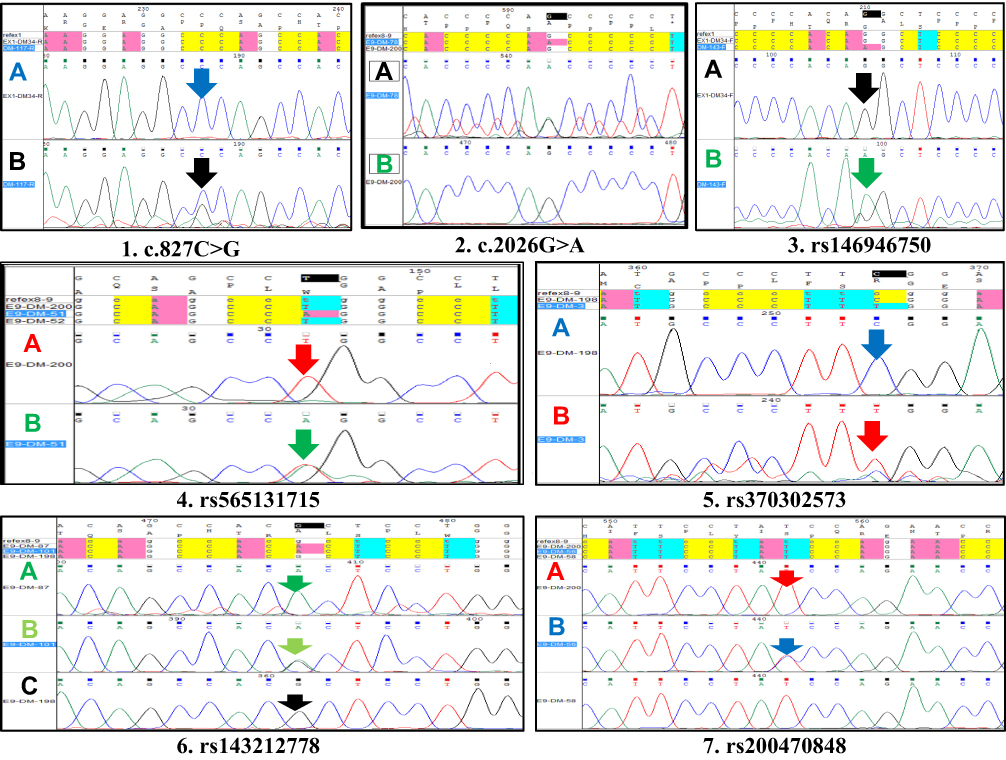 |
Figure 4 Capillary Electrophoresis and DNA-Sequencing Results. (1) Partial sequence Electropherograms of (NOVEL) SNP C827G for exon1. Notes: Reverse primer use here in PCR-sequencing step. (A) The wild type allele shows a conserved C at position 827 in DM-34 sample. Vertical arrow points to the conserved nucleotide C (blue peak) to G (black peak). (B) A sample showing a heterozygous C827G sequence variant. (2) Partial sequence Electropherograms of (NOVEL) SNP G2026A for exon9. Reverse primer use here in PCR-sequencing step. (A) The wild type allele shows a conserved G at position 2026 in DM-200 sample. Vertical arrow points to the conserved nucleotide G (black peak) to A (Green peak). (B) A sample showing a heterozygous G2026A sequence variant. (3) Partial sequence Electropherograms of G3241A SNP for exon1. Forward primer use here in PCR-sequencing step. (A) The wild-type allele shows a conserved G at position 3241 in DM-34 sample. Vertical arrow points to the conserved nucleotide G (black peak) to A (Green peak). (B) A sample showing a homozygous G3241A sequence variant. (4) Partial sequence Electropherograms of T361A SNP for exon9. This primer covers the T361A SNP. Reverse primer use here in PCR-sequencing step. (A) The wild type allele shows a conserved T at position 361 in DM-198 sample. Vertical arrow points to the conserved nucleotide T (red peak) to A (Green peak). (B) A sample showing a heterozygous T361A sequence variant. (5) Partial sequence Electropherograms of C1930T SNP for exon9. This primer covers the C1930T SNP. Forward primer use here in PCR-sequencing step. (A) The wild type allele shows a conserved C at position 1930 in DM-198 sample. Vertical arrow points to the conserved nucleotide C (blue peak) to T (red peak). (B) A sample showing a heterozygous C1930T sequence variant. (6) Partial sequence Electropherograms of G2161A SNP for exon9. This primer covers the G2161A SNP. Forward primer use here in PCR-sequencing step. (A) Sample showing homozygous G2161A in sequence variant for DM-87. (B) Sample showing heterozygous G2161A in sequence variant for DM-101. (C) The wild type allele shows a conserved G at position 2161 in DM-198 sample. Vertical arrow points to the conserved nucleotide G (blue peak) to A (red peak). (7) Partial sequence Electropherograms of T2221C SNP for exon9. This primer covers the T2221C SNP. Forward primer use here in PCR-sequencing step. (A) The wild-type allele shows a conserved T at position 2221 in DM-200 sample. Vertical arrow points to the conserved nucleotide T (blue peak) to C (red peak). (B) A sample showing a heterozygous T2221C sequence variant. |
Allelic and Genotyping Distribution of T2DM Patients and Healthy Controls
After SH2B1 SNPs analysis, genotypic and allelic frequencies were estimated for all variants in T2DM patients and healthy individuals (Tables 1 and 2).
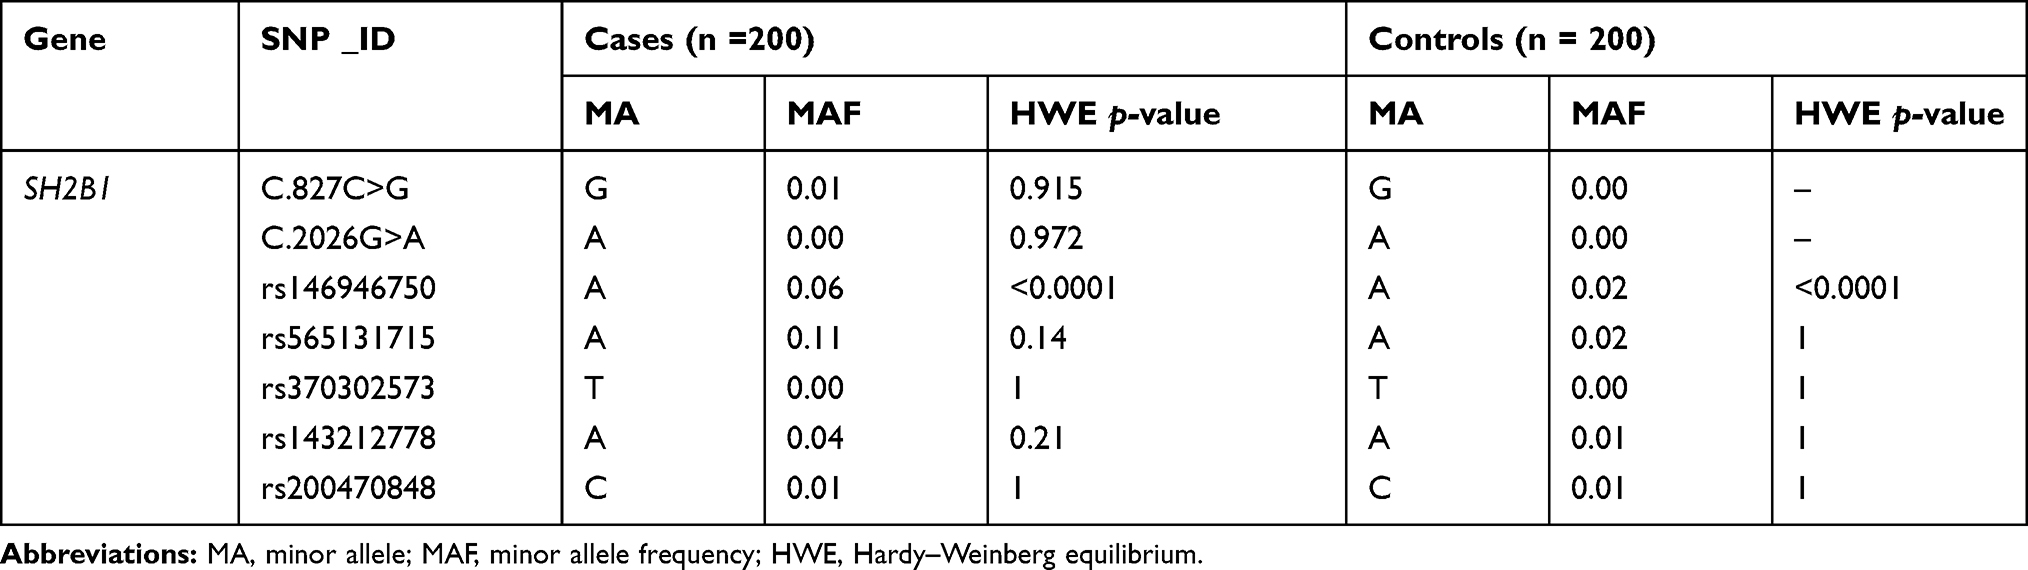 |
Table 1 SH2B1 SNPs, Their Minor Allele Frequencies, and HWE p-values in T2DM and Controls |
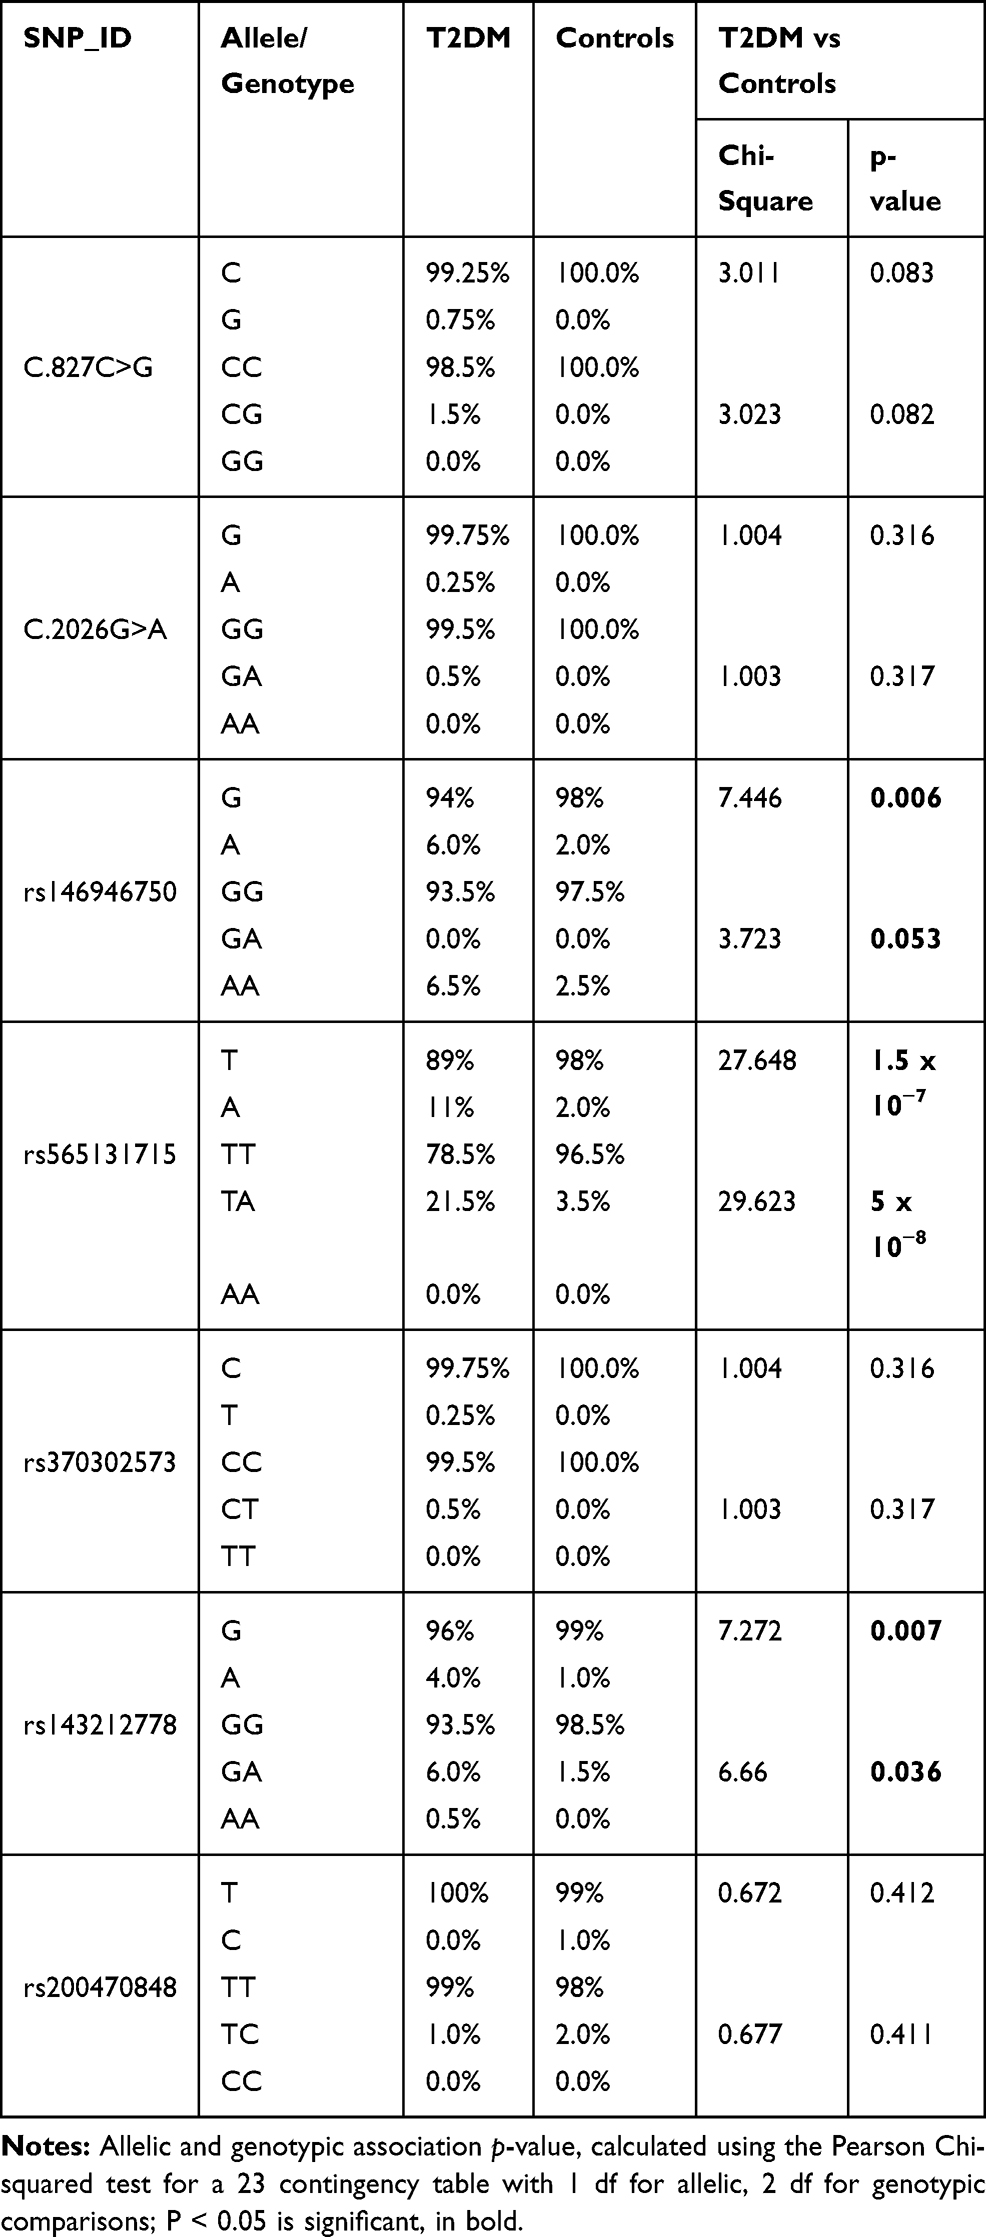 |
Table 2 Allele and Genotype Distributions of the Exon1 and Exon 9 Polymorphisms Within the SH2B1 Gene in T2DM Patients and Controls |
Genetic Association of SH2B1 Gene Polymorphisms with T2DM Patients
T2DM patients were compared to healthy individuals to search for any significant relationship between the variants and T2DM disease. Analysis of seven SNPs within the SH2B1 gene with T2DM was performed using the Chi-square analysis test (Table 2). The strongest statistical evidence for the genotypic association signals from rs565131715 SNP and rs143212778 (G/A) in exon 9 of SH2B1, with overall estimating of effects returning an odds ratio (OR) 7.55 (χ2 test (df = 2, n = 400) = 30, P < 0.001) and 4.21 (χ2 test (df = 2, n = 400) = 7, P = 0.036), respectively, was shown. However, the strongest statistical evidence of allelic frequency for these new association signals were from rs565131715 (χ2 test (df = 1, n = 400) = 28, P < 0.001), rs146946750 (χ2 test (df = 1, n = 400) = 8, P = 0.006) and rs143212778 (χ2 test (df = 1, n = 400) = 7, P = 0.007). Analysis of association between genotype and T2DM was also conducted using different genetic models such as the dominant, additive and recessive models (Table 3). According to the genetic analysis shown in (Tables 2 and 3), the highest degree of genetic association was shown in rs565131715 SNP (χ2 test, P< 0.001). The analysis of SNPs rs146946750 and rs143212778 within the SH2B1 gene by different genetic models also showed different association results.
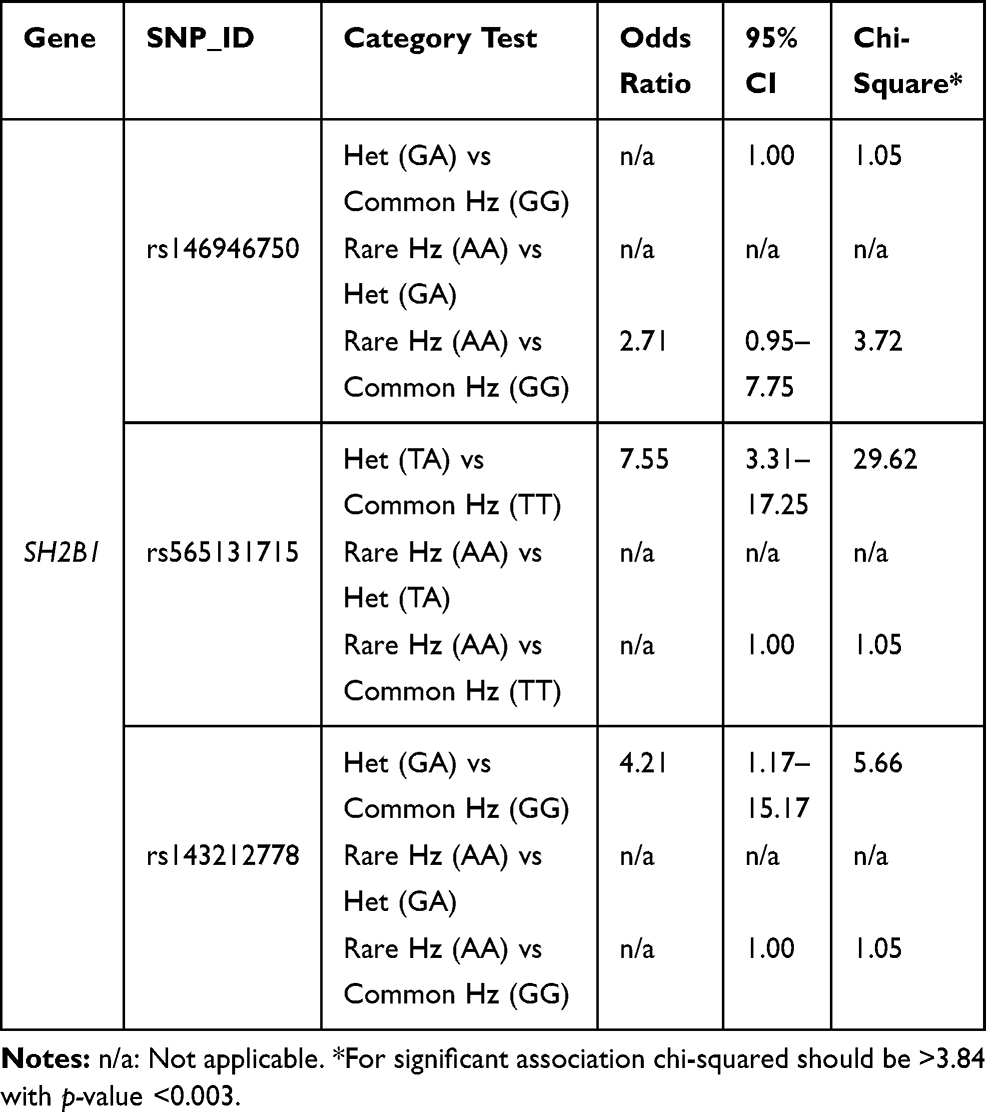 |
Table 3 Genetic Association Analysis of rs146946750, rs565131715 and rs143212778 Polymorphisms in T2DM Cases and Controls Using Different Genetic Models |
Genetic Association of the SH2B1 Gene Haplotypes
Four haplotypes were formed within the SH2B1 gene (Table 4). The genetic haplotype blokes of GTACG, GTTCA and ATTCG showed significant association with T2DM susceptibility as their frequency was higher in patients with T2DM than controls (P<0.0001, P= 0.037, and P= 0.022, respectively). Linkage disequilibrium analysis for the SH2B1 gene was shown in (Figure 5).
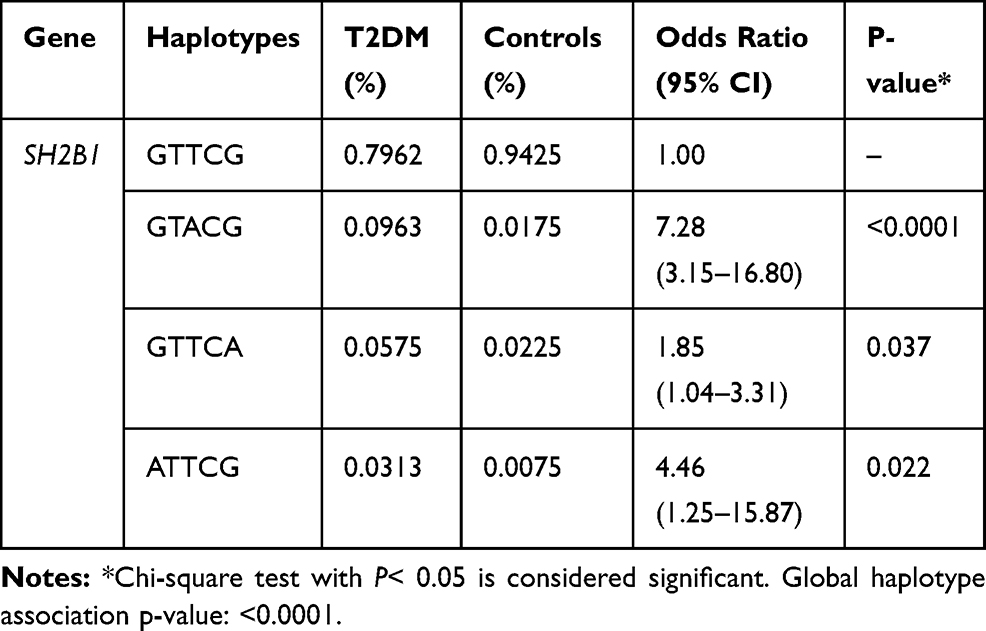 |
Table 4 Haplotype Association with Response (n=400, Crude Analysis) Within SH2B1 Gene in Patients with T2DM Compare to Healthy Controls |
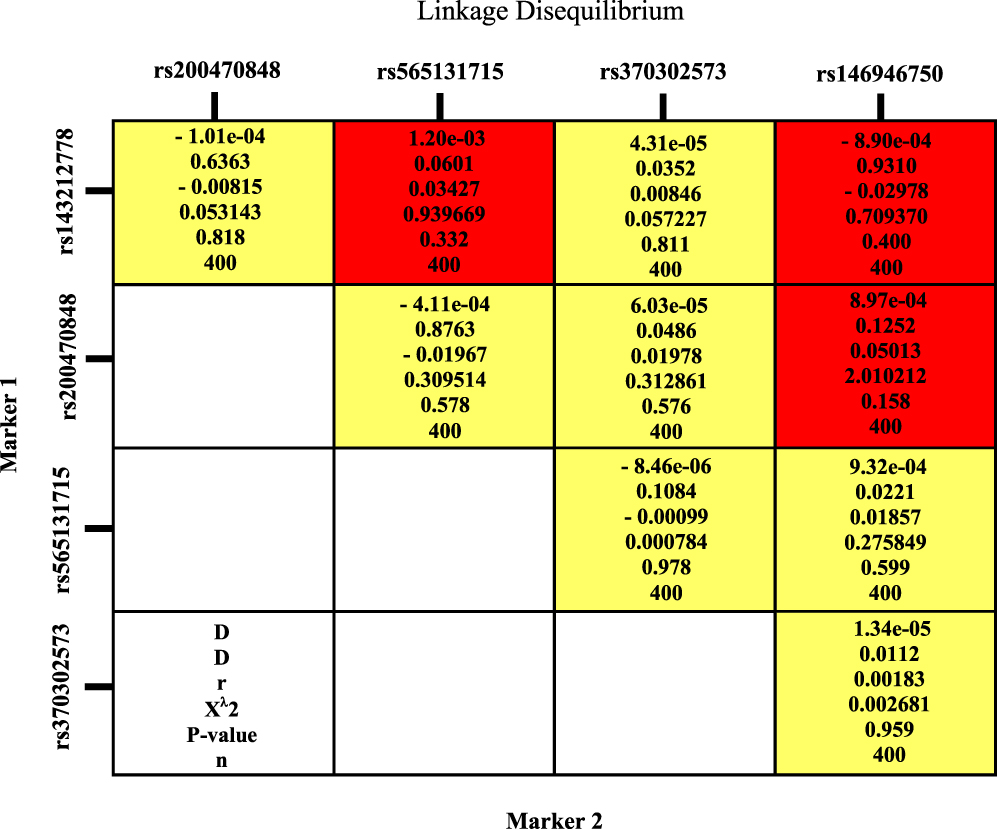 |
Figure 5 Linkage disequilibrium analysis for SH2B1 gene. |
Correlation Between SH2B1 Gene Polymorphisms and T2DM Clinical Data
A significant association was found between rs1219648 and body mass index (BMI), and rs2981682 and HDL with p-value <0.05. However, there was no significant correlation between other SH2B1 gene polymorphisms and BMI, gender and other clinical variables with a p > 0.05 as shown in Table 5.
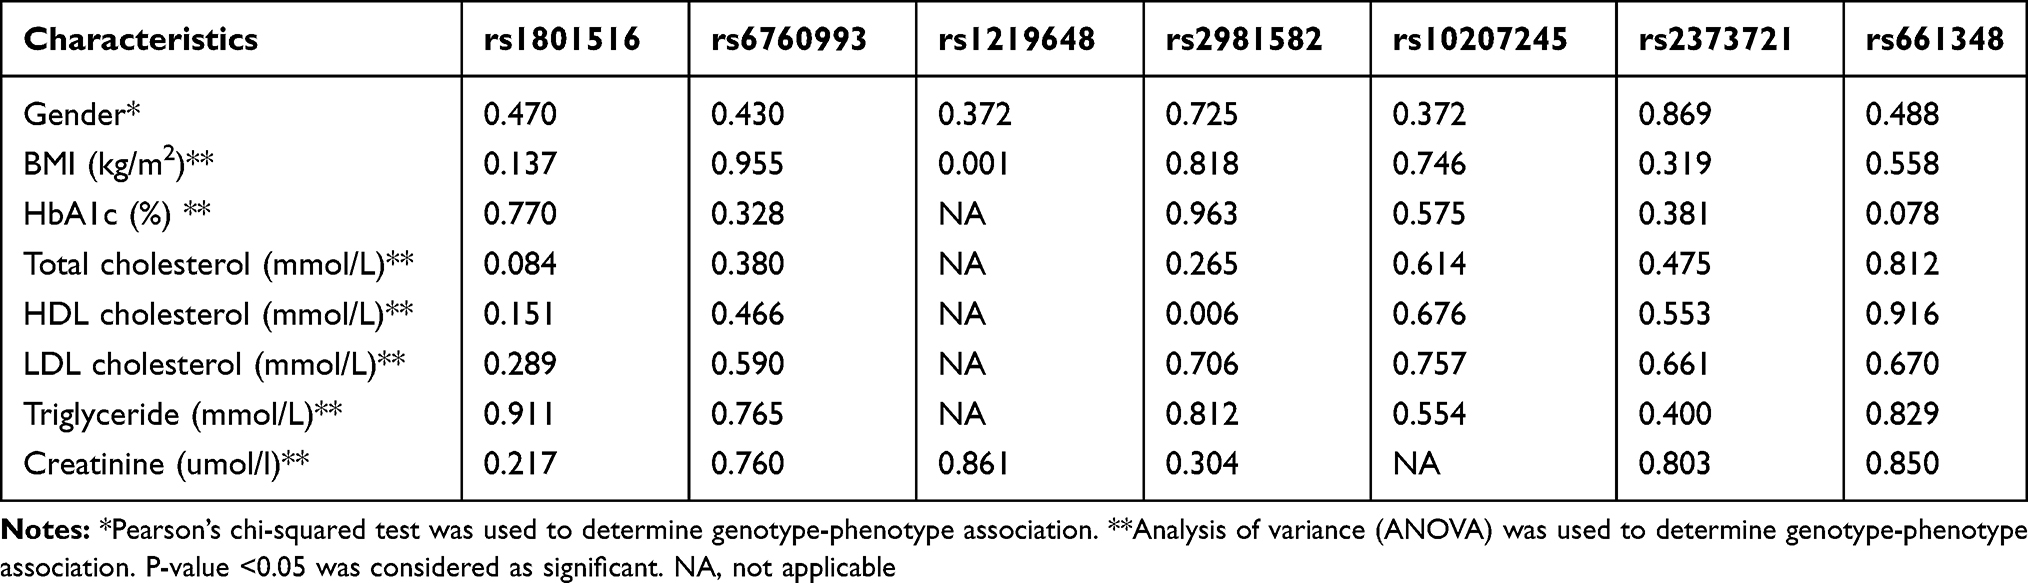 |
Table 5 Association Between Single Nucleotides Polymorphisms Within SH2B Gene and T2DM Clinical Factors |
Discussion
To the best of our knowledge, this cross-sectional study (n = 400) is the first genetic association study analyzing SH2B1 gene variants in the Jordanian Arab population. Our data indicated that there is a significant implication of the single nucleotide polymorphisms including rs565131715, rs146946750 and rs143212778 within the SH2B1 gene with T2DM in Jordanian diabetic patients. On the other hand, five SNPs showed no significant differences in allelic or genotypic frequencies. However, a significant association was identified in two locations: rs565131715 (T/A, 5ʹ-UTR) and rs143212778 (G/A, 3ʹ-UTR). For the allelic frequency, the strongest statistical evidence for these association signals was from rs565131715. Moreover, our data showed a similar allelic frequency distribution with minor allele frequency (MAF) for an allele of rs565131715 (1.75%) and an allele of rs143212778 (1%) of healthy Jordanian population when compared with different sub-populations such as African, American, East Asian, European and South Asian (www.ensemble.org). Thus, the ensemble genome browser (www.ensemble.org) reported that both SNPs play a major role in the regulation of gene expression as 5ʹ-UTR and 3ʹ-UTR regulator region variant with global minor allele frequency less than 0.01. It has been suggested that these SNPs have an important genetic factor affecting the function of the SH2B1 gene by influencing its expression.
The level of glucose in the human biological system and reinforcing mechanisms in the body is regulated by the insulin secretion system,11,12 more specifically the positive supporting impacts of insulin secretion.13 The current study showed that genetic variations, particularly rs565131715 (T/A), within the SH2B1 gene play a vital role as a susceptible gene for T2DM. Human and animal studies on T2DM have shown that the SH2B1 gene involves in the mechanism of glucose level regulation. Different animal studies suggested that the effects of insulin resistance were not expressed in mice lacking SH2B1 adapter protein. Conversely, SH2B1 overexpression in transgenic mice resulted in the reduction in the regulation of insulin sensitivity and glucose metabolism.14–16 Meanwhile, as the overexpression of SH2B1 increases; both glucose-stimulated insulin secretion and insulin expression also increase.17 Various genetic studies revealed that heterozygous deletion of SH2B1 plays a major role in decreasing the content of pancreatic insulin and levels of insulin in the plasma of leptin-deficient ob/ob mice. Thus, aggravating hyperglycaemia and glucose intolerance were observed altogether suggesting an aggravated disorder when compared to controls.18 Furthermore, insulin promoter activity is increased by the influence of overexpressed JAK2 and SH2B1 reinforced JAK2’s ability to activate the insulin promoter.19
A number of genetic studies on humans have suggested that any deficiencies in the insulin-signalling pathway could result from either mutation in the insulin receptor within the SH2B1 gene, or the existence of antibodies against either the insulin receptor or insulin itself, are rarely causing insulin resistance.20,21
In this study, no effect of population stratification was encountered due to the relative homogeneity of the Jordanian Arab population. This provides useful benefits to genetic studies as smaller numbers of multiple variations occurred in the genes that are responsible for the observed phenotypes, and expected to be identified in populations that are more homogeneous. Thus, the possibility to identify genetic associations will be increased. Consequently, results with high accuracy can be obtained from a study of a genetically homogenous population, even with a small sample size. Direct sequencing of the coding regions, the splicing junctions and part of the intronic region carried out the screening. The sequence genotyping data indicated that rs565131715, rs143212778, and rs146946750 variants showed a genetic association between these SNPs and T2DM patients. A total of two novel mutations and five SNPs have been found in the SH2B1 gene. The rest of the SNPs and the two novel mutations were found in the coding region of this gene. Since it is the first genetic study of its kind, the main limitations of this genetic analysis are small sample size and the lack of appropriate models of gene–gene and gene–environment interactions in risk disease assessment.
Further studies with a larger sample size are needed to confirm the genetic association between T2DM among Jordanians and candidate gene polymorphisms. Moreover, the combination of the previous genetic variants has been associated with T2DM predispositions and remarkably found to be also involved in this disease within Jordanian patients. However, our findings require replication in both Arab and other ethnic groups to affirm these results and identify individuals at increased risk of diabetes development and its progression. Currently, the same sample sets are being analyzed in order to find a probable association between SH2B1 variations and treatment outcomes. This may result in improved levels of accuracy in matching individuals to various treatment choices and earlier identification of individuals with a high risk of diabetes. It is also important to focus on the intronic region in the SH2B1 gene, which may contain SNPs that are associated with gene expression levels. Further genetic haplotype analysis is also needed to study the SNP interactions and determine their effects on clinical outcomes. Finally, genome-wide association studies (GWAS) and DNA sequencing are needed to increase our understanding of T2DM pathogenesis among Jordanian patients. This will aid in finding founder mutation in different genes among families with strong familial clustering diabetes in Jordan.
Abbreviations
T2DM, type 2 diabetes mellitus; SNPs, single nucleotide polymorphisms; DM, diabetes mellitus; PDGF, platelet-derived growth factor; GDNF, glial cell-derived neurotrophic factor; IGF1, insulin-like growth factor 1; NGF, nerve growth factor, FGF, fibroblast growth factor; JAK, Janus kinases; BMI, body mass index; IRB, Institutional Review Board; PCR, polymerase chain reaction; TBE, Tris borate EDTA; HWE, Hardy–Weinberg equilibrium; rCRS, revised Cambridge reference sequence; OR, odds ratio; MAF, minor allele frequency; 5ʹ-UTR, 5ʹ-untranslated region; 3ʹ-UTR, 3ʹ-untranslated region; GWAS, genome-wide association studies.
Acknowledgments
We would like to thank the Health Center of Jordan University of Science and Technology Staff specifically Dr. Wael and Ms. Omaimah for approving the work carried out for this study in the first instance. Funding for this project was provided by the Deanship of Research (RN: 20130218), Jordan University of Science and Technology (JUST). We would like to extend our thankfulness to the Princess Haya Biotechnology Centre (PHBC) for their technical help and support. Mr. AL-Aman is an MSc scholar at the Applied Biological Sciences Department.
Author Contributions
L.N.A.-E. designed the study. L.N.A.-E. and H.A.A. were responsible for clinical data and blood samples collection and prepared the manuscript. L.N.A.-E., H.A.A. R.Q.A. and M.A.A. analysed the samples and interpreted the data. All authors contributed to data analysis, drafting or revising the article, gave final approval of the version to be published, and agree to be accountable for all aspects of the work.
Disclosure
The authors report no conflicts of interest in this work.
References
1. Rom S, Zuluaga-Ramirez V, Gajghate S, et al. Hyperglycemia-driven neuroinflammation compromises BBB leading to memory loss in both diabetes mellitus (DM) type 1 and type 2 mouse models. Mol Neurobiol. 2019;56(3):1883–1896. doi:10.1007/s12035-018-1195-5
2. Tinahones FJ, Molina-Vega MV, Parra-Barona J, et al. Prevalence of postprandial hyperglycaemia in basal insulin-treated patients with type 2 diabetes mellitus with controlled fasting glycaemia and elevated glycosylated haemoglobin. Diabetol Metab Syndr. 2019;11(1):59. doi:10.1186/s13098-019-0452-8
3. Kumar V, Fausto N, Abbas AK, et al. Robbins and Cotran Pathologic Basis of Disease.
4. AL-Eitan LN, Nassar AM, Saadeh NA, et al. Evaluation of glycemic control, lifestyle and clinical characteristics in patients with type 2 diabetes treated at King Abdullah university hospital in Jordan. Can J Diabetes. 2016;40(6):496–502. doi:10.1016/j.jcjd.2016.04.009
5. Peng H, Hagopian W. Environmental factors in the development of Type 1 diabetes. Rev Endocr Metab Disord. 2006;7:149–162. doi:10.1007/s11154-006-9024-y
6. Ounissi-Benkalha H, Polychronakos C. The molecular genetics of type 1 diabetes: new genes and emerging mechanisms. Trends Mol Med. 2008;14:268–275. doi:10.1016/j.molmed.2008.04.002
7. Hualing Y, Yangyang N, Zhenyi C, et al. Genetic variants of the receptor for advanced glycation end-products in susceptibility to type 2 diabetes mellitus in primary hypertensive patients. Sci Rep. 2017;7(1):17207. doi:10.1038/s41598-017-17068-9
8. Bachmann-Gagescu R, Mefford C, Cowan C, et al. Recurrent 200-kb deletions of 16p11.2 that include the SH2B1 gene are associated with developmental delay and obesity. Genet Med. 2010;12:641–647. doi:10.1097/GIM.0b013e3181ef4286
9. Kong M, Wang CS, Donoghue DJ. Interaction of fibroblast growth factor receptor 3 and the adapter protein SH2-B: a role in STAT5 activation. J Biol Chem. 2002;277:15962–15970. doi:10.1074/jbc.M102777200
10. Rider L, Tao J, Snyder S, et al. Adapter protein SH2B1b cross-links actin filaments and regulates actin cytoskeleton. Mol Endocrinol. 2009;23:1065–1076. doi:10.1210/me.2008-0428
11. International Federation of Diabetes. IDF diabetes atlas. Available from: http://www.diabetesatlas.org/.
12. Aguirre V, Werner ED, Giraud J, et al. Phosphorylation of Ser307 in insulin receptor substrate-1 blocks interactions with the insulin receptor and inhibits insulin action. J Biol Chem. 2002;277:1531–1537. doi:10.1074/jbc.M101521200
13. Ahmed Z, Pillay TS. Adapter protein with a pleckstrin homology (PH) and a Src homology 2 (SH2) domains (APS) and SH2-B enhance insulin receptor autophosphorylation, extracellular-signal-regulated kinase and phosphoinositide 3-kinase-dependent signalling. Biochem. 2003;371:405–412. doi:10.1042/bj20021589
14. Guo S. Insulin signalling, resistance, and the metabolic syndrome: insights from mouse models to disease mechanisms. J Endocrinol. 2014;220(2):T1. doi:10.1530/JOE-13-0584
15. Francesca A, Dubé JJ, Coen PM, et al. Physical inactivity and obesity underlie the insulin resistance of aging. Diabetes Care. 2009;32(8):1547–1549. doi:10.2337/dc09-0267
16. Nathan LP, Abhishek KS, Noemi R, et al. Genetic ablation of miR-33 increases food intake, enhances adipose tissue expansion, and promotes obesity and insulin resistance. Cell Rep. 2018;22(8):2133–2145. doi:10.1016/j.celrep.2018.01.074
17. Carrascosa J, Andres A, Ros M. Development of insulin resistance during aging: involvement of central processes and role of adipokines. Curr Protein Pept Sci. 2011;12:305–315. doi:10.2174/138920311795906655
18. Prentki M, Nolan CJ. Islet β cell failure in type 2 diabetes. J Clin Invest. 2006;116:1802–1812.
19. Jiang Y, Lei Z, Yanpeng S, et al. SH2B1 protects against OGD/R‑induced apoptosis in PC12 cells via activation of the JAK2/STAT3 signaling pathway. Mol Med Rep. 2018;18(3):2613–2620. doi:10.3892/mmr.2018.9265
20. Giuranna J, Volckmar AL, Heinen A, et al. The effect of SH2B1 variants on expression of leptin-and insulin-induced pathways in murine hypothalamus. Obes Facts. 2018;11(2):93–108. doi:10.1159/000486962
21. Li Z, Zhou Y, Carter-Su C. SH2B1 enhances leptin signaling by both Janus kinase 2 Tyr813 phosphorylation-dependent and -independent mechanisms. Mol Endocrinol. 2007;21:2270–2281. doi:10.1210/me.2007-0111
 © 2020 The Author(s). This work is published and licensed by Dove Medical Press Limited. The
full terms of this license are available at https://www.dovepress.com/terms
and incorporate the Creative Commons Attribution
- Non Commercial (unported, 3.0) License.
By accessing the work you hereby accept the Terms. Non-commercial uses of the work are permitted
without any further permission from Dove Medical Press Limited, provided the work is properly
attributed. For permission for commercial use of this work, please see paragraphs 4.2 and 5 of our Terms.
© 2020 The Author(s). This work is published and licensed by Dove Medical Press Limited. The
full terms of this license are available at https://www.dovepress.com/terms
and incorporate the Creative Commons Attribution
- Non Commercial (unported, 3.0) License.
By accessing the work you hereby accept the Terms. Non-commercial uses of the work are permitted
without any further permission from Dove Medical Press Limited, provided the work is properly
attributed. For permission for commercial use of this work, please see paragraphs 4.2 and 5 of our Terms.