Back to Journals » Diabetes, Metabolic Syndrome and Obesity » Volume 16
Gender Differences in Relation to Body Composition, Insulin Resistance, and Islet Beta Cell Function in Newly Diagnosed Diabetic or Pre-Diabetic Patients
Authors Ma M, Jiang T ![]() , Wen Z, Zhang D
, Wen Z, Zhang D ![]() , Xiu L
, Xiu L
Received 14 November 2022
Accepted for publication 20 February 2023
Published 10 March 2023 Volume 2023:16 Pages 723—732
DOI https://doi.org/10.2147/DMSO.S397528
Checked for plagiarism Yes
Review by Single anonymous peer review
Peer reviewer comments 2
Editor who approved publication: Prof. Dr. Juei-Tang Cheng
Minglei Ma, Tao Jiang, Zhen Wen, Dongxue Zhang, Lei Xiu
Department of Endocrinology, Beijing Shijitan Hospital, Capital Medical University, Beijing, People’s Republic of China
Correspondence: Tao Jiang, Email [email protected]
Objective: To assess the correlation between body components with insulin resistance (IR) and islet beta cell function in patients with newly diagnosed type 2 diabetes mellitus (T2DM) or pre-diabetes mellitus (pre-DM) and to explore whether this correlation differs in males and females.
Methods: 111 newly diagnosed diabetic or pre-diabetic patients were recruited in this cross-sectional study. 75g oral glucose tolerance test was used to determine the diagnosis of DM or pre-DM. Homeostasis model assessment of insulin resistance (HOMA-IR) and glucose disposition index (DI30) was calculated to assess IR and islet beta cell function, respectively. Whole-body and regional lean mass (LM) and fat mass (FM) were obtained by dual-energy X-ray absorptiometry (DEXA). Partial correlation and multiple linear regression analyses were used to determine the associations between body composition, IR, and islet beta cell function.
Results: More body fat and appendicular fat was observed in female patients than in male, though with similar BMI. Legs fat % was negatively correlated with HOMA-IR, whereas legs lean % was positively associated with HOMA-IR in females (r = − 0.673, p = 0.017; r =0.664, p = 0.018, respectively). The regression analysis showed that legs LM was positively correlated with HOMA-IR in females. However, in male patients, android FM was positively correlated with HOMA-IR (r = 0.462, p = 0.007), and trunk LM was negatively associated with DI30 (r = − 0.458, p = 0.007). Nevertheless, no significant correlation was observed between body composition and islet beta cell function in female patients.
Conclusion: Android FM was positively correlated with IR only in male patients but not in females. Besides, relative legs fat and LM were independently associated with IR in female patients but not in males. Further studies are needed to explore the underlying mechanism.
Keywords: body composition, diabetes mellitus, insulin resistance, islet beta cell function
Background
During the past few decades, the prevalence of diabetes has increased worldwide, with an estimated prevalence of 12.2% in adults (783.2 million) by 2045.1 More and more overweight and obese people are diagnosed with type 2 diabetes mellitus (T2DM), among which 54.8% are obese and 85.2% are overweight or obese.2 Insulin resistance (IR) and the gradual decline of islet beta cell function are two major defects contributing to the occurrence and development of T2DM.3 These defects may also contribute to the development of impaired fasting glucose (IFG) and impaired glucose tolerance (IGT), also known as pre-diabetes (pre-DM), which occur before the diagnosis of DM.4
Obesity, especially central obesity, is a critical component of metabolic syndrome and a significant risk factor for metabolic diseases such as IR, T2DM, and cardiovascular disease (CVD).5,6 Body mass index (BMI) is a traditional indicator of obesity, which has been widely used because of its simplicity and convenience. However, BMI has certain limitations in the distribution of different body components. In recent decades, studies have shown that body fat distribution impact the risk of cardiometabolic disease independently of BMI or body fat percentage.7,8 Thus, more and more attention has been paid to the effects of body composition, as well as fat and muscle distribution forms, on different metabolic diseases. Most studies have focused on abdominal subcutaneous fatty tissue and visceral fat tissue, which are important risk factors that increase insulin resistance and promote the development of T2DM.9–11 Recently, scholars have also paid attention to the impact of other body components on IR,12–14 but studies focused on association with islet beta cell function are few.15 Moreover, most previous studies have focused on seemingly healthy or non-diabetic populations with risk factors. Few studies have explored the correlation between body composition and islet betacell function in patients with newly diagnosed diabetes and pre-DM and whether there are gender differences in this correlation. Therefore, the association between other fat depots and islet betacell function in diabetic patients remains inconclusively/unclear.
Because of the apparent gender differences in body composition, we propose that there may be gender differences in the correlation between body components and insulin resistance and islet beta cell function. This study is intended to analyze the differences in body components of different sexes in patients with newly diagnosed T2DM or pre-DM, to explore the correlation between various body components and insulin resistance and islet beta function, and to find out whether there is a gender difference in this correlation. Therefore, it is possible to understand better the gender differences in the effect of body composition on IR and islet beta cell function and help to make personalized recommendations for improved body composition in people of different sexes.
Methods
Population
The participants were recruited from Mar. 2020 to Feb. 2022 in the Department of Endocrinology, Beijing Shijitan Hospital, Capital Medical University. 111 adult patients aged 18 to 80 with newly diagnosed T2DM or pre-DM were included in this study (Figure 1). The diagnosis of DM and pre-DM were based on the diagnostic criteria of the World Health Organization (WHO), 1999. Those with fasting plasma glucose (FPG) ≥ 7.0 mmol/L or 2-h postprandial plasma glucose (PPG) ≥ 11.1 mmol/L were defined as having DM, those with FPG ≥ 6.1 mmol/L but < 7.0 mmol/L or 2-h PPG ≥ 7.8 mmol/L but < 11.0 mmol/L were defined as having pre-DM. The exclusion criteria were as follows: 1) patients previously diagnosed with diabetes or were taking hypoglycemic drugs; 2) patients diagnosed with type 1 diabetes, gestational diabetes, or other types of diabetes; 3) patients with a malignant tumor, severe cardiovascular, hepatic, or kidney disease. The study protocol was approved by the Ethics Committee of Beijing Shijitan Hospital, Capital Medical University (Approval Number: sjtkyll-lx-2021(27)) and was conducted in accordance with the Declaration of Helsinki. All patients provided written informed consent to participate in the study.
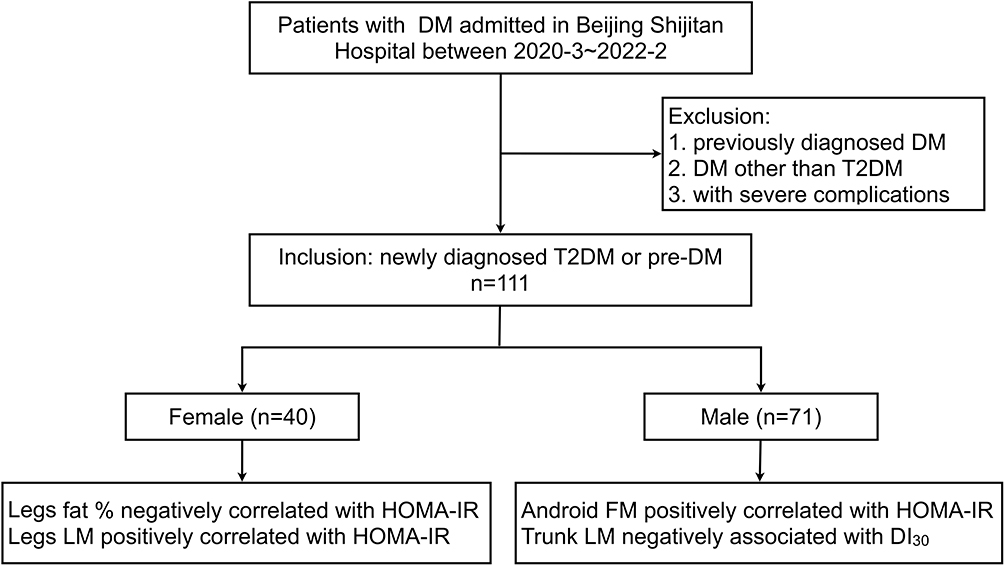 |
Figure 1 Flowchart and main results of the study. Abbreviations: DM, diabetes mellitus; T2DM, type 2 diabetes mellitus; pre-DM, pre-diabetes; LM, lean mass; FM, fat mass; HOMA-IR, homeostasis model assessment of insulin resistance; DI, glucose disposition index. |
Data Collection
Height and weight measurements were performed after overnight fasting with thin clothes without shoes. BMI was calculated by the formula: BMI = weight (kg) / height (m)2. Waist circumference (WC) was measured midway between the iliac crest and the costal margin. Venous blood was collected through the elbow vein from patients who had fasted for at least 10 hours. Glycosylated hemoglobin (HbA1c) was detected using a high-performance liquid chromatography method (Tosoh HLC-723 G8; Tosoh Bioscience, Inc, Tokyo, Japan). All the participants underwent a 75-g oral glucose tolerance test (OGTT) after overnight fasting. Venous blood was collected at 0, 30, 60, and 120 min and used to measure plasma glucose, serum insulin, and C peptide (CP). Plasma glucose was measured by the hexokinase method (Beckman AU5832 analyzer; Beckman Coulter, Brea, CA, USA). Serum insulin and CP was assessed by chemiluminescent enzyme immunoassay (LIAISON XLanalyzer; DiaSorin, Saluggia, Italy). The serum uric acid (UA) and lipid profile, including total cholesterol (TC), triglyceride (TG), high-density lipoprotein cholesterol (HDL-c), and low-density lipoprotein cholesterol (LDL-c), was measured using an automatic biochemical analyzer.
Measurement of Body Composition
The overall body composition was assessed using a dual-energy x-ray absorptiometry scanner (DEXA, Hologic Discovery: Vertec Scientific Ltd., Reading, UK). The scan results were analyzed using the Hologic APEX software (version 3.3: Hologic Inc., Bedford, MA, USA) and presented in terms of total mass (TM), fat mass (FM), lean mass (LM), fat-free mass (FFM) of the whole body, trunk, arms, and legs. The trunk region was limited by vertical borders lateral to the ribs and a lower border by the iliac crest. The android and gynoid FM were measured as described in a previous study.16 The same researcher completed the analysis of defined body segments during the entire study period. Total body fat (TBF) represents the fat percentage of the whole body. Regional fat percentage (fat %) and lean percentage (lean %) were calculated as FM or LM divided by TM of the same region to assess the relative fat and lean mass, respectively.
Assessment of Insulin Resistance and Islet Beta Cell Function
Homeostasis model assessment of insulin resistance (HOMA-IR) was used to assess insulin resistance: HOMA-IR = fasting plasma glucose (mmol/L) × fasting insulin (μIU/mL)/22.5.17 HOMA-IR is determined from results on fasting indices and is mainly used to estimate hepatic insulin sensitivity. Besides, the Matsuda insulin sensitivity index (ISIM) and Quantitative insulin sensitivity check index (QUICKI) were used to assess whole-body insulin sensitivity. ISIM was calculated using the following formula: ISIM = 104/[(fasting blood glucose × fasting insulin) × (average blood glucose × average insulin)]0.5.18 QUICKI was calculated by 1/[log insulin (μIU/mL) + log glucose (mg/dL)].19 Homeostasis model assessment of beta cell function (HOMA-β) was calculated to assess beta cell function using the formula: HOMA-β = 20 × fasting insulin (μIU/mL) / [fasting plasma glucose (mmol/L) – 3.5].17 The insulinogenic index (IGI) was used to assess the early-phase insulin secretion: IGI30 = ΔINS0–30/ΔGlu0–30.20 The disposition index (DI), a comprehensive evaluation of insulin secretion and insulin resistance, was measured as DI30 = ΔINS0–30/ΔGlu0–30 × ISIM.21
Statistical methods
Normality was assessed for all continuous variables. Normally distributed data were expressed as the mean ± SD, and Student’s t-test was used to evaluate differences between groups. Non-normally distributed data were expressed as the median (Q1, Q3), and differences between groups were assessed using the Mann‐Whitney U-test. Categorical variables were expressed as counts/percentiles (%), and Pearson’s χ2‐test was used to compare the difference between groups. Spearman correlation analysis, partial correlation analysis, and multiple linear regression analysis were used to assess the association of body composition with HOMA-IR (ln transformed) and DI30 (ln transformed). Confounding factors like age, smoking, alcohol, UA, TC, TG, HDL-c, and LDL-c were adjusted. All statistical analyses were performed using IBM SPSS Statistics 23.0 (IBM Corp., Armonk, NY, USA). A p-value <0.05 was considered significant.
Results
Basic Clinical Characteristics of Patients with Different Gender
The mean age of patients between females and males was similar. Few female participants were smokers and drinkers compared to male participants. Female patients were heavier than males, but the BMI between the two groups was similar. A lower HbA1c and FPG were observed in female patients than male patients, though without significant statistical differences. The UA and lipid profile was similar between females and males, except that the HDL-c level was higher in females than males. There were no significant differences in insulin sensitivity between males and females. Females have higher HOMA-β and DI30 than men, suggesting a better islet beta cell function in females, although the latter has no significant statistical differences (Table 1).
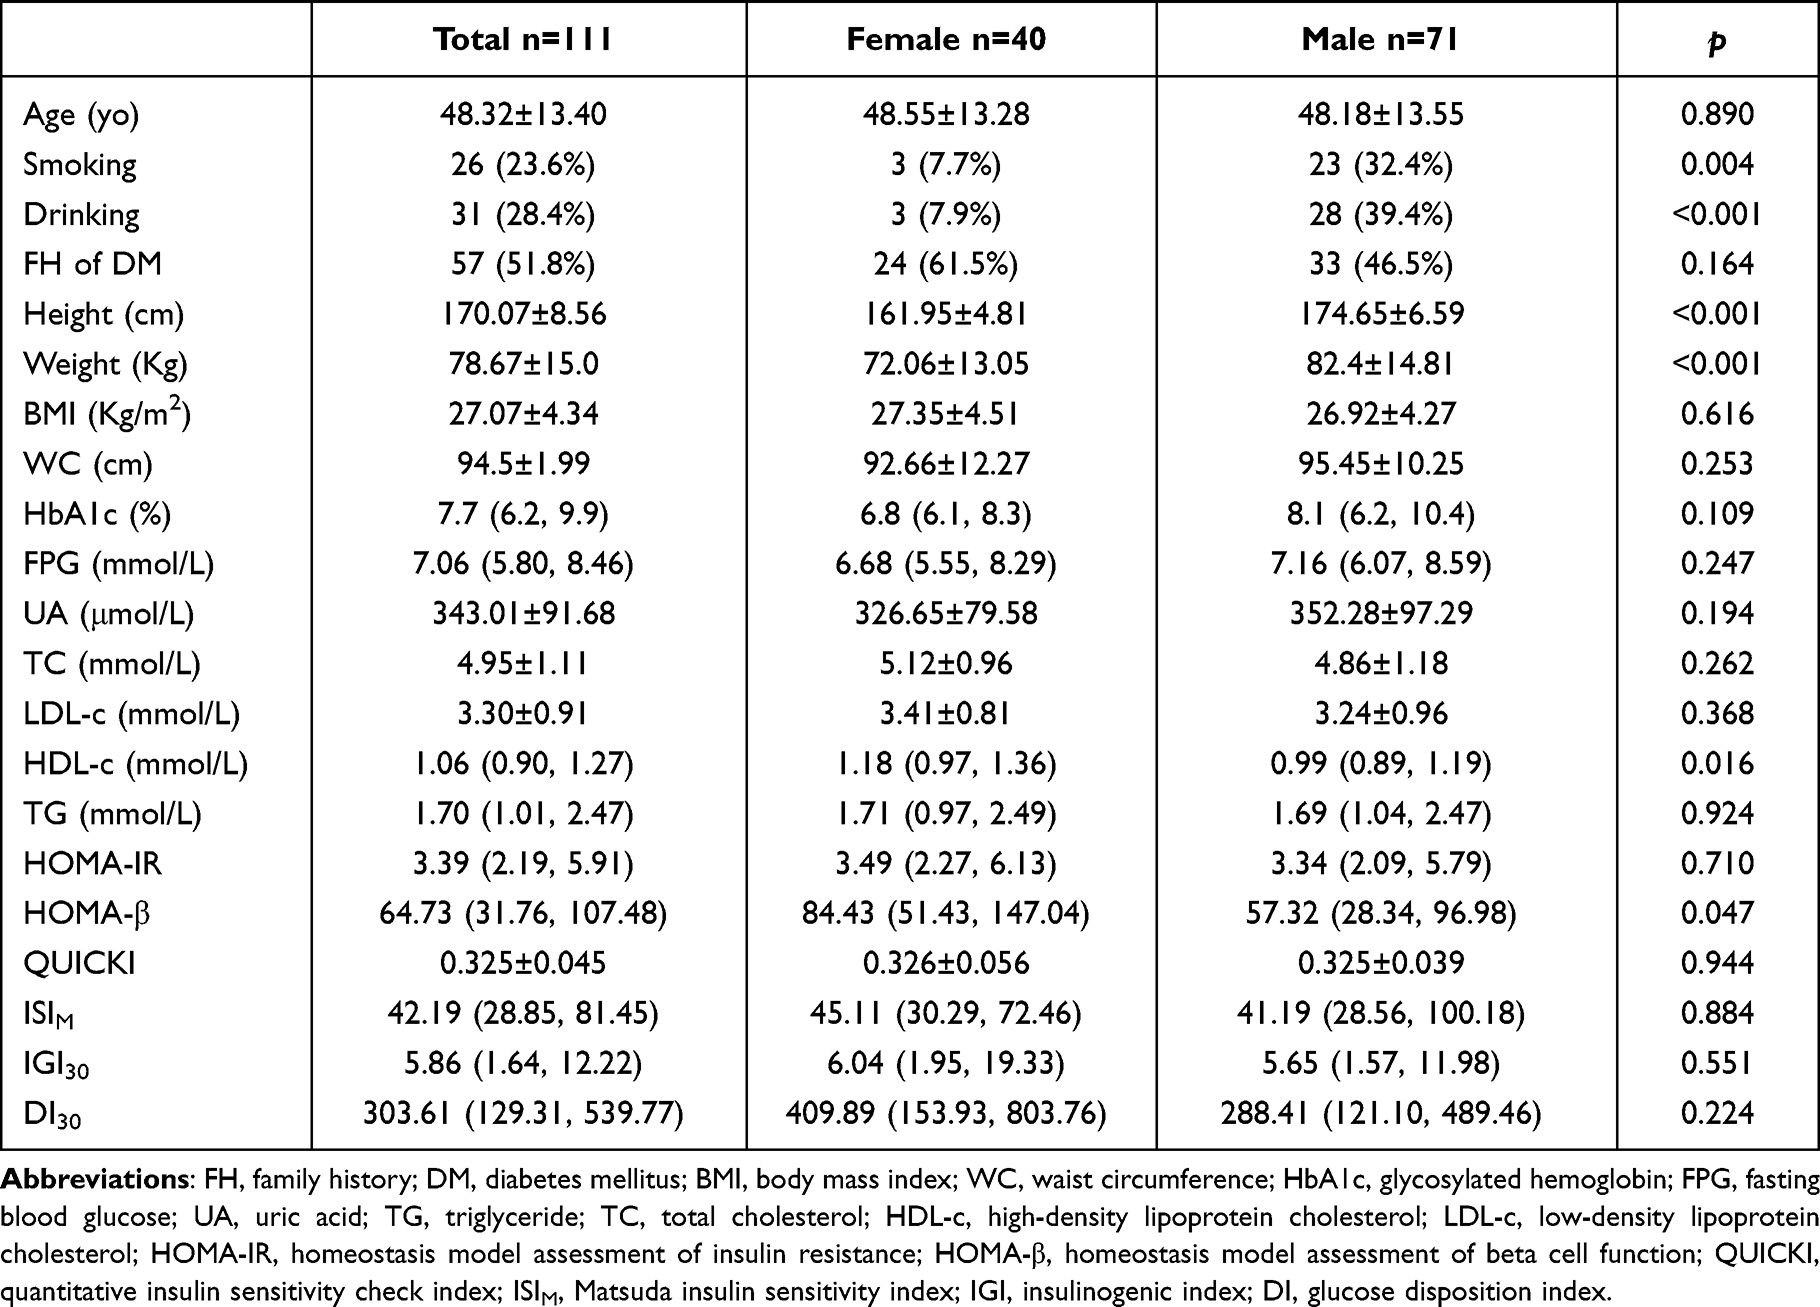 |
Table 1 General Clinical Characteristics in Patients with a Different Gender |
Body Composition of Patients with Different Gender
Though with similar BMI between females and males (27.35 ± 4.51 kg/m2 vs 26.92 ± 4.27 kg/m2, p = 0.616), TBF and total FM were significantly higher in female patients than in male patients, whereas the total LM and lean % were significantly lower in female. In terms of regional fat distribution, higher FM and fat % of gynoid and limbs were observed in females than in males. Though with higher android and trunk fat % in females, the FM of android and trunk was similar between female and male patients. Similarly, the LM and lean % of trunk and limbs were significantly lower in female patients than in male patients (Table 2).
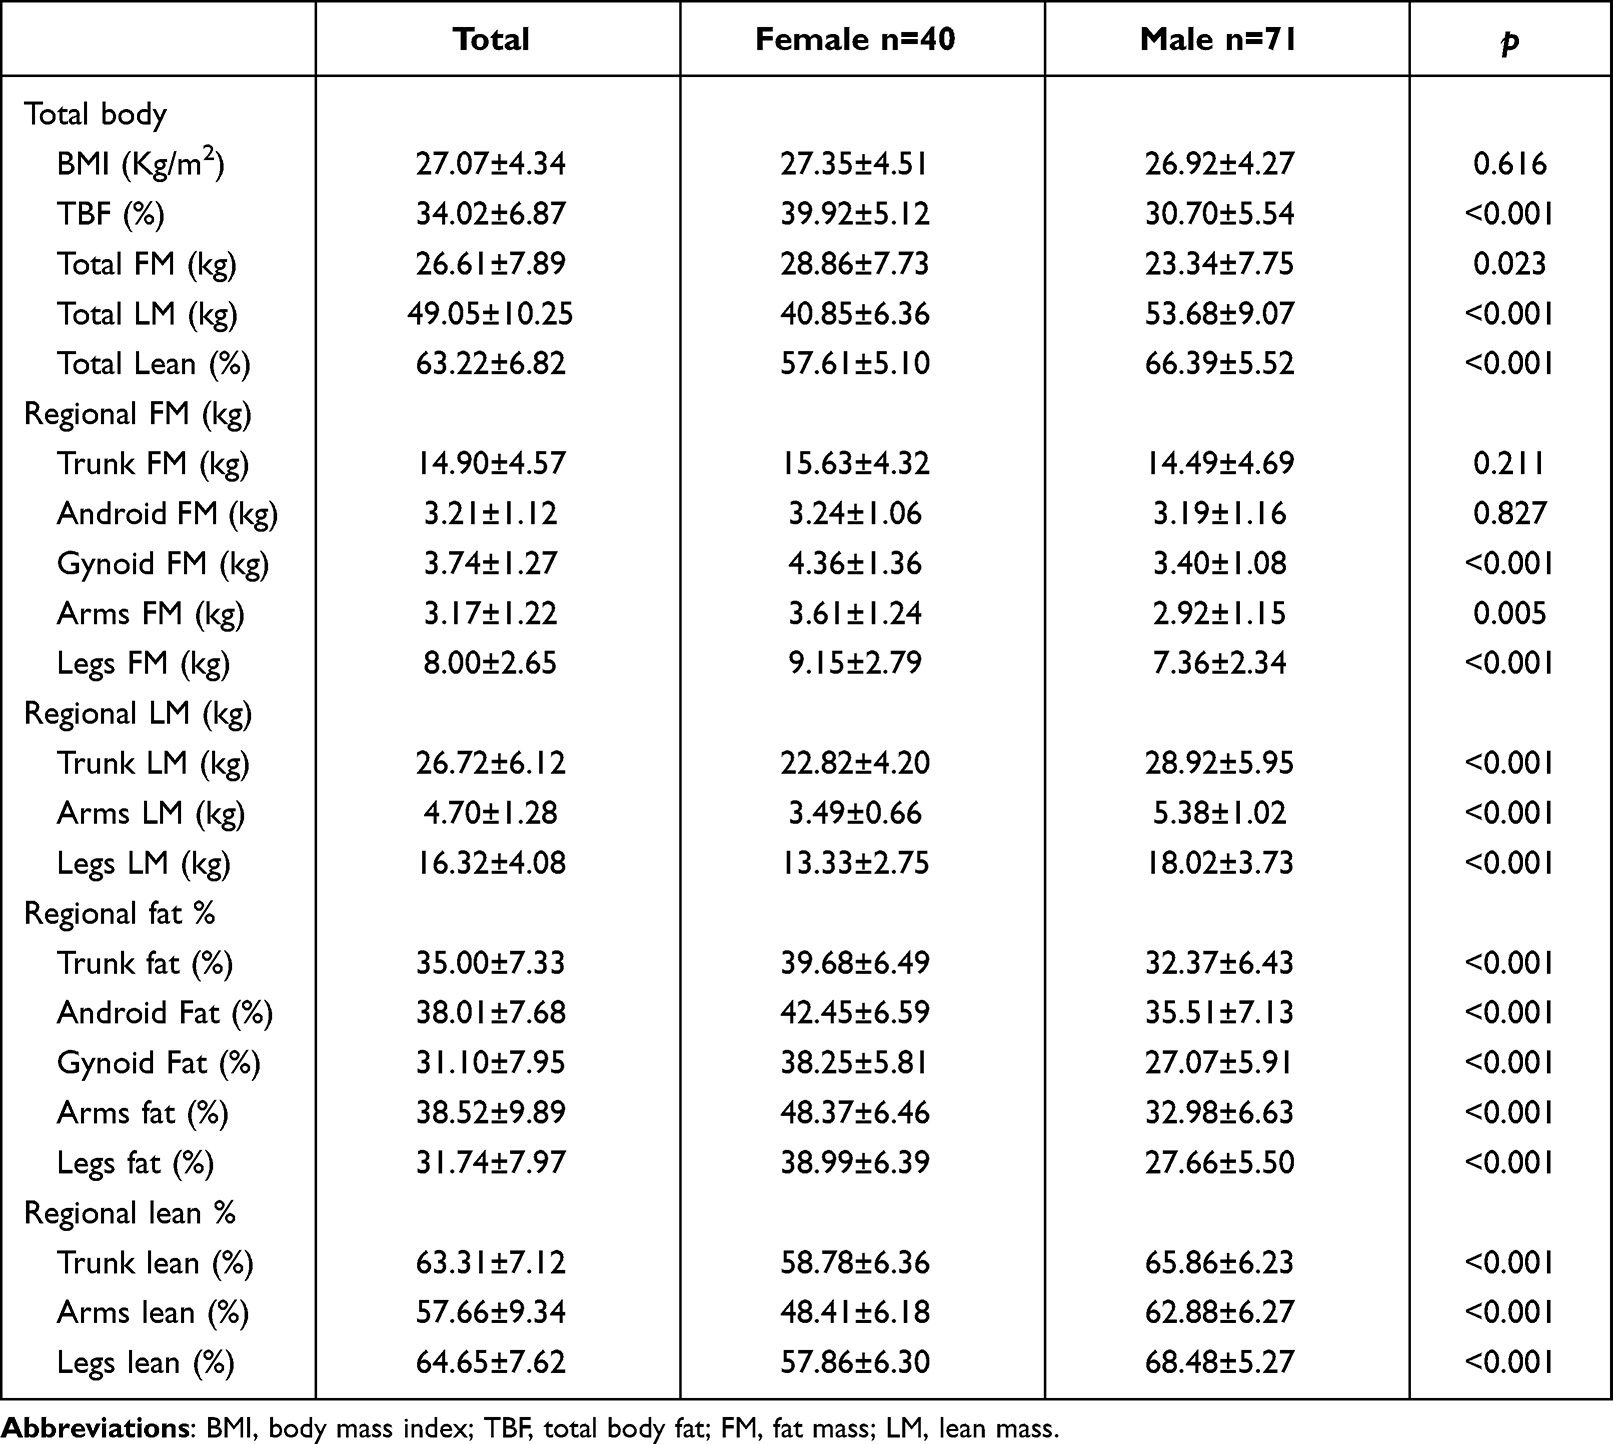 |
Table 2 Comparison of Body Composition in Female and Male |
Correlation of Body Composition with HOMA-IR
The partial correlation analysis showed that TBF and fat % of legs were negatively correlated with HOMA-IR. In contrast, total lean %, arms LM and lean % of legs were significantly positively correlated with HOMA-IR, even after adjusting for confounding factors, including age, gender, BMI, UA, and lipid profile. The correlation analysis in females showed that after correcting the above confounding factors, the fat % of legs is negatively related to HOMA-IR. In contrast, the lean % of legs positively correlates with HOMA-IR (Table 3 and Figure 1). In the multiple linear regression, legs LM was independently associated with HOMA-IR in females after adjusting for age, BMI, smoking, drinking, FPG, UA, and lipid profiles (Table 4 and Figure 1). In male patients, it can be observed that the android FM and FM of arms and legs are positively correlated with HOMA-IR (Table 3 and Figure 1). Moreover, in the multiple regression analysis, android FM was still independently positively associated with HOMA-IR in males (Table 4 and Figure 1).
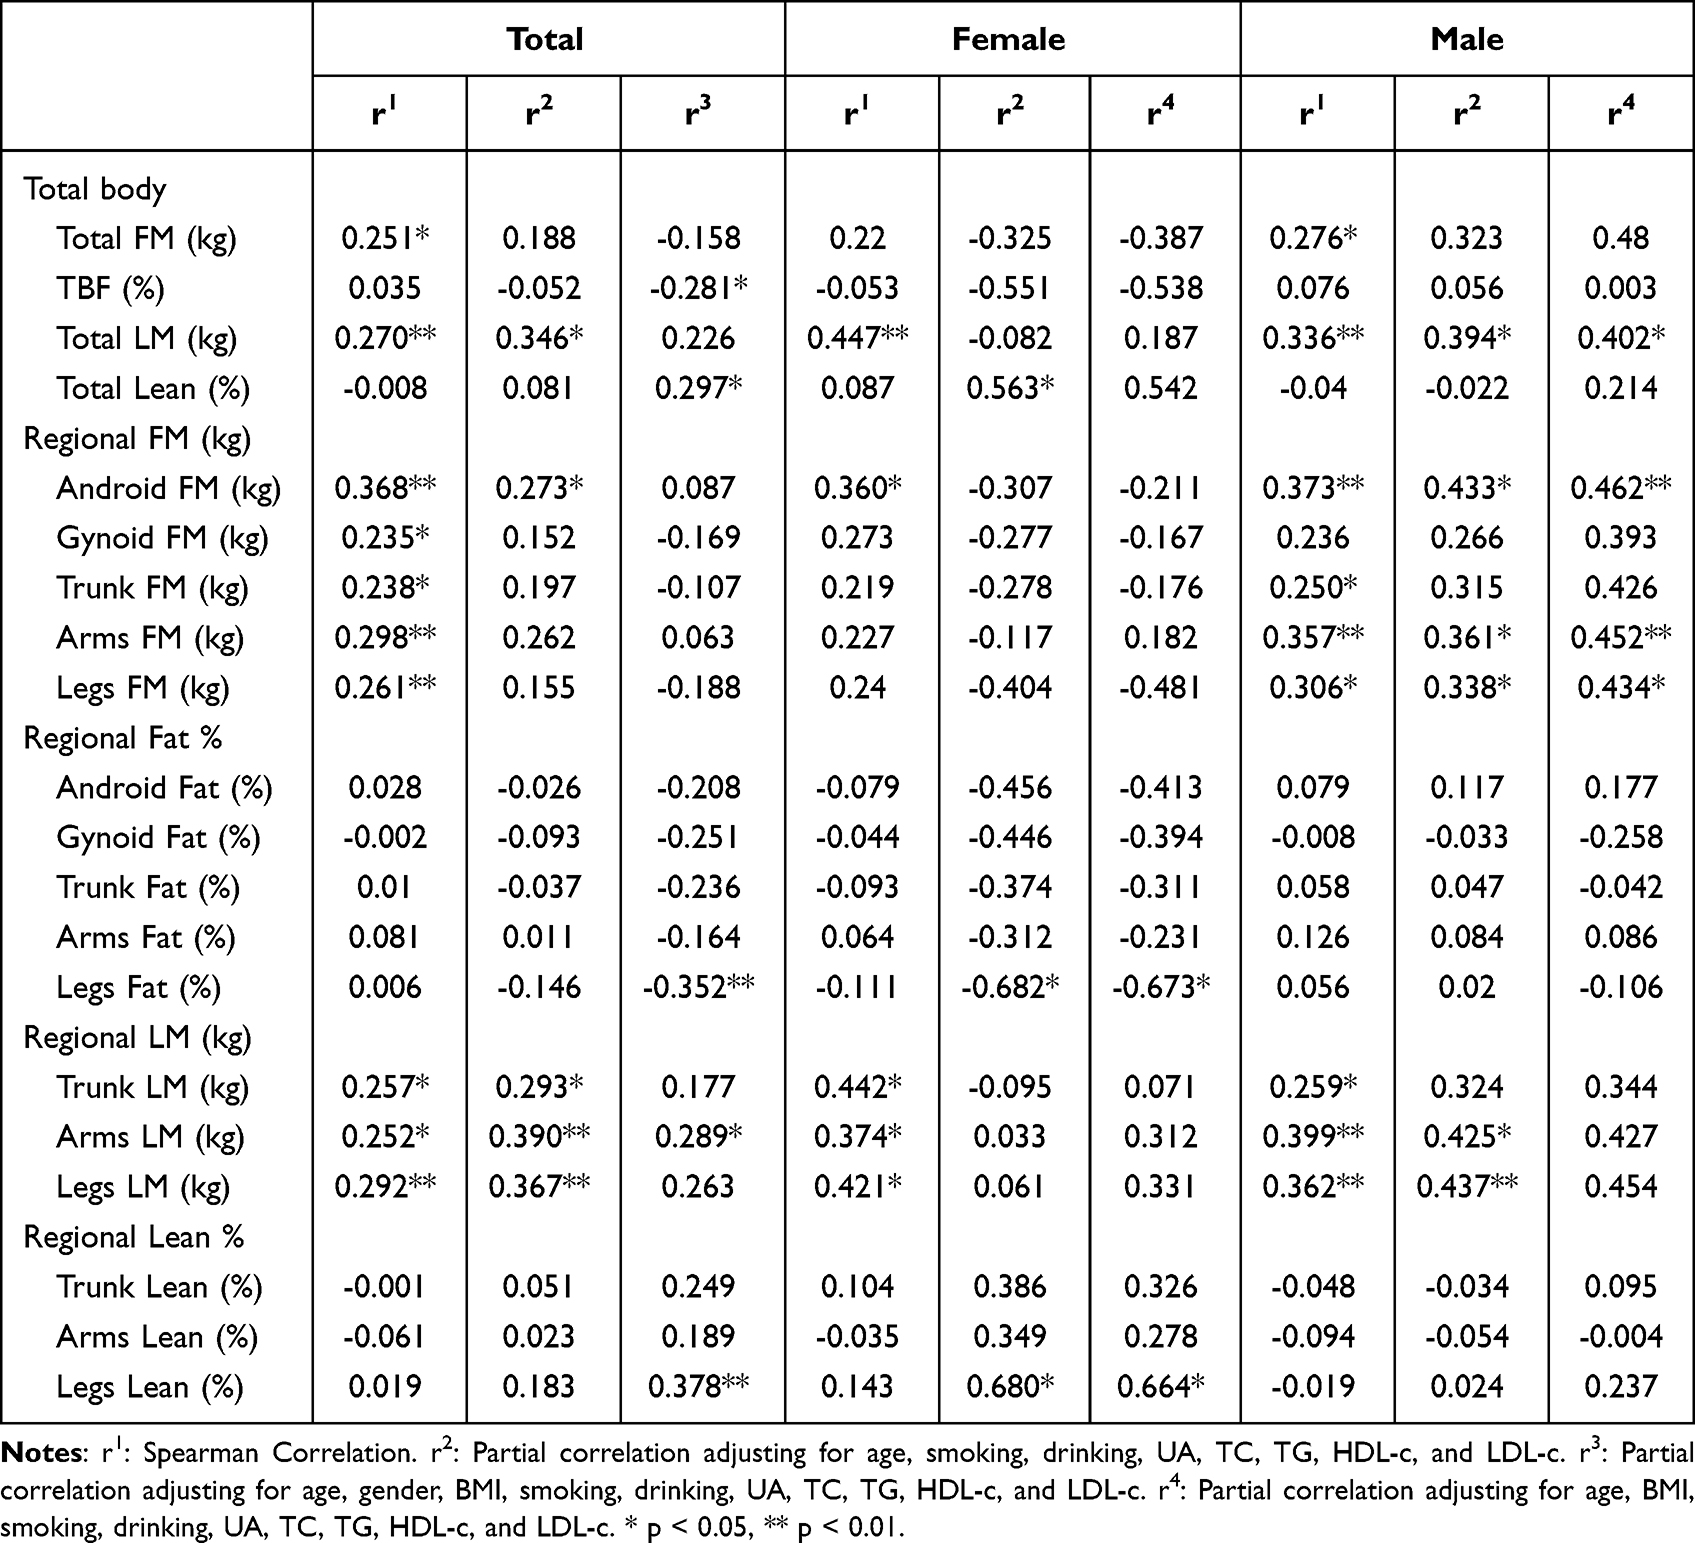 |
Table 3 Correlation of Body Composition and LnHOMAIR in Females and Males |
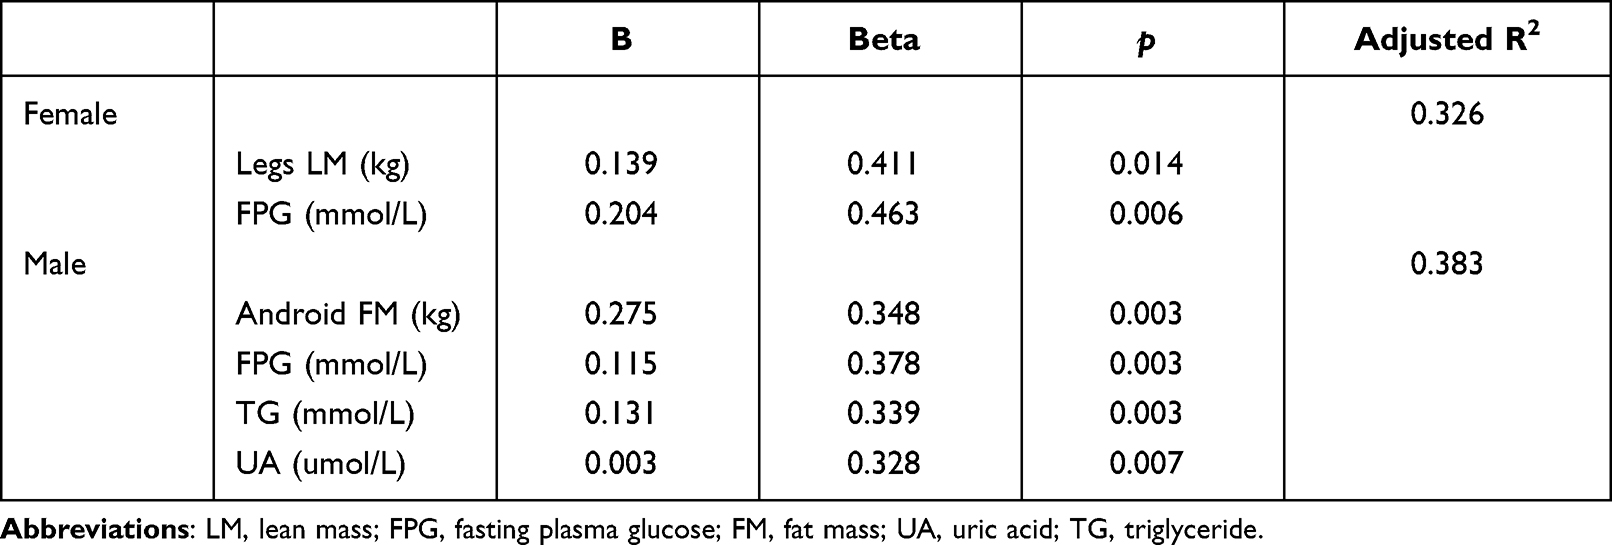 |
Table 4 Multiple Linear Regression of LnHOMAIR in Female and Male |
Correlation of Body Composition with DI30
The partial correlation analysis showed that FM and fat % of arms were positively correlated with DI30 after adjusting for confounding factors, including age, gender, BMI, UA, and lipid profile. Whereas LM of the trunk and lean % of arms were significantly negatively correlated with DI30. The correlation analysis in females showed that the fat % of legs is positively related to DI30, while the lean % of legs is negatively correlated with DI30; however, the correlation was not observed after adjusting for BMI. In male patients, it turned out that the LM of total and trunk are negatively correlated with DI30 (Table 5 and Figure 1). In the multiple linear regression analysis, trunk LM and legs LM were independently negatively and positively related to DI30 in males, respectively. However, the correlation of body composition with DI30 was non-significant in female patients (Table 6 and Figure 1).
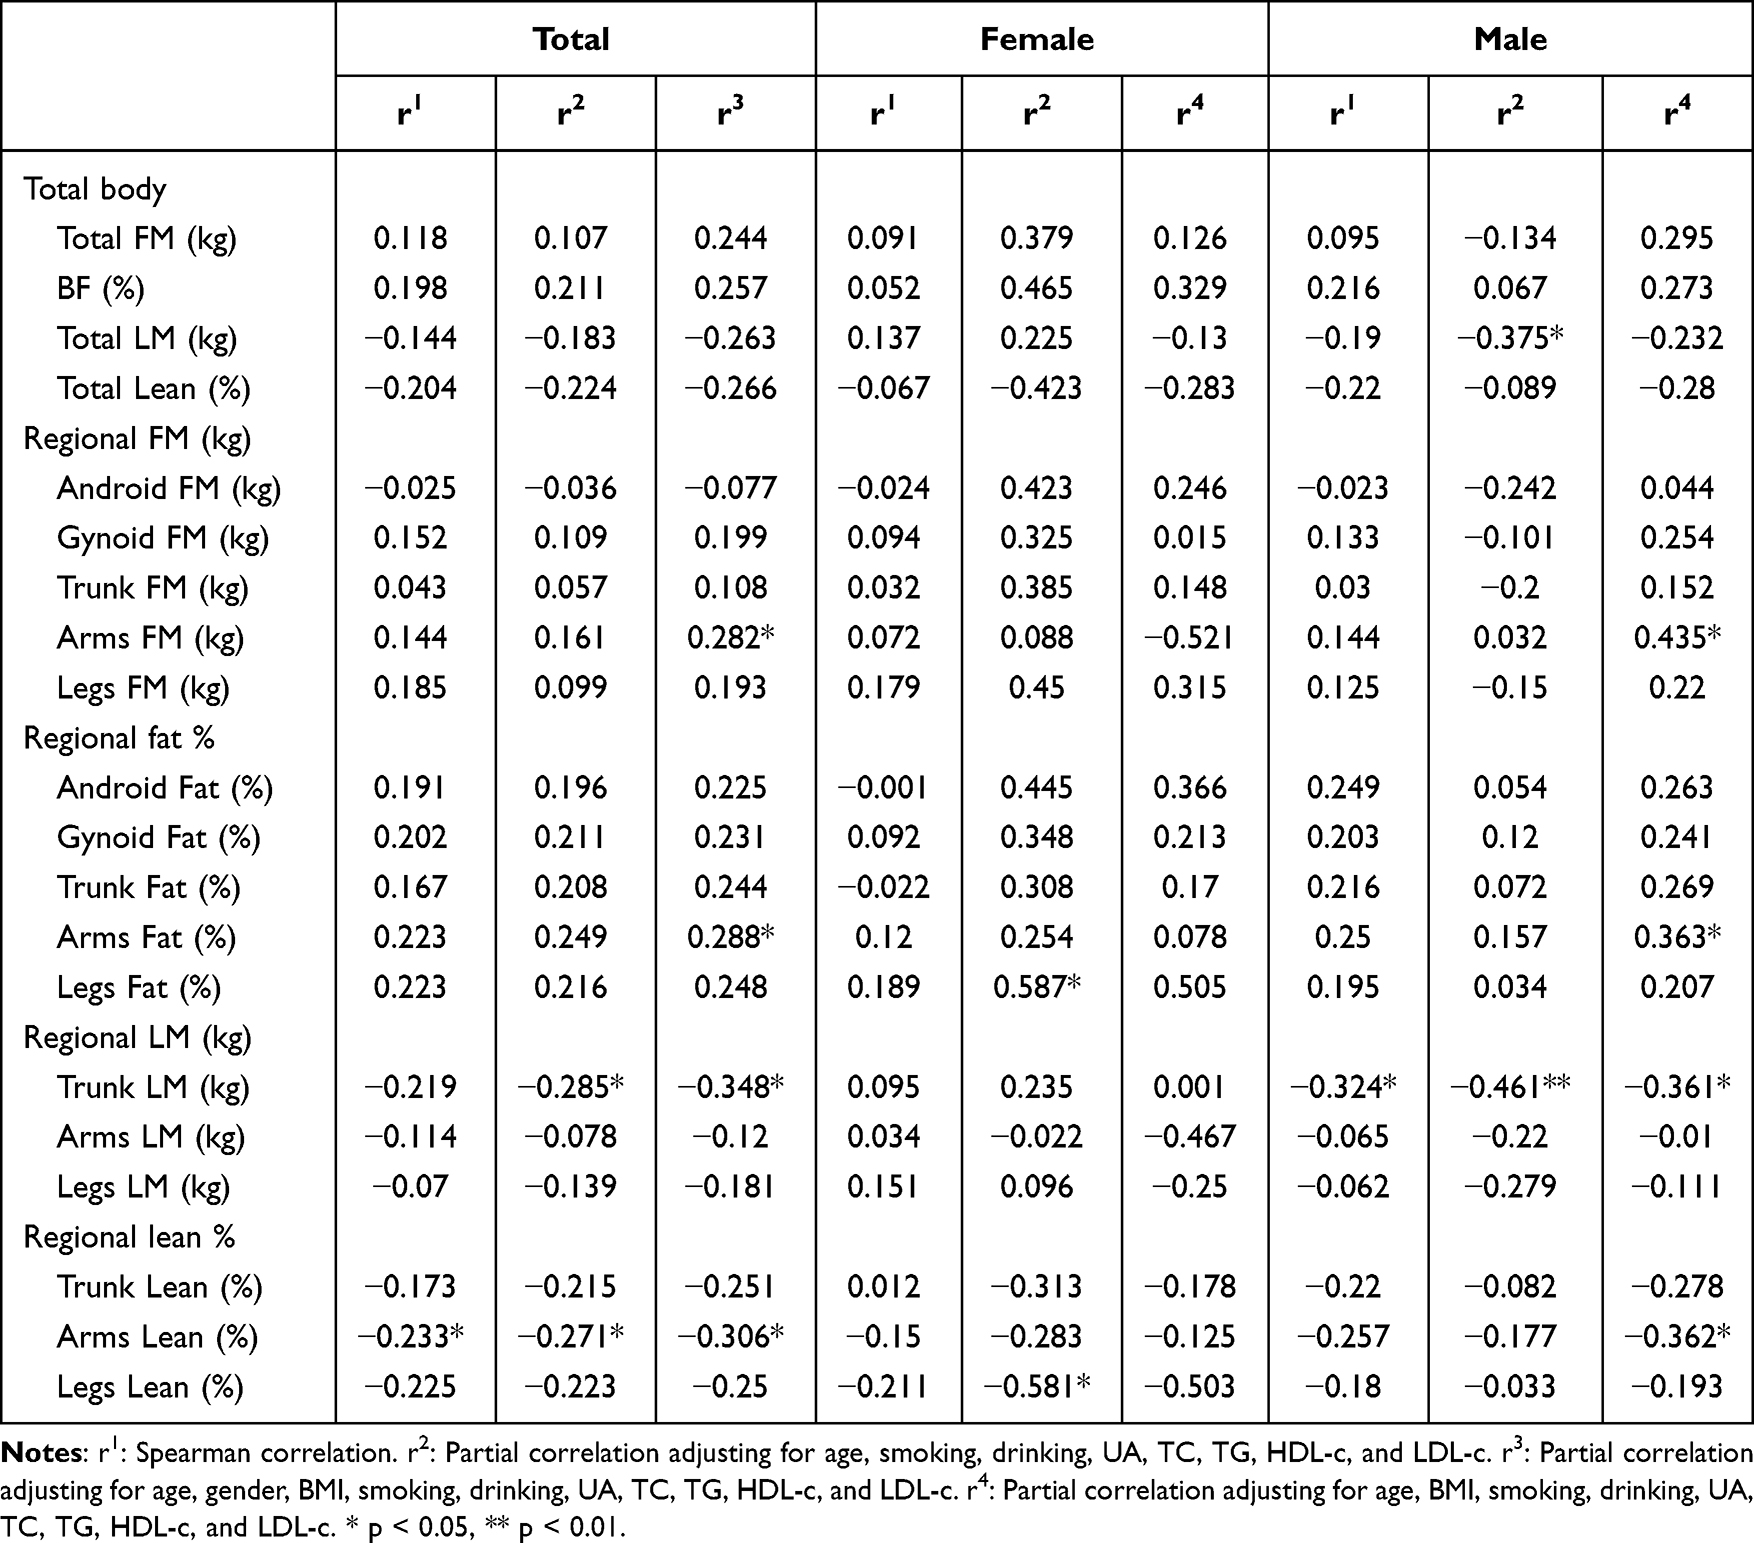 |
Table 5 Correlation of Body Composition and LnDI30 in Females and Males |
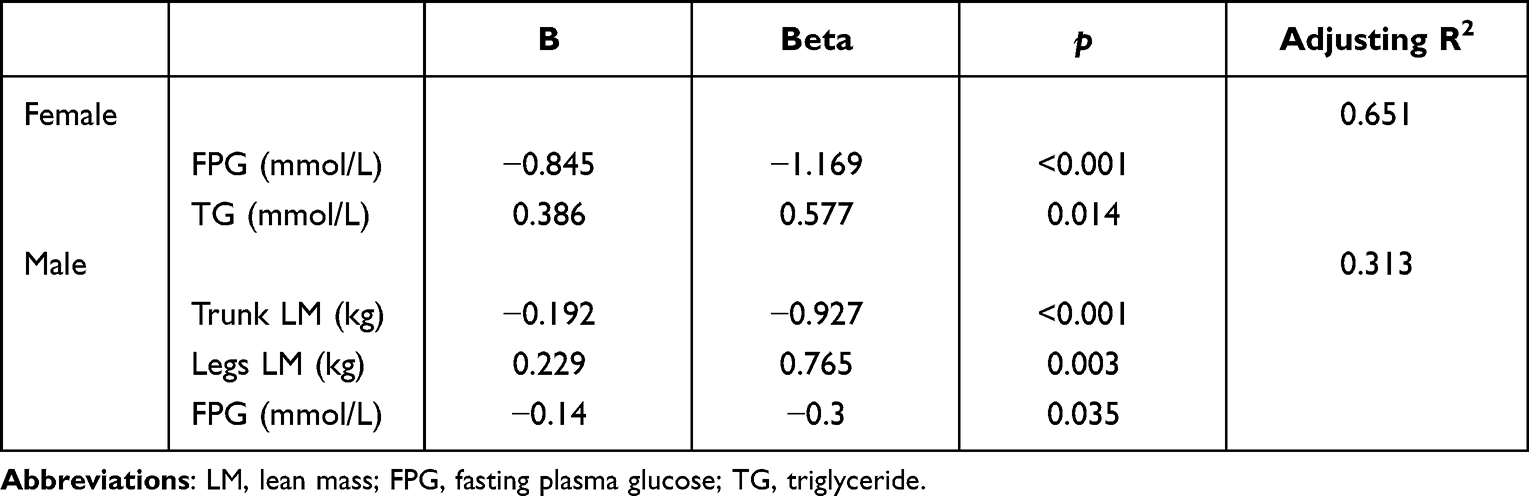 |
Table 6 Multiple Linear Regression of LnDI30 in Female and Male |
Discussion
The study showed that the vast majority of patients included were overweight. Though with similar BMI, female patients had higher total FM, TBF, and regional FM and lower total and regional LM than male patients. Correlation analysis showed that the fat % of legs was negatively correlated with HOMA-IR. In contrast, the lean % of legs was positively correlated with HOMA-IR in the overall population and female patients. However, this correlation was not observed in men; instead, android FM was positively associated with HOMA-IR in male patients. Regression analysis showed that after correcting for multiple confounders, legs LM was independently and positively correlated with HOMA-IR in female patients. In males, abdominal FM was independently and positively correlated with HOMA-IR. Correlation analysis of DI30 showed that legs fat % was positively correlated with DI30 while legs lean % was negatively correlated with DI30 in female patients. However, regression analysis corrected for multiple confounders did not observe an independent correlation between body composition and DI30. In males, correlation and regression analyses supported an independent negative correlation between trunk LM and DI30. The results suggest that body composition differs significantly between male and female patients with newly diagnosed T2DM / pre-DM, even with similar BMI. Besides, body composition affecting IR and islet beta cell function is not identical in male and female patients.
This study indicated that female patients with DM or pre-DM had higher whole-body FM, gynoid, and limb FM than males, while no significant gender differences were found in the trunk and abdominal FM. It is consistent with previous studies showing that males accumulate more trunk and abdominal fat, while females have more gluteofemoral fat accumulation.22,23 On the basis that females had significantly higher whole-body FM than males in this study, thus no significant gender differences were observed in the trunk and abdomen, which are the main areas of fat distribution in males. However, postmenopausal women tend to change body fat distribution with increased abdominal fat accumulation,24 similar to males. This suggested that sex hormones play an essential role in contributing to these differences in body compositions of different gender.8,25
In addition to focusing on the significant differences in body composition between men and women, this study also found that body composition affecting IR and islet beta cell function differed significantly between genders. Previous studies on body composition have concluded that abdominal fat, especially visceral fat, increases the risk of IR, T2DM, and cardiometabolic disease.9,11 However, in the present study, we observed that abdominal fat was independently and positively associated with HOMA-IR only in male patients. In female patients, on the other hand, abdominal fat was not observed to be independently associated with IR after correcting for other confounding factors. In contrast, the body components independently correlated with IR in women were legs fat % and legs lean %, which were negatively and positively associated with HOMA-IR, respectively. This also provides evidence from another perspective to support the protective effect of legs fat on IR, based on the fact that the fat % of legs here represents the ratio of FM to the total mass of legs, as reported in previous studies.26,27 Previous studies have reported that there is more abdominal fat in men than in women and more legs fat in women than in men and that abdominal and visceral adiposity is a detrimental factor, while gluteofemoral adiposity is a protective factor in cardiometabolic disease and IR. However, no studies have suggested that the correlation between abdominal fat and IR exists only in men and that the correlation between legs fat and IR exists only in women. The results of this study showed that men and women differed significantly not only in fat distribution but also in factors independently associated with IR. Possible mechanisms accounting for abdominal and visceral adiposity being a detrimental factor while gluteofemoral adiposity being a protective factor in cardiometabolic disease may involve differences in the uptake and utilization of triglycerides and fatty acids by adipose tissue at different locations, as well as differences in adipocytokine secretion by adipose tissue.28,29 As to why abdominal fat is only associated with IR in men and limb fat is only associated with IR in women, future studies are needed to explore the potential mechanisms further.
Previous studies on body composition have mainly focused on the effects on IR, while few studies have addressed the impact on islet beta cell function. A previous study showed that appendicular skeletal muscle mass index was positively associated with islet beta cell function, assessed by HOMA-β in both male and female non-diabetic Japanese populations.15 In this study, we observed that legs LM was positively correlated with DI30 in male patients. However, this correlation was not observed in female patients. Our finding was partly consistent with the previous study. However, the results were inconsistent with another study, which indicated that appendicular skeletal muscle mass was negatively correlated with endogenous insulin secretion in patients with T2DM.30 One possible explanation is that most patients in that study were already treated with insulin or oral hypoglycemic agents, and only a few (9.4%) were not yet treated. Whereas, in this study, all of the patients were newly diagnosed with diabetes or pre-DM and were untreated before the DEXA scan, thus minimizing the effect of glucose-lowering medications on body composition. Furthermore, correlation and regression analyses in male patients supported that trunk LM was independently and negatively correlated with DI30, indicating an unfavorable factor for islet beta cell function. Previous studies showed that trunk muscle indices were associated with visceral adiposity, glucose tolerance, and metabolic syndrome in the non-diabetic population.31,32 However, the finding that trunk LM was correlated with DI30 in male diabetic patients was not reported before. Further investigation is needed to explore the impact of body composition on islet beta cell function in patients with T2DM.
Limitations and disadvantages: this study was cross-sectional and could only analyze the correlation between body composition and IR and islet beta cell function but failed to assess whether interventions changing body composition affected IR and islet beta cell function. In addition, the sample size of this study was relatively small. Thus, future studies with larger sample sizes are needed to validate the results of this study. And the causality of the effect on IR and islet function can be assessed by interventions such as diet and exercise to make changes in body composition. This will lay the foundation for an in-depth investigation of the pathological mechanisms underlying the decline in insulin sensitivity and islet beta cell function, which will provide the basis for developing targeted and individualized interventions to delay the onset and progression of T2DM in the future.
In conclusion, the present study showed gender differences in the effects of body composition on IR and islet function. Legs fat appears to be a protective factor for IR in women, whereas legs LM is an unfavorable factor for IR in women. Abdominal FM and trunk LM were adverse factors for IR and islet function in males, respectively. More in-depth studies are needed to investigate the mechanisms underlying the sex differences in the effects of different body components on IR and islet function.
Data Sharing Statement
The datasets used and analyzed in the current study are available from the corresponding author upon reasonable request.
Acknowledgment
Thank all the authors and patients who participated in the study.
Funding
This work was supported by Project of Science and Technology Research and Development of China Railway Corporation (No. J2021Z608).
Disclosure
All the authors declare no conflicts of interest in this work.
References
1. Sun H, Saeedi P, Karuranga S, et al. IDF diabetes atlas: global, regional and country-level diabetes prevalence estimates for 2021 and projections for 2045. Diabetes Res Clin Pract. 2022;183:109119. doi:10.1016/j.diabres.2021.109119.
2. Centers for Disease Control and Prevention (CDC). Prevalence of overweight and obesity among adults with diagnosed diabetes--United States, 1988–1994 and 1999–2002. MMWR Morb Mortal Wkly Rep. 2004;53(45):1066–1068.
3. Bogardus C, Tataranni PA. Reduced early insulin secretion in the etiology of type 2 diabetes mellitus in Pima Indians. Diabetes. 2002;51(Suppl 1):S262–264. doi:10.2337/diabetes.51.2007.s262.
4. Abdul-Ghani MA, Tripathy D, DeFronzo RA. Contributions of beta-cell dysfunction and insulin resistance to the pathogenesis of impaired glucose tolerance and impaired fasting glucose. Diabetes Care. 2006;29:1130–1139. doi:10.2337/diacare.2951130.
5. M-E P, Tchernof A, Després J-P, Phenotypes O. Diabetes, and cardiovascular diseases. Circ Res. 2020;126:1477–1500. doi:10.1161/CIRCRESAHA.120.316101.
6. Haslam DW, James WPT. Obesity. Lancet Lond Engl. 2005;366:1197–1209. doi:10.1016/S0140-6736(05)67483-1.
7. Stefan N. Causes, consequences, and treatment of metabolically unhealthy fat distribution. Lancet Diabetes Endocrinol. 2020;8:616–627. doi:10.1016/S2213-8587(20)30110-8.
8. Frank AP, de Souza Santos R, Palmer BF, Clegg DJ. Determinants of body fat distribution in humans may provide insight about obesity-related health risks. J Lipid Res. 2019;60:1710–1719. doi:10.1194/jlr.R086975.
9. Rothney MP, Catapano AL, Xia J, et al. Abdominal visceral fat measurement using dual-energy X-ray: association with cardiometabolic risk factors: abdominal visceral fat and cardiometabolic risk. Obesity. 2013;2013:1. doi:10.1002/oby.20223.
10. Ibrahim MM. Subcutaneous and visceral adipose tissue: structural and functional differences. Obes Rev off J Int Assoc Study Obes. 2010;11(1):11–18. doi:10.1111/j.1467-789X.2009.00623.x.
11. Wajchenberg BL. Subcutaneous and visceral adipose tissue: their relation to the metabolic syndrome. Endocr Rev. 2000;21(6):697–738. doi:10.1210/edrv.21.6.0415
12. Heo JE, Shim J-S, Lee H, Kim HC. Association between the thigh muscle and insulin resistance according to body mass index in middle-aged Korean adults. Diabetes Metab J. 2020;44(3):446–457. doi:10.4093/dmj.2019.0110.
13. Alemán-Mateo H, López Teros MT, Ramírez FA, Astiazarán-García H Association between insulin resistance and low relative appendicular skeletal muscle mass: evidence from a cohort study in community-dwelling older men and women participants. J Gerontol a Biol Sci Med Sci 2014;69:871–877. doi:10.1093/gerona/glt193. 7
14. Seko T, Akasaka H, Koyama M, et al. Lower limb muscle mass is associated with insulin resistance more than lower limb muscle strength in non-diabetic older adults. Geriatr Gerontol Int. 2019;19(12):1254–1259. doi:10.1111/ggi.13805.
15. Sakai S, Tanimoto K, Imbe A, et al. Decreased β-cell function is associated with reduced skeletal muscle mass in Japanese subjects without diabetes. PLoS One 2016;11:e0162603. doi:10.1371/journal.pone.0162603. 9
16. Forte R, Pesce C, de Vito G, Boreham CAG. The body fat-cognition relationship in healthy older individuals: does gynoid vs android distribution matter? J Nutr Health Aging. 2017;21(3):284–292. doi:10.1007/s12603-016-0783-1.
17. Matthews DR, Hosker JP, Rudenski AS, Naylor BA, Treacher DF, Turner RC. Homeostasis model assessment: insulin resistance and ?-cell function from fasting plasma glucose and insulin concentrations in man. Diabetologia. 1985;28(7):412–419. doi:10.1007/BF00280883.
18. Matsuda M, DeFronzo RA Insulin sensitivity indices obtained from oral glucose tolerance testing: comparison with the euglycemic insulin clamp. Diabetes Care 1999;22:1462–1470. doi:10.2337/diacare.22.9.1462. 9
19. Katz A, Nambi SS, Mather K, et al. Quantitative insulin sensitivity check index: a simple, accurate method for assessing insulin sensitivity in humans. J Clin Endocrinol Metab. 2000;85(7):2402–2410. doi:10.1210/jcem.85.7.6661
20. Haffner SM, Miettinen H, Gaskill SP, Stern MP. Decreased insulin secretion and increased insulin resistance are independently related to the 7-year risk of NIDDM in Mexican-Americans. Diabetes. 1995;44(12):1386–1391. doi:10.2337/diab.44.12.1386.
21. Abdul-Ghani MA, Williams K, DeFronzo RA, Stern M. What is the best predictor of future type 2 diabetes? Diabetes Care. 2007;30(6):1544–1548. doi:10.2337/dc06-1331.
22. Machann J, Thamer C, Schnoedt B, et al. Age and gender related effects on adipose tissue compartments of subjects with increased risk for type 2 diabetes: a whole body MRI / MRS study. Magn Reson Mater Phys Biol Med. 2005;18(3):128–137. doi:10.1007/s10334-005-0104-x.
23. Lemieux S, Prud’homme D, Bouchard C, Tremblay A, Després JP. Sex differences in the relation of visceral adipose tissue accumulation to total body fatness. Am J Clin Nutr. 1993;58(4):463–467. doi:10.1093/ajcn/58.4.463.
24. Puder JJ, Monaco SE, Sen Gupta S, Wang J, Ferin M, Warren MP. Estrogen and exercise may be related to body fat distribution and leptin in young women. Fertil Steril. 2006;86(3):694–699. doi:10.1016/j.fertnstert.2006.02.085.
25. Bredella MA. Sex differences in body composition. Adv Exp Med Biol. 2017;1043:9–27. doi:10.1007/978-3-319-70178-3_2.
26. Appleton SL, Seaborn CJ, Visvanathan R, et al. Diabetes and cardiovascular disease outcomes in the metabolically healthy obese phenotype: a cohort study. Diabetes Care. 2013;36(8):2388–2394. doi:10.2337/dc12-1971.
27. Koster A, Stenholm S, Alley DE, et al. Body fat distribution and inflammation among obese older adults with and without metabolic syndrome. Obes Silver Spring Md. 2010;18(12):2354–2361. doi:10.1038/oby.2010.86.
28. Manolopoulos KN, Karpe F, Frayn KN. Gluteofemoral body fat as a determinant of metabolic health. Int J Obes. 2005;34:949–959. doi:10.1038/ijo.2009.286.
29. Karpe F, Pinnick KE. Biology of upper-body and lower-body adipose tissue—link to whole-body phenotypes. Nat Rev Endocrinol. 2015;11:90–100. doi:10.1038/nrendo.2014.185.
30. Shishikura K, Tanimoto K, Sakai S, Tanimoto Y, Terasaki J, Hanafusa T. Association between skeletal muscle mass and insulin secretion in patients with type 2 diabetes mellitus. Endocr J. 2014;61:281–287. doi:10.1507/endocrj.ej13-0375.
31. Maltais A, Alméras N, Lemieux I, et al. Trunk muscle quality assessed by computed tomography: association with adiposity indices and glucose tolerance in men. Metabolism. 2018;85:205–212. doi:10.1016/j.metabol.2018.04.003.
32. Tanaka M, Okada H, Hashimoto Y, et al. Relationship between metabolic syndrome and trunk muscle quality as well as quantity evaluated by computed tomography. Clin Nutr Edinb Scotl. 2020;39:1818–1825. doi:10.1016/j.clnu.2019.07.021.
 © 2023 The Author(s). This work is published and licensed by Dove Medical Press Limited. The
full terms of this license are available at https://www.dovepress.com/terms
and incorporate the Creative Commons Attribution
- Non Commercial (unported, 3.0) License.
By accessing the work you hereby accept the Terms. Non-commercial uses of the work are permitted
without any further permission from Dove Medical Press Limited, provided the work is properly
attributed. For permission for commercial use of this work, please see paragraphs 4.2 and 5 of our Terms.
© 2023 The Author(s). This work is published and licensed by Dove Medical Press Limited. The
full terms of this license are available at https://www.dovepress.com/terms
and incorporate the Creative Commons Attribution
- Non Commercial (unported, 3.0) License.
By accessing the work you hereby accept the Terms. Non-commercial uses of the work are permitted
without any further permission from Dove Medical Press Limited, provided the work is properly
attributed. For permission for commercial use of this work, please see paragraphs 4.2 and 5 of our Terms.
Recommended articles
Relationships Between Body Composition and Cognitive Impairment in Hospitalised Middle-Aged Type 2 Diabetic Patients
Li YS, Liu YL, Wang JJ, Haghbin N, Wang XH, Jiang WR, Qiu HN, Xia LF, Wu F, Lin CY, Li JB, Lin JN
Diabetes, Metabolic Syndrome and Obesity 2023, 16:2389-2400
Published Date: 9 August 2023
Gender Differences of Visceral Fat Area to Hip Circumference Ratio for Insulin Resistance
Cao H, Huang X, Luo B, Shi W, Li H, Shi R
Diabetes, Metabolic Syndrome and Obesity 2024, 17:3935-3942
Published Date: 22 October 2024
Association of the Triglyceride-Glucose Index with Body Composition and Laboratory Parameters in Chronic Kidney Disease Stages 3–5
Xu SS, Guan YM, Xuan HY, Fan XF, Lu P, Hao LH
Risk Management and Healthcare Policy 2025, 18:903-913
Published Date: 14 March 2025
Progressive Weight Loss-Induced Remission of Insulin Resistance/Hyperinsulinemia and Improvements in Cardiovascular Risk Factors
Leng M, Guo X, Wei C, Zhang Y, Li Z, Gao X, Hou D, Li C
Diabetes, Metabolic Syndrome and Obesity 2025, 18:1099-1110
Published Date: 15 April 2025
Sleep and Sugar: Deciphering the 2003–2023 Research Landscape on Sleep Disorders and Diabetes Mellitus via Bibliometric Study
Jiang Z, Tan J, Zhou Z, Zheng H, Li Y, Wang H, Yang Q, Tian H, Chen H, Xie J, Li Z, Chen Y
Journal of Multidisciplinary Healthcare 2025, 18:3859-3875
Published Date: 7 July 2025