")
Back to Journals » Diabetes, Metabolic Syndrome and Obesity » Volume 16
From Metabolically Healthy Obesity to Metabolically Unhealthy Obesity Populations: Decreased Bone Turnover Bioactivity
Received 9 September 2023
Accepted for publication 10 November 2023
Published 16 November 2023 Volume 2023:16 Pages 3657—3667
DOI https://doi.org/10.2147/DMSO.S431194
Checked for plagiarism Yes
Review by Single anonymous peer review
Peer reviewer comments 2
Editor who approved publication: Dr Konstantinos Tziomalos
Ning Zhang, Guang Wang
Department of Endocrinology, Beijing Chao-yang Hospital, Capital Medical University, Beijing, People’s Republic of China
Correspondence: Guang Wang, Email [email protected]
Purpose: A bone turnover marker reflects bone bioactivity. The effects of metabolically healthy compared with metabolically unhealthy obesity phenotypes on bone metabolism are not well understood. The aim of the study was to evaluate differences of bone transformation indexes in these two obesity phenotypes.
Patients and Methods: A total of 419 obese subjects were recruited, 64 with metabolically healthy obesity (MHO) and 351 with metabolically unhealthy obesity (MuHO). BTMs and clinical parameters were measured.
Results: Bone metabolism indexes, including tartrate resistant acid phosphatase (TRACP, p < 0.05), β carboxyl terminal peptide of collagen (β-CTX, p < 0.01), and bone alkaline phosphatase (BAP, p < 0.01), were higher in subjects with MHO than MuHO, but parathyroid hormone (PTH) was lower (p < 0.05). The between-group difference in serum calcium was not significant. Low bone turnover activity was associated with significant hyperglycemia, insulin resistance, and body fat index (p < 0.05). Multivariate logistic regression found that TRACP, β-CTX, and BAP were independently associated with the presence of MHO. Receiver operating characteristic curve analysis found that the maximum area under the curve value for the definition of MHO was (0.8221) and was obtained when sex, age, body mass index (BMI), TRACP, β-CTX and BAP were included simultaneously, resulting in a sensitivity of 81.25% and specificity: 72.3%.
Conclusion: The MHO group had significantly increased circulating TRACP and β-CTX compared with the MuHO group and BAP levels were within the physiological range. Obesity with the metabolically healthy phenotype had slightly increased bone turnover activity that may be an early compensatory response of skeletal metabolism to the increased BMI.
Keywords: bone turnover bioactivity, metabolically healthy obesity, obesity phenotype
Introduction
Obesity is a metabolic disease caused by increased deposition of adipose tissue and characterized by low-level inflammation. Metabolically healthy obesity (MHO) and metabolically unhealthy obesity (MuHO) are distinguished by the presence or absence of various abnormal metabolic indicators.1 MHO is characterized by less visceral fat, increased fat deposits in the extremities, and greater subcutaneous adipose tissue expandability than MuHO. The clinical characteristics of MHO include normal glycolipid metabolic parameters, normal blood pressure and insulin secretion, and less insulin resistance than MuHO.2,3
Previous studies on metabolic healthy obesity (MHO) mainly focused on the areas of glycolipid metabolism or the risk of cardiovascular diseases, and few studies focused on the association between obesity phenotype and bone metabolism indicators.
Obesity can lead to changes in bone density. The available study results are not consistent, but excess fat tissue in obese patients may negatively influence bone quality in adults.4–6 Although obese people have slightly increased bone mineral density (BMD), the decrease of BMD per unit of body weight leads to a greater than normal fracture risk.7 Decreased bone formation and bone resorption observed in obese people.8,9 Other studies have reported that subjects with class III obesity were prone to abnormal changes in bone metabolism.10
There are differences in bone metabolism among different obese people. Kim et al found that postmenopausal women with metabolic syndrome had reduced bone mineral density.11 It has also been reported that among male obese people, subjects with metabolic abnormalities such as diabetes mellitus showed a decrease bone transformation activity.12 Whether these metabolic differences are related to different obesity phenotypes is the question we want to explore. Since bone metabolism indexes are closely related to the risk and outcome of various bone diseases, our study may provide some clinical help for the understanding of bone metabolism in obese population. This study investigated differences in bone turnover markers (BTMs) related to bone bioactivity in patients with MHO and MuHO.
Materials and Methods
Study Design and Participants
We performed a cross-sectional analysis of 419 obese participants who were 18–55 years of age and registered at the endocrine obesity clinic of Beijing Chaoyang Hospital, Beijing, China. Data were collected from September 2019 to December 2021. The diagnostic criterion of obesity was a body mass index (BMI) ≥ 30 kg/m2. Participants with previously diagnosed diabetes, obesity secondary to endocrine diseases, current pregnancy, or lactation, acute or chronic infection; histories of chronic kidney or hepatic disease other than metabolically associated fatty liver disease, tumors, or parathyroid disease; or previously diagnosed diseases associated with abnormal calcium and phosphorus metabolism were excluded. The study was conducted in accordance with the ethical principles of the Declaration of Helsinki. The Ethics Committee of the Beijing Chaoyang Hospital approved the protocol and informed consent was obtained from all participants included in the study.
Definitions of MHO and MuHO and Basis for Grouping
The obesity phenotypes were previously described Ortega.13 The MHO criteria included a BMI ≥30 kg/m2)14,15 and excluded all of the followings: (1) fasting blood glucose ≥6.1 mmol/L, (2) postprandial blood glucose ≥7.8 mmol/L, (3) fasting serum triglycerides (TGs) ≥1.7 mmol/L, (4) serum high-density lipoprotein (HDL) <1.0 mmol/L for men and <1.3 mmol/L for women, and (5) elevated systolic blood pressure (SPB, ≥130 mmHg) and/or diastolic blood pressure (DBP, ≥85 mmHg), and not using drugs for treating dyslipidemia, diabetes, hypertension, or manifestations of cardiovascular disease.2 The MuHO criteria were a BMI ≥30 kg/m2 and one or more of the above four metabolic risk components. The study population was divided into MHO or MuHO groups and the MuHO group was further divided into those with one or two unhealthy metabolic phenotype criteria (mild-MuHO) and those with three or four (severe MuHO).1
Measurement of Clinical Parameters
Medical histories were obtained from the participants along with anthropometric measurements. Hematologic and biochemical testing was performed. Blood samples were obtained after a 12 hour overnight fast at 7–8am the next morning. All the bold samples were sent to the laboratory for centrifugation within 1 hour, and then sent for the measurement of insulin, glucose, fasting plasma glucose (FPG), fasting insulin (FINS), glycosylated hemoglobin (HbA1c), lipids including TGs, total cholesterol (TC), high-density lipoprotein cholesterol (HDL-C), and low-density lipoprotein cholesterol (LDL-C); liver and kidney function including alanine aminotransferase (ALT), aspartate aminotransferase (AST), and serum creatinine (SCr); and bone metabolism including calcium, 25 hydroxyvitamin D3 (25-VitD3), TRACP, β-CTX, procollagen amino-terminal lengthening peptide (PINP), BAP, and N-terminal osteocalcin (NMID). Biochemical indexes were determined by colorimetric enzyme assays using an autoanalyzer (Beckman, AU680, USA). Fasting glucose was determined by the glucose oxidase method, and insulin and C-peptide quantified by an electrochemiluminescence immunoassay (Roche Diagnostics GmbH, Roche, Germany). Glycated hemoglobin A1c (HbA1c) was quantified by high-performance liquid chromatography with a D10 set (Bio-RAD, Hercules, CA, USA). Bone metabolism indexes (TRACP, 25-VitD3, β-CTX, BAP, and NMID) were determined by electrochemiluminescence immunoassays (Roche cobas e601, Roche, Germany). Free fatty acid concentration was determined by enzyme colorimetry (nonesterified fatty acid). Parathyroid hormone levels were determined by enzyme-linked immunosorbent and chemiluminescence assays. Urine was collected after fasting for 8 hours electrochemiluminescence assay (Roche e501) and calculation of the microalbumin/creatinine ratio (UACR) was calculated by the ratio of urinary Estimated glomerular filtration rate (eGFR) was calculated using the Modification of Diet in Renal Disease equation as  16
16
Anthropometric Measurements and Calculations
Anthropometric measurements and blood pressure were performed by a qualified nursing team after 15 min of rest in a relaxed and sitting position. Blood pressure was measured twice with a desktop mercury sphygmomanometer at 2-minute intervals, and the mean values of SBP and DBP were recorded. Body weight and height were measured by standard weighing scale and stadiometer, respectively. Waist circumference (WC) and hip circumference (HC) were measured by trained specialists. BMI was calculated as weight (Kg)/height (m)2. Body adiposity index (BAI) was calculated as hip circumference (cm)/height (m)1.5 − 18. Waist-to-height ratio (WHtR) was calculated as waist (m)/Height (m). The Homeostatic Model Assessment for Insulin Resistance (HOMA-IR) was calculated as fasting glucose (mmol/L) × FINS (mIU/L)/22.5. HOMA assessment of beta-cell function (HOMA-β) was calculated as 20 × FINS (mIU/L)/(fasting glucose (mmol/L) − 3.5). The visceral adiposity index (VAI) is a sex-specific indicator of fat distribution that is calculated using an empirical mathematical model that includes BMI, waist circumference, TGs, and HDL described by Amato.17,18
Statistical Analysis
We performed the statistical analysis with SPSS v26.0 (IBM Corp., Armonk, NY, USA). Categorical data including sex; history of smoking, diabetes, and hypertension; and oral medicines were reported as numbers and percentages and differences were compared with chi-square tests. Numeric clinical, biochemical, and anthropometric variables, and bone metabolism indicators that were normally distributed were reported as means ± standard deviation (SD) or medians and 25–75% interquartile range if the values had severely skewed distributions. Between-group differences were compared by Student’s t-tests for normally distributed variables and Wilcoxon tests for non-normally distributed variables.
Multiple linear regressions were performed to adjust for specific confounding factors between two groups. We performed univariate logistic regression to identify factors that might be independently associated with the occurrence of MHO. Factors that were associated with MHO (p < 0.01 in the univariate analysis) were included in multivariate logistic regression to assess the independent effect of bone markers in different models on the presence of MHO. The odds ratio (ORs) and 95% confidence interval (CI) were calculated for each model. Receiver operating characteristic (ROC) curve analysis was used to evaluate the ability of bone metabolism markers to distinguish MHO and MuHO. Two-sided p-values <0.05 were considered statistically significant.
Results
Comparison of Baseline Clinical Characteristics of MHO and MuHO
A total of 419 obese participants were recruited, 64 with MHO and 355 with MuHO. The clinical characteristics of each group are summarized in Table 1. The mean age of the MHO group was 32.91 ± 2.11 years and that of the MuHO group was 42.34 ± 9.73 years (p > 0.05), where 75.56% of the MHO group and 73.86% of the MuHO group were women (p > 0.05). Between-group differences of the WHtR, BAI, VAI, ACR, HbA1c, FPG, fasting C-peptide, FINS, TGs, LDL-C, HDL-C, FFA, and HOMA-IR were significant (all p < 0.05) (Table 1). The WHtR, BAI, VAI, ACR, FPG, fasting C-peptide, FINS, TGs, LDL-C, FFA, and HOMA-IR were lower in the MHO group than in the MuHO and HDL-C level was higher (all p < 0.01) (Table 1).
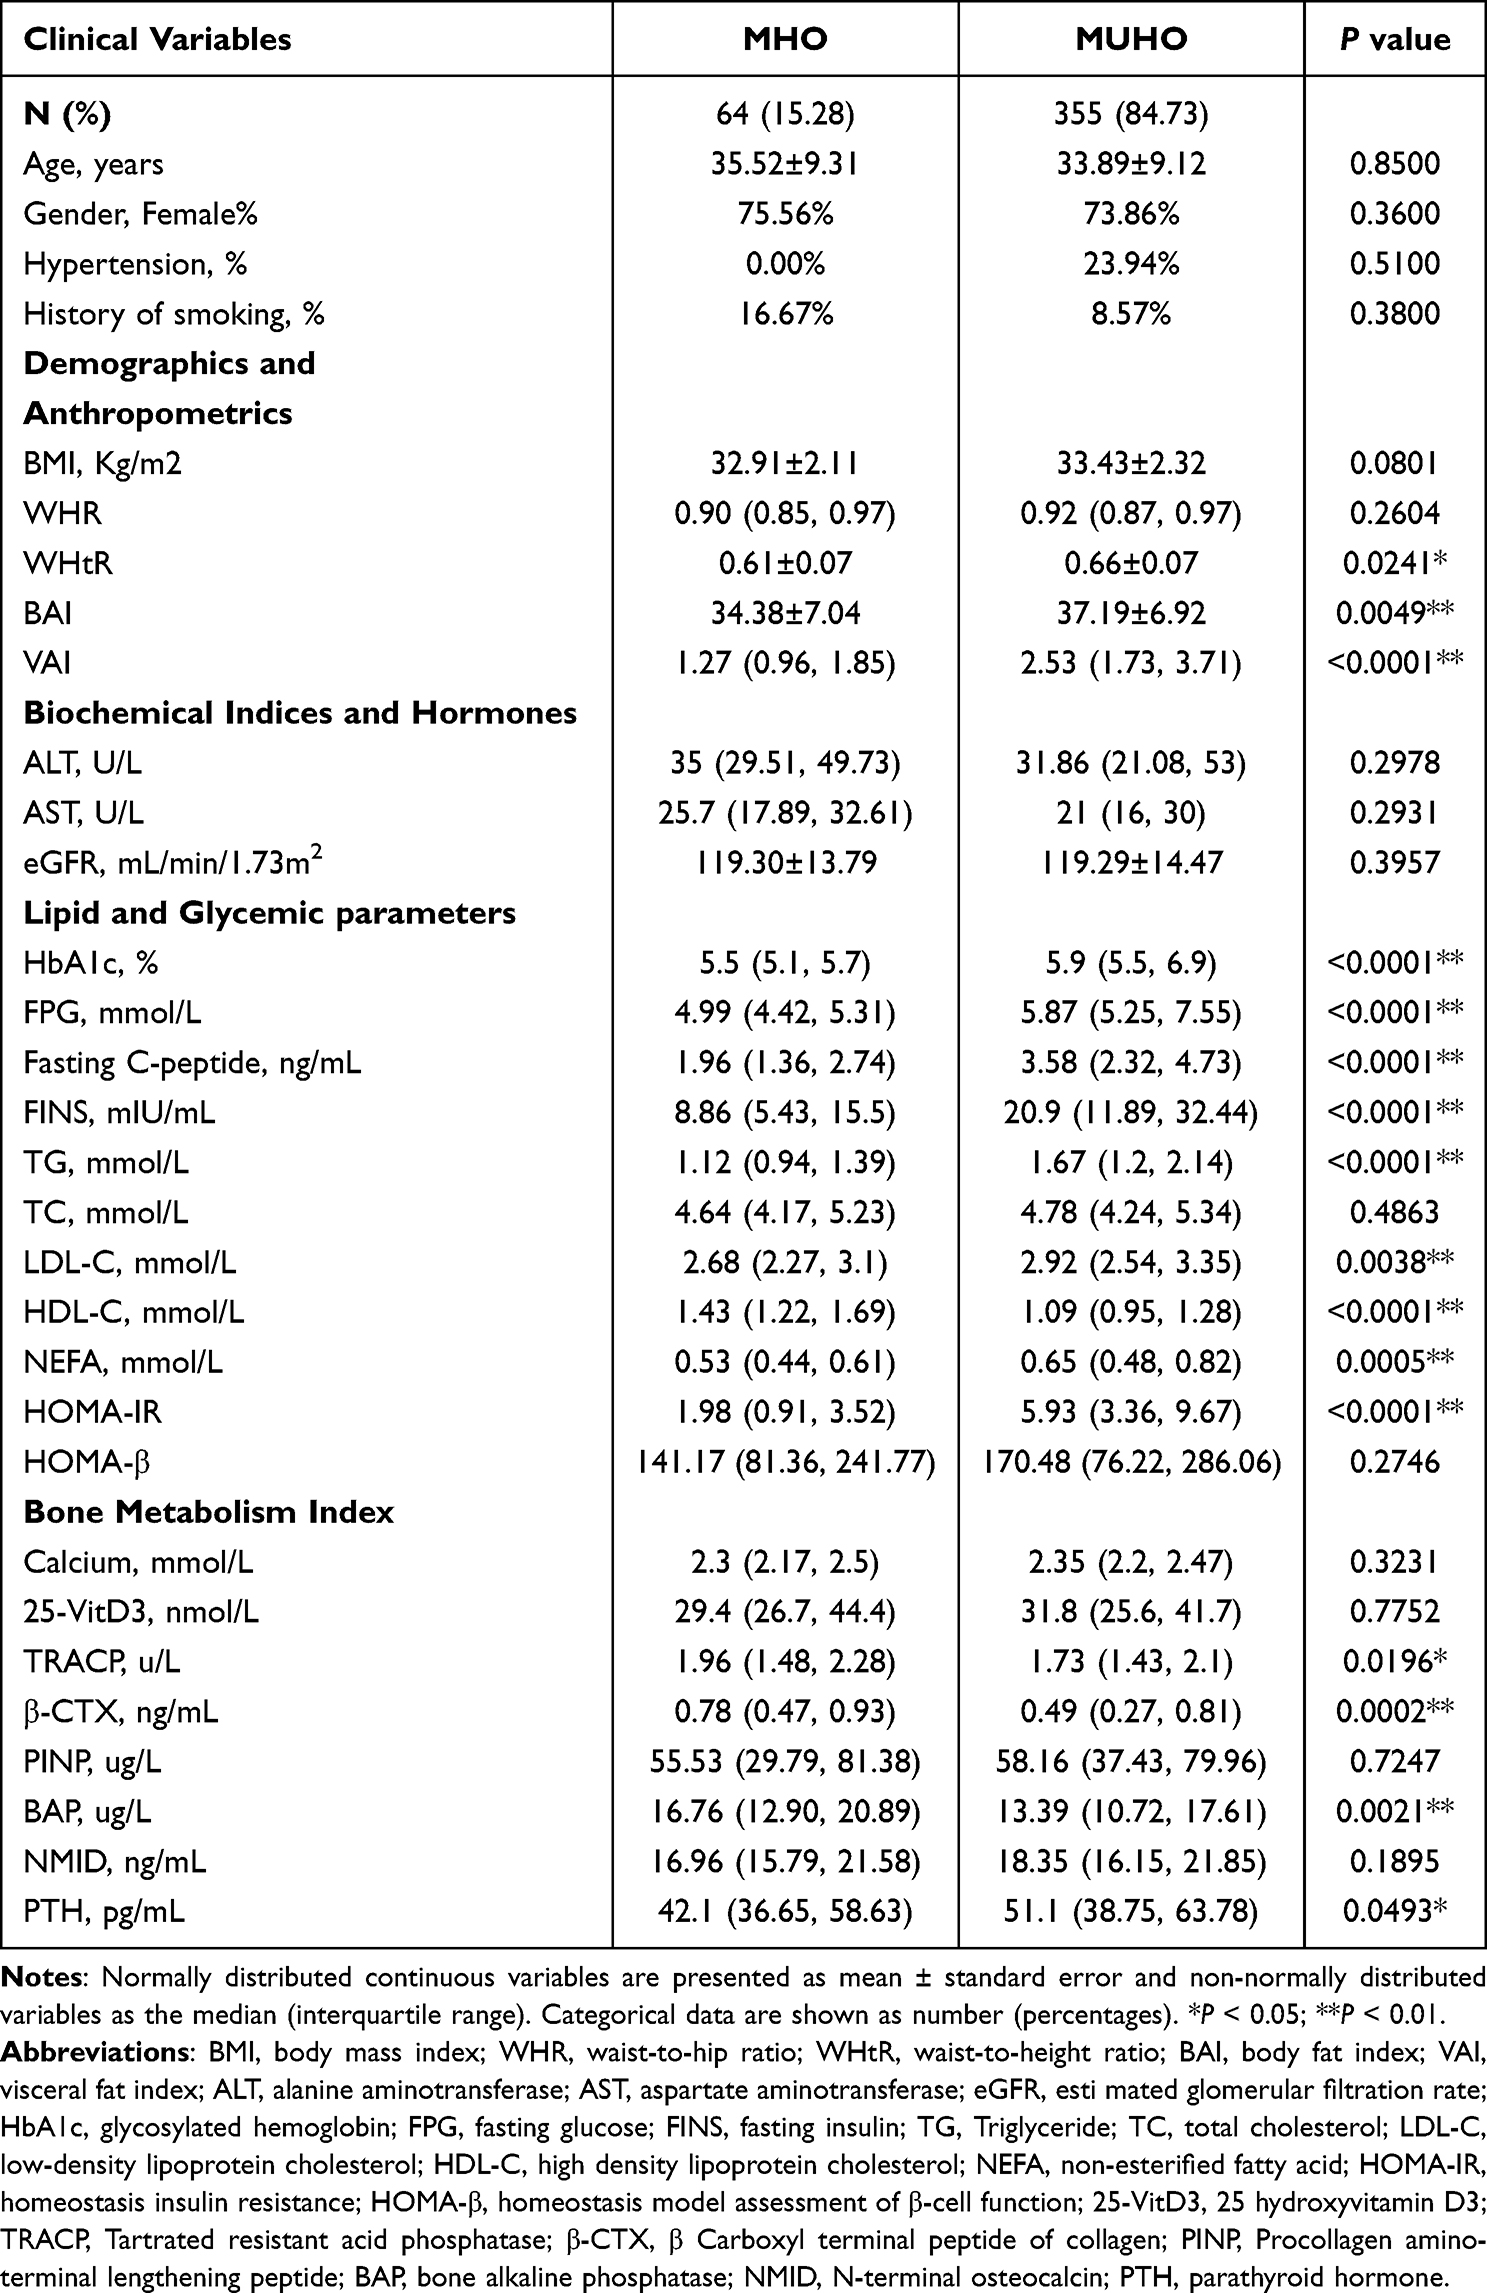 |
Table 1 Comparisons of Basic Characteristics Between MHO and MUHO Groups |
Comparison of the BTMs in the MHO and MuHO Groups
Of the values included in bone metabolism index, TRACP (p < 0.05), β-CTX (p < 0.01), and BAP (p < 0.01) were higher in MHO group than in the MuHO group, but PTH was lower (p < 0.05). The between-group difference in serum calcium levels was not significant. Considering that sex, age, blood calcium, and other biochemical and clinical variables might affect bone metabolism, we used linear regression analysis of three models to correct for various confounding factors.
We found that TRACP, β-CTX, and BAP were still associated with the presence of MHO phenotypes in the three models after adjusting for those factors. Comparison of the bone metabolism index of the two subgroups of MuHO subjects failed to find a significant difference between the two (p > 0.05, Table 2). However, differences between TRACP, β-CTX, and BAP were significant after adjusting for some clinical indicators that may affect bone metabolism (Table 3).
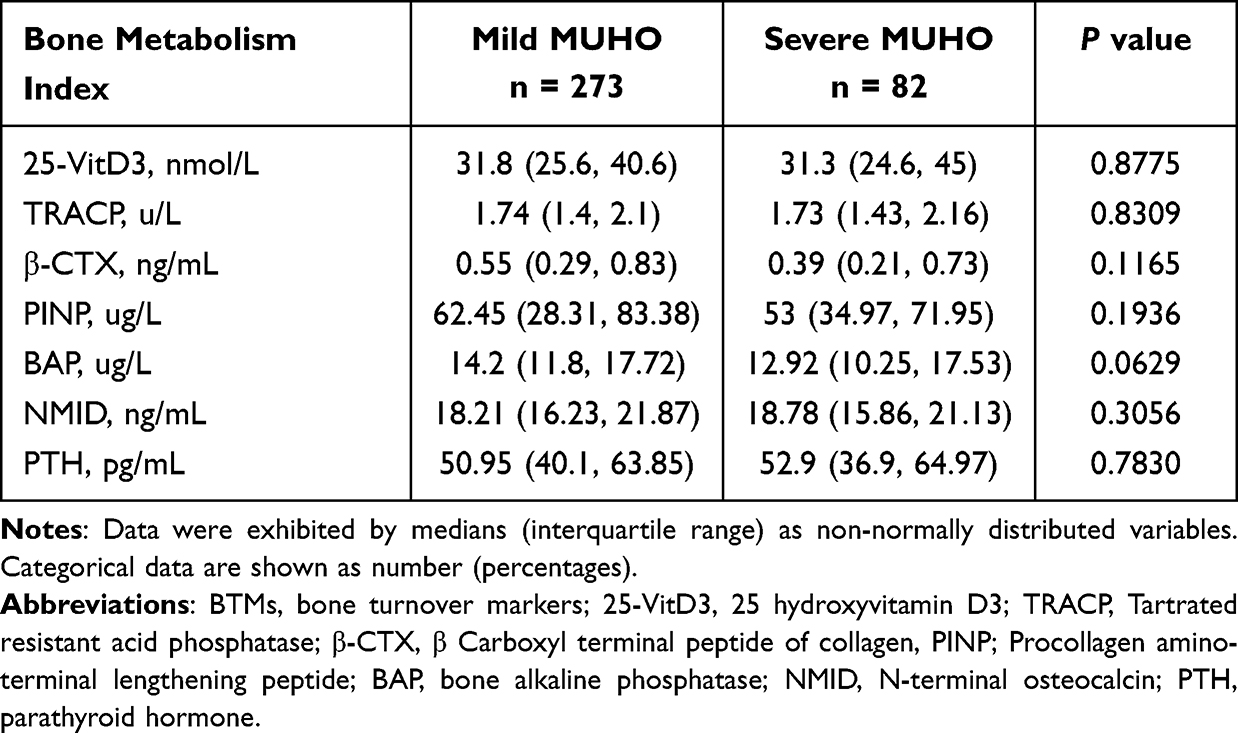 |
Table 2 Comparisons of BTMs Levels Between Mild- and Severe-MUHO Groups |
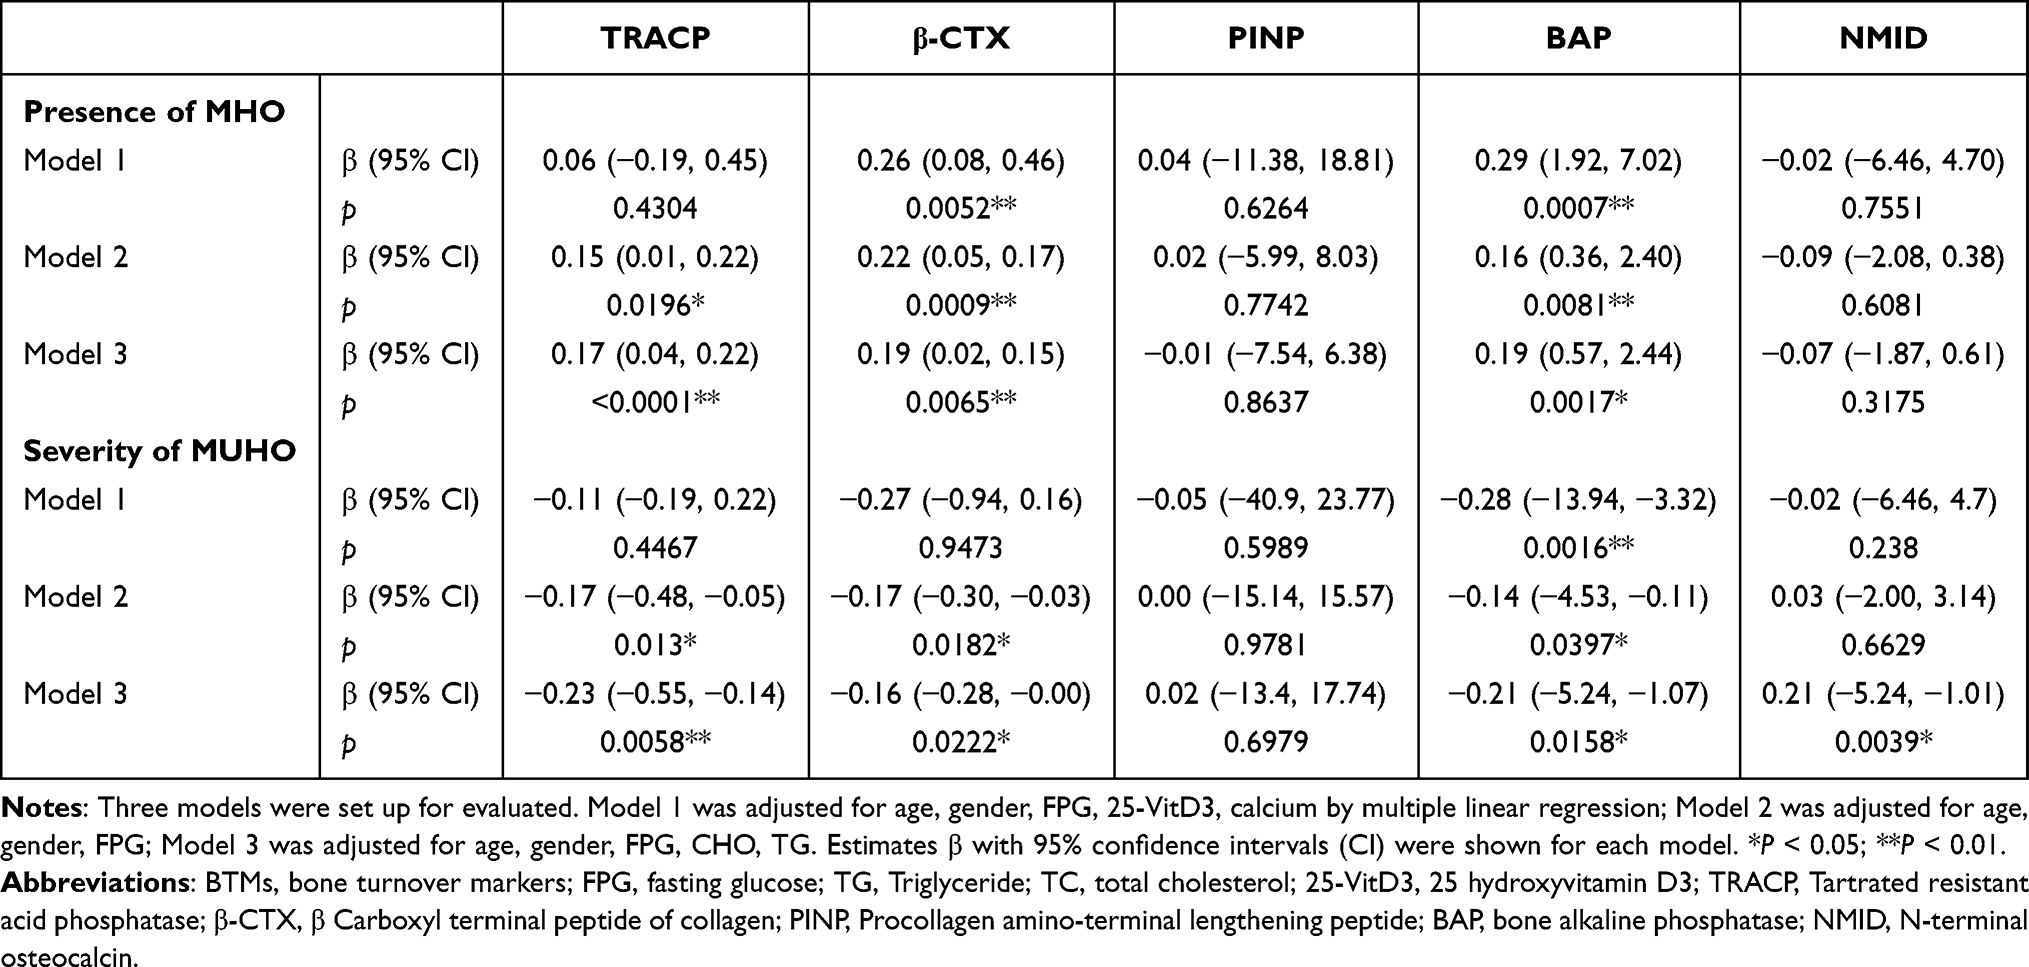 |
Table 3 Differences in BTMs Levels Between Groups According to the Presence of MHO or the Severity of MUHO by Multiple Linear Regression, Respectively |
Effect of BTMs on the Presence of MHO or Severe MuHO
We established a univariate logistic regression model with the occurrence of MHO as the dependent variable. Clinical indicators and bone metabolism indicators were brought into the model to screen out the factors that may affect the occurrence of MHO, as shown in the Supplemental Table.
Next, we included the selected variables in three multivariate logistic regression models with the presence of MHO as the endpoint event. TRACP, β-CTX, and BAP were identified as independently associated with the occurrence of MHO in each model, which included different clinically relevant variables (Table 4). We further observed the predictive effect of these bone indexes on the presence of MHO by constructing ROC curves, and found that the maximum AUC value was obtained when gender, age, BMI, TRACP, β-CTX, and BAP were included simultaneously (AUC = 0.8221, sensitivity: 81.25%, specificity: 72.3%, showed in Table 5).
 |
Table 4 The Independent Effect of BTMs on the Presence of MHO or the Severity of MUHO by Multivariable Logistic Regression, Respectively |
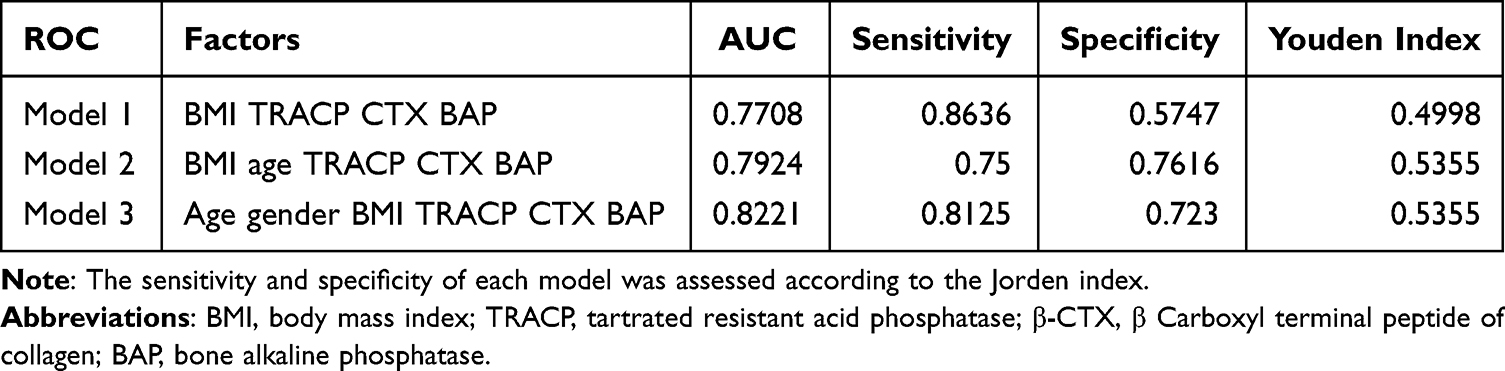 |
Table 5 ROC Curve for Definition of MHO by Combining Different Indexes |
Correlation of BTMs and Clinical Indexes in the MHO Group
In the whole population, the bone turnover index was slightly positively correlated with BMI and HDL, but negatively correlated with HbA1c, HOMA-IR, and BAI. Low bone turnover activity was associated with significant hyperglycemia, insulin resistance, and body fat index (p < 0.05, in Supplemental Table).
Discussion
Our study found significant differences in the serum bone metabolic indexes of MHO and MuHO patients. The BAP bone formation index and TRACP and β-CTX bone resorption indexes were higher in the MHO group than the MuHO group, suggesting that the obesity phenotypes had different bone biological activities, with increased bone transformation activity in MHO and decreased activity in MuHO.
MHO is considered to be an intermediate state between healthy and morbid obesity with a pathophysiology in which early fat expansion is not accompanied by metabolic abnormalities. A meta-analysis of prospective cohort found that MHO individuals had an increased the risk of cardiovascular disease19,20 and diabetes21,22 compared with their healthy normal-weight counterparts.23 In our study, 15.28% of the obese participants had the MHO phenotype, which is consistent with the 14.9–19.5% reported by others.24,25 We found that, when there was no difference in the BMI of MHO and MuHO individuals the obesity index BAI, VAI, and WHtR were significantly increased in MuHO group, suggesting that MHO and MuHO presented different body fat patterns, and that MuHO individuals had a higher visceral fat content. In a large BMI-stratified cohort, Stefan et al26,27 found that high liver fat content and visceral fat were associated with MuHO, while the MHO phenotype was associated with higher insulin sensitivity, better insulin secretion, good cardiorespiratory function, and lower subcutaneous fat mass.28,29 We compared the glycemic and lipid metabolism indexes of the two groups. The MHO group had normal glucose and lipid metabolism and insulin resistance, and there were significant differences in glycosylated hemoglobin, insulin, triglyceride, cholesterol, and insulin resistance indexes between the two groups.
Previous studies have reported the changes in bone nutrition and metabolic trace elements that occur in obese compared with healthy individuals. Some have investigated differences in the bone metabolism indexes in MHO and MuHO study cohorts,30,31 and vitamin D, calcium, and parathyroid hormone deficiencies were observed in MuHO but not MHO individuals.32 The MuHO phenotype seems to have an increased risk of bone metabolism-related changes that may contribute to the development of bone diseases. Mirzababaei et al confirmed that BMD was modified in both MHO and MuHO.33 Vigevano et al found that in men with diabetes, the presence of obesity was correlated with poor bone strength and trabecular microarchitecture and decreased bone turnover.12 Our study found slight increases in bone formation markers and bone resorption markers in MHO group that remained within the normal range. Calcium and vitamin D levels were not different from those with MuHO.
Our study explored the effects of different obesity phenotypes on bone turnover indicators that were identified in previous studies. In our study, the bone formation index BAP and the bone resorption indexes β-CTX and TRACP were slightly increased in MHO individuals and higher than in MuHO individuals. Bone metabolism indicators may be affected by age, sex, and various clinical biochemical indicators; however, the differences persisted after correcting for sex, age, blood glucose, blood lipid, blood calcium, and vitamin D levels in three statistical models. The MHO group showed slightly increased bone turnover activity compared with the MuHO group.
We suggest that differences in glucose and lipid metabolism may be the cause of the difference in bone turnover activity in MHO and MuHO individuals. β-CTX is specific for the breakdown of type I collagen, and the increase of β-CTX indicates an increase of bone turnover. Elevated β-CTX is known to be associated with abnormal deposition of adipose tissue in visceral organs,34,35 and β-CTX is negatively correlated with subcutaneous adipose tissue.36 TRACP is a bone resorption marker that reflects the number of osteoclasts.37,38 BAP, derived from osteoblasts, increases the local concentration of phosphoric acid. It is required for bone matrix mineralization, reflects osteoblast activity, and is an indicator specific for bone formation.39–41 We found that the bone bioactivity was correlated with glycolipid metabolism indexes in MHO individuals. When the two groups had similar BMIs, MuHO showed lower bone turnover activity. Circulating bone turnover markers reflect the metabolism of the entire bone. Low bone turnover activity was associated with significant hyperglycemia, insulin resistance, and body fat index,36,42 which is similar to our results. Our research suggested that low levels of bone turnover markers are associated with elevated HbA1c, HOMA-IR and BAI. Wojciech J. found that reduced CTX-1 in women with metabolic syndrome was significantly associated with insulin resistance, independent of BMI centile and waist circumference.43 Nielsen et al also reported that there may be a link between the development of insulin resistance and low bone turnover, which was associated with development of brittle bone structure and increased fracture risk in patients with abdominal obesity and diabetes.44
It has been reported that the bone transformation activity of obese individuals was decreased compared with the healthy individuals. Garnero et al found that the bone biochemical indexes of obese individuals decreased compared with healthy weight individuals, and bone resorption indexes decreased more than bone formation indexes. This partly explains the increase in bone density caused by obesity.45,46 But the current research is not uniform. For example, Melo observed that 7 years after bariatric surgery, not only did BMI tend to be normal, but markers of bone formation and bone resorption increased compared to themselves in the pre-operative state in severe obesity populations.47 In our research, a slight positive correlation between BMI and bone transformation markers was observed in obese people with similar BMIs ≥30Kg/m2. We analyzed that the reason may be that the increase in bone transformation activity in the early stage of pathological obesity without metabolic abnormalities may be a compensatory change in bone load-bearing capacity with weight gain.48 However, with the emergence of metabolic abnormalities, the accumulation of visceral fat and the rise of inflammatory response, the body’s bone metabolic activity is not enough to maintain normal bone mass, and then the bone metabolism in MuHO population shows a slightly decreased trend. We speculate that this trend is also related to pathological bone changes.
Some studies found that abdominal obesity was associated with osteopenia in similar BMI obesity subgroups and the accumulation of visceral fat was associated with osteoporosis.49,50 Ghezelbash et al found that in individuals of the same body weight and a high waist circumference experienced a 3- to 7-fold increase of spine-bearing and vertebral-fatigue compression fractures compared with those having a smaller waist circumference.51 In a longitudinal study of adolescents, visceral adipose tissue measured by peripheral quantitative computed tomography was negatively associated with tibia and radius strength, in girls but not in boys.52 Others have suggested that obese people have lower bone density per kilogram of body weight.53
Changes in calcium, phosphorus, and vitamin D were proved been essential for bone mineralization. Serum calcium and 25-VitD3 and serum calcium do not differ in different obesity phenotypes. It is worth noting that PTH was slightly increased in the MuHO group. We speculate that changes of PTH may be more sensitive indicators of obesity phenotype than calcium and vitamin D, and may change early because of feedback regulation of blood calcium. Loureiro et al reported decreased calcium and vitamin D in individuals with grade 3 obesity, but an association of PTH and MHO was not seen.54
We observed a weak correlation between bone turnover markers and HDL level. Some research suggested an association between hyperlipidemia and osteoporosis. Kim suggested that low bone mineral density in adult males is closely related to hyperlipidemia.55 Wojciech J. found that TG, not HDL, was the best predictor of metabolic syndrome in adolescent males and females.43 Recent data exhibited that there is a positive association between HDL and bone mass.56 Some studies have shown that elevated HDL is associated with better bone quality and reduced risk of osteoporosis, while other studies supported an inverse correlation between HDL levels and bone mass.57,58 Factors such as genetic background, age, eating habits and metabolic status are thought to be responsible for this inconsistency.
We used multiple logistic regression models to identify factors independently associated with obesity phenotypes. Increased β-CTX and BAP levels may be protective factor in those with the MHO phenotype. Patients with MHO and without metabolic disorders had increased bone biological activity in early physiological stages, which helps to meet the demands of increased body weight on bone strength. However, when metabolic disorders occur, the biological activity of bone is not enough to compensate for the demand generated by excessive weight growth, and bone transformation activity decreases, leading to osteoporosis and pathological bone diseases in obese patients. Previous studies found that in obese children with type 2 diabetes, bone marrow fat increased and led to weak bones and bone-related diseases.59
TRACP, β-CTX, and BAP were negatively correlated with severe MuHO after adjusting for clinical influencing factors. We hypothesized that bone turnover activity tended to be lower when the number of items with metabolic abnormalities increased. Logistic regression did not identify bone indexes that were independently associated with the severity of MuHO, suggesting that changes in bone activity were not significant in obese people with metabolic disorders of different severity.
A study limitation was the cross-sectional design without investigation of longitudinal changes and long-term risk of osteoporosis in obese people with different metabolic phenotypes. In addition, bone density evaluation and dietary surveys containing calcium intake were not performed. We will include more complete clinical indicators in future studies.
Conclusion
In conclusion, our study evaluated bone metabolic indexes in obese individuals with different metabolic phenotypes. We found that BAP, TRACP, and β-CTX were increased within the physiological range in the MHO population, indicating that the MHO phenotype had a slightly increased bone turnover activity, compared with the MuHO phenotype. This may be an early compensatory response of the skeletal metabolism to an increased BMI.
Acknowledgments
We thank International Science Editing for editing this manuscript. We gratefully acknowledge the subjects who were involved in conducting the project.
Funding
This research did not receive any specific grant from any funding agency in the public, commercial or not-for-profit sector.
Disclosure
The authors have no conflicts of interest to declare for this work.
References
1. Liu J, Zhang L, Fu J, Wang Q, Wang G. Circulating prolactin level is increased in metabolically healthy obesity. Endocr Connect. 2021;10(4):484–491. doi:10.1530/EC-21-0040
2. Bluher M. Metabolically healthy obesity. Endocr Rev. 2020;41(3):bnaa004. doi:10.1210/endrev/bnaa004
3. Stefan N, Haring HU, Hu FB, Schulze MB. Metabolically healthy obesity: epidemiology, mechanisms, and clinical implications. Lancet Diabetes Endocrinol. 2013;1(2):152–162. doi:10.1016/S2213-8587(13)70062-7
4. Janicka A, Wren TA, Sanchez MM, et al. Fat mass is not beneficial to bone in adolescents and young adults. J Clin Endocrinol Metab. 2007;92(1):143–147. doi:10.1210/jc.2006-0794
5. Zhao LJ, Liu YJ, Liu PY, Hamilton J, Recker RR, Deng HW. Relationship of obesity with osteoporosis. J Clin Endocrinol Metab. 2007;92(5):1640–1646. doi:10.1210/jc.2006-0572
6. Sukumar D, Schlussel Y, Riedt CS, Gordon C, Stahl T, Shapses SA. Obesity alters cortical and trabecular bone density and geometry in women. Osteoporos Int. 2011;22(2):635–645. doi:10.1007/s00198-010-1305-3
7. De Laet C, Kanis JA, Oden A, et al. Body mass index as a predictor of fracture risk: a meta-analysis. Osteoporos Int. 2005;16(11):1330–1338. doi:10.1007/s00198-005-1863-y
8. Wetzsteon RJ, Petit MA, Macdonald HM, Hughes JM, Beck TJ, McKay HA. Bone structure and volumetric BMD in overweight children: a longitudinal study. J Bone Miner Res. 2008;23(12):1946–1953. doi:10.1359/jbmr.080810
9. Makovey J, Naganathan V, Sambrook P. Gender differences in relationships between body composition components, their distribution and bone mineral density: a cross-sectional opposite sex twin study. Osteoporos Int. 2005;16(12):1495–1505. doi:10.1007/s00198-005-1841-4
10. Must A, Jacques PF, Dallal GE, Bajema CJ, Dietz WH. Long-term morbidity and mortality of overweight adolescents. A follow-up of the Harvard Growth Study of 1922 to 1935. N Engl J Med. 1992;327(19):1350–1355. doi:10.1056/NEJM199211053271904
11. Kim HY, Choe JW, Kim HK, et al. Negative association between metabolic syndrome and bone mineral density in Koreans, especially in men. Calcif Tissue Int. 2010;86(5):350–358. doi:10.1007/s00223-010-9347-2
12. Vigevano F, Gregori G, Colleluori G, et al. In men with obesity, T2DM is associated with poor trabecular microarchitecture and bone strength and low bone turnover. J Clin Endocrinol Metab. 2021;106(5):1362–1376. doi:10.1210/clinem/dgab061
13. Ortega FB, Lavie CJ, Blair SN. Obesity and cardiovascular disease. Circ Res. 2016;118(11):1752–1770. doi:10.1161/CIRCRESAHA.115.306883
14. Gomez-Zorita S, Queralt M, Vicente MA, Gonzalez M, Portillo MP. Metabolically healthy obesity and metabolically obese normal weight: a review. J Physiol Biochem. 2021;77(1):175–189. doi:10.1007/s13105-020-00781-x
15. Mongraw-Chaffin M, Foster MC, Anderson CAM, et al. Metabolically healthy obesity, transition to metabolic syndrome, and cardiovascular risk. J Am Coll Cardiol. 2018;71(17):1857–1865. doi:10.1016/j.jacc.2018.02.055
16. Inker LA, Titan S. Measurement and estimation of GFR for use in clinical practice: core curriculum 2021. Am J Kidney Dis. 2021;78(5):736–749. doi:10.1053/j.ajkd.2021.04.016
17. Amato MC, Giordano C, Galia M, et al. Visceral Adiposity Index: a reliable indicator of visceral fat function associated with cardiometabolic risk. Diabetes Care. 2010;33(4):920–922. doi:10.2337/dc09-1825
18. Tchernof A, Despres JP. Pathophysiology of human visceral obesity: an update. Physiol Rev. 2013;93(1):359–404. doi:10.1152/physrev.00033.2011
19. Eckel N, Meidtner K, Kalle-Uhlmann T, Stefan N, Schulze MB. Metabolically healthy obesity and cardiovascular events: a systematic review and meta-analysis. Eur J Prev Cardiol. 2016;23(9):956–966. doi:10.1177/2047487315623884
20. Kramer CK, Zinman B, Retnakaran R. Are metabolically healthy overweight and obesity benign conditions? A systematic review and meta-analysis. Ann Intern Med. 2013;159(11):758–769. doi:10.7326/0003-4819-159-11-201312030-00008
21. Bell JA, Kivimaki M, Hamer M. Metabolically healthy obesity and risk of incident type 2 diabetes: a meta-analysis of prospective cohort studies. Obes Rev. 2014;15(6):504–515. doi:10.1111/obr.12157
22. Hashimoto Y, Hamaguchi M, Tanaka M, Obora A, Kojima T, Fukui M. Metabolically healthy obesity without fatty liver and risk of incident type 2 diabetes: a meta-analysis of prospective cohort studies. Obes Res Clin Pract. 2018;12(1):4–15. doi:10.1016/j.orcp.2017.12.003
23. Neeland IJ, Ross R, Despres JP, et al. Visceral and ectopic fat, atherosclerosis, and cardiometabolic disease: a position statement. Lancet Diabetes Endocrinol. 2019;7(9):715–725. doi:10.1016/S2213-8587(19)30084-1
24. Hwang YC, Hayashi T, Fujimoto WY, et al. Visceral abdominal fat accumulation predicts the conversion of metabolically healthy obese subjects to an unhealthy phenotype. Int J Obes. 2015;39(9):1365–1370. doi:10.1038/ijo.2015.75
25. Goday A, Calvo E, Vazquez LA, et al. Prevalence and clinical characteristics of metabolically healthy obese individuals and other obese/non-obese metabolic phenotypes in a working population: results from the Icaria study. BMC Public Health. 2016;16:248. doi:10.1186/s12889-016-2921-4
26. Stefan N, Schick F, Haring HU. Causes, characteristics, and consequences of metabolically unhealthy normal weight in humans. Cell Metab. 2017;26(2):292–300. doi:10.1016/j.cmet.2017.07.008
27. Stefan N, Haring HU, Schulze MB. Metabolically healthy obesity: the low-hanging fruit in obesity treatment? Lancet Diabetes Endocrinol. 2018;6(3):249–258. doi:10.1016/S2213-8587(17)30292-9
28. Chen TP, Lin WY, Chiang CH, Shen TH, Huang KC, Yang KC. Metabolically healthy obesity and risk of non-alcoholic fatty liver disease severity independent of visceral fat. J Gastroenterol Hepatol. 2021;36(10):2903–2910. doi:10.1111/jgh.15544
29. Farcas AD, Vonica CL, Golea A. Non-alcoholic fatty liver disease, bulb carotid intima-media thickness and obesity phenotypes: results of a prospective observational study. Med Ultrason. 2017;19(3):265–271. doi:10.11152/mu-1015
30. Dobson R, Burgess MI, Sprung VS, et al. Metabolically healthy and unhealthy obesity: differential effects on myocardial function according to metabolic syndrome, rather than obesity. Int J Obes. 2016;40(1):153–161. doi:10.1038/ijo.2015.151
31. Karelis AD, Brochu M, Rabasa-Lhoret R. Can we identify metabolically healthy but obese individuals (MHO)? Diabetes Metab. 2004;30(6):569–572. doi:10.1016/s1262-3636(07)70156-8
32. Marques Loureiro L, Lessa S, Mendes R, Pereira S, Saboya CJ, Ramalho A. Does the metabolically healthy obese phenotype protect adults with class III obesity from biochemical alterations related to bone metabolism? Nutrients. 2019;11(9). doi:10.3390/nu11092125
33. Mirzababaei A, Mirzaei K, Khorrami-Nezhad L, Maghbooli Z, Keshavarz SA. Metabolically healthy/unhealthy components may modify bone mineral density in obese people. Arch Osteoporos. 2017;12(1):95. doi:10.1007/s11657-017-0381-9
34. Chen H, He Y, Wu D, et al. Bone marrow sFRP5 level is negatively associated with bone formation markers. Osteoporos Int. 2017;28(4):1305–1311. doi:10.1007/s00198-016-3873-3
35. D’Oronzo S, Brown J, Coleman R. The role of biomarkers in the management of bone-homing malignancies. J Bone Oncol. 2017;9:1–9. doi:10.1016/j.jbo.2017.09.001
36. Vilaca T, Evans A, Gossiel F, Paggiosi M, Eastell R, Walsh JS. Fat, adipokines, bone structure and bone regulatory factors associations in obesity. Eur J Endocrinol. 2022;187(6):743–750. doi:10.1530/EJE-22-0530
37. Andersson G, Ek-Rylander B, Hollberg K, et al. TRACP as an osteopontin phosphatase. J Bone Miner Res. 2003;18(10):1912–1915. doi:10.1359/jbmr.2003.18.10.1912
38. Halleen JM, Tiitinen SL, Ylipahkala H, Fagerlund KM, Vaananen HK. Tartrate-resistant acid phosphatase 5b (TRACP 5b) as a marker of bone resorption. Clin Lab. 2006;52(9–10):499–509.
39. Cabral HW, Andolphi BF, Ferreira BV, et al. The use of biomarkers in clinical osteoporosis. Rev Assoc Med Bras. 2016;62(4):368–376. doi:10.1590/1806-9282.62.04.368
40. Marinho SM, Mafra D, Pelletier S, et al. In hemodialysis patients, intradialytic resistance exercise improves osteoblast function: a Pilot Study. J Ren Nutr. 2016;26(5):341–345. doi:10.1053/j.jrn.2016.03.002
41. Yu-Yahiro JA, Michael RH, Dubin NH, et al. Serum and urine markers of bone metabolism during the year after Hip fracture. J Am Geriatr Soc. 2001;49(7):877–883. doi:10.1046/j.1532-5415.2001.49177.x
42. Yerlikaya FH, Eryavuz Onmaz D. Inflammation and bone turnover markers in adult obesity. J Clin Densitom. 2022;25(4):470–474. doi:10.1016/j.jocd.2022.08.002
43. Bilinski WJ, Stefanska A, Szternel L, et al. Relationships between bone turnover markers and factors associated with metabolic syndrome in prepubertal girls and boys. Nutrients. 2022;14(6). doi:10.3390/nu14061205
44. Fuglsang-Nielsen R, Rakvaag E, Vestergaard P, et al. Consumption of nutrients and insulin resistance suppress markers of bone turnover in subjects with abdominal obesity. Bone. 2020;133:115230. doi:10.1016/j.bone.2020.115230
45. Garnero P, Delmas PD. Osteoporosis. Endocrinol Metab Clin North Am. 1997;26(4):913–936. doi:10.1016/s0889-8529(05)70287-5
46. Garnero P, Delmas PD. Biochemical markers of bone turnover. Applications for osteoporosis. Endocrinol Metab Clin North Am. 1998;27(2):303–323. doi:10.1016/s0889-8529(05)70007-4
47. Melo TL, Froeder L, Baia LDC, Heilberg IP. Bone turnover after bariatric surgery. Arch Endocrinol Metab. 2017;61(4):332–336. doi:10.1590/2359-3997000000279
48. Guo H, An Z, Wang N, et al. Diabetes mellitus type 2 patients with abdominal obesity are prone to osteodysfunction: a cross-sectional study. J Diabetes Res. 2023;2023:3872126. doi:10.1155/2023/3872126
49. Shepherd JA. Is osteoporosis an obesity paradox? J Clin Densitom. 2013;16(2):131–132. doi:10.1016/j.jocd.2012.05.002
50. Fassio A, Idolazzi L, Rossini M, et al. The obesity paradox and osteoporosis. Eat Weight Disord. 2018;23(3):293–302. doi:10.1007/s40519-018-0505-2
51. Ghezelbash F, Shirazi-Adl A, Plamondon A, Arjmand N, Parnianpour M. Obesity and obesity shape markedly influence spine biomechanics: a subject-specific risk assessment model. Ann Biomed Eng. 2017;45(10):2373–2382. doi:10.1007/s10439-017-1868-7
52. Liu CT, Broe KE, Zhou Y, et al. Visceral adipose tissue is associated with bone microarchitecture in the Framingham Osteoporosis Study. J Bone Miner Res. 2017;32(1):143–150. doi:10.1002/jbmr.2931
53. Pinar-Gutierrez A, Garcia-Fontana C, Garcia-Fontana B, Munoz-Torres M. Obesity and bone health: a complex relationship. Int J Mol Sci. 2022;23(15). doi:10.3390/ijms23158303
54. Hou J, He C, He W, Yang M, Luo X, Li C. Obesity and bone health: a complex link. Front Cell Dev Biol. 2020;8:600181. doi:10.3389/fcell.2020.600181
55. Kim YH, Nam GE, Cho KH, et al. Low bone mineral density is associated with dyslipidemia in South Korean men: the 2008–2010 Korean National Health and Nutrition Examination Survey. Endocr J. 2013;60(10):1179–1189. doi:10.1507/endocrj.ej13-0224
56. Papachristou DJ, Blair HC. Bone and high-density lipoprotein: the beginning of a beautiful friendship. World J Orthop. 2016;7(2):74–77. doi:10.5312/wjo.v7.i2.74
57. Li S, Guo H, Liu Y, et al. Relationships of serum lipid profiles and bone mineral density in postmenopausal Chinese women. Clin Endocrinol. 2015;82(1):53–58. doi:10.1111/cen.12616
58. Ackert-Bicknell CL. HDL cholesterol and bone mineral density: is there a genetic link? Bone. 2012;50(2):525–533. doi:10.1016/j.bone.2011.07.002
59. Pagnotti GM, Styner M, Uzer G, et al. Combating osteoporosis and obesity with exercise: leveraging cell mechanosensitivity. Nat Rev Endocrinol. 2019;15(6):339–355. doi:10.1038/s41574-019-0170-1
 © 2023 The Author(s). This work is published and licensed by Dove Medical Press Limited. The full terms of this license are available at https://www.dovepress.com/terms.php and incorporate the Creative Commons Attribution - Non Commercial (unported, v3.0) License.
By accessing the work you hereby accept the Terms. Non-commercial uses of the work are permitted without any further permission from Dove Medical Press Limited, provided the work is properly attributed. For permission for commercial use of this work, please see paragraphs 4.2 and 5 of our Terms.
© 2023 The Author(s). This work is published and licensed by Dove Medical Press Limited. The full terms of this license are available at https://www.dovepress.com/terms.php and incorporate the Creative Commons Attribution - Non Commercial (unported, v3.0) License.
By accessing the work you hereby accept the Terms. Non-commercial uses of the work are permitted without any further permission from Dove Medical Press Limited, provided the work is properly attributed. For permission for commercial use of this work, please see paragraphs 4.2 and 5 of our Terms.