Back to Journals » International Journal of Nanomedicine » Volume 18
Formulation and Evaluation on Synergetic Anti-Hepatoma Effect of a Chemically Stable and Release-Controlled Nanoself-Assembly with Natural Monomers
Authors Zong L, Wang Y, Song S, Zhang H, Mu S, Liu W, Feng Y, Wang S, Tu Z, Yuan Q, Li L, Pu X
Received 13 February 2023
Accepted for publication 6 June 2023
Published 22 June 2023 Volume 2023:18 Pages 3407—3428
DOI https://doi.org/10.2147/IJN.S408416
Checked for plagiarism Yes
Review by Single anonymous peer review
Peer reviewer comments 2
Editor who approved publication: Prof. Dr. Anderson Oliveira Lobo
Lanlan Zong,1,* Yanling Wang,1,* Shiyu Song,1 Huiqi Zhang,1 Shengcai Mu,1 Wenshang Liu,1 Yu Feng,1 Shumin Wang,1 Ziwei Tu,1 Qi Yuan,1 Luhui Li,2 Xiaohui Pu1
1School of Pharmacy and Henan Province Engineering Research Center of High Value Utilization to Natural Medical Resource in Yellow River Basin, Henan University, Kaifeng, Henan, 475004, People’s Republic of China; 2Medical school, Henan Technical Institute, Kaifeng, Henan, 475004, People’s Republic of China
*These authors contributed equally to this work
Correspondence: Qi Yuan; Xiaohui Pu, Tel/Fax +86-371-23880680, Email [email protected]; [email protected]
Introduction: Hepatoma is the leading cause of death among liver diseases worldwide. Modern pharmacological studies suggest that some natural monomeric compounds have a significant effect on inhibiting tumor growth. However, poor stability and solubility, and side effects are the main factors limiting the clinical application of natural monomeric compounds.
Methods: In this paper, drug-co-loaded nanoself-assemblies were selected as a delivery system to improve the chemical stability and solubility of Tanshinone II A and Glycyrrhetinic acid, and to produce a synergetic anti-hepatoma effect.
Results: The study suggested that the drug co-loaded nanoself-assemblies showed high drug loading capacity, good physical and chemical stability, and controlled release. In vitro cell experiments verified that the drug-co-loaded nanoself-assemblies could increase the cellular uptake and cell inhibitory activity. In vivo studies verified that the drug co-loaded nanoself-assemblies could prolong the MRT0-∞, increase accumulation in tumor and liver tissues, and show strong synergistic anti-tumor effect and good bio-safety in H22 tumor-bearing mice.
Conclusion: This work indicates that natural monomeric compounds co-loaded nanoself-assemblies would be a potential strategy for the treatment of hepatoma.
Keywords: nanoself-assemblies, drug combination, glycyrrhetinic acid, tanshinone IIA, liver cancer
Graphical Abstract:

Introduction
It was reported that the total number of chronic liver disease patients in China could be over 447 million people in 2020.1 As a complication of hepatitis, hepatoma is the main cause of death. The clinical studies from Translation Chinese Medicine (TCM) have shown that the blood stasis syndrome was present throughout the development of liver cancer (Hepatoma), and promoting blood circulation for removing blood stasis medicine can effectively inhibit the development of liver cancer, especially the strengthening the middle warmer and benefiting vital energy drugs can effectively improve the deficiency of promoting blood circulation for removing blood stasis drugs alone, inhibit tumor metastasis and reduce immune inflammatory response.2 For example, Salvia miltiorrhiza-Licorice (named Danshen-Gancao in Chinese) is one of the famous couplet herbs with functions of promoting blood circulation, removing blood stasis, strengthening the middle warmer and benefiting vital energy for the treatment of liver cancer.
Tanshinone II A (TAN) is a major lipophilic non-quinone compound extracted from the root of Salvia miltiorrhiza,3 and Glycyrrhetinic acid (GA) is a pentacyclic triterpenoid glycoside with poor solubility derived from the root of licorice. Modern pharmacological studies suggest that they have a very wide range of pharmacological activities, such as TAN has anti-oxidation, anti-inflammatory, anti-thrombosis, lowering blood pressure, regulating vascular endothelial dysfunction, anti-liver fibrosis and anti-tumor activity,4 GA has antioxidant, anti-inflammatory, liver protection, antiviral activities, and so on.5 However, these two natural components have some defects, such as low oral bioavailability6,7 and side effects which TAN has an allergic reaction, bradycardia, tachycardia, drug-induced hepatitis, diarrhoea, muscle tremor, uremia, severe growth inhibition and developmental malformations of embryos,3 and GA has water-sodium retention, oedema, hypertension and cardiac dysfunction after long-term and extensive application.8 TAN also has photothermal instability and strong liver first-pass effect.9 Their disadvantages greatly hinder the use of both in clinical treatment. Luckily, TAN and GA have broad and similar effects on anti-cancer and mutual easing effects in terms of side effects. What is more, TAN and GA have been proven to have good inhibitory effects on liver cancer at the genetic, cellular and holistic levels.
TAN and GA exert anticarcinogenic effects via different mechanisms, and many studies have demonstrated that they have direct cytotoxic effects and induce apoptosis via different targets. For example, TAN-induced HepG2 and Hep3B liver cancer cell apoptosis by activating the caspase-3 and Caspase-8/9 via miR30b-p53-PTPN11/SHP2 signaling pathway, prevented the proliferation of the HepG2 and SMMC-7721 HCC cell lines by downregulating the expression of MMP-2 and MMP-3/9 and blocking NF-κB activation, and inhibited cell invasion and migration by regulating the expression level of E-cadherin and vimentin in HCC cells via TGF-β signaling pathway.10 TAN inhibited cancer cell-line proliferation by blocking the STAT3 signaling pathway.3 It is worth noting that the above related signaling pathways have also been confirmed to be closely related to the antioxidant activity and anti-inflammatory response of TAN.11,12 So, TAN’s inhibition effect on the occurrence and development of HCC through multiple pathways and targets is partly due to its significant antioxidant and anti-inflammatory activity. GA promoted the apoptosis of cancer cell by activating the caspase-3 and Caspase-8/9 and downregulating the expression of some inflammatory facts (such as NF-κB, IL-6, IL-8) via MEK-ERK signaling pathway, restrained cancer cell propagation by activating JNK signaling, inhibiting SHMT2 activity or depleting SHMT2, and suppressed cell invasion and migration by regulating the expression level of E-cadherin and vimentin and inhibiting ROS formation (increasing antioxidant activity) in cancer cells via ROS/PKC-α/ERK signaling pathway.13–16 Therefore, their combination could be not only expected to exert the synergistic anti-liver cancer effect, but also to alleviate the toxic and side effects of each other.
With the application of nanotechnology in drug delivery system, it has been found that nano-drugs can increase the solubility and bioavailability of drugs. Therefore, researchers have developed a variety of nano-formulations, such as polymer micelles, liposomes, nanoparticles and nano-emulsions, to solve the insolubility, instability and low bioavailability of TAN and GA.17–21 In addition, nanodrugs can be co-loaded with multiple drugs, so that drugs can play a better synergistic effect in vivo, reduce the occurrence of drug resistance, improve tumor targeting and suppressive effect, and reduce side effect.
In conclusion, the manufacture of TAN and GA co-loaded nanoself-assembly will be a very potential strategy to improve the solubility, stability and druggability of TAN and GA, and achieve synergistic anti-tumor efficacy and toxicity reduction. Deoxycholic acid (DCA) is a kind of bile acid secreted by human or animal liver, and has natural liver targeting and good biosafety.22 The amphiphilic planar structure gives it surfactant properties, allowing it to be used as a carrier to self-assemble into nanoparticles with some drugs.23 Therefore, a kind of TAN and GA co-loaded nanoself-assembly will be developed by the solvent evaporation method with DCA or mPEG-DCA as the carrier in this study. The optimum synergistic ratio and preparation process of TAN and GA will be optimized. Its long cycle and targeting will be investigated by in vivo pharmacokinetics and tissue distribution test. HepG2 cells and H22 tumor-bearing mice were used to study the safety and antitumor effect in vitro and in vivo.
Materials and Methods
Materials
Dimethyl sulfoxide (DMSO) and triethylamine from Tianjin Fuyu Fine Chemical Co., Ltd. Fetus bovine serum, RPMI1640 medium and trypsin were from Gibco, USA. Tetramethylazolazol blue (MTT), streptomycin sulfate, penicillin from the United States Amerco Company; Human normal liver cell 7702 and human hepatoma cell HepG2 were both from Beijing Donggebo Biotechnology Co., Ltd. Glycyrrhetinic acid (GA, 99%) and tanshinone IIA (TAN, 98%) were from Nanjing Jingzhu Biotechnology Co., Ltd. Deoxycholic acid (DCA) from Shanghai Yuanye Biotechnology Co., Ltd. Polyethylene glycol monomethyl ether-deoxycholic acid (mPEG-DCA) was prepared in laboratory. Methylene chloride (CH2Cl2) from Tianjin Chemical Reagent Supply and Marketing Company; Coomassie Bright Blue from Solibao; Chromatographic methanol from Tianjin Siyou Fine Chemicals Co., Ltd. Polyformaldehyde from Shanghai Yuanzhen Chemical Trading Co., Ltd. Sodium chloride from Beijing Lantai Chemical Technology Co., Ltd.
Screening of Synergistic Ratio
To obtain the optimal combination ratio, the inhibition rates of tumor cell growth were investigated by MTT assay using TAN-GA mixtures (TG-Mix) with different mass ratios (GA:TAN = 4:0, 3:1, 2.5:1.5, 2:2, 1.5:2.5, 1:3, 0:4).24–27 Briefly, HepG2 cells in the logarithmic growth phase were seeded into 96-well culture plates at the concentration of 6×10³ cells/well. After culturing for 24 h, free TAN, free GA, and TG-Mix were added into cells at the final concentration of 5, 10, 20, 40, 80 μg/mL, respectively. Then, the cells were incubated in constant temperature incubator (37°C, 5% CO2) for another 24 h. After that, the culture medium containing drug formulations was carefully removed and the cells were washed twice with fresh culture medium, and 10 μL of MTT solution was added into each well and sequentially incubated for 4 h. The cells were washed twice with a fresh culture medium after the culture medium containing MTT was discarded. Then, 100 μL of DMSO was used to dissolve the MTT crystals. The absorbance of each well was measured at a wavelength of 570 nm, and the survival rate of HepG2 cells was calculated as follows: Cell viability (%)=ODtest/ODcontrol×100%. All experiments were repeated 3 times. The IC50 values were calculated using SPSS 12.0. The optimal combination ratio of TG-Mix was confirmed by the combined index (CI, CI>1 indicates antagonistic effect; CI=1 indicates an additive effect; CI<1 indicates synergistic effect), which was calculated by the following formula.

C(GA), C(TAN) were the concentrations of two drug in TG-Mix when 50% of the HepG2 cell was inhibited by TG-Mix.
Formulation of TAN and GA Co-Loaded Nanoself-Assembly
In this study, TAN and GA co-loaded Nanoself-assembly were manufactured by a solvent evaporation method. The preparation process of nanoself-assembly is as follows: Firstly, some mPEG-DCA, GA and TAN were dissolved in 2 mL ethanol; Subsequently, the solution was added dropwise into a certain volume of ultra-pure water with high-speed agitation at the speed of 1800 r/min, and then was continuously agitated to remove ethanol completely. The obtained suspension was sonicated at 60 W using a probe ultrasonic instrument for 10 min and centrifuged at 636 g for 10 min to obtain the TAN and GA co-loaded nanoself-assemblies by mPEG-DCA (PD@TG-Nanos).
According to the results of single-factor tests, it was found that the ratio of drug to a carrier (A), the ratio of GA and TAN (B), and the ratio of organic solvent to water (O:W, C) were critical parameters that influence the dimension and loading content of Nanoself-assembly. Therefore, the central composite design (CCD)-response surface method was used to optimize the fabricated process with the above three critical parameters as experimental factors (shown in Table S1). And particle size (Y1), drug load of GA (R2) and drug load of TAN (R3) were selected as the responsive indexes within a minimum number of experiments (shown in Table S2). Design Expert 12.0 software was used to fit the experimental results to obtain an optimal polynomial mathematical model. The optimal process parameters were selected from response surface diagrams.
The control nanoself-assembly, such as TAN loaded nanoself-assembly with mPEG-DCA (PD@TAN-Nanos), GA loaded nanoself-assembly with mPEG-DCA (PD@GA-Nanos), GA and TAN co-loaded nanoself-assembly with DCA (DCA@TG-Nanos), DCA nanoself-assembly and mPEG-DCA nanoself-assembly were fabricated using the optimal process of PD@TG-Nanos, except that TG-Mix was replaced by TAN or GA, or mPEG-DCA was replaced by the equivalent amount of DCA.
Characterization
The particle size, size distribution (PDI), and zeta potential of PD@TG-Nanos, PD@TAN-Nanos, PD@GA-Nanos, DCA@TG-Nanos were measured using a Nano-ZS90 ZetaSizer (Malvern Instruments, Malvern, UK). Each sample was measured in triplicate. The freshly prepared nanoparticles were placed onto a carbon-coated copper grid and dried at room temperature overnight in a vacuum oven.28 The dimensions and morphologies of micelles were imaged on a JEOL 2010 transmission electron microscopy (TEM, JEOL Co., Japan).
To determine the drug loading capacities (DLC) and encapsulation efficiency (EE), 1 mL of freshly prepared nanoself-assembly was dissolved in 10 mL of ethanol and sonicated for 15 min. After filtration through a 0.22 μm filter, the concentration of TAN and GA in the ethanolic solution was determined at 250 nm and 270 nm with a UV detector on a Waters 2695–2489 HPLC system (Waters Co., Ltd., Milford, MA, USA) coupled by the following method: stationary phase, Waters Symmetry C18 column (250 mm×4.6 mm, 5 μm); mobile phase, methanol:0.1 M PBS (pH 3.0) (90:10, v/v); and flow rate, 1.0 mL/min. All experiments were performed in triplicate. The DLC and EE values were calculated according to the following equations:29,30


Prediction of Binding Affinity Between Small Molecules
Molecular docking (MD) simulations are one of the most popular receptor-ligand docking simulation technology, which is also used to investigate binding affinity between small molecules.31 For nanoself-assemblies, the molecular force between components is closely related to their physical stability and controlled release ability. So, MD simulations were conducted to predicate the molecule interactions among TAN, GA and carriers using the AutoDock 4.0 software. The 3D molecule structures of the two drugs and carriers were created through structural minimization and dynamics optimization with the Mgltools 1.5.6. All other parameters were maintained at the default values. The docking algorithm used local search parameters, which were set to the default values (the number of LS runs: 50, the maximum number of iterations: 300, the maximum number of successes in a row before changing rho: 4, the maximum number of failures in a row before changing rho: 4, soils and wets parameter defining initial variance and size of local space to sample (rho): 1.0, lower bound on rho:0.01, and the probability of any particular phenotype being subjected to local search: 0.06). The results were analyzed by PyMOL-2.3.1 software.
Differential Scanning Calorimetry
For differential scanning calorimetry (DSC) analysis, all freshly prepared nanoself-assemblies were freeze-dried at −45°C for 36 h by a freeze-dryer (christalph1-2 LD plus, Germany) to obtain the dry powder. A 3 mg of GA, TAN, mPEG-DCA, DCA, PD@TG-Nanos, PD@TAN-Nanos, PD@GA-Nanos, DCA@TG-Nanos, and physical mixtures (the mixture of GA, TAN, and mPEG-DCA or DCA, abbreviated to PM-PD or PM-DCA) were placed in a differential scanning calorimeter. The differential scanning calorimetry diagram was recorded with the nitrogen flow at 20 mL/min and heating speed of 10°C/min from 30°C to 500°C with the empty aluminum pan as the blank control.
Study on the Stability
Physical Stability
To study the stability of PD@TG-Nanos, PD@TAN-Nanos, PD@GA-Nanos, and DCA@TG-Nanos, the tests of storage stability, dilution stability, plasma stability, and freeze-drying stability were carried out in this study. In the storage stability test, the nanoself-assemblies were, respectively, stored at 4 °C and room temperature for 20 days and the sizes were measured on a predetermined day.
In the dilution stability test, several nanoself-assemblies were, respectively, dilutedto 5, 10, 25, 50, 100 times with distilled water and particle size analysis was executed by laser particle size analyzer after half an hour.
In the plasma stability test, the nanoself-assemblies were incubated with a PBS solution (pH=7.4) containing 10% rat plasma at 37 °C for 48 h in a constant temperature shaker (ZWY-103D, Shanghai Zhicheng, China) at a shaking speed of 100 rpm. After that, 2 mL of the samples were withdrawn at a pre-determined time of 0 h, 1 h, 2 h, 4 h, 12 h, 24 h and 48 h, and then the sizes were analyzed. All measurements were carried out in triplicate.
In order to investigate the effect of freeze-drying on the stability of several nanoself-assemblies, the freeze-dried powders were re-dispersed in ultra-pure water, and the particle size, encapsulation efficiency and drug loading content of each nanoself-assembly were measured. Three copies of each sample were analyzed.
Chemical Stability
Thermal Stability
The TAN solution, GA solution, and four nanoself-assemblies were placed in a thermostat water bath at 80 °C, respectively. The samples were withdrawn, and the content of TAN and GA was measured at 0.5, 1, 2, 4, 6 and 8h, respectively. Three copies of each sample were analyzed in parallel.
Photostability
The TAN solution, GA solution, and four nanoself-assemblies were placed in a light box with illumination of 4500LX±500LX, respectively. The samples were withdrawn at predetermined time of 0.5, 1, 2, 4, 6 and 8h, and the content of TAN and GA were measured, respectively. Three copies of each sample were analyzed in parallel.
pH Stability
The TAN solution, GA solution, and four nanoself-assemblies were, respectively, diluted by PBS with pH of 3.0, 6.8 and 9.0, and incubated in a constant temperature shaker. Samples were taken out at 1, 2, 4, 6 and 8 h for drug content determination. Three copies were analyzed for each sample.
Study on Protein Adsorption
PD@TG-Nanos, PD@TAN-Nanos, PD@GA-Nanos, DCA@TG-Nanos, and distilled water were, respectively, mixed with an equal volume of 10% mouse plasma, and incubated in a shaker at (37°C, 100 rpm) for 48 h. One millilitre of the sample was withdrawn at predetermined time points of 0.5 h, 2 h, 4 h, 8 h, 12 h, 24 h and 48 h. The samples were centrifugated for 10 min (15,898 g), and the sediment was washed once with distilled water. Then, 100 μL of distilled water was added to disperse the sediment. To determine the amount of protein in the dispersion, 5 mL of Coomassie brilliant blue solution was added, and the absorbance was determined at the wavelength of 595 nm with the SpectraMax M2e multi-function enzyme labelling instrument (American Molecular Instruments Company, the USA). Each formulation was analyzed in triplicate. The protein concentration was calculated using bovine serum albumin as standard.
Fresh mouse plasma was diluted with normal saline to prepare the solution containing 10%, 20%, 40%, 60%, 80%, 100%, 100% of plasma, and incubated in a constant temperature shaker (37°C, 100 rpm) with equal volume of nanoself-assembly. One milliliter of the sample was withdrawn at 2 h, and analyzed by the above same methods.
In vitro Release Test
For study on release behavior of drug from the different formulations, one milliliter of fresh formulation was put into dialysis bags (MW2000, three copies of each formulation in parallel). The dialysis bags were placed in 30 mL pH 7.4 PBS release medium containing 0.5% twain-80 (W/V) and incubated in a constant temperature shaker (37°C, 120 rpm). One milliliter of sample was taken out at scheduled time points of 0.25 h, 0.5 h, 1 h, 2 h, 4 h, 6 h, 8 h, 10 h, 12 h, 24 h, 36 h and 48 h, and then equivalent fresh release medium was added. Finally, the samples were injected into the HPLC for content determination at the above chromatographic condition, and the cumulative release of GA and TAN was calculated.
Hemolytic Test
PD@TG-Nanos, PD@TAN-Nanos, PD@GA-Nanos, DCA@TG-Nanos were, respectively, diluted to the concentration of 10, 50, 100, 200 and 400 μg/mL. 500 μL of the above samples were mixed with an equal volume of 2% red blood cell (RBC) suspension to observe hemolysis. In the test, the same volume of normal saline was employed as the negative control, and distilled water was as the positive control. All sample tubes were incubated at 37°C for 2 h and centrifugated at 160 g for 10 min. The experiments were repeated 3 times. The absorbance of the supernatant was analyzed at 545 nm using a microplate reader, and the hemolysis rate (%) was calculated by the following equation.
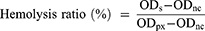
ODs: Absorbance of sample; ODnc: Absorbance of negative control; ODpx: Absorbance of positive control.
Cytotoxicity Test
To investigate the biosafety of the various formulations, its cytotoxicity to human normal liver cells (HL-7702) was investigated. The HL-7702 cells in the logarithmic growth phase were planted into 96 well plates at the concentration of 6×10³ cells/well. After culture for 24 h, the cells were incubated in a constant temperature incubator at 37°C, 5% CO2 for 24 h and 48 h with PD@TG-Nanos, PD@TAN-Nanos, PD@GA-Nanos, DCA@TG-Nanos at the final concentration of 0.04, 0.2, 1, 5, 25 μg/mL, where TAN and GA solutions were used as control. For MTT test, 10μL MTT solution of 5 mg/mL was added to each well and incubated for another 4h. The old medium was discarded, and the cells were washed twice with the fresh culture medium. Then, 100μL of DMSO was added to each well to dissolve MTT crystals. The absorbance (OD value) of each well was measured at a wavelength of 570 nm and the survival rate of HL-7702 cells was calculated. All experiments were repeated thrice.
The cytotoxicity test was carried out by studying the inhibition effect of the various formulations on HepG2 cells. PD@TG-Nanos, PD@TAN-Nanos, PD@GA-Nanos, DCA@TG-Nanos with the concentrations of 1.5625, 3.125, 6.25, 12.5, 25μg/mL were incubated with HepG2 cells in a constant temperature incubator (37 °C, 5% CO2) for 24 h and 48 h. Then, the cell survival rate was determined by the above MTT method. All experiments were repeated 3 times. The IC50 values were calculated with SPSS 12.0.
Cell Uptake Test
HepG2 cells at the concentration of 1×10⁶ cells/well were cultured in an incubator at 37 °C and 5% CO2 for 24 h to allow them to adhere to the wall and fill the well. After that, the old medium was discarded and replaced by free TAN solution, free GA solution, PD@TG-Nanos, PD@TAN-Nanos, PD@GA-Nanos, and DCA@TG-Nanos with the drug concentration of 12.5μg/mL. After co-incubation for 2, 4, 8, 12, and 24 h, respectively, the culture medium containing drug was discarded. The cells were washed with cooled HBSS three times and scraped to disperse into 300 μL of HBSS. The cell suspension was collected into an EP tube and lysed by a cell pulverizer. Then, the lysed cell suspension was mixed with 500 μL of methanol for 30 s by ultrasound. The suspension was centrifugated at 10,175 g for 10 min, and 20 μL of supernatant was taken to analyze the drug content by HPLC.
Tissue Distribution and Pharmacokinetics
All experiments and the welfare of the animals in this study were evaluated and approved by the Committee of Ethics of Animal Experimentation of Henan University (HUSOM2021-078), toxic effects were not observed in any of the animals. SPF KM mice weighing 20 ± 2 g were purchased from Henan Experimental Animal Center (code No. 410983211100027614) and fed in the laboratory for one week to adapt to the experimental environment. All experiments and the welfare of the animals were evaluated and approved by the Ethics Committee for Animal Experimentation of Henan University (License No. HUSOM2021-078). All animals were subcutaneously implanted with 3×10⁶ H22 hepatoma cells cultured in ascites at the right posterior axillary venous plexus. When the tumor volume reached about 500 mm3, H22 tumor-bearing mice were randomly divided into six groups (n=30). Free TAN solution, free GA solution, PD@TG-Nanos, PD@TAN-Nanos, PD@GA-Nanos, DCA@TG-Nanos were injected into mice through the tail vein at a total drug dose of 15 mg/kg. Six mice were randomly selected from each group and killed after administration for 2 h, 4 h, 6 h, 12 h, and 24 h, and the heart, liver, spleen, lung, kidney, and tumor were collected. All tissue samples were stored at −20°C until analysis. The levels of two drugs in each tissue were determined with rhein as internal standard substance by HPLC as described in the above pharmacokinetics test.
Adult male Sprague-Dawley rats, weighing approximately 200±20 g (code No. 37072610100113618), were housed for at least one week in a room at a controlled temperature and relative humidity before the pharmacokinetic study. Thirty-six rats were fasted for 12 h before the experiment and were randomly and equally divided into six equal groups. Free TAN solution, free GA solution, PD@TG-Nanos, PD@TAN-Nanos, PD@GA-Nanos, DCA@TG-Nanos were injected intravenously via the tail vein at a dose of 15 mg/kg. Blood samples (about 500 μL) were collected in heparinized tubes from the orbital venous plexus at 0.083 h, 0.25 h, 0.5 h, 1 h, 2 h, 4 h, 6 h, 8 h, 10 h and 12 h after administration. After immediate centrifugation at 3690 × g for 10 min, plasma samples were withdrawn and stored at −20 °C until further analysis. The levels of two drugs in the plasma were determined with rhein as internal standard substance by HPLC as described in the above except that the mobile phase was replaced by the mixed solution containing methanol and 0.1 M PBS with pH 3.0 (85:15, v/v).
In vivo Study on Antitumor Activity
To investigate the anti-tumor effectivity of GA and TAN Co-loaded Nanoself-assembly, H22 cells were selected to establish a tumor-bearing mouse model in this study. All experiments and the welfare of the animals were evaluated and approved by the Ethics Committee for Animal Experimentation of Henan University. Five to six weeks old SPF Kunming mice (20±2 g, Code No. 410983211100027614) bearing an H22 tumor with relatively uniform body weight and tumor volume were randomly divided into seven groups (n=10): saline, PD@TG-Nanos, PD@TAN-Nanos, PD@GA-Nanos, DCA@TG-Nanos, TAN solution, and GA solution. No significant difference in body weight was observed between these groups. In the saline group, a dose of 0.2 mL/mice was injected every other day. The other six groups were administered intravenously to mice with PD@TG-Nanos, PD@TAN-Nanos, PD@GA-Nanos, DCA@TG-Nanos, TAN solution, and GA solution through the tail vein at a dose of 15 mg/kg every other day for 14 days. Tumor size, animal survival, and body weight were monitored every day. The volume of tumor was calculated according to the following formula: Volume=0.5×(width)2×(length). After consecutive administration seven times every other day, the mice were put to execution at 24 h after the last administration to collect liver, kidney, heart, lung, spleen and tumor. All tissues were washed with cold normal saline (0.9% NaCl) to remove the blood on the surface, followed by quick-drying with tissue paper. After that, the tumor was weighed, and all tissues were buried in wax and sliced to image under a microscope after hematoxylin and eosin (H&E) staining for pathology. The tumor weight inhibition ratio (IRw) was calculated using the following formula:32

where Dcontrol is the tumor weight for the saline group, and Dtest is the tumor weight for the groups treated by drugs.
Results and Discussion
The Optimization Results of Drug Combination Ratio
Figure S1 shows the cell proliferation of human hepatocellular carcinoma cell-line HepG2 after treatment for 24 h by GT-Mix with a series of mass ratios 4:0, 3:1, 2.5:1.5, 2:2, 1.5:2.5, 1:3, 0:4. As shown in Figure S1, the cell viability of HepG2 cells decreased with the increase of the concentration of GA and TAN, indicating that the drugs had a concentration-dependent inhibitory effect on HepG2 cells. When the total drug concentration reached 80 μg/mL, the survival rate of HepG2 cells was 43.9%, 37.9%, 33.4%, 20.5%, 23.3%, 24.5%, 42.2%, respectively. This showed that all samples had a significant inhibition effect on the growth of HepG2 cells, and that the inhibition effect of the combined drugs on the proliferation of HepG2 cells was stronger than that of GA and TNA alone (ie 0:4 and 4:0 of combination proportion). The results indicated that the combination of drugs could enhance the inhibition effect on HepG2 cells, especially when the mass proportion in GT-Mix was 2:2 (1:1). It also showed that the IC50 of GT-Mix with the mass ratio of 1:1 was the smallest (Seen from Table 1). So, it was inferred that the inhibition effect of 1:1 GT-Mix was the strongest among the mass ratios.
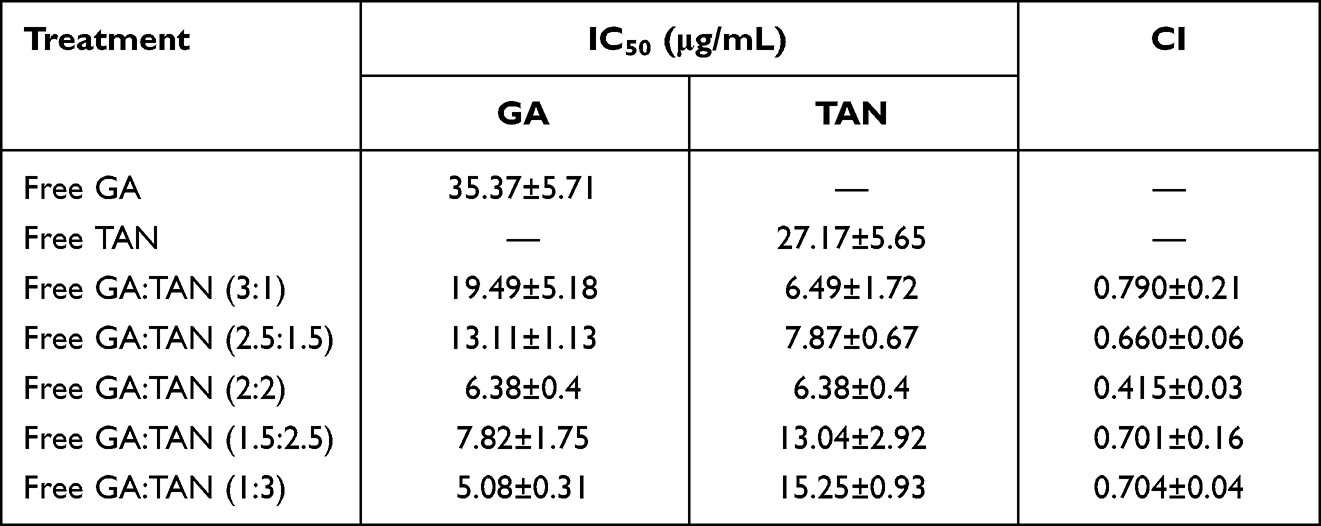 |
Table 1 IC50 and CI Values of HepG2 Treated with Drugs in Different Mass Ratios for 24 h |
Additionally, the synergistic indexes (CI) of the two drugs are shown in Table 1. All the CI values were less than 1, such as 0.790, 0.660, 0.415, 0.701 and 0.704, respectively. This result indicated that the combination drug of GA and TAN had a good synergistic anti-tumor effect. Among them, the CI value was the smallest at the mass ratio of 1:1, indicating the synergistic effect was strongest when GA and TAN were mixed equally.33,34 Therefore, the mass proportion of 1:1 was used as the best combination proportion for the continued study of nanoself-assemblies in vitro and in vivo.
According to the results of pharmacological research on anti-tumor effects of GA and TAN, it can be inferred that the synergistic effects may be derived from their dual effects of promoting caspase-dependent apoptosis and inhibiting cell division and metastasis through different signaling pathways, respectively.35–39 For instance, TAN and GA induce cancer cell apoptosis by activating the caspase-3 and Caspase-8/9 via miR30b-p53-PTPN11/SHP2 and MEK-ERK signaling pathways, respectively.3,10,13 And TAN and GA prevent the proliferation and migration of cancer cells by regulating the expression level of E-cadherin and vimentin in HCC cells via TGF-β and ROS/PKC-α/ERK signaling pathway, respectively.40–43
The Results of Process Optimization
To prepare uniform and stable polymer prodrug micelles, the preparation process was optimized with the central composite design.44 In this study, the different levels of three experimental factors (seen in Table S1) were employed in the central composite design experiments. The particle size (R1) and loading content of two drugs (R2, R3) were used as the responses (dependent variables). The experimental data from Design-Expert 12.0 Software was fitted to different types of models, such as multiple linear equations, quadratic polynomials, and cubic polynomials (shown by Eq. S1~S9 in Supporting Information). The fitting degree of the equation is good if its regression coefficient R-value is close to 1. The cubic polynomial model was found to be optimal to describe the regression coefficients between the change of variables and the subsequent responses, where the complex regression coefficients were 0.9653, 0.9486 and 0.9705, respectively (P<0.05, seen in Eq. S7~S9). Therefore, the fitting cubic polynomial equation was selected as the mathematical model to draw a three-dimensional effect surface diagram, and the results were shown in Figure S2. According to the experimental design results of the central design-effect surface, the appropriate range of evaluation indicators was limited, and the optimized prescriptions and predicted values of each indicator were obtained, such as A=0.2, B=1, C=0.13, R1=177.2nm, R2=6.69%, and R3=6.51%.
Under the optimized conditions, the experimental validation of the proposed model was conducted using three batches of the samples. The particle size, DLC, and EE of three batches of PD@TG-Nanos were shown in Table S3. The results in Table S3 show that the measured values of each index have no obvious difference compared with their predicted values from the central design experiment (Figure S2), which indicated that the mathematical model of cubic polynomial is more predictable.
Particle Size, Morphology, and Loading Property of Nanoself-Assemblies
As shown in Figure 1, PD@TG-Nanos, PD@TAN-Nanos, PD@GA-Nanos, and DCA@TG-Nanos have the particle sizes of about 160–205 nm and near spherical shape. Table 2 shows their polydispersity index (PDI), zeta potential, DLC, and EE, respectively. The small PDI indicates that the size distribution is uniform, and the high negative charge implies that there is a strong repulsive force between the nanoparticles, which will help them maintain good stability. As can be seen from Table 2, all formulations have high DLC and EE, which is conducive to the implementation of follow-up tests. As is well-known, the stability and drug loading property of the nanoparticles is usually related to the physical state of the drug and intermolecular forces between components in nanoparticles.28,45 Therefore, the molecular forces of each component and the crystallization state of the drug would be further investigated in this work.
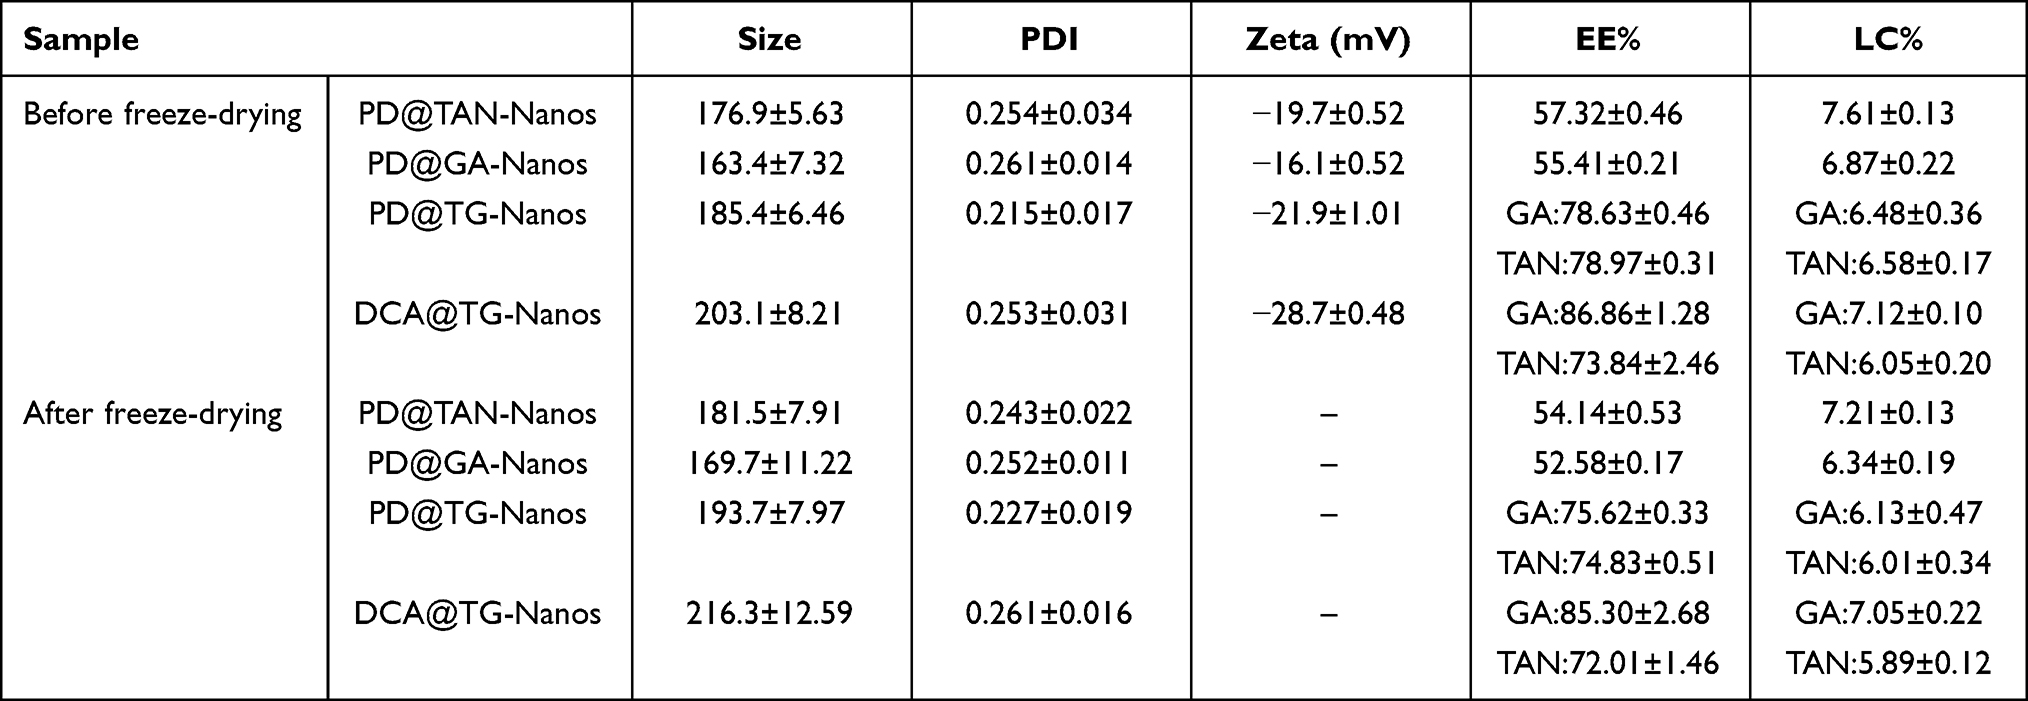 |
Table 2 The Size, PDI, EE, DLC of the Nano-Self assemblies Before and After Freeze Drying (n=3) |
 |
Figure 1 The particle size and morphology of four nanoself-assemblies. (A) PD@TAN-Nanos, (B) PD@GA-Nanos, (C) DCA@TG-Nanos, (D) PD@TG-Nanos. |
The TEM images of PD@TG-Nanos, PD@TAN-Nanos, PD@GA-Nanos, and DCA@TG-Nanos are shown in Figure 1. The nanoself-assemblies are spherical, and the particle size from TEM was about 100 nm, which was slightly smaller than those determined by the dynamic light scattering method, because the dehydration induced the shrinkage of the nanoself-assemblies during the sample preparation for TEM.26
Calculation of Intermolecular Affinity
The docking schematic diagram of GA, TAN and DCA molecules is shown in Figure S3. The binding energies between GA, TAN and DCA were, respectively, −4.01, −8.15 and −5.5 (seen from Table 3), which implied that there were strong forces between the molecules. The strong intermolecular force not only causes the disorderly accumulation of compound molecules (amorphous state) into spheres when they are precipitated out of the solvent, but also facilitates the formation, stability, drug loading and controlled release of nanoself-assemblies.
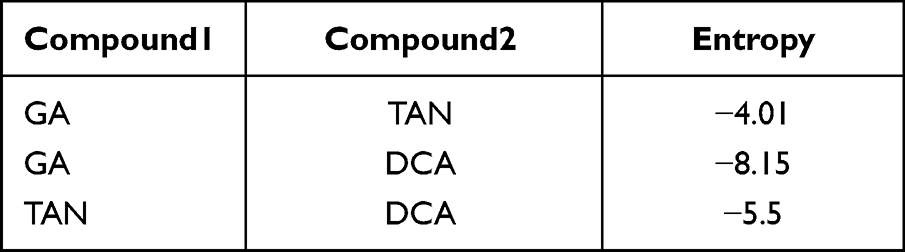 |
Table 3 Prediction of Binding Energy |
Physical State of Drugs
The DSC diagrams of PD@TG-Nanos, PD@TAN-Nanos, PD@GA-Nanos, and DCA@TG-Nanos are shown in Figure 2. The endothermic peaks of GA and TAN were observed at 305.03°C and 218.32°C, while mPEG-DCA and DCA have an endothermic peak at 52.91°C and 178.85°C, respectively. In the graph of physical mixtures, the endothermic peaks of all components did not shift significantly compared with those of single component. However, the endothermic peak of GA and TAN disappeared in the DSC spectra of all the nanoself-assemblies, indicating that the crystal phase transition of the drugs may occur during the formation of nanoself-assemblies and the drugs may exist in the amorphous form. These results confirm the physical state of drugs in nanoself-assemblies inferred from the intermolecular affinity.
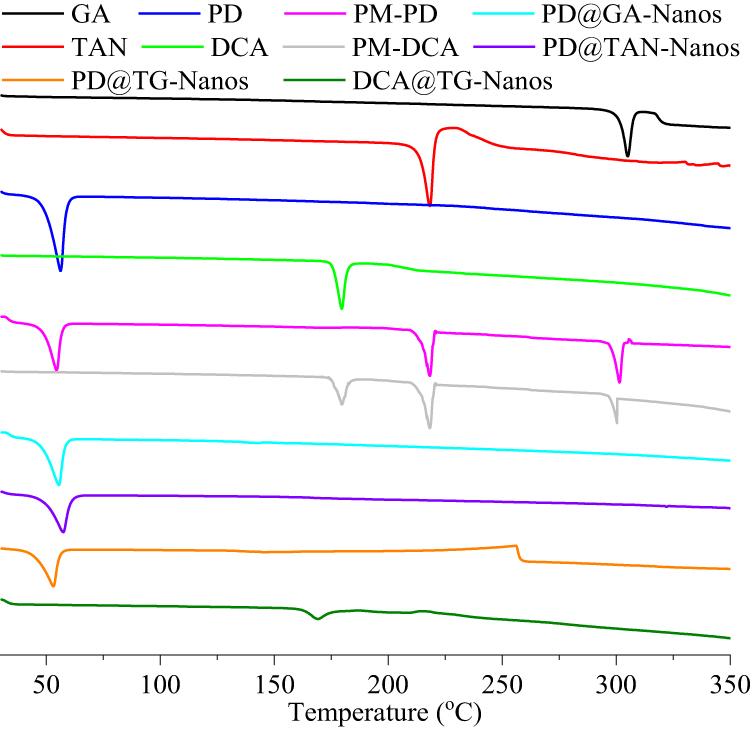 |
Figure 2 The DSC thermogram of nanoself-assemblies. |
Stability of Nanoself-Assemblies
Physical Stability
Figure 3A and B show the storage stability of four formulations at room temperature and 4 °C. The particle size of all formulations hardly changed at room temperature and 4 °C within 20 days. These results clearly show that all nanoself-assemblies had good storage stability over the measured period.
 |
Figure 3 The results of physical stability test in vitro. (A) Dilution stability; (B) Storage stability at room temperature; (C) Storage stability at 4°C; (D) Plasma stability. |
After dilution of 5, 10, 25, 50 and 100 times, the particle size changes of four nanoself-assemblies are shown in Figure 3C. The results showed that the particle sizes of all the formulations increased slightly, but the increase was less than 20 nm, which indicated that several formulations had good dilution stability. This property may help the nanoparticles to remain stable after entering the blood circulation.28,46
As can be seen from Table 2, the mean diameter, PDI, EE and LC of all formulations after lyophilization did not change significantly compared with those prior to lyophilization. This indicates that the freeze-drying process does not affect these pharmaceutical properties of the several formulations, and the freeze-dried powder of all nanoself-assemblies has good re-dispersibility.
Figure 3D displayed the particle size variation of the several formulations after being incubated with rat plasma for 48 hours. It showed that the particle size of DCA@TG-Nanos kept growing during the test, but the particle size of three formulations with PEG-DCA as carriers increased slightly (<30 nm) for the first 10 h after adding plasma and then remained unchanged. The corresponding blank nanoself-assemblies showed similar plasma stability. We inferred that these results were related to the ability of the two carrier materials to adsorb plasma proteins. In other words, the increase in the dimension of DCA-containing formulations may be due to the easy adsorption of plasma protein by DCA, while the stable particle size of the PEG-DCA-containing formulations should be due to the strong hydrophilicity of PEG chain, which makes it difficult to adsorb plasma protein. So, the protein adsorption test should be carried out to investigate whether the increase in particle size in plasma was related to the adsorption of proteins in plasma or not.
Chemical Stability of Drugs
During the four nanoself-assemblies and two free drug solutions were incubated for 8 h at high temperatures (80 °C), the trend of drug content change is shown in Figure 4A and B. Drug content in free TAN and GA solutions decreased rapidly, especially with only 15% TAN remaining in the TAN solution after incubation for 2 h, suggesting that both drugs are unstable in solution at high temperatures. However, the decreased rate of drug content slows down obviously for the nanoself-assemblies, indicating that the degradation rate of drugs was slow in these formulations. After 2 h of incubation, the contents of TAN in the nanoself-assemblies were above 50%, which is more than three times that in solution. After 8 h of incubation, the contents of TAN and GA in the nanoself-assemblies were still above 20% and 58%, respectively. These results suggested that the nanoself-assemblies could effectively protect the chemical structures of two drugs. Another, the drug degradation rate of mPEG-DCA nanoself-assemblies was significantly slower than that of DCA, which may be due to the insulating effect of the hydration layer formed by the PEG chain on the surfaces of mPEG-DCA nanoself-assemblies.
 |
Figure 4 The results of chemical stability test in vitro. (A) The thermal stability of TAN in the different formulations, (B) The thermal stability of GA in the different formulations, (C) The photostability of TAN in the different formulations, (D) The photostability of GA in the different formulations, (E) The pH stability of TAN in the different formulations, (F) The pH stability of GA in the different formulations. |
Figure 4C and D showed the drug content change with time during the several formulations that were illuminated. It is seen from Figure 4C and D that drug present content in free TAN and GA solutions declined rapidly during the incubation for 8 h, suggesting that both drugs are unstable in solution under the strong light. We also found that the drug contents in DCA@TG-Nanos were higher than those in free drug solution, which the drug degradation was slower in DCA@TG-Nanos than that in the solution. More excitingly, the content of two drugs in nanoself-assemblies containing PEG-DCA remained above 80% after bright-light exposure for 8 h. These results indicate that nanoself-assemblies can reduce light degradation of drugs, and nanoself-assemblies containing PEG-DCA had stronger protective effect on drugs.
As pH has been reported to be the most important factor affecting the chemical structure of TAN and GA, the stability study of TAN and GA was carried out at different pH values. The content percentage of the TAN and GA in solution and nanoself-assemblies in pH 6.8 PBS is shown in Figure 4E and F. We found that the degradation of TAN and GA in the solution was greatly increased with an increase in incubating time in the pH 6.8 environments as indicated by the lower percentage of TAN and GA remained, such as only 48.07% of TAN and 60.97% of GA, respectively. Although two drugs in DCA@TG-Nanos also degraded a lot, that of DCA@TG-Nanos was better than the solution, indicating that nanoself-assembly delivery system was more effective than the solution in protecting the chemical structure of the two drugs. Fortunately, the above 80% of TAN and GA in the nanoself-assemblies containing PEG-DCA were left even after incubation for 8 h in pH 6.8 PBS, clearly demonstrating the superiority of nanoself-assemblies containing PEG-DCA to the DCA@TG-Nanos and the drug solution in terms of stability.
Protein Adsorption and Hemolysis
In view of the increase in particle size of all formulations after co-incubation with plasma, the protein adsorption test was carried out by the Coomassie brilliant blue method. These experimental results are shown in Figure S4. Compared with the blank group, the absorbances of the nanoself-assembly samples were higher significantly, confirming that protein adsorption occurred when the nanoself-assemblies were incubated with plasma. Figure S4A showed the absorbance of the nanoself-assembly sample as a function of time. It can be seen that the absorbance was time-dependent and increased significantly with time in DCA and DCA@TG-Nanos samples. However, the absorbance of other samples did not change significantly with time. These results explain why the particle size increased at first for all formulation, and then the particle size change of the formulations containing mPEG-DCA showed different trend compared with those of the formulations containing DCA, which is due to that mPEG in the formulations containing mPEG-DCA can effectively decrease the adsorption of proteins. Similar results were found in the absorbance assay after the nanoself-assemblies were incubated with different concentrations of plasma (seen from Figure S4B), which again confirmed that all nanoself-assemblies can adsorb a small amount of protein after exposure to plasma, and the mPEG in some formulations can reduce the adsorption of protein by nanoparticles.
In this study, hemolysis was not observed after the several formulations were incubated with rat blood for 2 h (as shown in Figure S5A). When the hemolysis ratios are lower than the maximum value (5%) for the medical device requested by FDA,47,48 the nanoparticles are considered to have good hemocompatibility. The hemolysis rates calculated by the absorbance were less than 2% even for the highest concentration of all nanoself-assemblies (0.5 mg/mL as shown in Figure S5B), which indicates that all nanoself-assemblies did not contribute to RBC membrane-related toxicity. Based on these results, it seems that all of the PTX micelles had good blood compatibility.
Drug Release Behavior in vitro
The drug release profiles were investigated in the release medium with 0.01 M PBS (pH 7.4) containing 0.5% Tween 80 (W/V) at 37°C (Figure 5A and B). It can be seen from Figure 5A and B that the cumulative release ratios of TAN and GA from free drug solutions within 48 h were 96.08% and 97.89%, respectively. Drug releases from the DCA@TG-Nanos were noticeably slowed down, and about 86.41% of TAN and 88.40% of GA were released within 48 h, respectively. While the drug release rates became even slower in the PD@TG-Nanos, PD@TAN-Nanos, PD@GA-Nanos, and the cumulative release ratios of TAN and GA were, respectively, lower than 50% and 60% within 48 h. These results indicated that the nanoself-assemblies could control the drug release rates in the medium, and the nanoself-assemblies containing mPEG-DCA could significantly slow down drug release than DCA@TG-Nanos. This is mainly because of the strong molecular forces between the carriers (DCA and mPEG-DCA) and the drugs (shown in Table 3), and the polyethylene glycol in mPEG-DCA has a long hydrophilic chain, which can form a hydration layer on the surface of nanoparticles to effectively slow down the release of drugs. We also found that the release rates of TAN and GA in PD@TG-Nanos were not obviously different compared with PD@TAN-Nanos and PD@GA-Nanos, which be attributed to the strong molecular forces between each other among DCA in mPEG-DCA and two drugs. In addition, the similar release profiles of TAN and GA in PD@TG-Nanos and DCA@TG-Nanos indicated that they could be released synchronously from the co-loaded nanoself-assemblies, which implied that the co-delivery nano-system provided a possibility for their synergistic effect.49
 |
Figure 5 TAN release curves from the nanoself-assemblies (A); GA release curves from the nanoself-assemblies (B); In vitro cytotoxicity of the nanoself-assemblies on human normal liver cell line HL-7702 and human hepatoma cell line HepG2 for 24 h (C and E) and 48 h (D and F); The error bars was calculated from the data of three repetitions. |
Cytotoxicity Test
As shown in Figure 5C and D, the survival rates of normal liver cells 7702 still reach more than 80.0% after treatment with formulations of different concentrations for 24 h and 48 h, which indicated that the mPEG-DCA, DCA and several nanoself-assemblies had little inhibition effect on normal cells and good biocompatibility at the experimental concentrations.50
Figure 5E and F display the inhibiting effect of several drug-loaded formulations on the growth of HepG2 cells for 24 h and 48 h. Here, the cell survival rate decreased with an increase of concentration for each formulation, indicating that their anti-tumor effects were concentration dependent. The cells treated with four nanoself-assemblies showed lower survival rate compared with those of free TAN and GA solutions, which suggested that nanoself-assemblies had stronger inhibitory effect on cell growth than free drug solution. Among the four nanoself-assemblies, PD@TG-Nanos and DCA@TG-Nanos showed a more significant inhibitory effect on the growth of HepG2 cells compared to PD@TAN-Nanos and PD@GA-Nanos. Based on these results, it can be inferred that the combination of TAN and GA brought out significantly synergistic inhibition effect on the proliferation of tumor cells for the nanoself-assemblies co-loaded with drugs, which was explained by the optimization results of drug combination ratio. Strikingly, PD@TG-Nanos showed a stronger inhibitory effect on tumor cell growth than DCA@TG-Nanos, possibly attributed to good chemical stability and slow drug release of PD@TG-Nanos being more favourable for cellular uptake.
Cell Uptake Assay
The results of the uptake ratio of drug solutions and nano-formulations by HepG2 cells are shown in Table 2 and Figure S6. It can be seen from the Figure S6 that the uptake ratios of drugs by HepG2 cells increased in a time-dependent manner in all the tested groups. At 12 h, the uptake ratios of free TAN and GA solution were only 27.26% and 29.90%, and the drug uptake ratios increased to 34.42% and 37.43% for PD@TAN-Nanos and PD@GA-Nanos. The uptake ratios of PD@TG-Nanos and DCA@TG-Nanos at 12 h were over 40%. It was inferred that nanoself-assemblies could promote drug uptake by cells (P<0.05 or P<0.01), and the promoting effect of PD@TG-Nanos was slightly stronger than that of DCA@TG-Nanos (P<0.05). These results explained the differences in the inhibitory effects of various formulations on tumor cells. And, it was found that two drugs in PD@TG-Nanos and DCA@TG-Nanos had the similar uptake ratio, which helps them to achieve a synergistic effect on antitumor.
In vivo Performance
As shown in Figure 6, the biodistribution of two drugs was significantly influenced by the nanoself-assembly formulations. Firstly, the TAN and GA solution displayed high concentrations in various tissues at 2 h after administration and was quickly eliminated from all the tissues thereafter, which indicated that the TAN and GA solution is rapidly distributed and eliminated in vivo. Compared with free drug solutions, all nanoself-assemblies accumulated more in the liver and tumor region after 2h of drug administration, even at 24h, which could be attributed to the liver targeting effect of DCA and mPEG-DCA and the EPR effect of nano-formulations. In addition, it can be seen from the figure that PD@TG-Nanos has the largest accumulation in tumor among all the nanoself-assemblies. Compared with DCA@TG-Nanos, the higher accumulation of PD@TG-Nanos in tumor was mainly due to the long circulating effect of mPEG, controlled drug release and higher cellular uptake ratio. And, the high cellular uptake ratio also explains the differences in the accumulation of PD@TG-Nanos with PD@TAN-Nanos and PD@GA-Nanos in the tumor. These results suggested that PD@TG-Nanos would provide an exciting tumor penetration, retention capability and anti-tumor effect. In addition, it was found that the concentration of GA and TAN in the livers and the lungs for free drug groups was higher than that in other normal tissues in the first 4 hours, and the concentration of GA and TAN in the lungs was highest in all the tested tissues at 24 h for free drug groups. Previous reports have shown that GA-specific receptors are expressed on hepatocytes (Stecanella et al 2021), which may be related to the fast accumulation of GA in the livers. However, it is not clear whether GA’s accumulation in other organs, including the lung51 and the colon,52 is associated with the GA-receptors. Whether the distribution of free TAN in various tissues is related to its physicochemical properties and receptors has not been reported so far, which needs to be further studied.
 |
Figure 6 Tissue distributions of TAN (A) and GA (B) in the primary organs and tumor tissues after I.V. administration with the nanoself-assemblies at 15 mg/kg (n=10). |
The mean plasma-concentration profiles of two drugs over time for three formulations were shown in Figure 7A, and the primary pharmacokinetic parameters for these formulations were calculated by noncompartmental models with DAS2.0 (seen in Table 4). As shown in Figure 7A, while the plasma concentrations of TAN and GA were still detectable at 8 h or 12 h after administration for the nanoself-assemblies, the plasma concentrations of two drugs were close to the quantification limit at 4 h for the free drug solutions. The values of all the pharmacokinetic parameters for the nanoself-assemblies were significantly different from those for the drug solutions (Table 4). For example, the AUC0-∞ of two drugs for the nanoself-assemblies were approximately 2.54~6.49-fold greater than those for the free drug solutions, and the mean residence time (MRT0-∞) and plasma half-life (T1/2) were nearly several-fold longer for the nanoself-assemblies in comparison to free drug solutions. Thus, it was clear that the nanoself-assemblies maintained relatively higher plasma concentration and longer exposure than free drug solutions, especially significant for nanoself-assemblies containing mPEG-DCA. These results could be made clear by the controlled drug release induced by the strong molecular forces between the carriers and the drugs (shown in Table 3 and Figure S3), and confirmed the hypothesis that PEGylated nanocarriers can create a highly water-bound barrier around the drug particle, which prevents rapid drug elimination, prolongs circulation half-life, and enhances the EPR effect.53–55 The long-circulation effect of PEG chains offers longer duration of exposure and further enhances passive drug targeting to tumor tissues.56–58 For DCA@TG-Nanos, the long MRT0-∞ in rats could be attributed to the controlled drug release and the fact that its targeted uptake by the liver can serve as a drug reservoir to slowly release the drug into the systemic circulation.59 In addition, the pharmacokinetics curves and parameters of TAN and GA in PD@TG-Nanos and DCA@TG-Nanos indicated that the co-loading two active ingredients have synchronous performance in vivo, which was as much a prerequisite for synergy as their similar release behavior and cellular uptake ratios.60,61
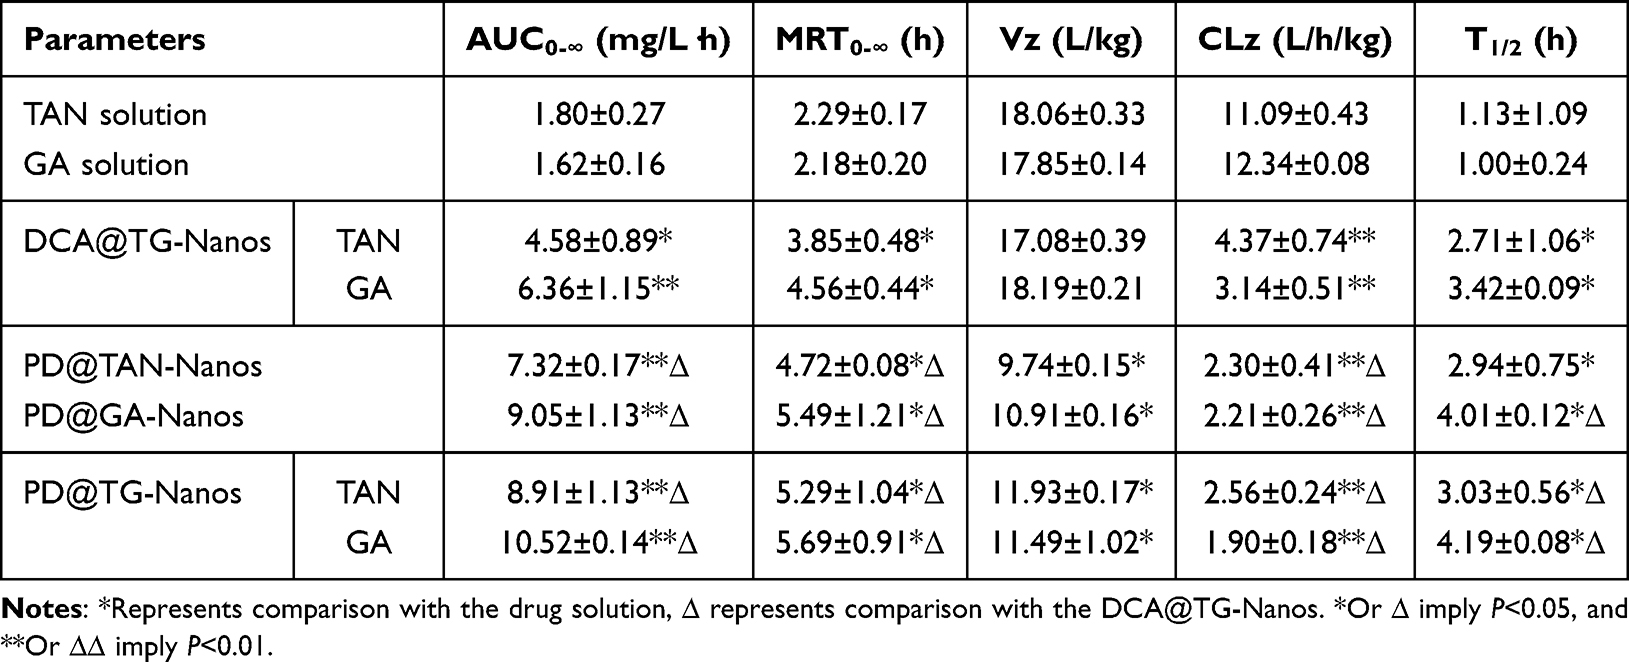 |
Table 4 Main Pharmacokinetic Parameters of TAN Injection and Its Preparations |
 |
Figure 7 (A) Mean plasma concentration vs time curves of various formulations after I.V. administration at 15 mg/kg. Data are expressed as the mean±s.d. (n=5). (B) Tumor growth inhibition curves (n=18), *P<0.05, **P<0.01, ***P<0.001. (C) Body weights of mice bearing H22 tumors after different treatments for 14 days (n=18), *P<0.05. (D) The curve of mice survival for 14 days. |
In vivo Antitumor Activity
The evaluation of in vivo anti-tumor was carried out in H22 tumor xenograft mice for two drug solutions and four nanoself-assemblies. Figure 7B showed the change curves of tumor volume in mice within 14 days after administration. The tumor grew rapidly in the saline group and the tumor volume was significantly larger than that in other groups after administration by 7 times. Compared with that of the saline group, the tumor volume in all the drug formulation groups decreased significantly. The increase of tumor volume in PD@TAN-Nanos group and PD@GA-Nanos group were less than that of GA solution and TAN solution groups, indicating that tumor development was more obviously inhibited by the nanoself-assemblies than free drug solutions (P<0.05) apparently due to the prolonged circulation time and high accumulation in tumor. Additionally, the change of tumor volume in PD@TG-Nanos group and DCA@TG-Nanos group were smaller than that of PD@TAN-Nanos and PD@GA-Nanos, suggesting the drug co-loaded nanoself-assemblies had better tumor inhibition effect than the single drug loaded nanoself-assemblies, which may be due to the synergistic effect of TAN and GA. Among all groups, the change of tumor volume in PD@TG-Nanos group was smallest, which indicated the inhibition effect of PD@TG-Nanos was strongest. The result may be attributed to the fact that mPEG-DCA can control the release of drugs, prolong the circulation time, and improve the drug accumulation in tumor (EPR effect). The tumor inhibition ratios were calculated by comparing the average tumor weight of the drug treatment groups to that of the saline group after the treatment (Figure S7). The tumor inhibition ratios were, respectively, 37.45, 31.02, 46.45%, 49.19%, 60.41% and 63.30% for GA solution, TAN solution, PD@GA-Nanos, PD@TAN-Nanos, DCA@TG-Nanos and PD@TG-Nanos, suggesting better antitumor activity of the PD@TG-Nanos compared with that in the other drug test groups.
Biosafety Analysis
Figure 7C shows the body weight changes of tumor-bearing mice after intermittent administration for 14 days. As shown in Figure 7C, the body weights of the mice increased significantly for the saline group, which could be attributed to the normal growth of mice and the increase of tumor volume.62 Compared to the saline group, the body weights of two drug solution groups increased much less (P<0.05) due to the inhibited tumor growth. The body weight of mice in the PD@TAN-Nanos and PD@GA-Nanos groups was well controlled, which may be due to better inhibition of tumor volume compared with drug solutions. For the groups treated with PD@TG-Nanos and DCA@TG-Nanos, the lowest fluctuation of body weight might be attributed to the fact that the drug co-loaded nanoself-assemblies exhibited strongest antitumor activities and had best effects on the health of the mice, which were consistent with these results of cytotoxicity tests. Figure 7D showed the survival curves of tumor-bearing mice in various test groups within 14 days. A 60% of mice survived in the saline group, 70% in two drug solution groups. The survival rates of mice injected with PD@TAN-Nanos, PD@GA-Nanos and DCA@TG-Nanos were 90%, 90% and 80%, respectively. However, the survival rate of the PD@TG-Nanos group reached 100%. From comparison of the weight change and survival rate among different test groups, it can be inferred that the evaluation of body weight change and survival rate may not accurately reflect whether the drug has systemic toxicity.
The images of primary organ slices stained by hematoxylin–eosin (H&E) are shown in Figure 8. No obvious abnormalities were observed in the slices of the heart, liver, and kidney for all test groups. These results suggest that all the test formulations had not obvious side effects. As can be seen from histological images of H22 tumor slices, all the groups except the saline group showed different levels of nuclear lysis changes, especially serious in PD@TG-Nanos group, which was characterized by the obvious fragments. This indicated that TAN and GA in PD@TG-Nanos have a strong synergistic effect on the inhibition of malignant proliferation, which is consistent with the anti-tumor effect in vivo.
 |
Figure 8 H&E analyses of the main organs and tumor tissues after treatment with various formulations. The scale bar represents 250 μm in the H&E images. |
Conclusion
In this paper, based on the TCM theory of liver disease treatment and the modern pharmacology of TCM, TAN and GA were selected as model drugs to study the synergistic effect of the combination of natural monomeric compounds on inhibiting tumor growth. Firstly, the antitumor synergistic ratio of the two drugs was optimized by MTT assay in vitro, and the nanoself-assemblies were prepared by solvent evaporation method. The pharmaceutical study confirmed that all the nanoself-assemblies had a particle size of about 160–205 nm, quasi-spherical morphology and good physical and chemical stability. In the in vitro release assay, the nanoself-assemblies exhibited controlled drug release. The cytotoxicity test in vitro showed that mPEG-DCA, DCA and several nanoself-assemblies had little inhibition effect on normal cells and had good biocompatibility at the experimental concentrations. And, PD@TG-Nanos and DCA@TG-Nanos showed a stronger inhibitory effect on tumor cell growth than other drug formulations. The results of in vivo performance study showed that all the nanoself-assemblies could prolong the MRT0-∞, and increase the exposure in blood and the accumulation in tumor and liver tissues. The studies on anti-tumor activity in mice had confirmed that the drug co-loaded nanoself-assemblies showed strong anti-tumor activity, especially PD@TG-Nanos, indicating that drug co-loaded nanoself-assemblies had a good synergistic effect on inhibiting tumor growth. Therefore, it may have potential application prospects to manufacture a nanoself-assembly co-loading natural active ingredients under the guidance of traditional Chinese medicine theory for the treatment of tumors or other diseases. However, some related work of this topic needs to be further explored in the future, such as the distribution mechanism of free GA and TAN in vivo, the factors on the pharmacokinetics and tissue distribution of GA and TAN in vivo affected by nanoself-assemblies, the relationship between their anti-tumor and anti-inflammatory effect, and the synergistic anti-tumor mechanism. In particular, the study on their anti-tumor effect and synergistic mechanism needs to be explored as our special topic in the future.
Data Sharing Statement
The data in our manuscript and supporting information are available.
Acknowledgments
We are grateful for financial support from the National Natural Science Foundation of China (No. U1904155), Natural Science Foundation of Jilin Province (20210101033JC), Kaifeng Science and Technology Development Plan Project and the Key Project of Science (No. 1903034, No. 1908006). We also thank Dr. Jing Ma (Department of Pharmacology, College of Pharmacy, Henan University) for her assistance about the discussion on the anti-tumor mechanism during the re-submission of this manuscript.
Author Contributions
All authors made a significant contribution to the work reported, whether that is in the conception, study design, execution, acquisition of data, analysis and interpretation, or in all these areas; took part in drafting, revising or critically reviewing the article; gave final approval of the version to be published; have agreed on the journal to which the article has been submitted; and agree to be accountable for all aspects of the work.
Disclosure
The authors report no conflicts of interest in this work.
References
1. Wang S, Huang Y, Hu W, et al. Detachable string magnetically controlled capsule endoscopy for detecting high-risk varices in compensated advanced chronic liver disease (CHESS1801): a prospective multicenter study. Lancet Region Health. 2021;6:100072. doi:10.1016/j.lanwpc.2020.100072
2. Yang R, Wang LQ, Yuan BC, Liu Y. The pharmacological activities of licorice. Planta Med. 2015;81:1654–1669. doi:10.1055/s-0035-1557893
3. Li Z, Zou J, Cao D, Ma X. Pharmacological basis of tanshinone and new insights into tanshinone as a multitarget natural product for multifaceted diseases. Biomed Pharmacother. 2020;130:110599. doi:10.1016/j.biopha.2020.110599
4. Subedi L, Gaire BP. Tanshinone IIA: a phytochemical as a promising drug candidate for neurodegenerative diseases. Pharmacol Res. 2021;169:105661. doi:10.1016/j.phrs.2021.105661
5. Wang ZY, Nixon DW. Licorice and cancer. Nutr Cancer. 2001;39:1–11. doi:10.1207/S15327914nc391_1
6. Wang D, Yu W, Cao L, et al. Comparative pharmacokinetics and tissue distribution of cryptotanshinone, tanshinone IIA, dihydrotanshinone I, and tanshinone I after oral administration of pure tanshinones and liposoluble extract of Salvia miltiorrhiza to rats. Biopharm Drug Dispos. 2020;41:54–63. doi:10.1002/bdd.2213
7. Shen C, Zhu J, Song J, Shen B, Yuan H, Li X. Formulation of pluronic F127/TPGS mixed micelles to improve the oral absorption of glycyrrhizic acid. Drug Dev Ind Pharm. 2020;46:1100–1107. doi:10.1080/03639045.2020.1775634
8. Nazari S, Rameshrad M, Hosseinzadeh H. Toxicological effects of Glycyrrhiza glabra (licorice). Phytother Res. 2017;31:1635–1650. doi:10.1002/ptr.5893
9. Ashour AA, El-Kamel AH, Abdelmonsif DA, Khalifa HM, Ramadan AA. Modified lipid nanocapsules for targeted tanshinone IIA delivery in liver fibrosis. Int J Nanomed. 2021;16:8013–8033. doi:10.2147/IJN.S331690
10. Li H, Hu P, Zou Y, et al. Tanshinone IIA and hepatocellular carcinoma: a potential therapeutic drug. Front Oncol. 2023;13:1071415. doi:10.3389/fonc.2023.1071415
11. Liu YW, Huang YT. Inhibitory effect of tanshinone IIA on rat hepatic stellate cells. PLoS One. 2014;9:e103229. doi:10.1371/journal.pone.0103229
12. Sun X, Tan Y, Lyu J, Liu HL, Zhao ZM, Liu CH. Active components formulation developed from Fuzheng Huayu recipe for anti-liver fibrosis. Chin J Integr Med. 2022;28:538–544. doi:10.1007/s11655-021-3293-x
13. Tang ZH, Li T, Chang LL, et al. Glycyrrhetinic acid triggers a protective autophagy by activation of extracellular regulated protein kinases in hepatocellular carcinoma cells. J Agric Food Chem. 2014;62:11910–11916. doi:10.1021/jf503968k
14. Wang X-F, Zhou Q-M, Lu -Y-Y, Zhang H, Huang S, Su B. Glycyrrhetinic acid potently suppresses breast cancer invasion and metastasis by impairing the p38 MAPK-AP1 signaling axis. Expert Opin Ther Targets. 2015;19:577–587. doi:10.1517/14728222.2015.1012156
15. Huang RY, Chu YL, Huang QC, Chen XM, Jiang ZB, Zhang X. 18beta-glycyrrhetinic acid suppresses cell proliferation through inhibiting thromboxane synthase in non-small cell lung cancer. PLoS One. 2014;9:e93690. doi:10.1371/journal.pone.0093690
16. Wang S, Shen Y, Qiu R, Chen W, Chen W, Chen W. 18 beta-glycyrrhetinic acid exhibits potent antitumor effects against colorectal cancer via inhibition of cell proliferation and migration. Int J Oncol. 2017;51:615–624. doi:10.3892/ijo.2017.4059
17. Wang W, Lei Y, Sui H, et al. Fabrication and evaluation of nanoparticle-assembled BSA microparticles for enhanced liver delivery of glycyrrhetinic acid. Artif Cells Nanomed Biotechnol. 2017;45:740–747. doi:10.1080/21691401.2016.1193024
18. Wolfram RK, Heller L, Csuk R. Targeting mitochondria: esters of rhodamine B with triterpenoids are mitocanic triggers of apoptosis. Eur J Med Chem. 2018;152:21–30. doi:10.1016/j.ejmech.2018.04.031
19. Sun G, Sun J, Sun J. Combination prostate cancer therapy: prostate-specific membranes antigen targeted, pH-sensitive nanoparticles loaded with doxorubicin and tanshinone. Drug Deliv. 2021;28:1132–1140. doi:10.1080/10717544.2021.1931559
20. Chu T, Zhang Q, Li H, et al. Development of intravenous lipid emulsion of tanshinone IIA and evaluation of its anti-hepatoma activity in vitro. Int J Pharm. 2012;424:76–88. doi:10.1016/j.ijpharm.2011.12.049
21. Chen F, Zhang J, He Y, Fang X, Wang Y, Chen M. Glycyrrhetinic acid-decorated and reduction-sensitive micelles to enhance the bioavailability and anti-hepatocellular carcinoma efficacy of tanshinone IIA. Biomater Sci. 2016;4:167–182. doi:10.1039/C5BM00224A
22. Zong L, Wang H, Hou X, et al. A novel GSH-triggered polymeric nanomicelles for reversing MDR and enhancing antitumor efficiency of hydroxycamptothecin. Int J Pharm. 2021;600:120528. doi:10.1016/j.ijpharm.2021.120528
23. Pártay LB, Sega M, Jedlovszky P. Morphology of bile salt micelles as studied by computer simulation methods. Langmuir. 2007;23:12322–12328. doi:10.1021/la701749u
24. Zeng M, Xue Y, Zeng M-H, Zeng M-H, Zeng M-H, Zeng M-H. CuBr-promoted domino Biginelli reaction for the diastereoselective synthesis of bridged polyheterocycles: mechanism studies and in vitro anti-tumor activities. Chin Chem Lett. 2022;33:4891–4895. doi:10.1016/j.cclet.2022.02.075
25. Wu H, Huang C, Wang L, et al. Folate-targeted co-delivery polymersomes for efficient photo-chemo-antiangiogenic therapy against breast cancer and in vivo evaluation via OCTA/NIRF dual-modal imaging. Chin Chem Lett. 2022;33:5035–5041. doi:10.1016/j.cclet.2022.04.021
26. Zheng P, Liu Y, Chen J, Xu W, Li G, Ding J. Targeted pH-responsive polyion complex micelle for controlled intracellular drug delivery. Chin Chem Lett. 2020;31:1178–1182. doi:10.1016/j.cclet.2019.12.001
27. Jin R, Liu Z, Liu T, Yuan P, Bai Y, Chen X. Redox-responsive micelles integrating catalytic nanomedicine and selective chemotherapy for effective tumor treatment. Chin Chem Lett. 2021;32:3076–3082. doi:10.1016/j.cclet.2021.03.084
28. Qiao Y, Wei Z, Qin T, et al. Combined nanosuspensions from two natural active ingredients for cancer therapy with reduced side effects. Chin Chem Lett. 2021;32:2877–2881. doi:10.1016/j.cclet.2021.03.049
29. He M, Yu L, Yang Y, et al. Delivery of triptolide with reduction-sensitive polymer nanoparticles for liver cancer therapy on patient-derived xenografts models. Chin Chem Lett. 2020;31:3178–3182. doi:10.1016/j.cclet.2020.05.034
30. Wang Y, Wang X, Zhang J, et al. Gambogic acid-encapsulated polymeric micelles improved therapeutic effects on pancreatic cancer. Chin Chem Lett. 2019;30:885–888. doi:10.1016/j.cclet.2019.02.018
31. Bitencourt-Ferreira G, Pintro VO, de Azevedo X. Docking with AutoDock4. Methods Mol Biol. 2019;2019:125–148.
32. Pu X, Zhao L, Li J, et al. A polymeric micelle with an endosomal pH-sensitivity for intracellular delivery and enhanced antitumor efficacy of hydroxycamptothecin. Acta Biomater. 2019;88:357–369. doi:10.1016/j.actbio.2019.02.039
33. Cao H, Ma R, Chu S, Xi J, Yu L, Guo R. Synergistic effect of T80/B30 vesicles and T80/PN320 mixed micelles with Se/C on nasal mucosal immunity. Chin Chem Lett. 2021;32:2761–2764. doi:10.1016/j.cclet.2021.03.029
34. Pu X, Zhou X, Huang Z, Yin G, Chen X. Fabrication of extracellular matrix-coated conductive polypyrrole-poly(l-lactide) fiber-films and their synergistic effect with (nerve growth factor)/(epidermal growth factor) on neurites growth. Chin Chem Lett. 2020;31:1141–1146. doi:10.1016/j.cclet.2019.07.002
35. Yunchu Z, Tingting L, Yihong H, Jing C, Xiang G, Yan Z. Co-delivery of doxorubicin and curcumin via cRGD-peptide modified PEG-PLA self-assembly nanomicelles for lung cancer therapy. Chin Chem Lett. 2022;33:2507–2511. doi:10.1016/j.cclet.2021.11.076
36. Lan M, Chunlai N, Rangrang F, et al. Facile construction of targeted pH-responsive DNA-conjugated gold nanoparticles for synergistic photothermal-chemotherapy. Chin Chem Lett. 2021;32:1775–1779. doi:10.1016/j.cclet.2020.12.058
37. Shan L, Chao J, Peng H, et al. Mild hyperthermia-enhanced chemo-photothermal synergistic therapy using doxorubicin-loaded gold nanovesicles. Chin Chem Lett. 2021;32:2411–2414. doi:10.1016/j.cclet.2021.03.080
38. Chenyu G, Jun W, Bo L, et al. Bioactive gelatin cryogels with BMP-2 biomimetic peptide and VEGF: a potential scaffold for synergistically induced osteogenesis. Chin Chem Lett. 2022;33:1956–1962. doi:10.1016/j.cclet.2021.10.070
39. Bengang X, Shuang L, Fan J, et al. Tumor microenvironment-responsive MnSiO3-Pt@BSA-Ce6 nanoplatform for synergistic catalysis-enhanced sonodynamic and chemodynamic cancer therapy. Chin Chem Lett. 2022;33:2959–2964. doi:10.1016/j.cclet.2021.12.096
40. Ma L, Jiang H, Xu X, et al. Tanshinone IIA mediates SMAD7-YAP interaction to inhibit liver cancer growth by inactivating the transforming growth factor beta signaling pathway. Aging. 2019;11:9719–9737. doi:10.18632/aging.102420
41. Cai H, Chen X, Zhang J, Wang J. 18beta-glycyrrhetinic acid inhibits migration and invasion of human gastric cancer cells via the ROS/PKC-alpha/ERK pathway. J Nat Med. 2018;72:252–259. doi:10.1007/s11418-017-1145-y
42. Yuan L, Yang Y, Li X, et al. 18beta-glycyrrhetinic acid regulates mitochondrial ribosomal protein L35-associated apoptosis signaling pathways to inhibit proliferation of gastric carcinoma cells. World J Gastroenterol. 2022;28:2437–2456. doi:10.3748/wjg.v28.i22.2437
43. Irshad R, Raj N, Gabr GA, Manzoor N, Husain M. Integrated network pharmacology and experimental analysis unveil multi-targeted effect of 18alpha- glycyrrhetinic acid against non-small cell lung cancer. Front Pharmacol. 2022;13:1018974. doi:10.3389/fphar.2022.1018974
44. Du J, Zong L, Li M, et al. Two-pronged anti-tumor therapy by a new polymer-paclitaxel conjugate micelle with an anti-multidrug resistance effect. Int J Nanomed. 2022;17:1323–1341. doi:10.2147/IJN.S348598
45. Kojo Y, Matsunaga S, Suzuki H, Onoue S, Onoue S, Onoue S. Improved oral absorption profile of itraconazole in hypochlorhydria by self-micellizing solid dispersion approach. Eur J Pharm Sci. 2017;97:55–61. doi:10.1016/j.ejps.2016.10.032
46. Zong L, Li X, Wang H, et al. Formulation and characterization of biocompatible and stable I.V. itraconazole nanosuspensions stabilized by a new stabilizer polyethylene glycol-poly(beta-Benzyl-l-aspartate) (PEG-PBLA). Int J Pharm. 2017;531:108–117. doi:10.1016/j.ijpharm.2017.08.082
47. Liu MC, Liu B, Sun XY, et al. Core/shell structured Fe(3)O(4)@TiO(2)-DNM nanospheres as multifunctional anticancer platform: chemotherapy and photodynamic therapy research. J Nanosci Nanotechnol. 2018;18:4445–4456. doi:10.1166/jnn.2018.15338
48. Yang X, Cai X, Yu A, Xi Y, Zhai G. Redox-sensitive self-assembled nanoparticles based on alpha-tocopherol succinate-modified heparin for intracellular delivery of paclitaxel. J Colloid Interface Sci. 2017;496:311–326. doi:10.1016/j.jcis.2017.02.033
49. Wang H, Zhao Y, Wu Y, Nan K, Nie G, Chen H. Enhanced anti-tumor efficacy by co-delivery of doxorubicin and paclitaxel with amphiphilic methoxy PEG-PLGA copolymer nanoparticles. Biomaterials. 2011;32:8281–8290. doi:10.1016/j.biomaterials.2011.07.032
50. Fu X, Zhang G, Zhang Y, Sun H, Yang S, Cui J. Co-delivery of anticancer drugs and cell penetrating peptides for improved cancer therapy. Chin Chem Lett. 2021;32:1559–1562. doi:10.1016/j.cclet.2020.10.011
51. Cao M, Zuo J, Yang G, et al. Physiology-based pharmacokinetic study on 18β-glycyrrhetic acid mono-glucuronide (GAMG) prior to glycyrrhizin in rats. Molecules. 2022;27:4657. doi:10.3390/molecules27144657
52. Lu JZ, Hong DD, Ye D, et al. Tissue distribution and integrated pharmacokinetic properties of major effective constituents of oral Gegen-Qinlian decoction in mice. Front Pharmacol. 2022;13. doi:10.3389/fphar.2022.996143
53. Sahu BP, Hazarika H, Bharadwaj R, et al. Curcumin-docetaxel co-loaded nanosuspension for enhanced anti-breast cancer activity. Expert Opin Drug Deliv. 2016;13:1065–1074. doi:10.1080/17425247.2016.1182486
54. Chi Y, Yin X, Sun K, et al. Redox-sensitive and hyaluronic acid functionalized liposomes for cytoplasmic drug delivery to osteosarcoma in animal models. J Control Release. 2017;261:113–125. doi:10.1016/j.jconrel.2017.06.027
55. Chen YC, Liao LC, Lu PL, et al. The accumulation of dual pH and temperature responsive micelles in tumors. Biomaterials. 2012;33:4576–4588. doi:10.1016/j.biomaterials.2012.02.059
56. Parveen S, Sahoo SK. Long circulating chitosan/PEG blended PLGA nanoparticle for tumor drug delivery. Eur J Pharmacol. 2011;670:372–383. doi:10.1016/j.ejphar.2011.09.023
57. Yin S, Li J, Gu X, Gu X, Gu X. Preparation and characterization of long-circulating PELMD/mPEG–PLGA-mixed micelles for 10-hydroxycamptothecin. J Nanoparticle Res. 2014;16:1–14. doi:10.1007/s11051-014-2274-9
58. Mishra P, Nayak B, Dey RK. PEGylation in anti-cancer therapy: an overview. Asian J Pharma Sci. 2016;11:337–348. doi:10.1016/j.ajps.2015.08.011
59. Pu XH, Sun J, Qin YM, et al. The passive targeting and the cytotoxicity of intravenous 10-HCPT nanosuspension. Curr Nanosci. 2012;8:762–766. doi:10.2174/157341312802884553
60. Zhou L, Du C, Zhang R, Dong C. Stimuli-responsive dual drugs-conjugated polydopamine nanoparticles for the combination photothermal-cocktail chemotherapy. Chin Chem Lett. 2021;32:561–564. doi:10.1016/j.cclet.2020.02.043
61. Wang Q, Gao Z, Zhao K, et al. Co-delivery of enzymes and photosensitizers via metal-phenolic network capsules for enhanced photodynamic therapy. Chin Chem Lett. 2022;33:1917–1922. doi:10.1016/j.cclet.2021.11.040
62. Yang L, Jiang J, Hong J, Liao Y, Kuang H, Wang X. High drug payload 10-hydroxycamptothecin nanosuspensions stabilized by cholesterol-PEG: in vitro and in vivo investigation. J Biomed Nanotechnol. 2015;11:711–721. doi:10.1166/jbn.2015.2050
 © 2023 The Author(s). This work is published and licensed by Dove Medical Press Limited. The
full terms of this license are available at https://www.dovepress.com/terms
and incorporate the Creative Commons Attribution
- Non Commercial (unported, 3.0) License.
By accessing the work you hereby accept the Terms. Non-commercial uses of the work are permitted
without any further permission from Dove Medical Press Limited, provided the work is properly
attributed. For permission for commercial use of this work, please see paragraphs 4.2 and 5 of our Terms.
© 2023 The Author(s). This work is published and licensed by Dove Medical Press Limited. The
full terms of this license are available at https://www.dovepress.com/terms
and incorporate the Creative Commons Attribution
- Non Commercial (unported, 3.0) License.
By accessing the work you hereby accept the Terms. Non-commercial uses of the work are permitted
without any further permission from Dove Medical Press Limited, provided the work is properly
attributed. For permission for commercial use of this work, please see paragraphs 4.2 and 5 of our Terms.