Back to Journals » Diabetes, Metabolic Syndrome and Obesity » Volume 16
Formate Might Be a Novel Potential Serum Metabolic Biomarker for Type 2 Diabetic Peripheral Neuropathy
Authors Xu W ![]() , Xue W, Zhou Z, Wang J, Qi H, Sun S, Jin T, Yao P, Zhao JY, Lin F
, Xue W, Zhou Z, Wang J, Qi H, Sun S, Jin T, Yao P, Zhao JY, Lin F
Received 4 July 2023
Accepted for publication 4 October 2023
Published 10 October 2023 Volume 2023:16 Pages 3147—3160
DOI https://doi.org/10.2147/DMSO.S428933
Checked for plagiarism Yes
Review by Single anonymous peer review
Peer reviewer comments 2
Editor who approved publication: Dr Konstantinos Tziomalos
Weisheng Xu,1,2,* Wangsheng Xue,1,* Zeyu Zhou,3,* Jiying Wang,1 Hui Qi,1 Shiyu Sun,1 Tong Jin,1 Ping Yao,1 Jian-Yuan Zhao,4 Fuqing Lin1
1Department of Pain Medicine, Shanghai Tenth People’s Hospital, Tongji University School of Medicine, Shanghai, 200072, People’s Republic of China; 2School of Medicine, Tongji University, Shanghai, 200331, People’s Republic of China; 3School of Life Sciences, Fudan University, Shanghai, 200433, People’s Republic of China; 4Institute for Developmental and Regenerative Cardiovascular Medicine, MOE-Shanghai Key Laboratory of Children’s Environmental Health, Xinhua Hospital, Shanghai Jiao Tong University School of Medicine, Shanghai, 200090, People’s Republic of China
*These authors contributed equally to this work
Correspondence: Fuqing Lin, Department of Pain Medicine, Shanghai Tenth People’s Hospital, Tongji University School of Medicine, Shanghai, 200072, People’s Republic of China, Email [email protected] Jian-Yuan Zhao, Institute for Developmental and Regenerative Cardiovascular Medicine, MOE-Shanghai Key Laboratory of Children’s Environmental Health, Xinhua Hospital, Shanghai Jiao Tong University School of Medicine, Shanghai, 200090, People’s Republic of China, Email [email protected]
Background: As one of the most frequent complications of type 2 diabetes mellitus (T2DM), diabetic peripheral neuropathy (DPN) shows a profound impact on 50% of patients with symptoms of neuropathic pain, numbness and other paresthesia. No valid serum biomarkers for the prediction of DPN have been identified in the clinic so far. This study is to investigate the potential serum biomarkers for DPN firstly based on 1H-Nuclear Magnetic Resonance (1H-NMR)-based metabolomics technique.
Methods: Thirty-six patients enrolled in this study were divided into two groups: 18 T2DM patients without DPN (T2DM group) and 18 T2DM patients with DPN (DPN group). Serum metabolites were measured via 1H-NMR spectroscopy. Bioinformatic approaches including principal component analysis (PCA), orthogonal partial least squares-discriminant analysis (OPLS-DA), independent sample t-test, Fisher’s test, Pearson and Spearman correlation analysis, Stepwise multiple linear regression analysis and receiver operating characteristic (ROC) curve analysis were used to identify the potential altered serum biomarkers.
Results: A total of 20 metabolites were obtained and further analyzed. Formate was identified as the only potential biomarker that decreased in the DPN group with statistical significance after multiple comparisons (p< 0.05). Formate also displayed a negative relationship with some elevated clinical markers in DPN. ROC curve analysis showed a good discriminative ability for formate in DPN with an area under the curve (AUC) value of 0.981.
Conclusion: Formate could be considered a potential serum metabolic biomarker for DPN. The reduced level of formate in DPN may be associated with mitochondrial dysfunction and gut microbiota alteration. Monitoring the level of serum formate would be an important strategy for the early diagnosis of DPN and a supplement of formate may be a promising treatment for DPN in the future.
Keywords: diabetic peripheral neuropathy, type 2 diabetes mellitus, 1H-NMR, metabolomics, formate, uric acid
Introduction
The prevalence of type 2 diabetes mellitus (T2DM), a long-term metabolic disease, has kept increasing worldwide in recent years.1 It is estimated that the global diabetes prevalence was 9% (463 million) in 2019, 10.5% (536.6 million) in 2021 and will rise to 12.2% (783.2 million) in 2045, most of which is T2DM.2 It is reported that approximately 50% of patients with T2DM would be accompanied by diabetic peripheral neuropathy (DPN), one of the most frequent chronic complications of diabetes mellitus.3,4 DPN is characterized by neuropathic pain, numbness, and sensory abnormality on symmetrical, bilateral distal limbs, which not only increases the risks of foot ulceration and even lower-limb amputation but also results in a substantial effect on the patient’s health and a heavy financial burden.5
Up to now, the potential pathogenic mechanisms of DPN have not yet been completely elucidated, which limits the further exploration of useful prevention and treatment strategies for DPN.6,7 Although nerve conduction is often used as a standard diagnostic tool for DPN, it is time-consuming, costly, and somewhat difficult to clinically diagnose. Therefore, the current diagnosis of DPN is exclusive and is diagnosed mainly in combination with clinical symptoms, the clinical evaluation scales and electromyography.5 About half of such patients are asymptomatic with occult nerve damage, and there are no serum markers allowing for early screening. Irreversible nerve damage has already occurred when confirmed DPN based on current diagnostic method. Although studies have proposed new diagnostic methods, they have not been widely applied clinically.8
As a metabolic disease, DPN was revealed in some studies that the occurrence of it may be related to the imbalance of metabolic pathways caused by hyperglycemia, lipid metabolism disorders and insulin abnormalities, which thereby leads to a series of oxidative stress (OS), inflammatory reaction, mitochondrial dysfunction and nerve cell damage, especially OS playing a pivotal role due to mitochondrial dysfunction.9 But, there is no effective treatment for DPN, emphasizing early glycaemic control combined with exercise and a healthy diet to prevent and delay disease progression.8
Recently, metabolomics has rapidly and widely developed into a useful technique to quantitatively analyze multicomponent mixtures of biological samples, which provides important information for understanding the composition and function of biochemical networks.10,11 Del Coco et al identified a metabolic serum signature associated with T2DM stages by the 1H-NMR-based metabolomics technique.12 Meanwhile, Rawat et al reported that 1H-NMR metabolomics may be promising for differentiating and predicting diabetes and its complications on their onset or progression by determining the altered levels of the metabolites in serum.13
However, there were no studies focused on the metabolomic alteration of DPN and no serum metabolic biomarkers had been identified for DPN.14 The progress in metabolomics technology may be conducive to revealing novel biomarkers of DPN and be possible for a better understanding of the pathogenic mechanisms. Hence, it would be greatly valuable if simple and practical serum markers are available for predicting and monitoring DPN in clinical applications. In this study, serum samples were collected to identify potentially valuable metabolite markers of DPN and associated metabolic pathways by the 1H-NMR metabolomics technique.
Methods
Participants and Design
A total of 36 patients were consecutively enrolled from June 2021 to January 2022 in the United Center of Endocrine and Pain in Shanghai Tenth People’s Hospital. All recruited patients were diagnosed with T2DM based on the American Diabetes Association criteria in 201915 and the age were 18–80 years old. Patients were excluded by the following conditions: heart diseases; history of the cerebral infarction; malignant tumors; liver or renal dysfunction; acute complications of diabetes and other endocrine diseases; arteriovenous vascular diseases; cervical and lumbar spine lesions; and other diseases affecting peripheral nerve function.
According to DPN inclusion criteria, they were divided into two groups, the T2DM group (n=18) and the DPN group (n=18). DPN group inclusion criteria:5 (1) common clinical symptoms, such as pain, numbness, and paresthesia at the end of limbs; (2) the physical examination score of Michigan Neuropathy Screening Instrument (MNSI)16 is more than five and the score of Toronto Clinical Scoring system (TCSS) is no less than six;17 (3) electromyography suggests multiple peripheral neuropathies.18
Clinical Data and Biochemical Indexes Collection
Patients’ basic information and blood biochemical indexes were collected as follows: gender, age, diabetes duration, drugs use, body mass index (BMI), systolic blood pressure (SBP), diastolic blood pressure (DBP), fasting blood glucose (FBG), fasting C-peptide (FCP), glycated hemoglobin A1c (HbA1c), brain natriuretic peptide (BNP), albumin (ALB), alanine aminotransferase (ALT), aspartate aminotransferase (AST), alkaline phosphatase (ALP), serum creatinine (Scr), blood urea nitrogen (BUN), uric acid (UA), glomerular filtration rate (GFR), cystatin C (Cys-C), triglyceride (TG), high-density lipoprotein (HDL), low-density lipoprotein (LDL), total bilirubin (TBil), total bile acid (TBA), urinary microalbumin (UMA), 1.25-hydroxy vitamin D (1,25-(OH)2D3), parathyroid hormone (PTH), free triiodothyronine (FT3), free thyroxine (FT4), triiodothyronine (TT3), thyroxine (TT4), thyroid stimulating hormone (TSH) and neuron-specific enolase (NSE).
Sample Collection and Processing
Targeted metabolomics was applied via a 1H-NMR metabolomics platform, which could measure the concentrations of metabolites and the detailed methods were depicted previously.19,20 Blood samples were collected and clotted for 30 min at room temperature. Then, the samples were centrifuged at 3000 rpm for 10min at 4°C to make the sera separated and stored at −80°C until the 1H-NMR analysis. Serum samples were unfrozen at room temperature before the 1H-NMR analysis. 200μL serum was added with 800μL prechilled methanol and 20μL ethylenediaminetetraacetic acid (EDTA, 0.1M), after which got evenly, the new samples were centrifuged (12,000×g, 4°C) for 10 min and the supernatants were collected. The extraction was repeated twice and three supernatants were combined. The new samples were then lyophilized with liquid nitrogen after the removal of methanol in a vacuum for testing. 600μL phosphate buffer (0.15 M, K2HPO4-NaH2PO4, pH 7.40) containing 80% D2O (v/v) and trimethylsilyl propionate (TSP) was titrated into the numbered EP sample tube containing the dried extract and then centrifuged (16,000×g, 4°C) for 10 min. 550μL supernatant was transferred into a 5 mm NMR tube for 1H-NMR analysis.
The one-dimensional 1H NMR spectra were obtained by using the first increment of the gradient-selected NOESY pulse sequence (NOESYGPPR1D) at 298 K on a Bruker Advance III 600 MHz NMR spectrometer (600.13 MHz for proton frequency) which is equipped with a quaternary cryogenic inverse probe (Bruker Biospin, Germany). Sixty-four transients were collected into 32-k data points with a spectral width of 20 ppm for each sample. The completely relaxed NMR spectra were acquired when the total relaxation delay time was 26s.
To obtain the quantification of metabolites, the software package TOPSPIN (V3.6.0, Bruker Biospin, Germany) was used to process all the acquired NMR spectra. For 1H-NMR spectra, the exponential window function was used before the Fourier transformation with a line broadening factor of 1 Hz and zero padding to 128 k. The phase and baseline of all spectra were then corrected automatically and manually with the chemical shift referenced to TSP (δ 0.00). The absolute concentration of the metabolites was finally calculated with the known concentration of TSP.
Statistical Analysis
Categorical variables were presented as proportions and analyzed by using Fisher's exact test. Normally distributed and continuous variables were expressed as means±standard deviations and were analyzed by using an independent sample t-test. Differences were considered statistically significant if the p value was less than 0.05.
A heat map based on z-score was used to distinguish the difference in metabolites between the two groups preliminarily. For further identification of significant variables between the two groups, principal component analysis (PCA) and orthogonal partial least squares-discriminant analysis (OPLS-DA) were performed. The stability of the OPLS-DA model was assessed by cross-validation and permutation test (R2Y: fitness of model, Q2: predictive capability). Metabolites with variable importance in projection (VIP) values >1.0 in the OPLS-DA model were thought to be different between the DPN group and the T2DM group. Detailed data were shown as means±SD and a p-value of <0.05 determined via independent sample t-test was applied as the standard for statistical significance between two groups. Benjamini & Hochberg method was used to correct the p values of independent sample t-test for metabolites involving multiple sampling, showing as q values. Pearson and Spearman correlation analysis and stepwise multiple linear regression analysis were also applied. Finally, the Binary logistic regression analysis and receiver operating characteristic (ROC) curves were used to assess the diagnostic capability of metabolites for confirming DPN, and area under the curve (AUC) values were calculated as a rigorous validation of the prediction accuracy.21
All statistical analyses were performed using SPSS software (version 25.0), GraphPad Prism 9 software and the Metware Cloud platform.
Results
Clinical Features and Basic Information
The enrolled 36 patients were well matched in BMI and basic information (Table 1). DPN group had higher levels of HbA1c (p=0.003), UA (p=0.023), Cys-C (p=0.001), TSH (p=0.002) and NSE (p=0.026), and lower level of ALB (p=0.002) compared with T2DM group. There was no significant difference between the two groups in other clinical parameters and the use of drugs (Table 2).
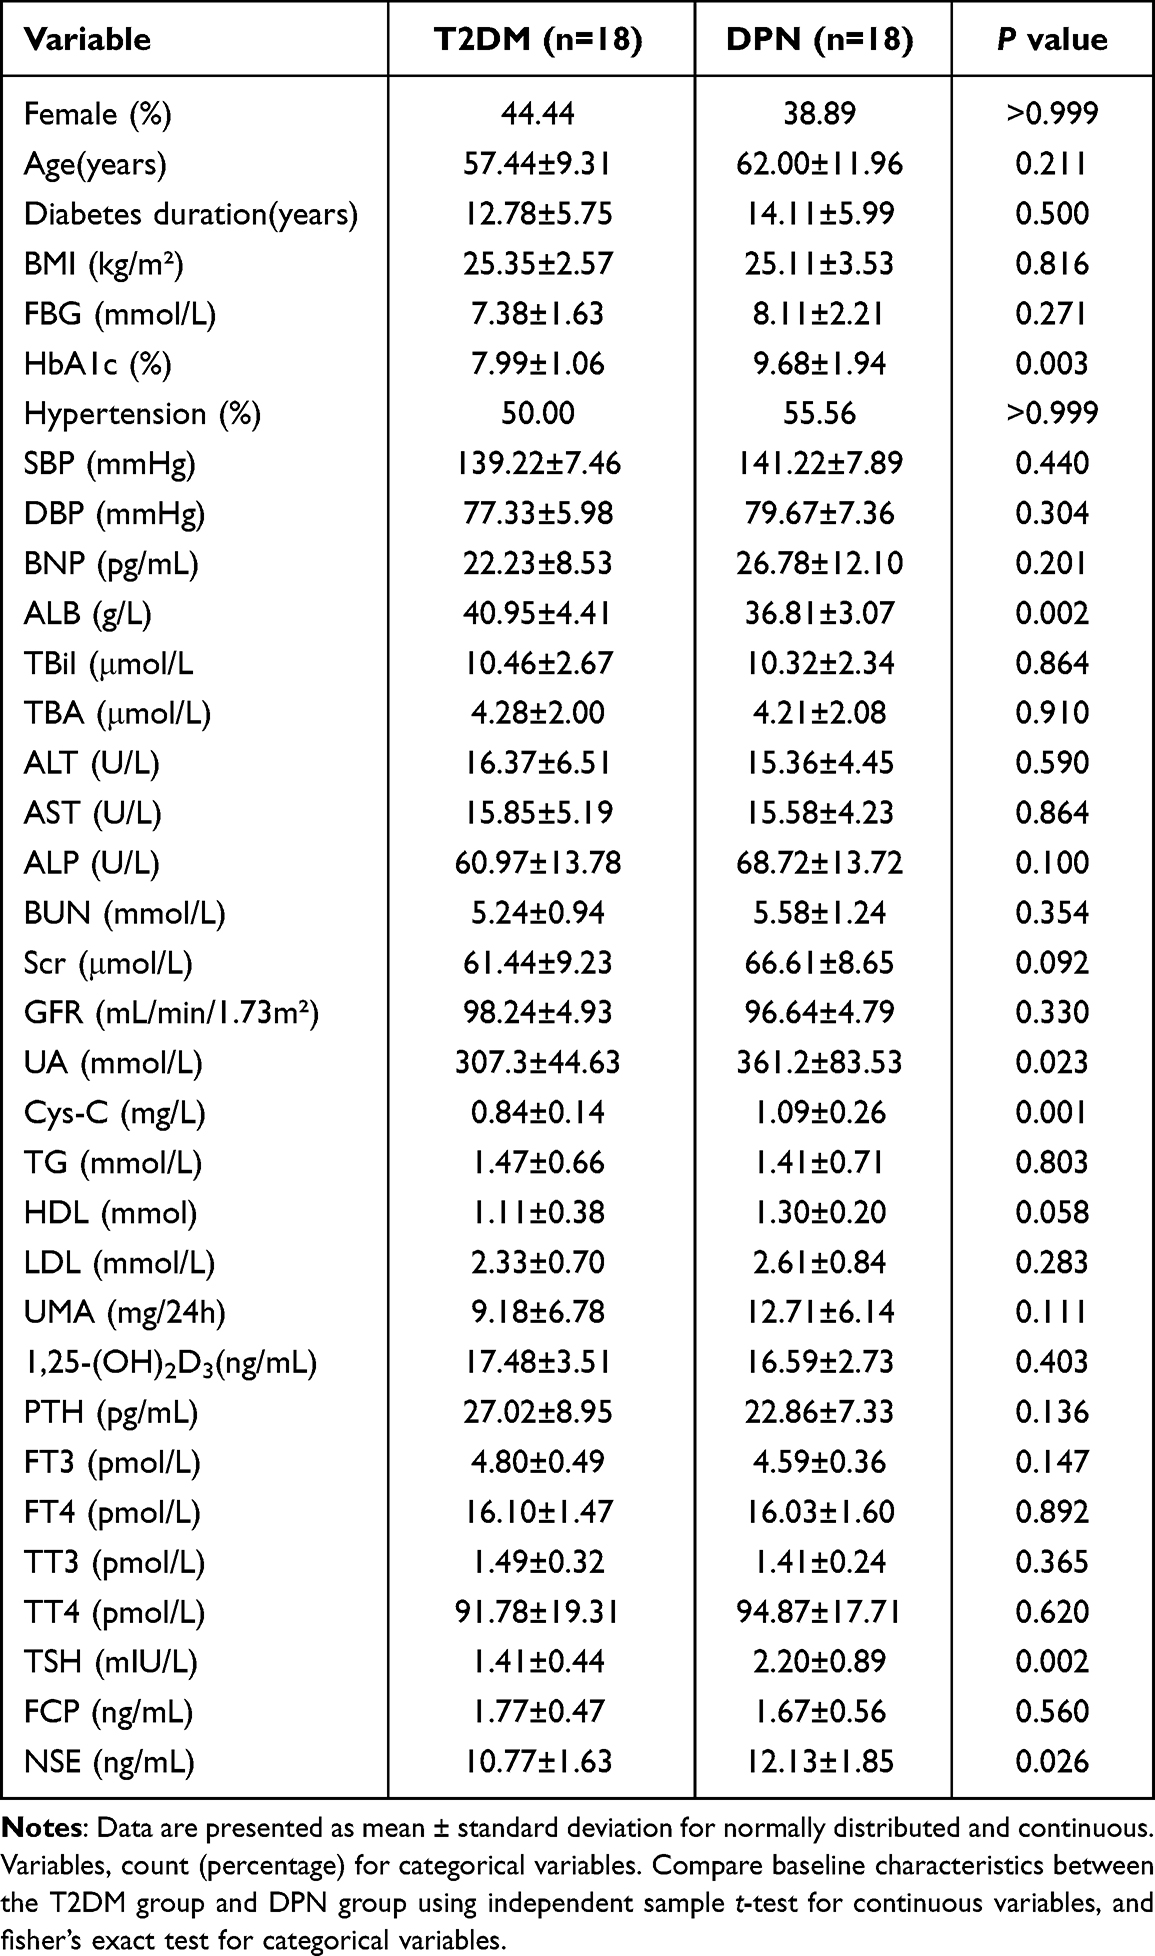 |
Table 1 Clinical Characteristics Between DPN Group and T2DM Group |
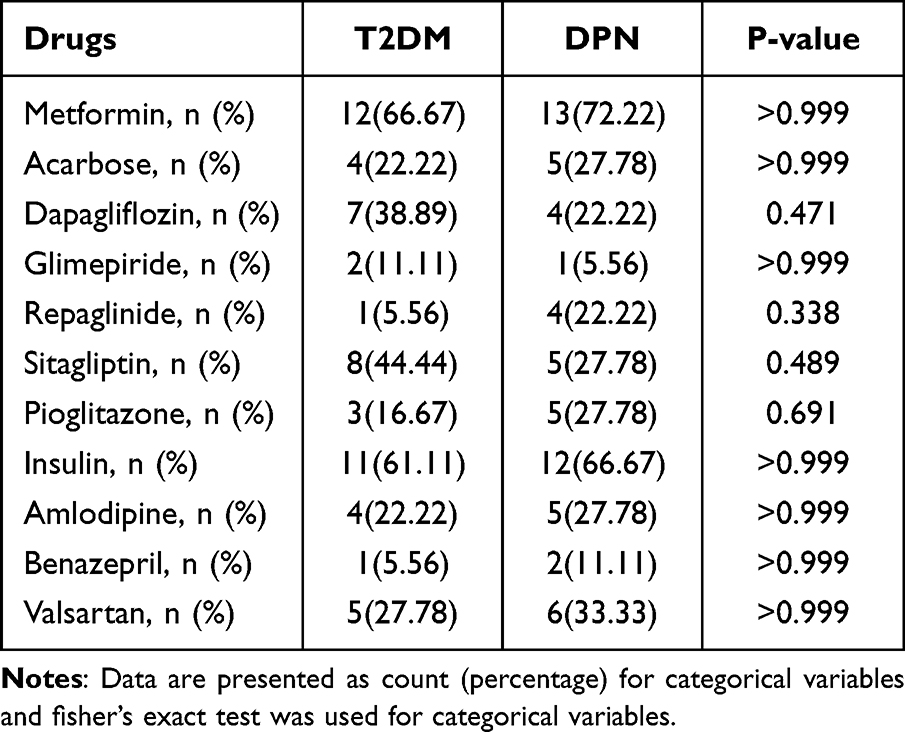 |
Table 2 The Use of Drugs in T2DM Group and DPN Group |
Metabolomics Analysis of Serum Samples
In the study, 36 serum samples were examined by 1H-NMR spectroscopy and twenty metabolites were obtained: formate, hypoxanthine, histidine, phenylalanine, tyrosine, glucose, lactate, creatine, citrate, glutamine, acetate, alanine, valine, isoleucine, leucine, 3-hydroxybutyrate, tryptophan, inosine, Ca2+ and Mg2+. The representative 1H-NMR comparison spectrum between the two groups was shown in Figure 1. The heat map revealed a robust difference in the relative concentration of formate in the two groups, while other metabolites showed no clear difference (Figure 2). After being transformed via zero-centered, the data was analyzed by PCA and OPLS-DA analysis between T2DM and DPN groups. The PCA model analysis (Figure 3a) showed an overall understanding of the serum metabolite distribution of two groups. The DPN group was almost separated from the T2DM group in the OPLS-DA model (Figure 3b), indicating a good model adaptation. The OPLS-DA score plot indicated that the significance threshold for metabolite difference between the two groups was 8.01%. The intra-group difference threshold for metabolites in the two groups was 34.3% and mainly clarified by variation among these individuals. Permutation plots were then used for validation of the results, and the model quality parameters were Q2=0.658, R2X=0.523 and R2Y=0.826 (Figure 3c). The OPLS-DA model displayed a significant differentiation (R2Y=0.826), which showed relatively strong stability and reliability. The prediction rate was more than 0.50 (Q2=0.658), which further proved the higher prediction accuracy of the OPLS-DA model.
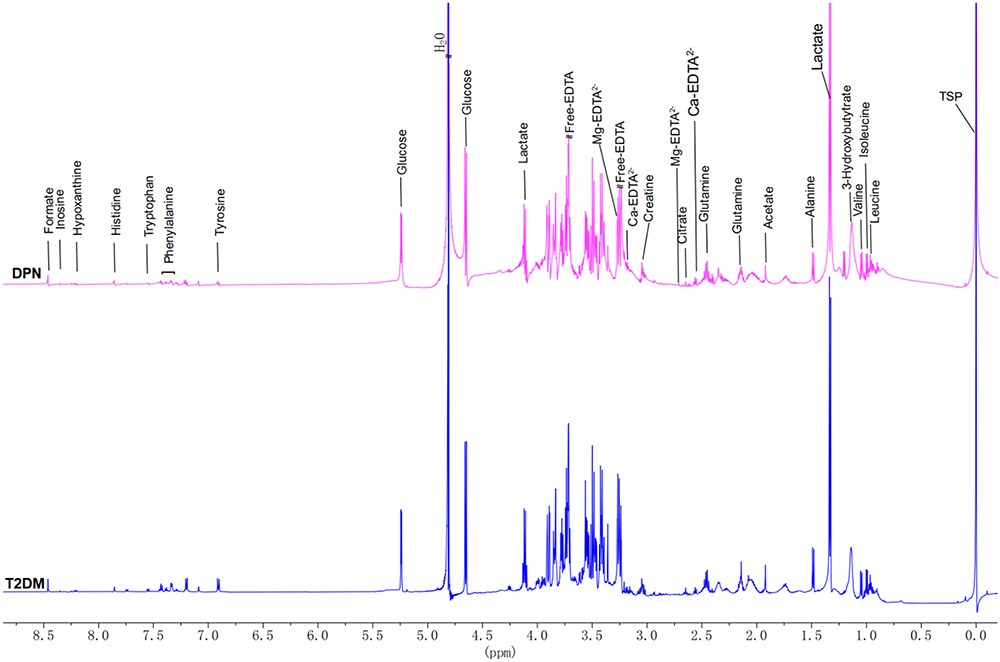 |
Figure 1 Representative 600‐MHz 1H nuclear magnetic resonance spectrum (δ0.0~8.75,) of the T2DM group (blue) and DPN group (purple). All peaks were referenced to the resonance of TSP at 0 ppm. Free EDTA signals in all samples indicated that all Ca2+ and Mg2+ were chelated. Ca-EDTA, Mg-EDTA were EDTA complexes. |
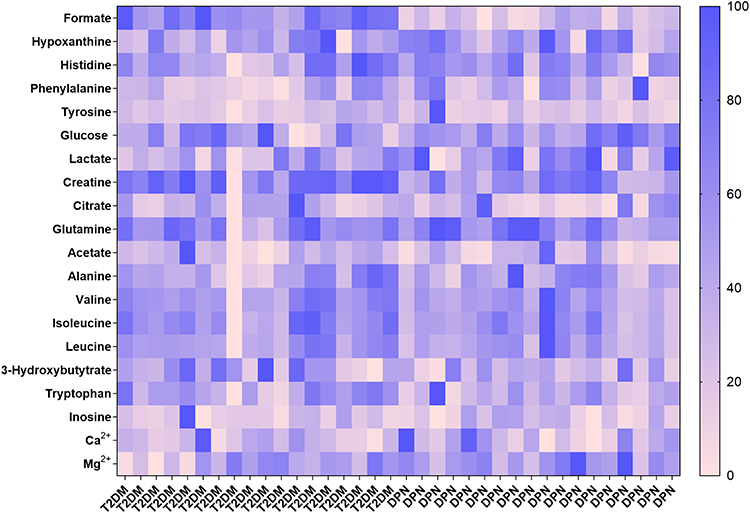 |
Figure 2 A heat map revealed the relative concentrations of twenty metabolites between the T2DM group and DPN group. The different colors were corresponding to different values in the right palette (0–100%). |
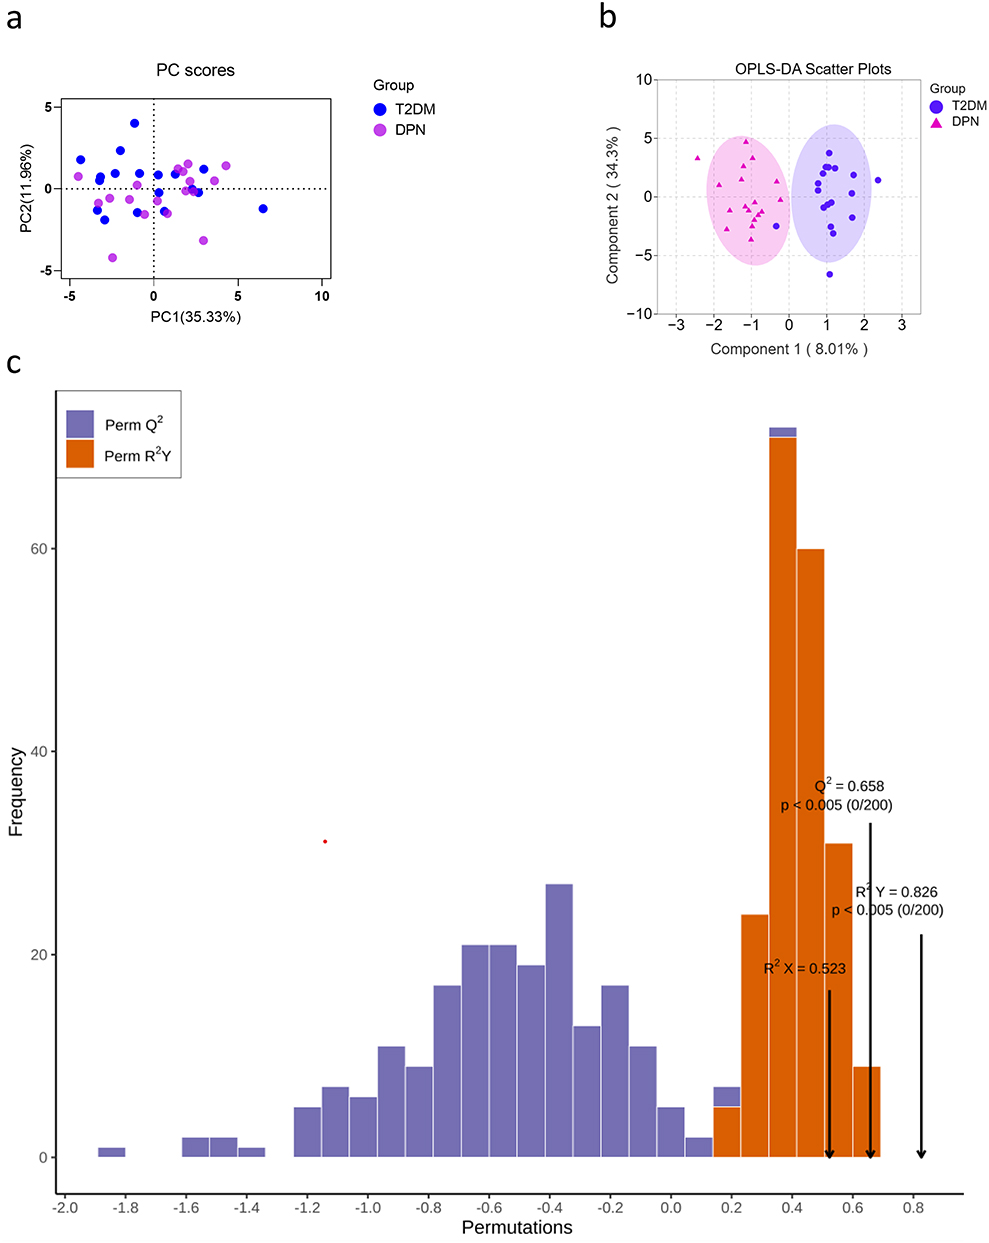 |
Figure 3 Principal components analysis (PCA) score plot (a) and OPLS-DA scores plot (b) indicated discrimination of the metabolites between the T2DM group and DPN group. Permutation test plot verified the OPLS-DA model (c): Q2 (cum)=0.658, R2X (cum)=0.523, R2Y (cum)=0.826. The abscissa of the model verification permutation test plot represents the accuracy of the model, the ordinate represents the frequency of the accuracy of 200 models in the 200 permutation tests, and the arrows indicate the location of the accuracy of this OPLS-DA model. R2X and R2Y respectively indicate the explanatory rate of the built model to the X and Y matrices, Q2 represents the predictive ability of the model. The closer the values of R2 and Q2 to 1, the better the model. |
On the basis of OPLS-DA model, at the threshold of VIP score >1, three metabolites including formate (VIP=3.2218), creatine (VIP=1.5719) and lactate (VIP=1.3193) were significantly different between the two groups (Table 3). Formate (p<0.001) and creatine (p=0.014) showed a statistical significance via independent sample t-test. After Benjamini & Hochberg adjustment, only formate was found to decrease significantly in DPN (q value <0.001).
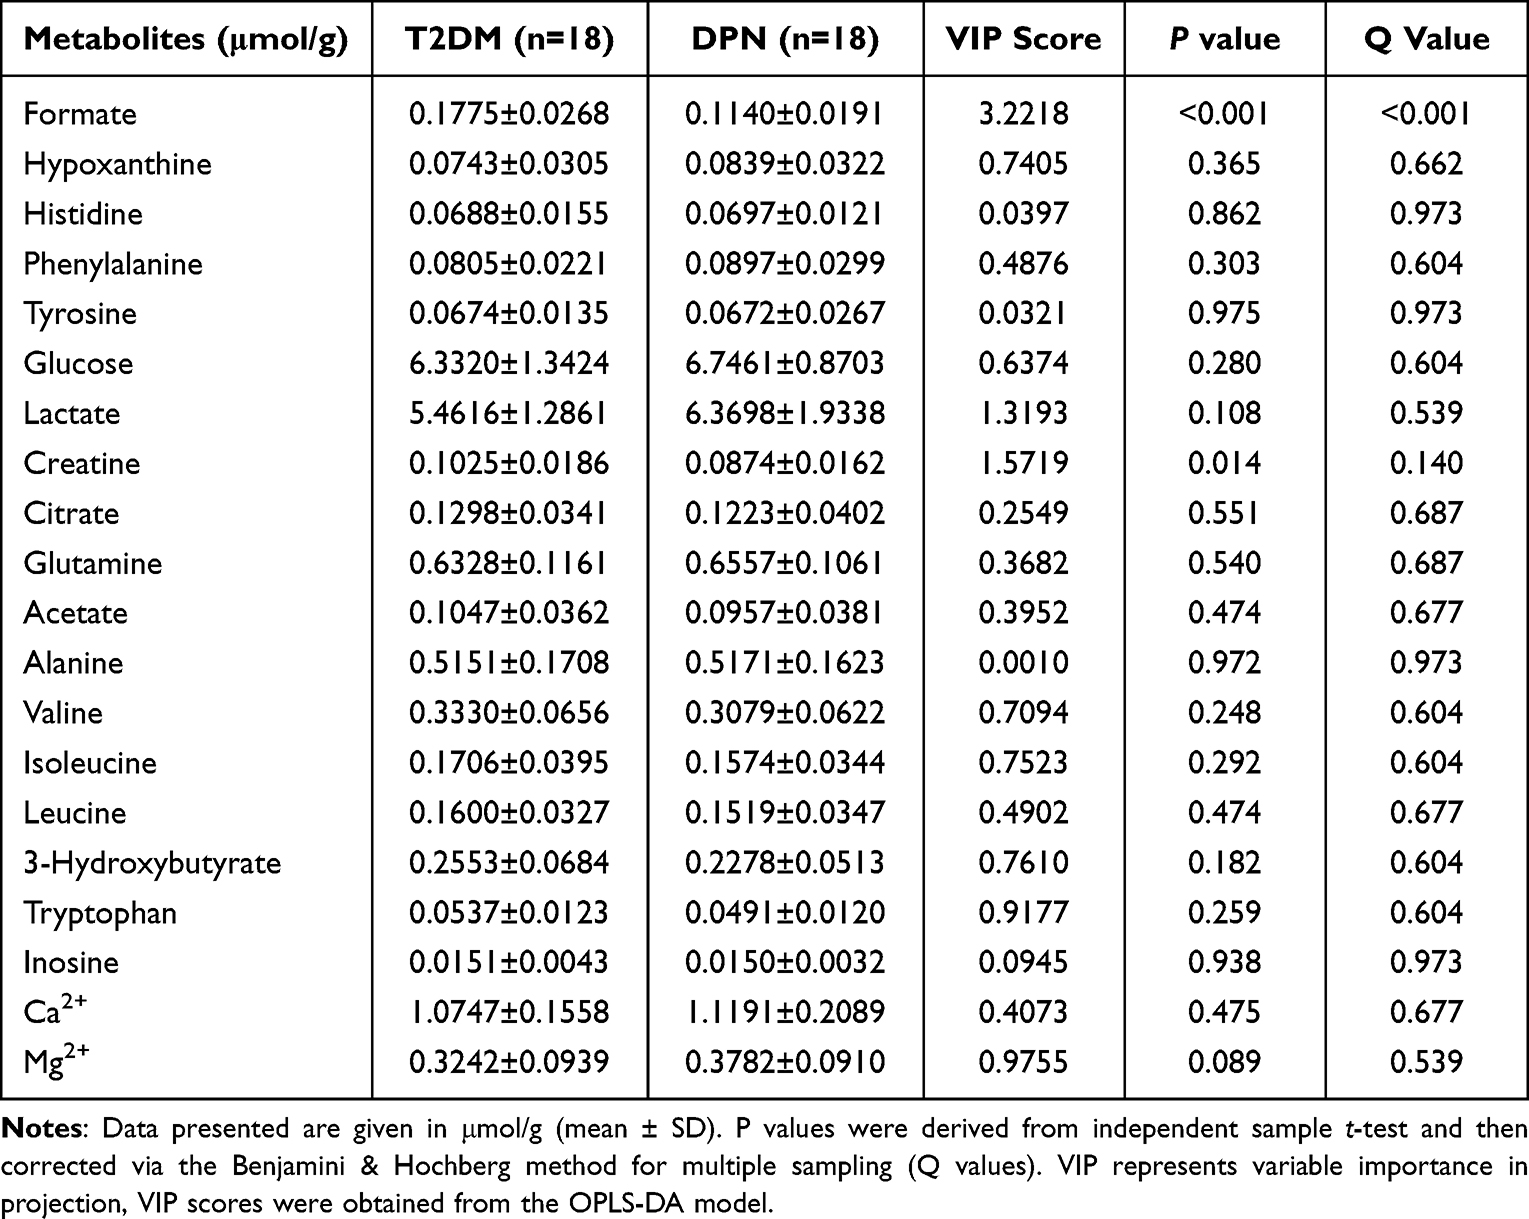 |
Table 3 Twenty Serum Metabolites Concentration and VIP Scores Between the T2DM Group and DPN Group |
Pearson and Spearman correlation analysis indicated that the serum formate level was negatively associated with Cys-c (r=−0.564, p<0.001), HbA1c (r=−0.357, p=0.032), TSH (r=−0.422, p=0.010), HDL (r=−0.383, p=0.021), DPN (r=−0.814, p<0.001) and positively correlated with ALB (r=0.365, p=0.029), PTH (r=0.331, p=0.049) (Table 4). Serum metabolites and other clinical indicators were taken as independent variables and the presence or absence of DPN was taken as a dependent variable. The results in Table 5 and Table 6 based on stepwise multiple linear regression analysis showed the formula: DPN=−9.417×formate+0.064×HbA1c+1.306 (adjusted R² = 0.689).
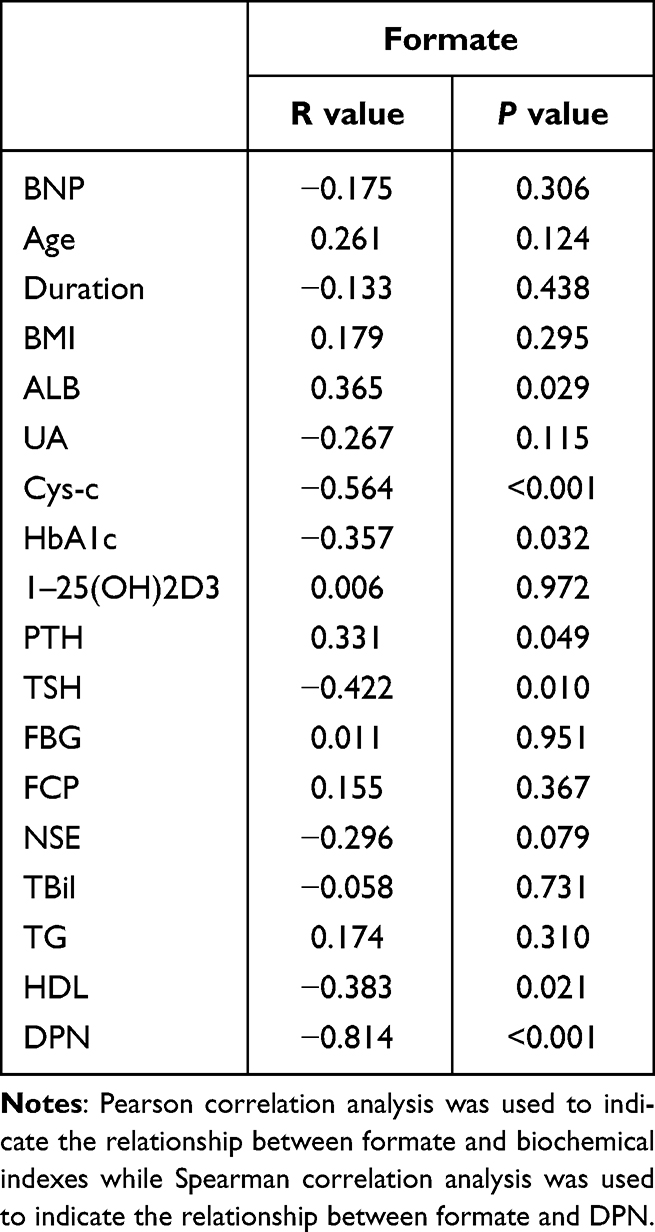 |
Table 4 Correlation Between Formate and Other Clinical Characteristics |
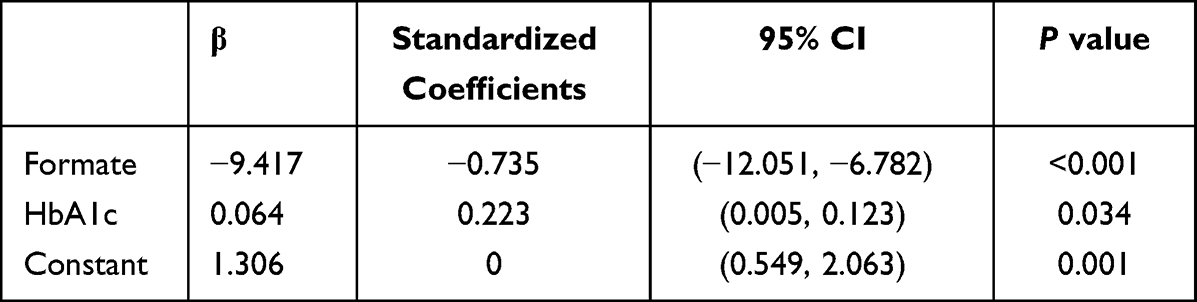 |
Table 5 Stepwise Multiple Linear Regression Analysis of DPN and Serum Indexes |
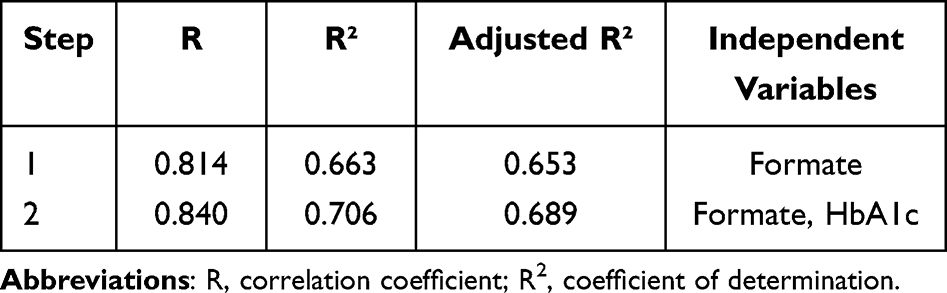 |
Table 6 The Coefficients and Constant of Predictive Formula Based on Stepwise Multiple Regression Analysis |
According to the above results, we hypothesized that the level of serum formate might be distinguished as a potential biomarker for the prediction of DPN. To further characterize the predictive probability of formate, ROC curve analysis was conducted. We found the formate had highest AUC values in a heat map designed to illustrate the discriminatory capability of all metabolites based on AUC (Figure 4a). The ROC curves of formate was plotted and the value of AUC was 0.981 (Figure 4b).
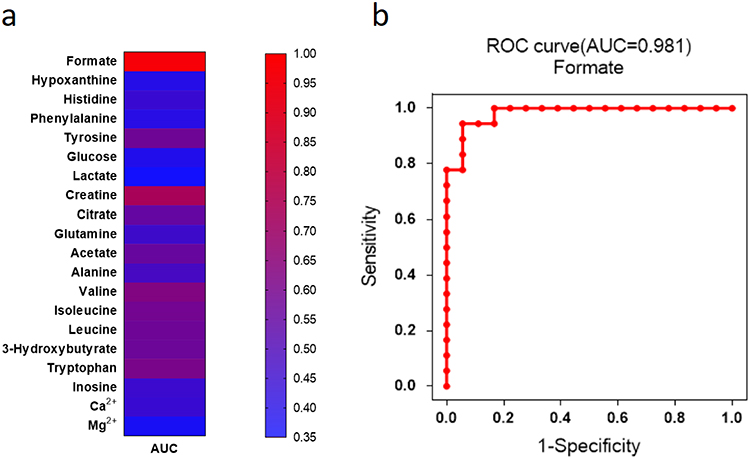 |
Figure 4 The heat map showed diagnostic ability of each metabolite with AUC values (a). The different colors were corresponding to different AUC values in the right palette. Formate showed the highest AUC value in all the metabolites for the diagnosis of DPN (b). |
Discussion
With the increasing prevalence of T2DM, the number of patients with DPN will be also expected to increase. T2DM is a metabolic disorder disease characterized by chronic hyperglycemia with alterations in protein, carbohydrate, and lipid metabolism. DPN represents one of the critical topics of interest as it makes up a serious clinical problem. Although the pathophysiology is still incomplete, several previous studies have demonstrated that some serum indicators were associated with DPN, such as HbA1c, UA, Cys-C, NSE, ALB, and TSH.22–27 In this study, the levels of serum HbA1c, UA, TSH, Cys-C and NSE increased, and the level of serum ALB decreased in the DPN group, which were consistent with previous studies above.
Metabolomic analysis, as a rapidly emerging technology, has developed into an important means for the identification of metabolites from biochemical pathways that are changed on account of disease or therapeutic intervention. There were some studies involving metabolomics in diabetes,13,28,29 but the characteristics of serum metabolites in DPN were rarely explored. Reviewing the literatures, we were the first to explore the serum metabolites of DPN via 1H-NMR metabolomics technology. In this study, only formate among the twenty metabolites obtained showed a significant difference, whose level was obviously lower in the DPN group than that in the T2DM group. There is a significant amount of formate released into the blood, although the origin of the formate remains unconfirmed. Previous studies revealed that formate was likely to be the endogenous metabolic production of amino acids in mitochondria, such as serine occupying 50%, glycine and methionine, along with choline and methanol. The in vitro evidence reported that serine as a main potential source was catabolized to glycine and formate with the energy generation in mitochondria.30 One ADP molecule is phosphorylated to form ATP via reverse mitochondrial 10-CHO-THF synthetase with per formate molecule released from cells and this process may involving creatine (Figure 5). Although formate levels are notably decreased in obese and cancer individuals,31,32 BMI and the use of drug had no statistical difference between two groups (p>0.05) and patients had no history of cancer in our study, which eliminated the factors of obese, drugs and cancer resulting in the reduced formate levels in DPN.
 |
Figure 5 Potential mechanisms of formate in the development of DPN. Dysfunction of mitochondria might decrease the production of formate (black arrows) and then limit the electron supplement in uric acid metabolism (Orange arrows). Gut anaerobic bacteria (black arrows) and creatine (blue arrows) could also produce a certain proportion of formate. |
Recently, the significance of formate in intermediary metabolism and its role in some diseases have been identified and explored. Formate, as a one-carbon (1C) molecule, is a mediator of metabolic interactions among mammalian organisms, whole-body metabolism, diet, and microbiome metabolism. Mitochondria, the site of producing intracellular oxygen-free radicals as well as the main target of oxygen-free radicals are important organelles maintaining the intracellular energy homeostasis and function. Mitochondrial dysfunction is thought as the trigger of neuronal damage in the pathogenesis of DPN, which may contribute to the deficiency of adenosine triphosphate (ATP) and then lead to reactive oxygen specimen generation and neuronal apoptosis.5,33 Gundu et al revealed that improvement of mitochondrial function could relieve rats allodynia and other behavioral defects associated with DPN.34 Bao et al also revealed that mitochondrial respiratory chain damage could reduce the production of formate from serine in 1C metabolism and mitochondrion.35 A recent study found that serine decreased in mice with DPN and supplementation of it could slow the progression of DPN.36 In the article, related genes were also changed in the pathway of serine to formate, thus providing cogent evidence for our results.
In recent years, gut microbiota has been playing an important role in many diseases, which also participated the progression of T2DM and peripheral neuropathy by the varieties of axis. Wang et al demonstrated that the abundance of Bacteroides, one of the anaerobic bacteria in the intestinal flora of DPN was significantly reduced, which also decreased obviously in the context of neuropathic pain.37,38 The formate generated from the fermentation of anaerobic bacteria in the gut, accounting for the remaining 50%, can enter the circulation, adding to the endogenous pool of formate or being used as a substrate for the growth of other bacteria with aerobic metabolism.39 Thus, gut dysbiosis may alter bacterial fermentation-produced serum formate levels and impact 1C metabolism.40 DPN involves autonomic neuropathy to a certain extent and a review41 summarized that autonomic nerve dysfunction was correlated with gut microbiome, involving byproducts of bacterial fermentation including butyrate, which has been proved with huge benefits to body.42 Formate was first found decreased in DPN involving the significant role of intestinal flora, contributing to the research of more function of formate. Creatine can be metabolized to methylamine by the gut microbiome (Figure 5), which is a potential exogenous source of formate. In consideration of the decreased level of creatine in the DPN group, the supplementation of creatine may contribute to the increase of serum formate. Recently, creatine is also explored in a few neurodegenerative diseases due to its beneficial effect on preventing apoptosis and diminishing OS, whose potential metabolism may relate to the antioxidant effects via reducing the formation of reactive oxygen species in neurodegenerative disease.43 Poortmans et al reported levels of urine methylamine increased by 90%, while formate increased by 13% when subjects consumed 21g of creatine/day for 14 days.44 The supplement of 1C sources, including formate and creatine, may help restore 1C metabolism,45 which possibly benefits the process of purine synthesis.
Although differentiated neurons do not proliferate, the axon regeneration and growth of new axons require de novo purine synthesis.46 Formate and uric acid (UA) participate in the synthesis and catabolism of purine as a precursor of purine synthesis and a product, respectively. Two-third of UA is excreted via the renal excretion pathway, and the remaining one-third UA excretion is degraded via the human gut microbiota.47,48 When UA is secreted into the intestine lumen, the degrading activity is rapidly mediated by components of the intestinal microbiota such as Escherichia coli, Clostridium and Pseudomonas bacteria.49 UA metabolism disorders are accompanied by increasing levels of OS and mitochondrial impairment, where UA could induce OS response in the mitochondria, exacerbating mitochondrial dysfunction. Previous studies have proposed that UA is also a marker of OS, and hyperuricemia-induced OS may be involved in the development of DPN.
Iwadate et al found that formate may act as an electron donor for a new metabolic pathway of UA degradation in gut microbiota,50 so the decreased formate level may contribute to the excretion disorder of UA. Thus, we speculated that the UA degradation decreased due to the insufficiency of formate providing an electron and our study showed reduced levels of formate along with the higher levels of UA in the DPN group (p<0.05). The high concentrations of UA may induce OS in hepatocyte mitochondria, increasing ROS production and ultimately resulting in mitochondrial damage,51 which may be a vicious cycle and further lower the level of formate (Figure 5). Our results provided a mechanistic hypothesis that the decreased formate and increased UA involving mitochondrial dysfunction and intestinal flora dysbiosis play an important role in DPN. These data indicated that formate supplementation should be explored as a therapeutic option in neurological disorders characterized by low levels of circulating urate.
Taken together, for the first time, the decreased levels of formate were found accompanied by the increased levels of uric acid in DPN group. Mitochondria plays an important role in the synthesis of formate and creatine. The interaction of these two molecules (Figure 5) would get trapped in a vicious circle when mitochondria function is damaged. UA degrade with an increase in the demand of formate as 1C units via gut microbiome. The reduced formate level may lead to the high concentrations of UA, which would induce OS response and aggravate mitochondrial dysfunctions. The increased UA level, the reduced formate and creatine levels, and OS response and mitochondrial dysfunctions may get trapped in vicious circle, which would aggravate neurological damage. Whether formate decreases in early stage of DPN, it deserves further research based on different diabetic neuropathy stages, such as previous studies.52 At the same time, the interference of diabetes nephropathy should be excluded, which is a systemic metabolic disease affecting the excretion of metabolites.53
Conclusion
In summary, this study offers a new insight that the serum level of formate could be a potential key serum metabolic biomarker in the occurrence and progression of DPN. Due to the development of metabolomics, the detection of serum formate is not difficult. Therefore, monitoring the level of serum formate would benefit the prediction of DPN. The reduced level of formate in DPN may be associated with mitochondrial dysfunction and intestinal microbiota. There is a potentially correlative mechanism between formate and uric acid. The supplement of formate and creatine may be a potentially effective treatment in the prevention and alleviation of DPN. However, there are some limitations in our study. Firstly, the number of samples is small, lacking causality, and more patients need to be enrolled to confirm our findings. Secondly, patients without symptoms, especially those with nerve conduction dysfunction confirmed by electromyogram were excluded. Thirdly, although the strict criteria were set to exclude possible influencing factors as much as possible, there might be other factors unknown interfering with the study results. A great deal of additional work remains to be done in future. Further animal experiments are under-designed to explore the specific pathways and mechanisms. Whether formate decreases in early stage of DPN, it deserves further research based on different diabetic neuropathy stages. More samples are required to validate the above hypothesis and address whether supplementation of them would improve the progression of peripheral neuropathy.
Data Sharing Statement
The datasets included in this study are available from the first author upon request.
Ethics Approval and Informed Consent
This study was conducted following the Declaration of Helsinki and approved by the Ethics Committee of Shanghai Tenth People’s Hospital (SHYS-IEC-5.0/22K151/PO1). All patients provided their written informed consent to participate in this study.
Acknowledgments
All authors are very grateful to the nurses in our department for their valuable assistance and to all patients involved in our study.
Author Contributions
All authors contributed significantly to the work reported, whether that is in the conception, study design, execution, acquisition of data, analysis and interpretation, or in all these areas; took part in drafting, revising, or critically reviewing the article; gave final approval of the version to be published; have agreed on the journal to which the article has been submitted; and agree to be accountable for all aspects of the work.
Funding
This study was supported by the Youth Development Fund of Shanghai Tenth People’s Hospital (04.03.20160).
Disclosure
The authors report no conflicts of interest in this work.
References
1. Bellary S, Kyrou I, Brown JE, Bailey CJ. Type 2 diabetes mellitus in older adults: clinical considerations and management. Nat Rev Endocrinol. 2021;17(9):534–548. doi:10.1038/s41574-021-00512-2
2. Sun H, Saeedi P, Karuranga S, et al. IDF diabetes atlas: global, regional and country-level diabetes prevalence estimates for 2021 and projections for 2045. Diabetes Res Clin Pract. 2022;183:109119.
3. Cho NR, Yu Y, Oh CK, et al. Neuropeptide Y: a potential theranostic biomarker for diabetic peripheral neuropathy in patients with type-2 diabetes. Ther Adv Chronic Dis. 2021;12:20406223211041936. doi:10.1177/20406223211041936
4. Hicks CW, Selvin E. Epidemiology of peripheral neuropathy and lower extremity disease in diabetes. Curr Diab Rep. 2019;19(10):86. doi:10.1007/s11892-019-1212-8
5. Sloan G, Selvarajah D, Tesfaye S. Pathogenesis, diagnosis and clinical management of diabetic sensorimotor peripheral neuropathy. Nat Rev Endocrinol. 2021;17(7):400–420. doi:10.1038/s41574-021-00496-z
6. Javed S, Hayat T, Menon L, Alam U, Malik RA. Diabetic peripheral neuropathy in people with type 2 diabetes: too little too late. Diabet Med. 2020;37(4):573–579. doi:10.1111/dme.14194
7. Yan P, Wan Q, Zhang Z, et al. Decreased physiological serum total bile acid concentrations in patients with type 2 diabetic peripheral neuropathy. Diabetes Metab Syndr Obes. 2021;14:2883–2892. doi:10.2147/DMSO.S313488
8. Elafros MA, Andersen H, Bennett DL, et al. Towards prevention of diabetic peripheral neuropathy: clinical presentation, pathogenesis, and new treatments. Lancet Neurol. 2022;21(10):922–936. doi:10.1016/S1474-4422(22)00188-0
9. Rosenberger DC, Blechschmidt V, Timmerman H, Wolff A, Treede RD. Challenges of neuropathic pain: focus on diabetic neuropathy. J Neural Transm. 2020;127(4):589–624. doi:10.1007/s00702-020-02145-7
10. Dubey D, Kumar S, Chaurasia S, et al. NMR-based serum metabolomics revealed distinctive metabolic patterns in reactive arthritis compared with rheumatoid arthritis. J Proteome Res. 2019;18(1):130–146.
11. Liang WD, Huang PJ, Xiong LH, et al. Metabolomics and its application in the mechanism analysis on diabetic bone metabolic abnormality. Eur Rev Med Pharmacol Sci. 2020;24(18):9591–9600. doi:10.26355/eurrev_202009_23047
12. Del Coco L, Vergara D, De Matteis S, et al. NMR-based metabolomic approach tracks potential serum biomarkers of disease progression in patients with type 2 diabetes mellitus. J Clin Med. 2019;8(5):720. doi:10.3390/jcm8050720
13. Rawat A, Misra G, Saxena M, et al. (1)H NMR based serum metabolic profiling reveals differentiating biomarkers in patients with diabetes and diabetes-related complication. Diabetes Metab Syndr. 2019;13(1):290–298. doi:10.1016/j.dsx.2018.09.009
14. Selvarajah D, Kar D, Khunti K, et al. Diabetic peripheral neuropathy: advances in diagnosis and strategies for screening and early intervention. Lancet Diabetes Endocrinol. 2019;7(12):938–948. doi:10.1016/S2213-8587(19)30081-6
15. American Diabetes A. 2. classification and diagnosis of diabetes: standards of medical care in diabetes-2019. Diabetes Care. 2019;42(Suppl 1):S13–S28.
16. Kristensen AG, Gylfadottir S, Itani M, et al. Sensory and motor axonal excitability testing in early diabetic neuropathy. Clin Neurophysiol. 2021;132(7):1407–1415. doi:10.1016/j.clinph.2021.02.397
17. Wang L, Guo S, Wang W, et al. Neuropathy scale score as an independent risk factor for myocardial infarction in patients with type 2 diabetes. Diabetes Metab Res Rev. 2022;38(7):e3561. doi:10.1002/dmrr.3561
18. Zhang Q, Ji L, Zheng H, et al. Low serum phosphate and magnesium levels are associated with peripheral neuropathy in patients with type 2 diabetes mellitus. Diabetes Res Clin Pract. 2018;146:1–7. doi:10.1016/j.diabres.2018.09.015
19. Wang XH, Xu S, Zhou XY, et al. Low chorionic villous succinate accumulation associates with recurrent spontaneous abortion risk. Nat Commun. 2021;12(1):3428. doi:10.1038/s41467-021-23827-0
20. Zhang X, Liu L, Chen WC, et al. Gestational leucylation suppresses embryonic T-Box transcription factor 5 signal and causes congenital heart disease. Adv Sci. 2022;9(15):e2201034. doi:10.1002/advs.202201034
21. Bhawal R, Fu Q, Anderson ET, Gibson GE, Zhang S. Serum metabolomic and lipidomic profiling reveals novel biomarkers of efficacy for benfotiamine in alzheimer’s disease. Int J Mol Sci. 2021;22(24):13188. doi:10.3390/ijms222413188
22. Su JB, Zhao LH, Zhang XL, et al. HbA1c variability and diabetic peripheral neuropathy in type 2 diabetic patients. Cardiovasc Diabetol. 2018;17(1):47. doi:10.1186/s12933-018-0693-0
23. Yu S, Chen Y, Hou X, et al. Serum uric acid levels and diabetic peripheral neuropathy in type 2 diabetes: a systematic review and meta-analysis. Mol Neurobiol. 2016;53(2):1045–1051. doi:10.1007/s12035-014-9075-0
24. Zhao W, Zeng H, Zhang X, et al. A high thyroid stimulating hormone level is associated with diabetic peripheral neuropathy in type 2 diabetes patients. Diabetes Res Clin Pract. 2016;115:122–129. doi:10.1016/j.diabres.2016.01.018
25. Yan P, Tang Q, Wu Y, et al. Serum albumin was negatively associated with diabetic peripheral neuropathy in Chinese population: a cross-sectional study. Diabetol Metab Syndr. 2021;13(1):100. doi:10.1186/s13098-021-00718-4
26. Hu Y, Liu F, Shen J, et al. Association between serum cystatin C and diabetic peripheral neuropathy: a cross-sectional study of a Chinese type 2 diabetic population. Eur J Endocrinol. 2014;171(5):641–648. doi:10.1530/EJE-14-0381
27. Li J, Zhang H, Xie M, Yan L, Chen J, Wang H. NSE, a potential biomarker, is closely connected to diabetic peripheral neuropathy. Diabetes Care. 2013;36(11):3405–3410. doi:10.2337/dc13-0590
28. Lu W, Luo M, Fang X, et al. Discovery of metabolic biomarkers for gestational diabetes mellitus in a Chinese population. Nutr Metab. 2021;18(1):79. doi:10.1186/s12986-021-00606-8
29. Quek DQY, He F, Sultana R, et al. Novel serum and urinary metabolites Associated with diabetic retinopathy in three Asian Cohorts. Metabolites. 2021;11(9). doi:10.3390/metabo11090614
30. Meiser J, Tumanov S, Maddocks O, et al. Serine one-carbon catabolism with formate overflow. Sci Adv. 2016;2(10):e1601273. doi:10.1126/sciadv.1601273
31. Pietzke M, Arroyo SF, Sumpton D, et al. Stratification of cancer and diabetes based on circulating levels of formate and glucose. Cancer Metab. 2019;7(1):3. doi:10.1186/s40170-019-0195-x
32. Bertini I, Cacciatore S, Jensen BV, et al. Metabolomic NMR fingerprinting to identify and predict survival of patients with metastatic colorectal cancer. Cancer Res. 2012;72(1):356–364. doi:10.1158/0008-5472.CAN-11-1543
33. Schmidt RE. Mitochondriopathy: the unifying concept in distal neuropathies? Int Rev Neurobiol. 2019;145:1–12.
34. Gundu C, Arruri VK, Sherkhane B, Khatri DK, Singh SB. Indole-3-propionic acid attenuates high glucose induced ER stress response and augments mitochondrial function by modulating PERK-IRE1-ATF4-CHOP signalling in experimental diabetic neuropathy. Arch Physiol Biochem. 2022;1–14. doi:10.1080/13813455.2021.2024577
35. Bao XR, Ong SE, Goldberger O, et al. Mitochondrial dysfunction remodels one-carbon metabolism in human cells. Elife. 2016;5. doi:10.7554/eLife.10575
36. Handzlik MK, Gengatharan JM, Frizzi KE, et al. Insulin-regulated serine and lipid metabolism drive peripheral neuropathy. Nature. 2023;614(7946):118–124. doi:10.1038/s41586-022-05637-6
37. Wang Y, Ye X, Ding D, Lu Y. Characteristics of the intestinal flora in patients with peripheral neuropathy associated with type 2 diabetes. J Int Med Res. 2020;48(9):300060520936806. doi:10.1177/0300060520936806
38. Chen P, Wang C, Ren YN, Ye ZJ, Jiang C, Wu ZB. Alterations in the gut microbiota and metabolite profiles in the context of neuropathic pain. Mol Brain. 2021;14(1):50. doi:10.1186/s13041-021-00765-y
39. Hughes ER, Winter MG, Duerkop BA, et al. Microbial respiration and formate oxidation as metabolic signatures of inflammation-Associated Dysbiosis. Cell Host Microbe. 2017;21(2):208–219. doi:10.1016/j.chom.2017.01.005
40. Brosnan ME, Brosnan JT. Formate: the neglected member of one-carbon metabolism. Annu Rev Nutr. 2016;36(1):369–388. doi:10.1146/annurev-nutr-071715-050738
41. Wang X, Chen Z, Geng B, Cai J, D Elia L. The bidirectional signal communication of microbiota-gut-brain axis in hypertension. Int J Hypertens. 2021;2021:8174789. doi:10.1155/2021/8174789
42. Farhat EK, Sher EK, Dzidic-Krivic A, Banjari I, Sher F. Functional biotransformation of phytoestrogens by gut microbiota with impact on cancer treatment. J Nutr Biochem. 2023;118:109368. doi:10.1016/j.jnutbio.2023.109368
43. Roschel H, Gualano B, Ostojic SM, Rawson ES. Creatine supplementation and brain health. Nutrients. 2021;13(2):586. doi:10.3390/nu13020586
44. Poortmans JR, Kumps A, Duez P, Fofonka A, Carpentier A, Francaux M. Effect of oral creatine supplementation on urinary methylamine, formaldehyde, and formate. Med Sci Sports Exerc. 2005;37(10):1717–1720. doi:10.1249/01.mss.0000176398.64189.e6
45. Miller MR, DiBattista A, Patel MA, et al. A distinct metabolite signature in military personnel exposed to repetitive low-level blasts. Front Neurol. 2022;13:831792. doi:10.3389/fneur.2022.831792
46. Petrausch B, Tabibiazar R, Roser T, et al. A purine-sensitive pathway regulates multiple genes involved in axon regeneration in goldfish retinal ganglion cells. J Neurosci. 2000;20(21):8031–8041. doi:10.1523/JNEUROSCI.20-21-08031.2000
47. Sorensen LB, Levinson DJ. Origin and extrarenal elimination of uric acid in man. Nephron. 1975;14(1):7–20. doi:10.1159/000180432
48. Ichida K, Matsuo H, Takada T, et al. Decreased extra-renal urate excretion is a common cause of hyperuricemia. Nat Commun. 2012;3(1):764. doi:10.1038/ncomms1756
49. Wang J, Chen Y, Zhong H, et al. The gut microbiota as a target to control hyperuricemia pathogenesis: potential mechanisms and therapeutic strategies. Crit Rev Food Sci Nutr. 2022;62(14):3979–3989. doi:10.1080/10408398.2021.1874287
50. Iwadate Y, Kato JI, Galperin MY. Identification of a formate-dependent uric acid degradation pathway in Escherichia coli. J Bacteriol. 2019;201(11). doi:10.1128/JB.00573-18
51. Yang Y, Zhou Y, Cheng S, Sun JL, Yao H, Ma L. Effect of uric acid on mitochondrial function and oxidative stress in hepatocytes. Genet Mol Res. 2016;15(2). doi:10.4238/gmr.15028644
52. Sher EK, Prnjavorac B, Farhat EK, Palic B, Ansar S, Sher F. Effect of diabetic neuropathy on reparative ability and immune response system. Mol Biotechnol. 2023. doi:10.1007/s12033-023-00813-z
53. Liu H, Feng J, Tang L. Early renal structural changes and potential biomarkers in diabetic nephropathy. Front Physiol. 2022;13:1020443. doi:10.3389/fphys.2022.1020443
 © 2023 The Author(s). This work is published and licensed by Dove Medical Press Limited. The
full terms of this license are available at https://www.dovepress.com/terms
and incorporate the Creative Commons Attribution
- Non Commercial (unported, 3.0) License.
By accessing the work you hereby accept the Terms. Non-commercial uses of the work are permitted
without any further permission from Dove Medical Press Limited, provided the work is properly
attributed. For permission for commercial use of this work, please see paragraphs 4.2 and 5 of our Terms.
© 2023 The Author(s). This work is published and licensed by Dove Medical Press Limited. The
full terms of this license are available at https://www.dovepress.com/terms
and incorporate the Creative Commons Attribution
- Non Commercial (unported, 3.0) License.
By accessing the work you hereby accept the Terms. Non-commercial uses of the work are permitted
without any further permission from Dove Medical Press Limited, provided the work is properly
attributed. For permission for commercial use of this work, please see paragraphs 4.2 and 5 of our Terms.