Back to Journals » ImmunoTargets and Therapy » Volume 14
Flow Cytometric Profiling of Peripheral Immune Checkpoints Predicts Prognosis and Reveals PD-1/Treg/IL-10 Crosstalk in B-Cell Lymphoma
Authors Pan B, Li S, Ye R, Zhu J, Tang Y, Li L ![]()
Received 3 September 2025
Accepted for publication 25 December 2025
Published 31 December 2025 Volume 2025:14 Pages 1555—1568
DOI https://doi.org/10.2147/ITT.S561672
Checked for plagiarism Yes
Review by Single anonymous peer review
Peer reviewer comments 2
Editor who approved publication: Professor Michael Shurin
Bing Pan,* Sijia Li,* Ruyu Ye,* Jie Zhu, Yawei Tang, Li Li
Department of Hematology, The Second Hospital of Dalian Medical University, Dalian, People’s Republic of China
*These authors contributed equally to this work
Correspondence: Li Li, Department of Hematology, The Second Hospital of Dalian Medical University, Dalian, People’s Republic of China, Email [email protected]
Background: The clinical significance and mechanistic role of immune checkpoints (ICs) in B-cell lymphoma remain underexplored. This study investigates peripheral IC expression as prognostic biomarkers and their interaction with Tregs and IL-10.
Methods: Peripheral blood from 140 B-cell lymphoma patients was analyzed using flow cytometry (PD-1, CTLA-4, LAG-3, TIM-3 on CD4+/CD8+ T cells) and ELISA. Comparisons were made across disease aggressiveness, extranodal involvement, and treatment response (complete remission [CR] vs relapse/progression [R/P]).
Results: Aggressive lymphomas and cases with multiple extranodal sites showed significantly elevated IC expression (all p < 0.05). R/P patients demonstrated markedly higher PD-1 expression (CD4+: 26.1% vs 8.2%; CD8+: 25.2% vs 7.1%; p < 0.001) and elevated CTLA-4, LAG-3, TIM-3 versus CR patients. PD-1 and CTLA-4 showed significant prognostic value (AUC > 0.7), unlike LAG-3/TIM-3. R/P patients had increased Treg proportions (7.84% vs 3.58%, P< 0.0001) and IL-10 levels (10.5 vs 5.44 pg/mL, p < 0.0001). PD-1 on CD4+ T cells correlated positively with Treg frequency (r = 0.539, p < 0.0001) and IL-10 levels (r = 0.457, p < 0.0001).
Conclusion: Peripheral T-cell ICs, particularly PD-1 and CTLA-4, are significant prognostic biomarkers in B-cell lymphoma. The correlation between PD-1+ CD4+ T cells, Treg expansion, and IL-10 elevation is consistent with a mechanism whereby PD-1 signaling may contribute to immunosuppression through Treg differentiation and JAK2/STAT3 pathway activation, providing insights for therapeutic targeting.
Keywords: B-cell lymphoma, immune checkpoints, Treg, IL-10, immune microenvironment, CTLA-4
Introduction
B-cell lymphoma is a hematologic malignancy that is closely associated with the complex molecular pathways involved in the growth, development, and activation of B cells. Dysregulation of the tumor immune microenvironment is one of the critical pathogenic mechanisms underlying this disease.1 Investigating the immune microenvironment in B-cell lymphoma patients and exploring the interplay between immune checkpoints, regulatory T cells, and IL-10 signaling can elucidate tumor immune evasion mechanisms while providing biomarkers for prognosis assessment and therapeutic guidance.
Immune checkpoint (IC), also known as co-inhibitory receptors, these molecules primarily function to inhibit T-cell activity and induce T-cell exhaustion.2 They include programmed cell death protein-1 (PD-1), cytotoxic T lymphocyte antigen-4 (CTLA-4), lymphocyte activation gene-3 (LAG-3), T cell immunoglobulin and mucin domain-3 (TIM-3), and their respective ligands. Immune checkpoint inhibitors (ICIs) have garnered significant attention in cancer therapy.3–5 However, CTLA-4 inhibitors, due to their high toxicity and numerous side effects, are rarely used in clinical practice.6 In contrast, PD-1/PD-L1 inhibitors have been widely applied clinically, yet only a subset of patients benefit from these treatments, and their overall efficacy remains suboptimal. Although new ICI agents and clinical applications continue to emerge, there is an urgent need to gain a deeper understanding of the complex biological properties of immune checkpoint molecules and to reveal the correlation between immune checkpoint expression and disease onset, progression, and prognosis in B-cell lymphoma patients.
This study systematically investigates the clinical significance of peripheral immune checkpoint profiling in B-cell lymphoma through two integrated approaches: First, we establish the prognostic value of circulating T cell immune checkpoints (CTLA-4, LAG-3, PD-1, and TIM-3) by correlating their expression patterns with disease progression and treatment outcomes. Second, we explore the potential interplay between these checkpoints, regulatory T cells, and IL-10 signaling that may contribute to shaping the immunosuppressive tumor microenvironment - a critical knowledge gap in lymphoma immunobiology with direct therapeutic implications. The findings of this study are expected to provide novel insights into the immune regulation mechanisms of B-cell lymphoma, and offer potential new biomarkers and therapeutic targets for improving patient prognosis and treatment efficacy, thus holding great promise for advancing the field of lymphoma immunotherapy.
Materials and Methods
Study Subjects
This study included 140 patients with B-cell lymphoma who met the diagnostic criteria for hematopoietic and lymphoid neoplasms according to the WHO classification.7 Inclusion Criteria: (1) Patients diagnosed with B-cell lymphoma. (2) Age between 25 and 90 years. Exclusion Criteria: (1) Presence of autoimmune diseases. (2) Presence of other malignancies. (3) Coagulation disorders. (4) Active infection at enrollment; (5) Current immunosuppressive therapy; (6) Prior ICI treatment. All samples for flow cytometric and ELISA analyses were collected prior to the initiation of any systemic therapy. A total of 30 patients in the complete remission (CR) group and 41 in the relapsed/progressive group were analyzed for Tregs and IL-10 in peripheral blood. To exclude the impact of aggressive and indolent lymphoma on Tregs, we further analyzed the differences in Treg and IL-10 levels in peripheral blood between the CR and relapsed/progressive groups of indolent B-cell lymphoma (follicular lymphoma and marginal zone lymphoma) and diffuse large B-cell lymphoma (DLBCL) among the 71 samples. The CR and relapsed/progressive groups of indolent B-cell lymphoma included 12 patients each, while the CR and relapsed/progressive groups of DLBCL included 18 and 29 patients, respectively. This study was carried out in accordance with the World Medical Association’s Declaration of Helsinki guidelines on medical research involving human subjects. The study protocol was approved by the Ethics Committee of the Second Hospital of Dalian Medical University, and written informed consent was obtained from every participant (Table 1).
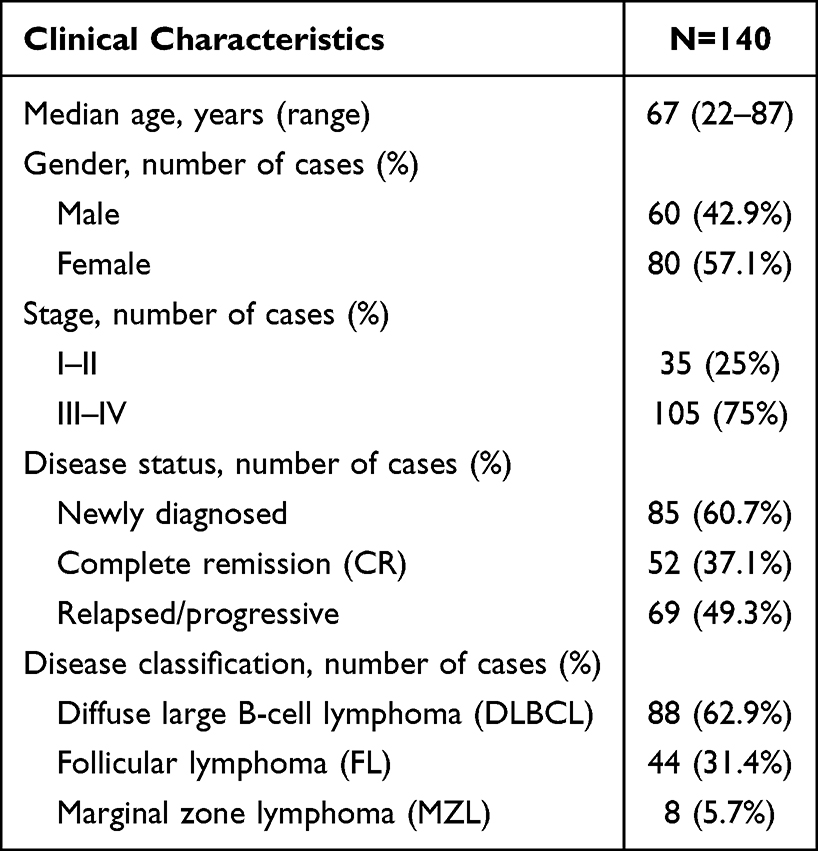 |
Table 1 Baseline Characteristics of Patients |
Flow Cytometry
Peripheral blood mononuclear cells were isolated from 4 mL EDTA-anticoagulated venous blood within 2 h of collection using Ficoll-Paque PLUS (Cytiva, Marlborough, MA, USA). Cells were stained at 4 °C for 30 min in the dark with fluorochrome-conjugated monoclonal antibodies against CD3 (clone SK7, PerCP; BD Biosciences, San Diego, CA, USA), CD4 (clone RPA-T4, APC; BD Biosciences), CD8 (clone SK1, PE; BD Biosciences), PD-1 (clone EH12.2H7, PE-Cy7; BioLegend, San Diego, CA, USA), CTLA-4 (clone BNI3, APC; BioLegend), LAG-3 (clone 11C3C65, PE; BioLegend) and TIM-3 (clone F38-2E2, FITC; BioLegend). After erythrocyte lysis with 1× ammonium chloride solution (BioLegend) for 15 min at room temperature, cells were washed twice in PBS containing 2% fetal bovine serum (Gibco, Grand Island, NY, USA) and acquired on a BD FACSCanto II flow cytometer calibrated daily with CS&T beads (BD Biosciences). The detailed gating hierarchy for lymphocyte populations is provided in Supplementary Figure S1. Data were analysed using FlowJo v10.8 (BD Biosciences). For regulatory T-cell enumeration, the identical procedure was followed except that the antibody panel targeted CD4, CD25 (clone BC96, PE-Cy7; BioLegend) and CD127 (clone A019D5, PE; BioLegend) and the erythrocyte lysis step employed a gentler 1000 g spin for 15 min, after which cells were resuspended in 300 µL buffer and events were collected for gating on CD4+CD25+CD127−/low Tregs.
Enzyme‑Linked Immunosorbent Assay (ELISA)
Plasma IL-10 concentrations were quantified in duplicate using the Human IL-10 Quantikine ELISA kit (R&D Systems, Minneapolis, MN, USA) according to the manufacturer’s protocol. Plasma was separated from 4mL fresh peripheral blood anticoagulated with EDTA or heparin by centrifugation at 300g for 5min and stored at −80°C until analysis. After reagent preparation, 100µL of IL-10 standards or appropriately diluted samples were loaded into duplicate wells of a 96-well microplate, sealed with adhesive film and incubated for 90min at 36°C. The plate was then uncovered, contents discarded and blotted dry, and each well was filled with wash buffer followed by a 20s rest and complete removal of liquid, a sequence repeated five times. One hundred microlitres of biotinylated anti-human IL-10 antibody was added to every well and the plate was incubated for 60min at 36°C, after which the wash cycle was repeated five times. Streptavidin–horseradish peroxidase conjugate (100µL) was dispensed into each well and the plate was incubated for 30min at 20–25°C, followed by another five washes. Substrate solution containing TMB (100 µL) was then added and the plate was kept in the dark at 20–25°C for 10–20min until colour development was optimal. The reaction was quenched with 50µL of stop solution and absorbance was read immediately at 450nm with a 540nm correction on a SpectraMax iD3 microplate reader (Molecular Devices, San José, CA, USA).
Statistical Analysis
Data analysis was performed using SPSS 25.0 software. Data that followed a normal distribution were analyzed using the t-test and expressed as mean ± standard deviation. Non-normally distributed data were analyzed using non-parametric tests and expressed as median (range). GraphPad Prism 9.5 software was used for data visualization. A p-value < 0.05 was considered statistically significant, with indicating p < 0.05, indicating p < 0.01, indicating p < 0.001, and indicating p < 0.0001. The absence of notation indicates p > 0.05, which is considered non-significant. The predictive performance of the scoring system was further evaluated and validated using receiver operating characteristic (ROC) curves, with the area under the curve (AUC) serving as the measure of performance. An AUC > 0.7 was considered indicative of good predictive performance.
Results
Analysis of Circulating T-Cell Immune Status in Patients with Newly Diagnosed B-Cell Lymphoma
Flow cytometry was used to assess the expression of PD-1, CTLA-4, LAG-3, and TIM-3 on peripheral blood CD4+ and CD8+ T cells in patients with newly diagnosed aggressive and indolent B-cell lymphoma. The results are shown in Table 2 and Figures 1, 2. Compared to the indolent group, patients with aggressive B-cell lymphoma exhibited significantly elevated expression levels of all assessed immune checkpoints on circulating CD4+ and CD8+ T cells. This was most pronounced for PD-1, which showed a marked increase in the aggressive group (Table 2). Similarly, the expression of CTLA-4, LAG-3, and TIM-3 was also significantly higher across both T cell subsets (for all comparisons, p < 0.05; see Table 2 for detailed data).
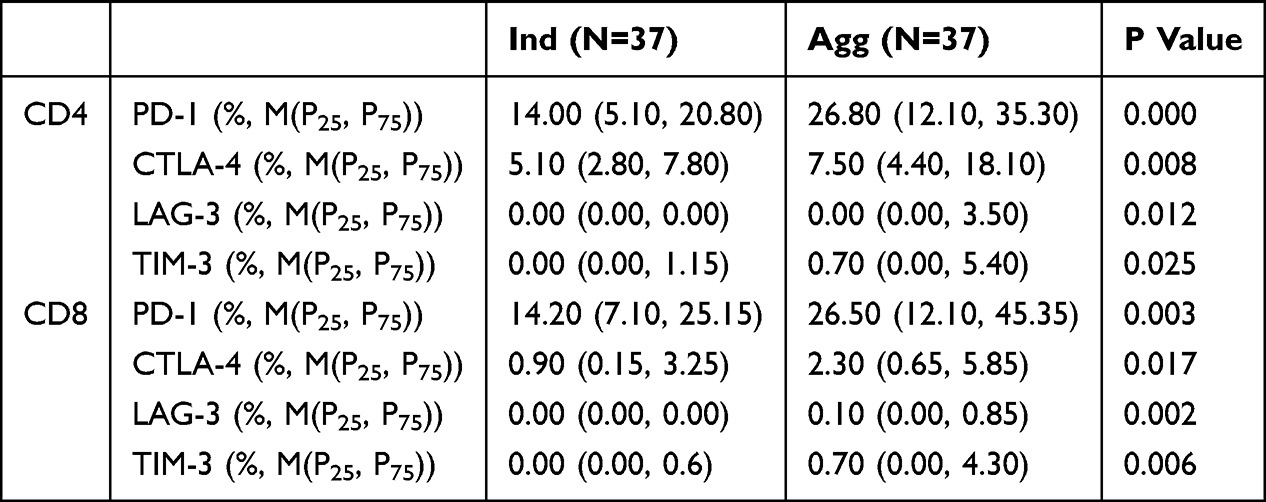 |
Table 2 Differences in Immune Checkpoint Molecule Expression on CD4+ and CD8+ T Cells Between Patients with Indolent and Aggressive Disease at Initial Diagnosis |
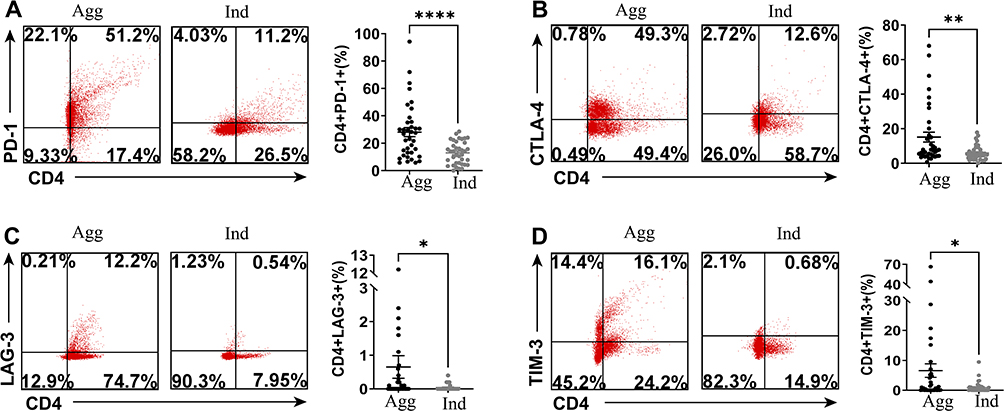 |
Figure 1 Assessment of Immune Checkpoint Molecule Expression on CD4+ T Cells in Patients with Aggressive and Indolent Disease at Initial Diagnosis. Peripheral blood from treatment-naïve patients with aggressive (Agg) or indolent (Ind) B-cell lymphoma was analyzed by flow cytometry for expression of (A) PD-1, (B) CTLA-4, (C) LAG-3, and (D) TIM-3 on CD4+ T cells. The left panels show representative flow cytometry dot plots. The right panels show scatter plots with bar graphs summarizing the expression levels. (Red: CD4+ T cells; *p < 0.05; **p < 0.01; ****p < 0.0001). Abbreviations: Agg, aggressive B-cell lymphoma; Ind, indolent B-cell lymphoma. |
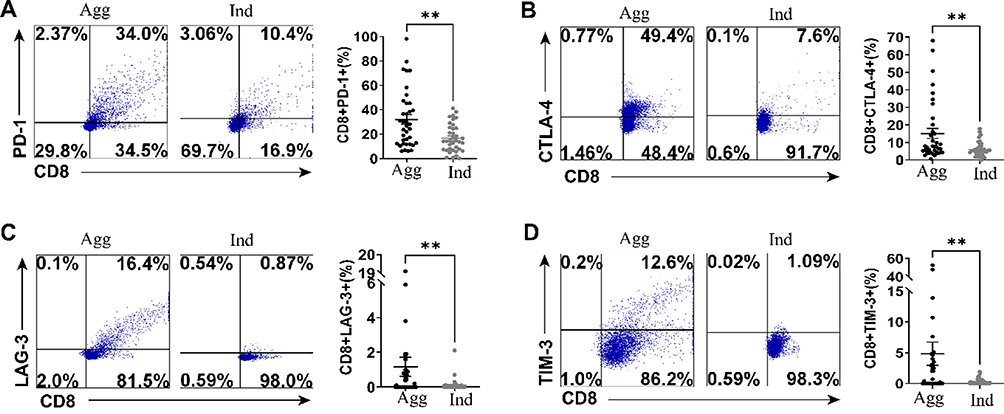 |
Figure 2 Assessment of Immune Checkpoint Molecule Expression on CD8+ T Cells in Patients with Aggressive and Indolent B-Cell Lymphoma at Initial Diagnosis. Peripheral blood from treatment-naïve patients with aggressive (Agg) or indolent (Ind) B-cell lymphoma was analyzed by flow cytometry for expression of (A) PD-1, (B) CTLA-4, (C) LAG-3, and (D) TIM-3 on CD8+ T cells. The left panels show representative flow cytometry dot plots. The right panels show scatter plots with bar graphs summarizing the expression levels. (Blue: CD8+ T cells; **p < 0.01). Abbreviations: Agg, aggressive B-cell lymphoma; Ind, indolent B-cell lymphoma. |
Analysis of Circulating T-Cell Immune Status in Patients with Newly Diagnosed B-Cell Lymphoma with or Without Extensive Involvement
Flow cytometry was used to assess the expression of PD-1, CTLA-4, LAG-3, and TIM-3 on peripheral blood CD4+ and CD8+ T cells in patients with newly diagnosed B-cell lymphoma who had either single/no extranodal involvement or multiple extranodal involvements. The results are shown in Table 3 and Figures 3, 4. Patients with multiple extranodal involvements exhibited a significant and consistent increase in the expression of all four immune checkpoints (PD-1, CTLA-4, LAG-3, and TIM-3) on both CD4+ and CD8+ T cells compared to those with single or no extranodal involvement (all p < 0.05). The detailed expression levels and statistical comparisons are provided in Table 3.
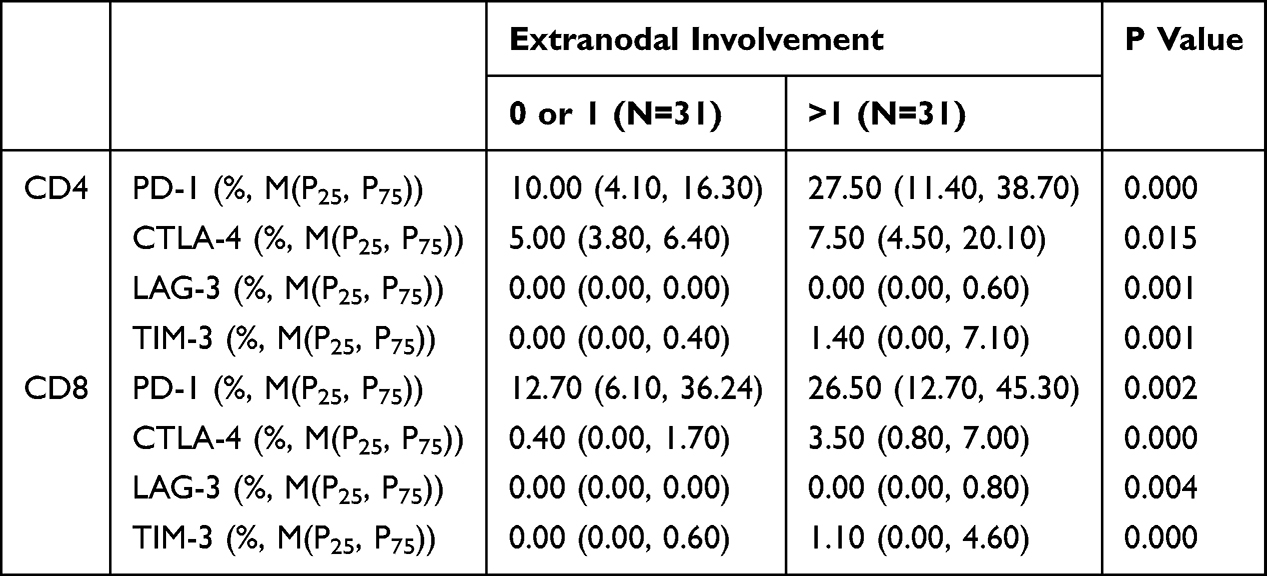 |
Table 3 Differences in Immune Checkpoint Molecule Expression on CD4+ and CD8+ T Cells Between Patients with Single/No Extranodal Involvement and Multiple Extranodal Involvement |
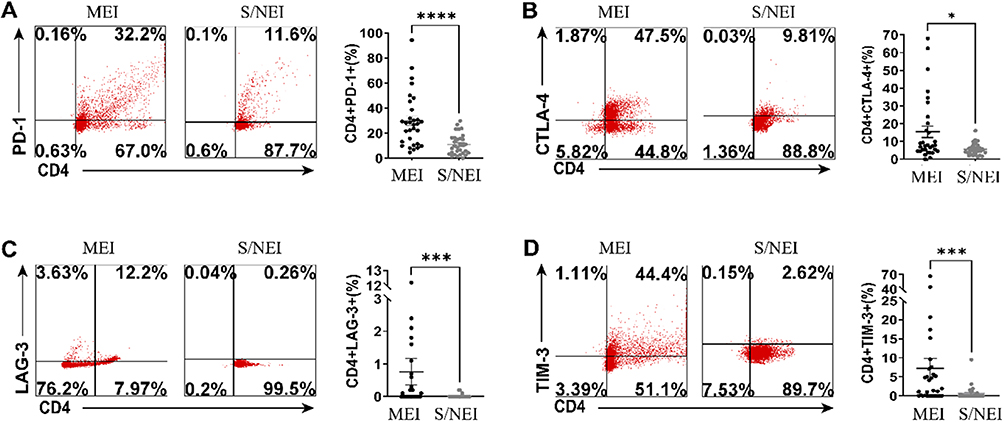 |
Figure 3 Assessment of Immune Checkpoint Molecule Expression on CD4+ T Cells in Patients with Single/No Extranodal Involvement and Multiple Extranodal Involvement at Initial Diagnosis. Flow cytometric analysis of (A) PD-1, (B) CTLA-4, (C) LAG-3, and (D) TIM-3 expression on peripheral blood CD4+ T cells from treatment-naïve B-cell lymphoma patients with single/no extranodal involvement (S/NEI) versus multiple extranodal involvement (MEI). Representative flow cytometry dot plots are shown on the left, with summary scatter plots on the right. MEI: multiple extranodal involvement in B-cell lymphoma. (Red: CD4+ T cells; *p < 0.05; ***p < 0.001; ****p < 0.0001). Abbreviation: S/NEI, single/no extranodal involvement in B-cell lymphoma. |
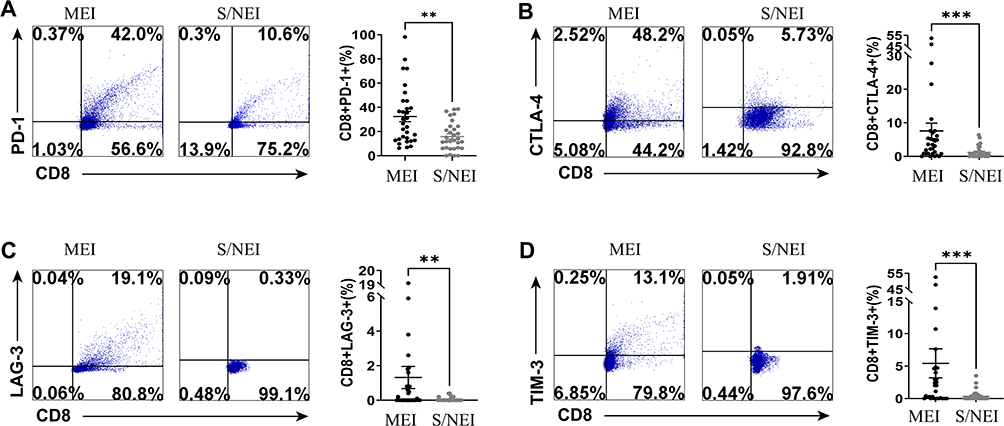 |
Figure 4 Assessment of Immune Checkpoint Molecule Expression on CD8+ T Cells in Patients with Single/No Extranodal Involvement and Multiple Extranodal Involvement at Initial Diagnosis. Flow cytometric analysis of (A) PD-1, (B) CTLA-4, (C) LAG-3, and (D) TIM-3 expression on peripheral blood CD8+ T cells from treatment-naïve B-cell lymphoma patients with single/no extranodal involvement (S/NEI) versus multiple extranodal involvement (MEI). Representative flow cytometry dot plots are shown on the left, with summary scatter plots on the right. (Blue: CD8+ T cells; **p < 0.01; ***p < 0.001). Abbreviations: MEI, multiple extranodal involvement in B-cell lymphoma; S/NEI, single/no extranodal involvement in B-cell lymphoma. |
Analysis of Circulating T-Cell Immune Status in Patients with Newly Diagnosed B-Cell Lymphoma with Good or Poor Prognosis
Flow cytometry was used to assess the expression of PD-1, CTLA-4, LAG-3, and TIM-3 on peripheral blood CD4+ and CD8+ T cells in patients who achieved complete remission (CR) and those with relapsed or progressive disease following treatment for B-cell lymphoma. The results are shown in Table 4 and Figures 5, 6. Compared to patients who achieved complete remission, those with relapsed or progressive disease exhibited significantly elevated expression of all assessed immune checkpoints on circulating CD4+ and CD8+ T cells. This was most pronounced for PD-1 and CTLA-4, which showed marked increases in the relapsed/progressive group (Table 4). Similarly, the expression of LAG-3 and TIM-3 was also significantly higher across both T cell subsets (for all comparisons, p < 0.05; see Table 4 for detailed data).
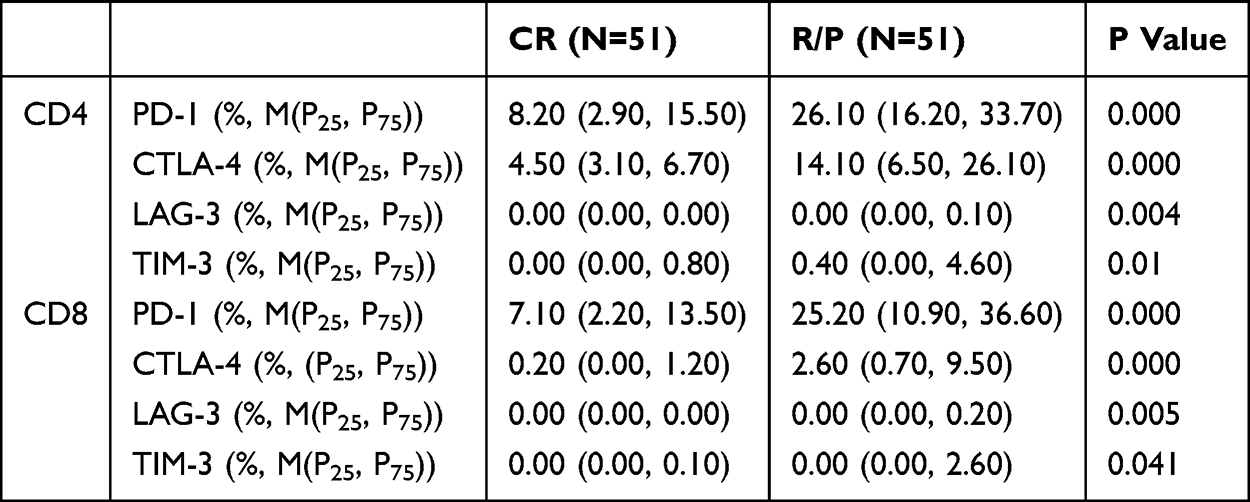 |
Table 4 Differences in Immune Checkpoint Molecule Expression on CD4+ and CD8+ T Cells Between Relapsed/Progressive and Complete Remission Patient Groups |
 |
Figure 5 Assessment of Immune Checkpoint Molecule Expression on CD4+ T Cells in Patients with Relapsed/Progressive and Complete Remission B-Cell Lymphoma. Peripheral blood CD4+ T cells from patients with relapsed/progressive (R/P) disease or complete remission (CR) were analyzed by flow cytometry for expression of (A) PD-1, (B) CTLA-4, (C) LAG-3, and (D) TIM-3. Representative flow cytometry dot plots are shown on the left, with summary data presented as scatter plots with bars on the right. (Red: CD4+ T cells; **p < 0.01; ****p < 0.0001). Abbreviations: R/P, relapsed/progressive B-cell lymphoma patients; CR, complete remission B-cell lymphoma. |
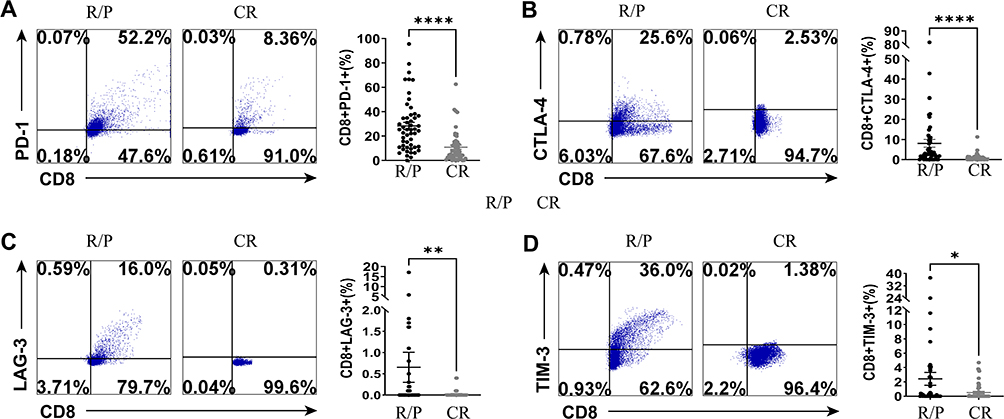 |
Figure 6 Assessment of Immune Checkpoint Molecule Expression on CD8+ T Cells in Patients with Relapsed/Progressive and Complete Remission B-Cell Lymphoma. Peripheral blood CD8+ T cells from patients with relapsed/progressive (R/P) disease or complete remission (CR) were analyzed by flow cytometry for expression of (A) PD-1, (B) CTLA-4, (C) LAG-3, and (D) TIM-3. Representative flow cytometry dot plots are shown on the left, with summary data presented as scatter plots with bars on the right. (Blue: CD8+ T cells; *p < 0.05; **p < 0.01; ****p < 0.0001). Abbreviations: R/P, relapsed/progressive B-cell lymphoma patients; CR, complete remission B-cell lymphoma. |
Validation of the Prognostic Prediction Efficacy of Immune Checkpoints in Patients with Newly Diagnosed B-Cell Lymphoma
To validate the prognostic prediction efficacy of immune checkpoints on circulating T lymphocytes in patients with newly diagnosed B-cell lymphoma, ROC curves were further constructed (Figure 7). The results showed that the areas under the curve (AUC) for PD-1, CTLA-4, LAG-3, and TIM-3 on CD4+ T cells were 0.859 (p < 0.001), 0.828 (p < 0.001), 0.625 (p = 0.03), and 0.634 (p = 0.019), respectively. For CD8+ T cells, the AUC values for PD-1, CTLA-4, LAG-3, and TIM-3 were 0.794 (p < 0.001), 0.767 (p < 0.001), 0.618 (p = 0.04), and 0.601 (p = 0.079), respectively. In summary, PD-1 and CTLA-4 on circulating T cells demonstrated good efficacy in predicting the prognosis of patients with B-cell lymphoma, while LAG-3 and TIM-3 on circulating T cells did not show good predictive efficacy.
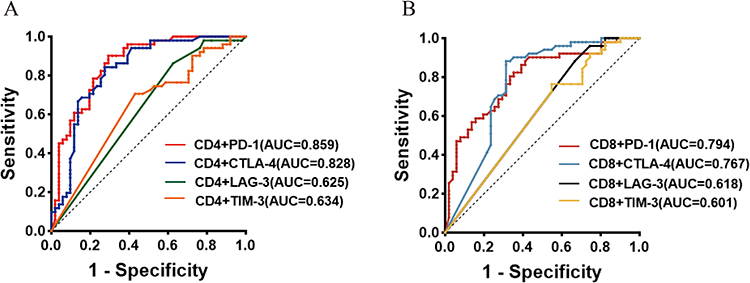 |
Figure 7 ROC Curves of Immune Checkpoint Molecule Expression on CD4+ and CD8+ T Cells in Patients with Relapsed/Progressive and Complete Remission B-Cell Lymphoma. (A) ROC curves for PD-1, CTLA-4, LAG-3, and TIM-3 expression on peripheral blood CD4+ T cells in patients with relapsed/progressive and complete remission B-cell lymphoma. (B) ROC curves for PD-1, CTLA-4, LAG-3, and TIM-3 expression on peripheral blood CD8+ T cells in patients with relapsed/progressive and complete remission B-cell lymphoma. |
Analysis of Circulating Tregs in Peripheral Blood of B-Cell Lymphoma Patients with Good or Poor Prognosis
Flow cytometry was used to measure the proportion of Tregs in peripheral blood of patients in the complete remission (CR) group and the relapsed/progressive group. As shown in Table 5. Comparison of Peripheral Blood Treg and IL-10 Levels Between Relapsed/Progressive and Complete Remission Patients Table 5 and Figure 8, the proportion of Tregs in peripheral blood was higher in the relapsed/progressive group than in the CR group [7.84 (4.59, 11.89)% vs 3.58 (2.74, 6.5)%, p < 0.0001]. To exclude the influence of aggressive and indolent lymphoma on Tregs, we further analyzed the proportion of Tregs in peripheral blood of patients with indolent B-cell lymphoma and diffuse large B-cell lymphoma (DLBCL) in both the CR and relapsed/progressive groups. Table 5 and Figure 8 show that the proportion of Tregs in peripheral blood was higher in the relapsed/progressive group of patients with indolent B-cell lymphoma compared to the CR group [10.81 (5.78, 15.33)% vs 3.72 (2.79, 6.16)%, p = 0.003]. Table 5 and Figure 8 show that the proportion of Tregs in peripheral blood was higher in the relapsed/progressive group of patients with DLBCL compared to the CR group [6.53 (4.24, 11.05)% vs 3.65 (2.79, 6.62)%, p = 0.015].
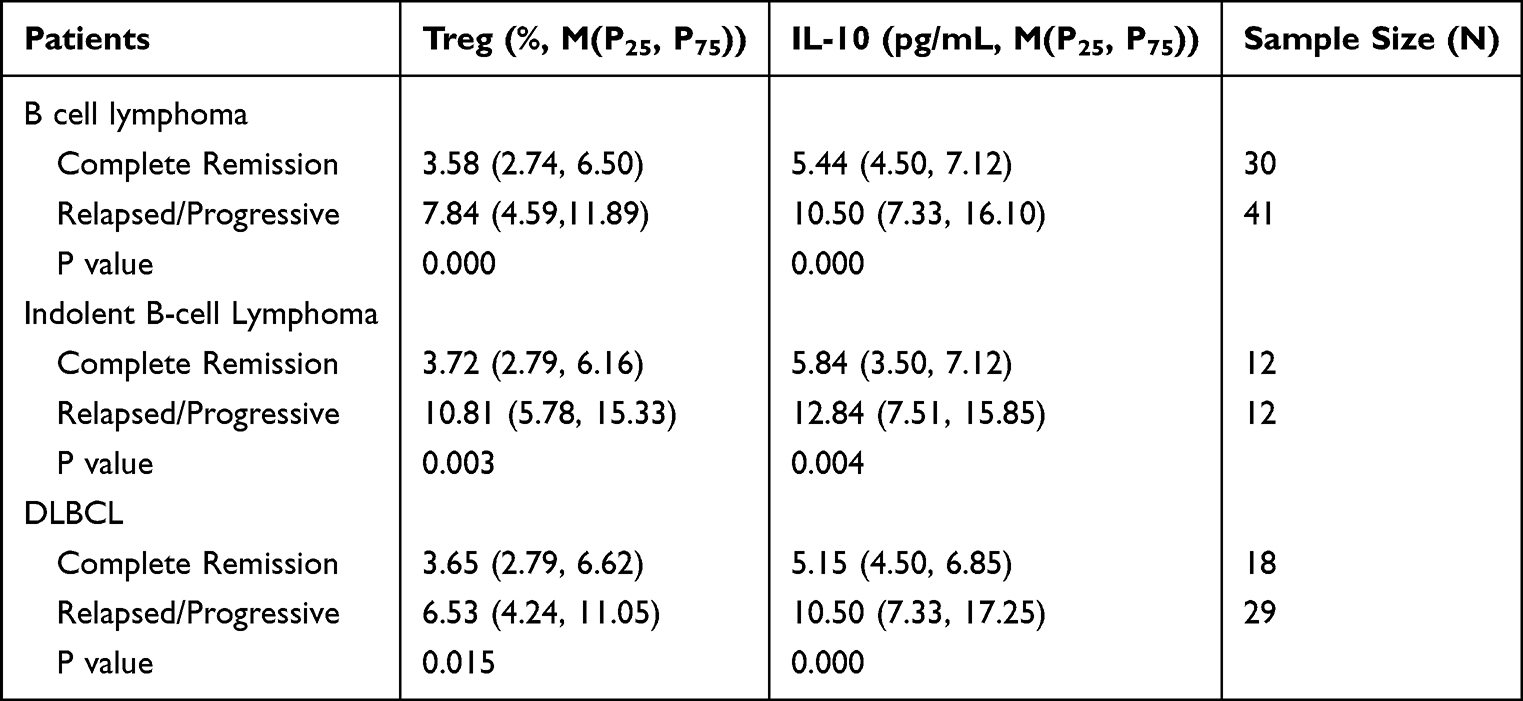 |
Table 5 Comparison of Peripheral Blood Treg and IL-10 Levels Between Relapsed/Progressive and Complete Remission Patients |
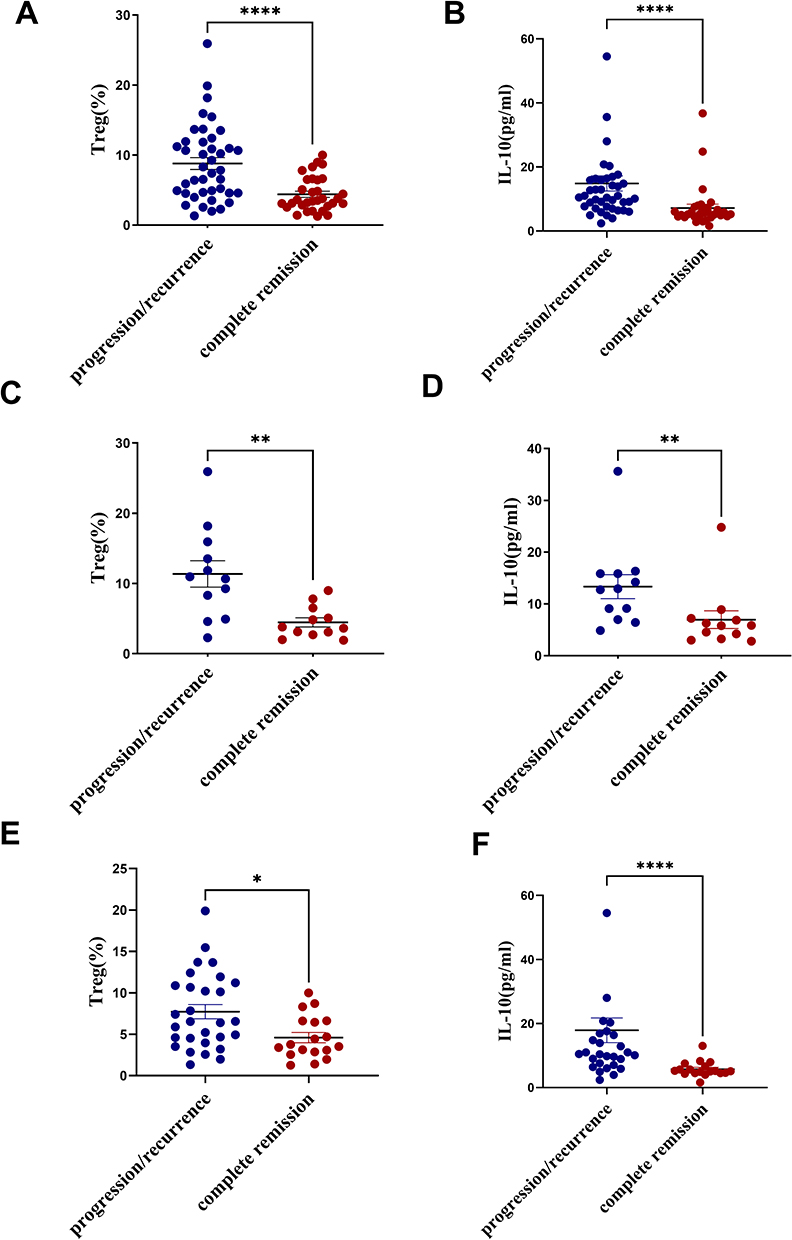 |
Figure 8 Determination of Treg and IL-10 in Peripheral Blood of Patients with B-Cell Lymphoma, Indolent B-Cell Lymphoma, and DLBCL in Progression/Relapse and Complete Remission. (A and B) Comparison of peripheral blood Treg and IL-10 in patients with relapsed-progressed (n=41) and complete remission (n=30); (C and D) Comparison of peripheral blood Treg and IL-10 in patients with relapsed-progressed (n=12) and complete remission (n=12) of Indolent B-cell Lymphoma; (E and F) Comparison of peripheral blood Treg and IL-10 in patients with relapsed-progressed (n=12) and complete remission of DLBCL (n=12) comparison of peripheral blood Treg and IL-10; *p < 0.05, **p < 0.01, ****p < 0.0001. |
Comparison of Peripheral Blood IL-10 Levels in B-Cell Lymphoma Patients with Good or Poor Prognosis
The levels of IL-10 in peripheral blood of patients in the CR group and the relapsed/progressive group were measured using ELISA. As shown in Table 5 and Figure 8, the concentration of IL-10 in peripheral blood was higher in the relapsed/progressive group than in the CR group [10.5 (7.33, 16.10) pg/mL vs 5.44 (4.5, 7.12) pg/mL, p < 0.0001]. To exclude the influence of aggressive and indolent lymphoma on IL-10, we further analyzed the concentration of IL-10 in peripheral blood of patients with indolent B-cell lymphoma and DLBCL in both the CR and relapsed/progressive groups. Table 5 and Figure 8 show that the concentration of IL-10 in peripheral blood was higher in the relapsed/progressive group of patients with indolent B-cell lymphoma compared to the CR group [12.84 (7.51, 15.85) pg/mL vs 5.84 (3.50, 7.12) pg/mL, p = 0.004]. Table 5 and Figure 8 show that the concentration of IL-10 in peripheral blood was higher in the relapsed/progressive group of patients with DLBCL compared to the CR group [10.5 (7.33, 17.25) pg/mL vs 5.15 (4.50, 6.85) pg/mL, p < 0.0001].
Correlation Analysis of Tregs, IL-10, and T-Cell Immune Status in Peripheral Blood of Patients with B-Cell Lymphoma
Spearman correlation analysis was performed on the levels of Tregs, IL-10, and immune checkpoint expression on T cells in the peripheral blood of patients with B-cell lymphoma (Figure 9). As shown in Table 6, Tregs were positively correlated with the expression of PD-1 on CD4+ T cells (correlation coefficient r = 0.539, p < 0.0001), while no significant correlations were observed between Tregs and other immune checkpoints (all p > 0.05). Similarly, IL-10 was positively correlated with the expression of PD-1 on CD4+ T cells (correlation coefficient r=0.457, p < 0.0001), with no significant correlations observed between IL-10 and other immune checkpoints (all p > 0.05).
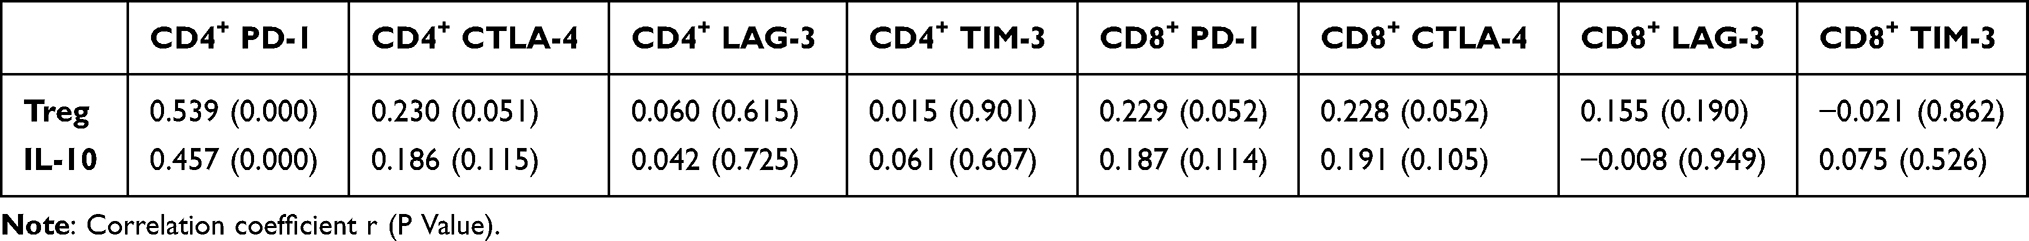 |
Table 6 Correlation of Treg, IL-10, and T Cell Immune Checkpoints Between Relapsed/Progressive and Complete Remission Patients (P Value) |
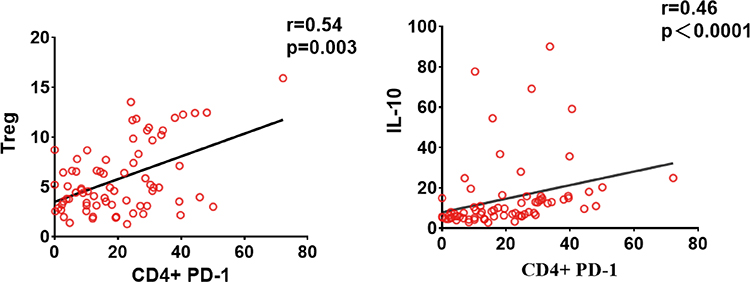 |
Figure 9 Correlation Analysis between CD4+ PD-1 and Treg, IL-10 in Patients with Recurrent/Progressive and Complete Remission B-Cell Lymphoma. |
Discussion
Our study provides compelling evidence that peripheral immune checkpoint expression on T cells correlates with Treg frequency, IL-10 levels, and clinical outcomes in B-cell lymphoma, revealing a critical immunosuppressive axis that drives disease progression. The findings not only underscore the prognostic significance of PD-1, CTLA-4, LAG-3, and TIM-3 but also elucidate a mechanistic link between T cell exhaustion, regulatory T cell expansion, and IL-10-mediated immune suppression. These insights advance our understanding of B-cell lymphoma pathogenesis and highlight potential therapeutic vulnerabilities that could be exploited to improve patient outcomes.
The elevated expression of immune checkpoints on circulating CD4+ and CD8+ T cells in aggressive B-cell lymphoma aligns with the growing recognition of T cell exhaustion as a hallmark of immune evasion in hematologic malignancies.8–13 Notably, PD-1 expression on CD4+ T cells was significantly higher in patients with aggressive disease (26.8% vs 14.0%, p < 0.001) and those with multiple extranodal involvements (27.5% vs 10.0%, p < 0.001), reinforcing its association with advanced disease biology. This observation is consistent with prior studies in DLBCL, where PD-1 and TIM-3 upregulation correlated with high-risk features such as B symptoms and elevated LDH.14 Our data extend these findings by demonstrating that peripheral immune checkpoint expression mirrors tumor microenvironment exhaustion, offering a minimally invasive biomarker for risk stratification.
The tumor microenvironment (TME) in B-cell lymphoma consists of cellular components and immunosuppressive molecules that collectively facilitate tumor immune escape. Both Tregs and tumor cells secrete IL-10, which promotes PD-L1 expression on tumor cells and contributes to T cell exhaustion. The IL-10/IL-10R pathway is also significant—IL-10R is upregulated on PD-1high CD8+ T cells, and IL-10 can induce apoptosis of antigen-specific PD-1high CD8+ T cells. Dual IL-10R/PD-1 blockade enhances the expansion and function of tumor-specific CD8+ T cells.15,16
To clarify the role of immune checkpoints in B-cell lymphoma, we analyzed correlations among peripheral Treg frequency, IL-10 levels, and checkpoint expression. Treg frequency positively correlated with PD-1 on CD4+ T cells (r = 0.539, p < 0.0001), as did IL-10 levels (r = 0.457, p < 0.0001). No other significant correlations were detected. Based on these findings and existing literature, we propose a model: tumor-derived IL-10 activates JAK2/STAT3 signaling and upregulates PD-L1. PD-L1/PD-1 interaction may drive CD4+ T cell exhaustion and contribute to their differentiation into Tregs,17 which in turn secrete more IL-10, perpetuating a feed-forward loop that exacerbates T cell exhaustion and tumor proliferation (Figure 10).18–20 Schematic representation of the experimental approach and the proposed PD-1/Treg/IL-10 regulatory network is provided in Figure 11. Thus, Tregs, IL-10, and immune checkpoints appear to interact to suppress antitumor immunity and facilitate immune escape in B-cell lymphoma. Building upon our previous discovery of IL-10-mediated PD-L1 upregulation in DLBCL through BCR-NFATc1/STAT3 signaling,20 the current findings clinically validate this axis and identify PD-1+ CD4+ T cells as master regulators of tumor-associated immunosuppression.
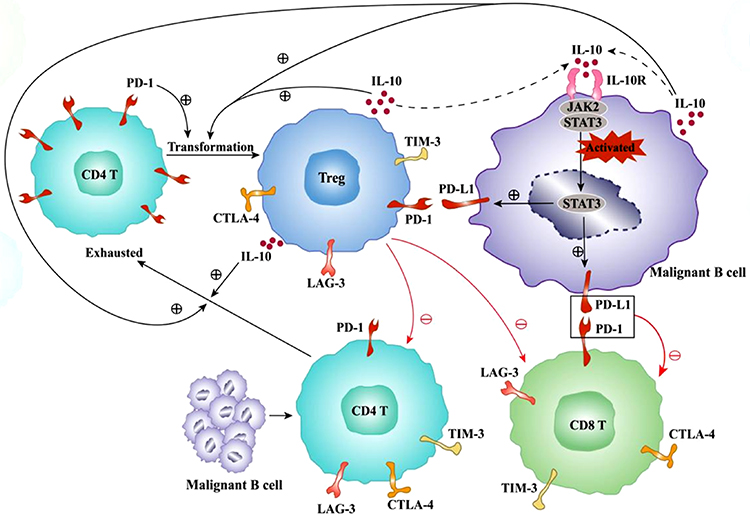 |
Figure 10 Schematic Diagram of the Abnormal Network Regulatory Mechanism in the Tumor Microenvironment of B-Cell Lymphoma Patients. Both tumor cells and Tregs can secrete IL-10, which binds to IL-10R on the surface of tumor cells, activating the JAK2/STAT3 pathway to promote tumor cell proliferation and induce the expression of PD-L1 on their surface. Our study found that the expression level of PD-1 on peripheral blood CD4+ T cells was positively correlated with the levels of Tregs and IL-10. It can be inferred that the secretion of IL-10 by tumor cells promotes the expression of PD-L1 on their surface. The binding of PD-L1 on tumor cells to PD-1 on CD4+ T cells induces the exhaustion of CD4+ T cells and promotes the transformation of CD4+ T cells into Treg cells. Tregs can also secrete a large amount of IL-10, activating the JAK2/STAT3 pathway in tumor cells to induce tumor cell proliferation and further depletion of the immune microenvironment, thereby further exhausting CD4+ T and CD8+ T cells. This illustrates the immune network regulatory mechanism of exhausted cells and cytokines in the immune microenvironment of B-cell lymphoma tumors. |
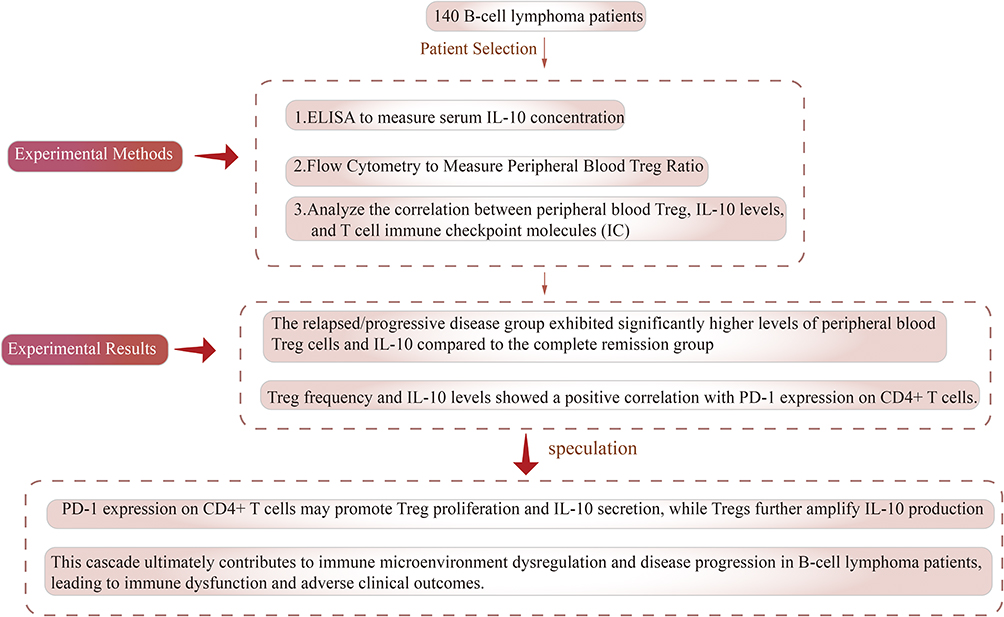 |
Figure 11 Schematic Diagram of the Experimental Process and Conclusions on the Correlation Analysis of Treg, Cytokine Effector Factors, and Circulating T Cell Immune Status in B-Cell Lymphoma Patients. |
The prognostic implications of our data are particularly striking. Patients with relapsed or progressive disease exhibited significantly higher PD-1 and CTLA-4 expression on both CD4+ and CD8+ T cells compared to those in complete remission (p < 0.001). ROC analysis further confirmed the robust predictive value of PD-1 and CTLA-4 (AUC > 0.7), suggesting their utility as dynamic biomarkers for monitoring treatment response and early relapse detection. These results complement emerging evidence that immune checkpoint expression in peripheral blood may serve as a surrogate for tumor microenvironment exhaustion, offering a practical tool for clinical decision-making.
The interplay between Tregs, IL-10, and immune checkpoints also has important therapeutic implications. While PD-1 blockade has shown promise in B-cell lymphoma, response rates remain suboptimal, likely due to compensatory immunosuppressive mechanisms.15 Our data suggest that dual targeting of PD-1 and IL-10/IL-10R signaling could disrupt the immunosuppressive feedback loop, potentially enhancing T cell function and improving clinical outcomes. Preclinical studies support this approach, demonstrating that IL-10R blockade synergizes with anti-PD-1 therapy to reinvigorate exhausted CD8+ T cells.21 Similarly, strategies to deplete or inhibit Tregs (eg, anti-CCR4 antibodies) may further augment checkpoint inhibition by mitigating IL-10-mediated suppression.18,19,22 Despite these advances, several questions remain unresolved. This study reveals that LAG-3/TIM-3 expression correlates with IL-10 deficiency and exhibits limited prognostic predictive value in peripheral blood (as demonstrated by ROC and correlation analyses), suggesting that immune checkpoint molecules may play distinct roles. PD-1/CTLA-4 may dominate systemic T-cell exhaustion, while LAG-3/TIM-3 functions are likely confined to the tumor microenvironment, exerting localized effects. Future single-cell analysis and spatial transcriptomics profiling will aid in deciphering these compartmentalized interactions. Additionally, our study’s retrospective design necessitates validation in larger, prospective cohorts, particularly to explore subtype-specific differences in indolent versus aggressive lymphomas.
In conclusion, our work delineates a critical role for the PD-1/Treg/IL-10 axis in B-cell lymphoma immune evasion, providing a mechanistic foundation for biomarker-driven immunotherapy. By linking peripheral immune checkpoint expression to tumor microenvironment dysregulation, we offer a roadmap for integrating liquid biopsy approaches with targeted therapeutic strategies. Future studies exploring combinatorial regimens that simultaneously target checkpoint inhibition, Treg activity, and IL-10 signaling may provide a promising new avenue to improve immune control in this challenging disease.
Conclusions
Our study elucidates a critical mechanistic link between peripheral immune checkpoint expression, Tregs, IL-10, and disease progression in B-cell lymphoma, offering profound clinical implications for prognosis and therapeutic strategies. We demonstrate that elevated expression of PD-1, CTLA-4, LAG-3, and TIM-3 on circulating CD4+ and CD8+ T cells correlates with aggressive disease features, including advanced-stage lymphoma, extranodal involvement, and poor treatment outcomes. Notably, PD-1 on CD4+ T cells exhibits a strong positive association with Treg proportions and IL-10 levels, suggesting a feedback loop wherein PD-1 signaling may contribute to Treg expansion and IL-10 secretion, further exacerbating immune suppression and tumor progression via the JAK2/STAT3 pathway. These findings underscore the potential of peripheral immune checkpoints as non-invasive biomarkers for risk stratification and early detection of disease relapse. The robust predictive performance of PD-1 and CTLA-4 highlights their utility in monitoring therapeutic response and guiding personalized immunotherapy. Moreover, our data advocate for dual targeting of PD-1 and IL-10/IL-10R pathways to disrupt this immunosuppressive axis, offering a novel combinatorial approach to enhance the efficacy of immune checkpoint blockade in B-cell lymphoma.
By unraveling the interplay between immune exhaustion, Tregs, and IL-10, this study contributes to the growing understanding of immune evasion mechanisms in this disease and paves the way for translational innovations. Future clinical trials should validate these biomarkers in larger cohorts and explore therapeutic interventions that concurrently modulate checkpoint molecules and cytokine networks to improve patient outcomes. Our work positions peripheral immune profiling as a cornerstone for precision medicine in B-cell malignancies, with direct relevance to clinical practice and drug development.
Author Contributions
Bing Pan, Sijia Li and Ruyu Ye share the first authorship. All authors made a significant contribution to the work reported, whether that is in the conception, study design, execution, acquisition of data, analysis and interpretation, or in all these areas; took part in drafting, revising or critically reviewing the article; gave final approval of the version to be published; have agreed on the journal to which the article has been submitted; and agree to be accountable for all aspects of the work.
Disclosure
The authors declare that they have no known competing financial interests or personal relationships that could have appeared to influence the work reported in this paper.
An abstract of this study was presented at the 67th Annual Meeting & Exposition of the American Society of Hematology (ASH) as an online abstract presentation with interim findings. The abstract was published in “Blood” as part of the conference proceedings: “Peripheral immune checkpoints predict prognosis and reveal PD-1/Treg/IL-10 crosstalk in B-cell lymphoma.” Blood 2025; 146 (Supplement 1): Abstract 622. https://doi.org/10.1182/blood-2025-7088.
References
1. Zhu MY, Liu WJ, Wang H, Wang WD, Liu NW, Lu Y. NSE from diffuse large B-cell lymphoma cells regulates macrophage polarization. Cancer Manage Res. 2019;11:4577–4595. doi:10.2147/CMAR.S203010
2. Guo Z, Zhang R, Yang AG, Zheng G. Diversity of immune checkpoints in cancer immunotherapy. Front Immunol. 2023;14:1121285. doi:10.3389/fimmu.2023.1121285
3. Chen Y, Zhang H. Immune microenvironment and immunotherapy for chordoma. Front Oncol. 2024;14:1374249. doi:10.3389/fonc.2024.1374249
4. DeRogatis JM, Viramontes KM, Neubert EN, Tinoco R. PSGL-1 Immune Checkpoint Inhibition for CD4(+) T Cell Cancer Immunotherapy. Front Immunol. 2021;12:636238. doi:10.3389/fimmu.2021.636238
5. Li S, Pan Y, Ye R, Wang Y, Li L. Immune checkpoints in B-cell Lymphoma: still an Unmet challenge from basic research to clinical practice. Int Immunopharmacol. 2025;146:113717. doi:10.1016/j.intimp.2024.113717
6. Anderson AC, Joller N, Kuchroo VK. Lag-3, Tim-3, and TIGIT: co-inhibitory receptors with specialized functions in immune regulation. Immunity. 2016;44(5):989–1004. doi:10.1016/j.immuni.2016.05.001
7. Campo E, Swerdlow SH, Harris NL, Pileri S, Stein H, Jaffe ES. The 2008 WHO classification of lymphoid neoplasms and beyond: evolving concepts and practical applications. Blood. 2011;117(19):5019–5032. doi:10.1182/blood-2011-01-293050
8. McLane LM, Abdel-Hakeem MS, Wherry EJ. CD8 T cell exhaustion during chronic viral infection and cancer. Ann Rev Immunol. 2019;37:457–495. doi:10.1146/annurev-immunol-041015-055318
9. Potter DA, Herrera-Ponzanelli CA, Hinojosa D, et al. Recent advances in neoadjuvant therapy for breast cancer. Fac Rev. 2021;10:2. doi:10.12703/r/10-2
10. Huang S, Zhao Y, Lai W, et al. Higher PD-1/Tim-3 expression on IFN-γ+ T cells is associated with poor prognosis in patients with acute myeloid leukemia. Cancer Biol Ther. 2023;24(1):2278229. doi:10.1080/15384047.2023.2278229
11. Liao Z, Yao H, Wei J, et al. Development and validation of the prognostic value of the immune-related genes in clear cell renal cell carcinoma. Transl Androlo Urol. 2021;10(4):1607–1619. doi:10.21037/tau-20-1348
12. Liu S, Wang F, Tan W, et al. CTLA4 has a profound impact on the landscape of tumor-infiltrating lymphocytes with a high prognosis value in clear cell renal cell carcinoma (ccRCC). Cancer Cell Int. 2020;20:519. doi:10.1186/s12935-020-01603-2
13. Hu J, Han C, Zhong J, et al. Dynamic network biomarker of pre-exhausted CD8(+) T cells contributed to T cell exhaustion in colorectal cancer. Front Immunol. 2021;12:691142. doi:10.3389/fimmu.2021.691142
14. Zhang L, Du H, Xiao TW, et al. Prognostic value of PD-1 and TIM-3 on CD3+ T cells from diffuse large B-cell lymphoma. Biomed Pharmacother. 2015;75:83–87. doi:10.1016/j.biopha.2015.08.037
15. Sun Z, Fourcade J, Pagliano O, et al. IL10 and PD-1 cooperate to limit the activity of tumor-specific CD8+ T cells. Cancer Res. 2015;75(8):1635–1644. doi:10.1158/0008-5472.CAN-14-3016
16. Ascierto PA, Grimaldi AM, Anderson AC, et al. Future perspectives in melanoma research: meeting report from the “Melanoma Bridge”, Napoli, December 5th–8th 2013. J Transl Med. 2014;12:277. doi:10.1186/s12967-014-0277-z
17. Bohlen H, Kessler M, Sextro M, Diehl V, Tesch H. Poor clinical outcome of patients with Hodgkin’s disease and elevated interleukin-10 serum levels. Clinical significance of interleukin-10 serum levels for Hodgkin’s disease. Ann Hematol. 2000;79(3):110–113. doi:10.1007/s002770050564
18. Kumar S, Singh SK, Rana B, Rana A. Tumor-infiltrating CD8(+) T cell antitumor efficacy and exhaustion: molecular insights. Drug Discov Today. 2021;26(4):951–967. doi:10.1016/j.drudis.2021.01.002
19. Camisaschi C, Casati C, Rini F, et al. LAG-3 expression defines a subset of CD4(+)CD25(high)Foxp3(+) regulatory T cells that are expanded at tumor sites. J Immunol. 2010;184(11):6545–6551. doi:10.4049/jimmunol.0903879
20. Li L, Zhang J, Chen J, et al. B-cell receptor-mediated NFATc1 activation induces IL-10/STAT3/PD-L1 signaling in diffuse large B-cell lymphoma. Blood. 2018;132(17):1805–1817. doi:10.1182/blood-2018-03-841015
21. Ascierto PA, Atkins M, Bifulco C, et al. Future perspectives in melanoma research: meeting report from the “Melanoma Bridge”: Napoli, December 3rd–6th 2014. J Transl Med. 2015;13:374. doi:10.1186/s12967-015-0736-1
22. White AM, Wraith DC. Tr1-like T cells - an enigmatic regulatory T cell lineage. Front Immunol. 2016;7:355. doi:10.3389/fimmu.2016.00355
 © 2025 The Author(s). This work is published and licensed by Dove Medical Press Limited. The
full terms of this license are available at https://www.dovepress.com/terms
and incorporate the Creative Commons Attribution
- Non Commercial (unported, 4.0) License.
By accessing the work you hereby accept the Terms. Non-commercial uses of the work are permitted
without any further permission from Dove Medical Press Limited, provided the work is properly
attributed. For permission for commercial use of this work, please see paragraphs 4.2 and 5 of our Terms.
© 2025 The Author(s). This work is published and licensed by Dove Medical Press Limited. The
full terms of this license are available at https://www.dovepress.com/terms
and incorporate the Creative Commons Attribution
- Non Commercial (unported, 4.0) License.
By accessing the work you hereby accept the Terms. Non-commercial uses of the work are permitted
without any further permission from Dove Medical Press Limited, provided the work is properly
attributed. For permission for commercial use of this work, please see paragraphs 4.2 and 5 of our Terms.