Back to Journals » Clinical Interventions in Aging » Volume 18
Field-Based Estimates of Muscle Quality Index Determine Timed-Up-and-Go Test Performance in Obese Older Women
Authors Neto IVDS ![]() , Diniz JDS, Alves VP
, Diniz JDS, Alves VP ![]() , Ventura Oliveira AR
, Ventura Oliveira AR ![]() , Barbosa MPDS
, Barbosa MPDS ![]() , da Silva Prado CR, Alencar JA
, da Silva Prado CR, Alencar JA ![]() , Vilaça e Silva KHC, Silva CR, Lissemerki Ferreira GM
, Vilaça e Silva KHC, Silva CR, Lissemerki Ferreira GM ![]() , Garcia D, Grisa RA
, Garcia D, Grisa RA ![]() , Prestes J
, Prestes J ![]() , Rodrigues Melo GL
, Rodrigues Melo GL ![]() , Burmann LL
, Burmann LL ![]() , Gomes Giuliani FN, Beal FLR, Severiano AP, Nascimento DDC
, Gomes Giuliani FN, Beal FLR, Severiano AP, Nascimento DDC ![]()
Received 20 December 2022
Accepted for publication 13 February 2023
Published 22 February 2023 Volume 2023:18 Pages 293—303
DOI https://doi.org/10.2147/CIA.S399827
Checked for plagiarism Yes
Review by Single anonymous peer review
Peer reviewer comments 2
Editor who approved publication: Dr Maddalena Illario
Ivo Vieira de Sousa Neto,1 Joyce de Sousa Diniz,2 Vicente Paulo Alves,2 Alessandra Ribeiro Ventura Oliveira,2 Monica Palermo de Souza Barbosa,2 Carla Regina da Silva Prado,2 Jaqueline Alves Alencar,2 Karla Helena Coelho Vilaça e Silva,2 Cristiane Rocha Silva,3 Gleison Miguel Lissemerki Ferreira,3 Danielle Garcia,3 Roberto A Grisa,3 Jonato Prestes,3 Geiziane Leite Rodrigues Melo,3 Larissa Lauda Burmann,2 Fernanda Nelli Gomes Giuliani,2 Fabiani Lage Rodrigues Beal,2 Andréa Paula Severiano,2 Dahan da Cunha Nascimento3
1School of Physical Education and Sport of Ribeirão Preto, University of São Paulo (USP), São Paulo, Brazil; 2Department of Gerontology, Catholic University of Brasilia, UCB, Brasília, DF, Brazil; 3Department of Physical Education, Catholic University of Brasilia (UCB), Brasília, Brazil
Correspondence: Dahan da Cunha Nascimento, Programa de Pós-Graduação Stricto Sensu em Educação Física, Universidade Católica de Brasília – Q.S. 07, Lote 01, EPTC – Bloco G. Zip code: 71966-700 – Distrito Federal, Brasilia, Brazil, Tel/Fax +21/55/61 3356 9350, Email [email protected]
Objective: The muscle quality index (MQI) is associated with numerous health outcomes in adults; however, the effects of distinct MQI on functional capacity in obese older women have not yet been fully investigated. Thus, we investigated the contribution of different muscle quality indices on TUG performance prediction in obese older women. We secondarily evaluated the association between MQI, aerobic capacity performance (Treadmill performance and 6-minute walk test), and obesity indices (BMI, body fat percentage, and neck, waist, and hip circumference).
Methods: Participants included 64 obese older women (mean age 67.05 ± 5.46 years, body fat ≥ 35%). General anthropometric, health history, body composition, treadmill exercise, and functional test (Time up and go) measures were collected. A hydraulic dynamometer was used to assess muscle strength, and Dual Energy X-ray Absorptiometry (DXA) to identify body fat percentage. The field MQI was defined as the highest reading divided by the subject’s body mass index (BMI), while the laboratory MQI was obtained by the ratio of grip strength to the entire arm muscle in kilograms measured by DXA. A hierarchical multiple regression was performed to predict TUG-test performance.
Results: An increase in field MQI of one unit is associated with a decrease of 2.59 seconds in the TUG test (β = − 0.540; p = 0.004). There was no association between laboratory MQI and TUG performance (β = 0.067; p = 0.712). Furthermore, field MQI displays a positive correlation (p < 0.05) with aerobic capacity performance (6-minute walk test and peak O2 consumption) and a negative correlation (p < 0.05) with diverse obesity indices (neck and waist circumference, body fat, and BMI).
Conclusion: MQI displayed an important prediction with TUG-test, a positive correlation with aerobic capacity, and a negative correlation with obesity indices.
Keywords: muscle quality, aging, functional capacity, obesity, muscle mass, sarcopenia
Introduction
Populations in several countries are aging, and this demographic transition will substantially impact public health and medicine. Senescence is an irreversible process, described by morphofunctional changes in all physiological systems.1 Progressive deterioration of neuromuscular apparatus is among the harmful changes over time, worsening the life expectancy, overall health status, and functional characteristics of living.2 In particular, the occurrence of low muscle mass is expected to be between 8 and 40%, varying among the people investigated and the procedures applied to detect the sarcopenia process.3 In addition, muscle strength can reduce by around 12–15% every 10 years after an individual reaches the age of 50, potentially contributing to physical frailty, loss of autonomy, and poor quality of life.4,5 Hence, there is a vital need to understand the critical factors that determine functional ability during aging to create protective strategies and therapies.
The timed-up-and-go (TUG) test has been shown to be a critical validated instrument to assess physical capabilities during aging.6,7 Interestingly, this inexpensive, easy, and quick-to-perform instrument presented a strong correlation with gait speed, balance, risk of falls, hospitalization, and other functional tests, including hand grip strength.8–10 The TUG may be a valuable clinical tool to evaluate fundamental independence. Interestingly, Coelho Junior et al found that the variability in TUG was explained by lower limb muscle strength or power, mobility, and balance.5 This viewpoint is corroborated by Nur et al who demonstrated that muscle strength was a key predictor of TUG performance in older adults with knee osteoarthritis.2 More recently, it was observed that lower contractile properties of all quadriceps muscle components are correlated with TUG scores in older women.11
Despite the interesting findings, the previous investigations did not precisely evaluate how much muscle quantity or body mass and composition can affect the functional assessment. Older individuals with muscle or fat mass variability may not be capable of generating equal amounts of force production, consequently influencing TUG performance.12 In this scenario, muscle quality (MQ) may be an important biomarker of muscle health, because it normalizes the amount of strength per muscle unit or body mass.13 Previous studies showed that different muscle quality indices (MQI) are stronger predictors of muscle performance than Body mass index (BMI), muscle thickness, or strength alone.12 A low MQI is considered a useful predictor of adverse health events, gait disorders, and fatigue in older populations. For instance, MQI was a stronger independent predictor of lower extremity physical function than aerobic fitness and fat mass, which makes it a relevant measure for older adults with obesity.14 Therefore, MQ could help health professionals design better rehabilitation programs to enhance independence in the aging population.15
In applied research settings, field-based estimates of MQI (dividing handgrip strength by upper limb muscle mass, body weight, or BMI) provide a similar prediction for mobility and lower extremity performance in community-dwelling older adults when compared to the most expensive method to determine MQI (eg, laboratory, normalized by lean mass through dual-energy x-ray (DXA)).16 In our laboratory, we observed a strong correlation effect between field MQI and laboratory MQI in octogenarians, which highlights the importance of simpler measures.17 Also, knee extensor muscle strength measurements with one repetition maximum (RM) and dynamometers that can provide different MQI is limited by the need for special equipment.18–20 In this regard, grip strength is an accurate and quick global strength method, making it a feasible way to assess the overall health status of older adults.21 Furthermore, from a practical standpoint, hand grip strength may be an inexpensive and preferable metric in long-term analysis to identify individuals at risk of functional decline.10,22 However, there are limited data on the influence of field MQI on functional capacity in obese older women. Consequently, little is known about the effects of distinct MQI on TUG scores.
Understanding the predictors of TUG is relevant to assess the need for assistance, care, and support for older adults. In addition, it may have great relevance in self-rated health, mainly when individuals are matched with other persons of the same age. This assessment is particularly important because functional impairment can clarify chronic disease incidence, polypharmacy, and, particularly, sedentary behavior. Handgrip strength and the TUG test were strong and independent predictors of short-term mortality; these objective indicators can explain the vulnerability, disabilities, and physical limitations, as well as premature death among older adults.23 The availability of a noninvasive method of MQI that is accessible and sensitive could deliver attractive insights for practical diagnostics of musculoskeletal health attached to aging.
Thus, the innovative purpose of the present study was to investigate the contribution of different muscle quality indices on TUG performance prediction in obese older women. We secondarily evaluated the association between muscle quality indices, aerobic capacity performance (Treadmill stress test and 6-minute walk test), and obesity indices (BMI, body fat percentage, and neck, waist, and hip circumference).
Methods
Subjects
One hundred fifty-seven obese older women from a community in the Federal District, Brazil, were assessed for eligibility. To be eligible for participation in this study, the women were required to be aged 60–100 years with body fat percentages ≥ 35%, as assessed by dual-energy x-ray absorptiometry (DEXA). Of those initially assessed, 93 were excluded (did not meet inclusion criteria for body fat percentage), leaving 64 participants who met the inclusion criteria.24 These women were not precisely representative of the Brazilian population and were recruited on a voluntary basis through posters and lectures about the study. Subjects were interviewed and responded to a medical history questionnaire (past medical history, cardiac risk factors, previous cardiac events and procedures, and osteoarticular disorders), underwent anthropometric measures, and answered a questionnaire about lifestyle information and use of medications. Subjects were classified as hypertensive according to diagnostic criteria used in previous studies and diabetes was defined as the documented prescription of insulin or other hypoglycemic medications. Characteristics of the study subjects are presented in Table 1.25–27
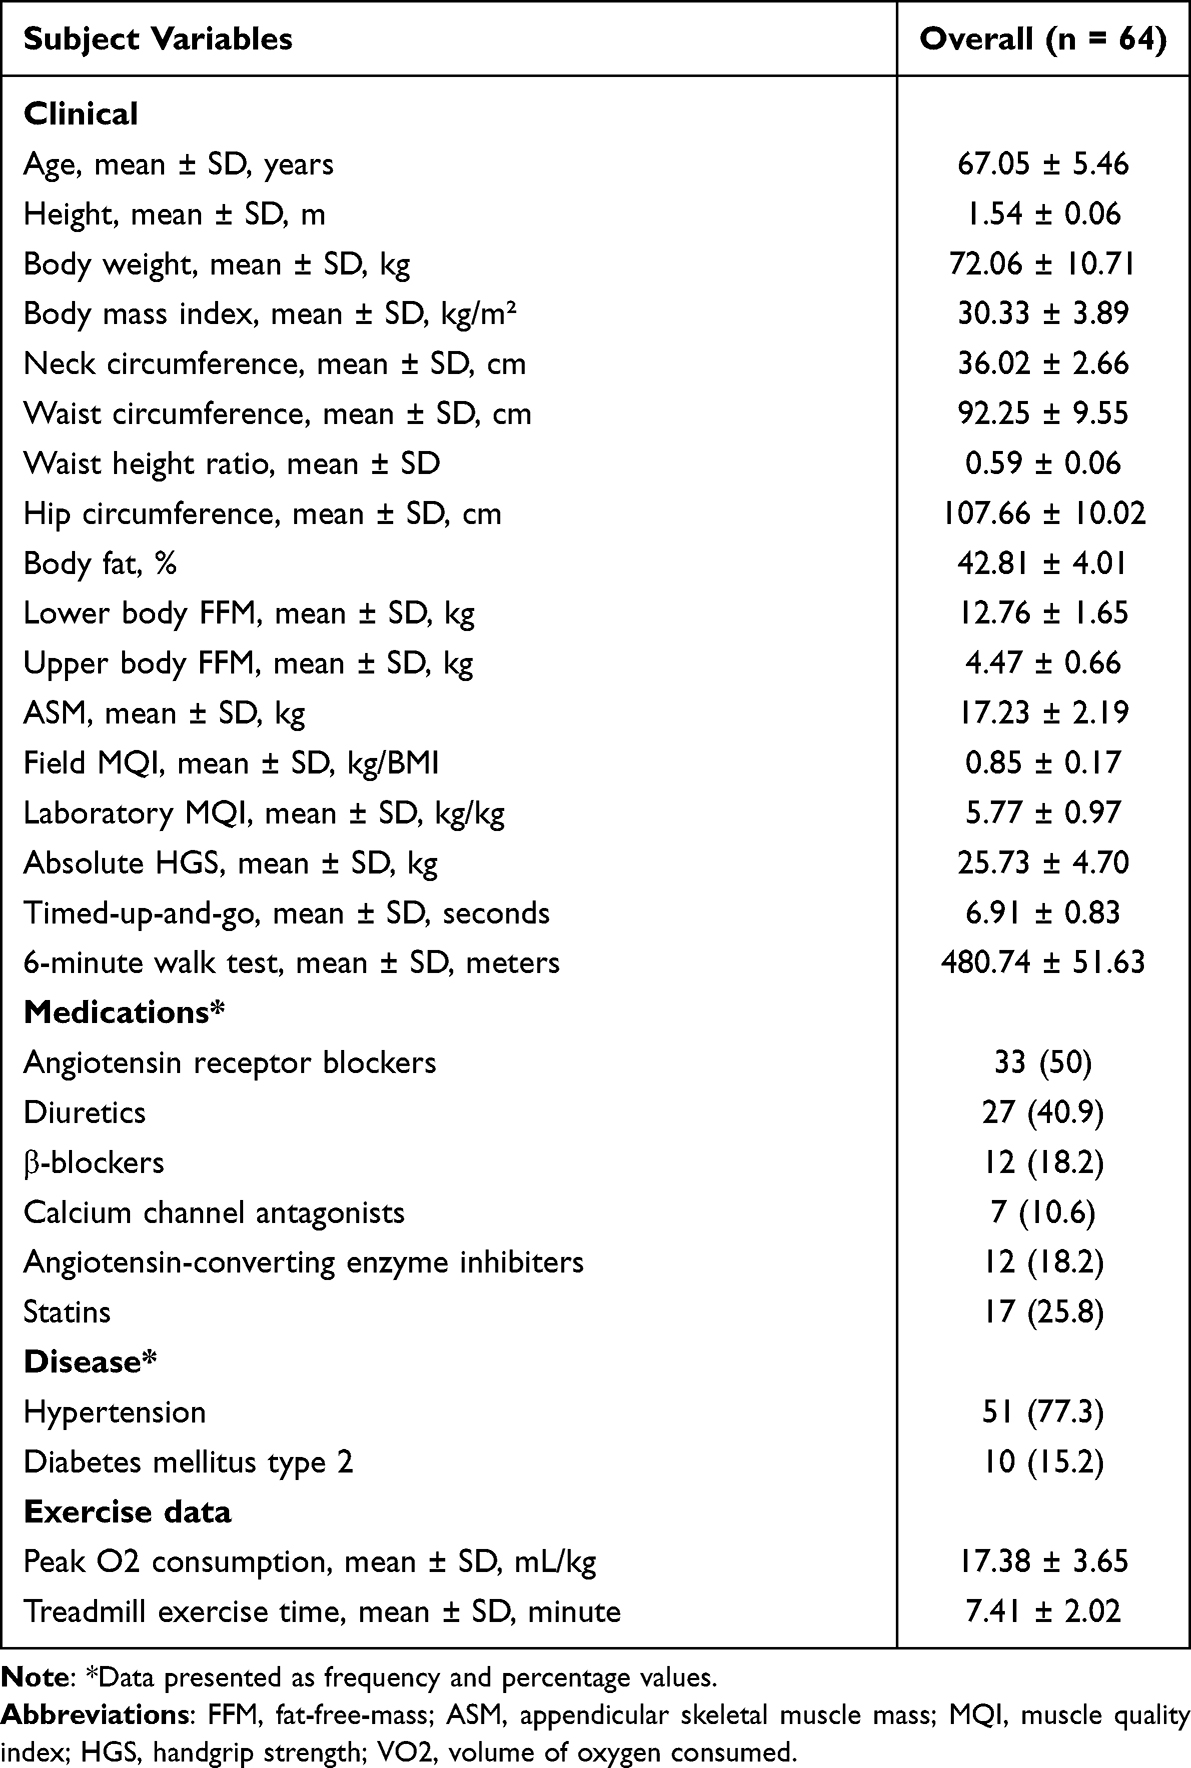 |
Table 1 Subjects’ Characteristics |
The study was approved by the Institutional Research Ethics Committee of the Catholic University of Brasília (UCB) (protocol 45648115.8.0000.5650). The study design and procedures were in accordance with ethical standards and the Declaration of Helsinki.28 Each subject was fully informed about the risks associated with study participation and gave their written informed consent. This study was performed under STROBE (Strengthening the Reporting of Observational studies in Epidemiology).29
For procedures evaluating lower functional capacity, handgrip strength, body composition, and anthropometric measurements, a trained and experienced professional in geriatric patients of physical education was responsible for the applicability of the tests. Furthermore, a trained and experienced cardiologist in geriatric patients was responsible for conducting the treadmill stress testing. Also, test-retest reliability for handgrip strength, TUG-test, and 6-minute walk test based on previous studies displays an ICC higher than 0.87.30–32 For body composition, DXA displays a good precision with low coefficient variation.33
Evaluation of Lower Functional Capacity
The timed-up-and-go test consisted of rising from a chair and walking as fast as possible to a cone 3 m away, circling around the cone, and returning to sit on the chair.34,35 Subjects were allowed three trials to perform each test, with a one minute interval between trials, and received instructions to perform each test as fast as possible without running. Participants initiated the test with their back against the chair and hands on hips. The 6-minute walk test (number of meters walked in 6 min around a 20-meter course) was also applied.36
Handgrip Strength
Handgrip strength was determined using a handgrip Hydraulic dynamometer (Saehan Corp®, SH5001, S. Korea). Three measures were obtained in both the right and left hands and the highest value was recorded for statistical analysis.37 The second position was used for all the subjects; with the forearm in a neutral position, elbow fully extended; standing position; and verbal encouragement was used for all subjects, with one-minute rest intervals between measurements. To calculate the field MQI, the highest reading was divided by the subject’s body mass index (BMI). Previous research supports strength corrected for BMI over absolute strength measures.16,19,38,39 To calculate laboratory MQI, the ratio of grip strength to the entire arm muscle in kilograms measured by DXA was obtained.17,40–42
Body Composition Analysis and Anthropometric Measurements
Body composition analysis was evaluated using DXA (General Electric-GE model 8548 BX1L, year 2005, Lunar DPX type, software Encore 2005; Rommelsdorf, Germany). Briefly, the apparatus was operated by a technically trained professional who performed a complete body scan with the participant in the supine position. DXA calibration was performed, and a phantom was used to check this calibration daily before body composition was evaluated. The legs were secured using non-elastic straps at the knees and ankles, and the arms were aligned along the trunk with the palms facing the thighs. Body mass (kg) was measured using a scale (W200 LCD Portable Welmy), and a conventional stadiometer was used to measure height (m). Body mass index was calculated by the traditional equation (body mass/height2). All circumferences were obtained using a non-elastic tape measure and averaged to determine the final reported circumference. Waist circumference was measured with the subject standing up, at the midway point between the last floating rib and iliac crest; neck circumference was measured with the subject standing erect with their hand positioned in the horizontal Frankfurt plane. The upper edge of the measuring tape was placed at mid-neck height, between mid-cervical spine to mid-anterior neck just below the laryngeal prominence. Hip circumference was measured with the subject standing up using the maximum circumference of the hip.43
Treadmill Stress Testing
Exercise testing procedures in the laboratory have been described in detail elsewhere.44 Subjects underwent a symptom-limited treadmill exercise test using a ramp-treadmill protocol. The protocol used velocity increments (between 0.004 and 0.005 km/h each second) and grade (between 0.015 and 0.021% each second), adjusted for subjects to reach maximal exercise capacity within the recommended range of 8 to 12 minutes. The initial and final velocities were 3.0 km/h and 6.0 km/h, respectively, while the initial and final grades were 1.0 and 14.0%. Subjects were encouraged to exercise until voluntary-exhaustion, and the achievement of 85% of maximum predicted HR and/or respiratory exchange ratio > 1.02 were used for the termination of testing.44 During each exercise stage and recovery stage, symptoms (chest discomfort, rate of perceived exertion, and dizziness), blood pressure, and heart rate were recorded.
Statistical Analysis
All statistical analyses were conducted using SPSS software version 18.0 (Chicago, USA). A multiple regression was run to predict the TUG test from field MQI, and laboratory MQI. The TUG test was used as a dependent variable because it is a sensitive and specific measure for identifying older adults at risk for falls.35,45 Linearity was found, assessed by partial regression plots and a plot of studentized residuals against the predicted values, independence of residuals, assessed by a Durbin-Watson statistic of 2.06, and homoscedasticity, assessed by visual inspection of a plot of studentized residuals versus unstandardized predicted values. There was no evidence of multicollinearity, assessed by tolerance values greater than 0.1. The assumption of normality was met, evaluated by a Q-Q Plot. The multiple regression model statistically significantly predicted the TUG test, F(2, 61) = 9.63, p = 0.001, adj. R2 = 0.24. Hence, considering that body fat negatively affects MQI, a hierarchical multiple regression was conducted to control the effects of body fat on TUG test results.46 In addition, a correlation was performed between field and laboratory MQI with peak O2 consumption, treadmill exercise time, and obesity measure indices. For r effect size, values between 0.2–0.49, 0.50–0.79, and ≥ 0.80 were considered small, moderate, and large, respectively.47 For power analysis (Linear multiple regression: Fixed model, R2 deviation from zero), considering an effect size of 0.54, α = 0.05, and number of predictors (field and laboratory MQI), a power of 0.99 was observed for 61 participants. An alpha level of α ≤ 0.05 was considered significant. For data analysis, SPSS (version 20.00) and G*Power 3.1.9.7 were used.48
Results
Only field MQI added statistically significantly to the prediction of the TUG test, p = 0.004. Regression coefficients and standard errors can be found in Table 2 (below). As such, an increase in field MQI of one unit is associated with a decrease in the TUG test of 2.59 seconds. However, the inclusion of body fat as a covariate did not add a statistically significant increase to the variance explained by the model, R2 of 0.26, F(1, 60) = 0.21, p = 0.21 Table 2.
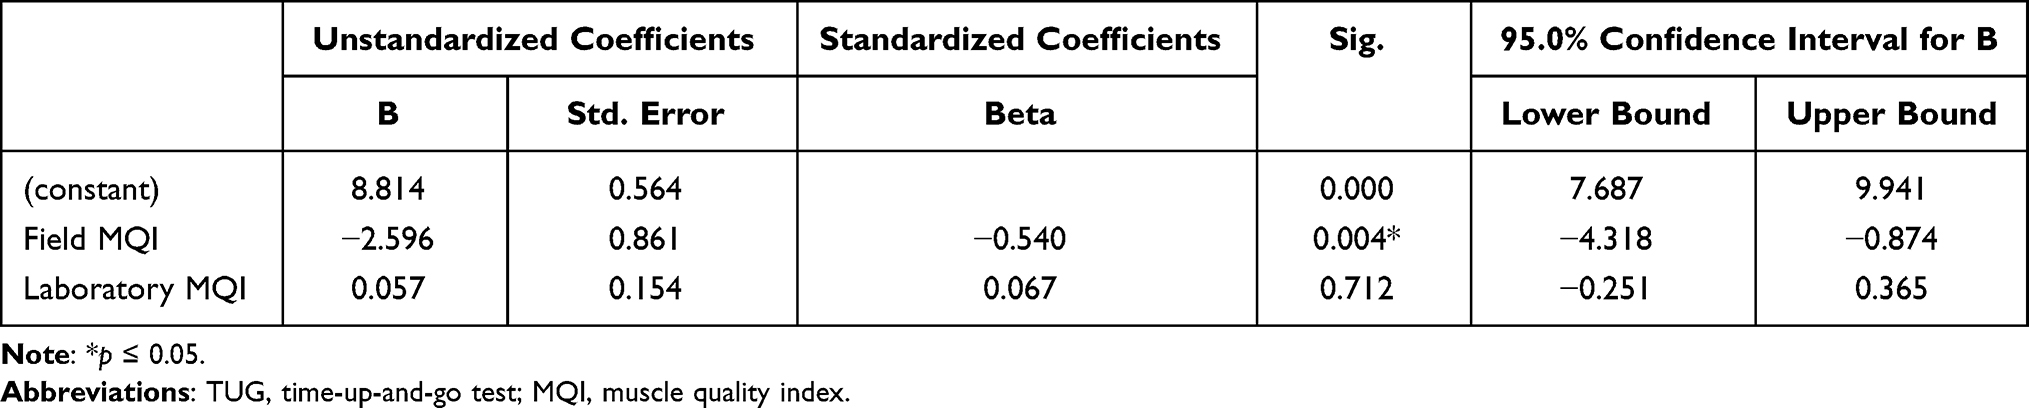 |
Table 2 Multiple Regression Predicting TUG Test Based on Field and Laboratory MQI |
Field MQI
For correlation analysis, field MQI displayed a positive statistical correlation with the 6-minute walk test (r = 0.36, p = 0.003), peak O2 consumption (r = 0.29, p = 0.021), and treadmill exercise time (r = 0.30, p = 0.016). However, field MQI displayed a negative statistical correlation with neck circumference (r = −0.35, p = 0.004), waist circumference (r = −0.34, p = 0.006), waist height ratio (r = −0.51, p = 0.001), hip circumference (r = −0.36, p = 0.003), percentage body fat (r = −0.30, p = 0.016), and BMI (r = −0.46, p = 0.001) (Table 3).
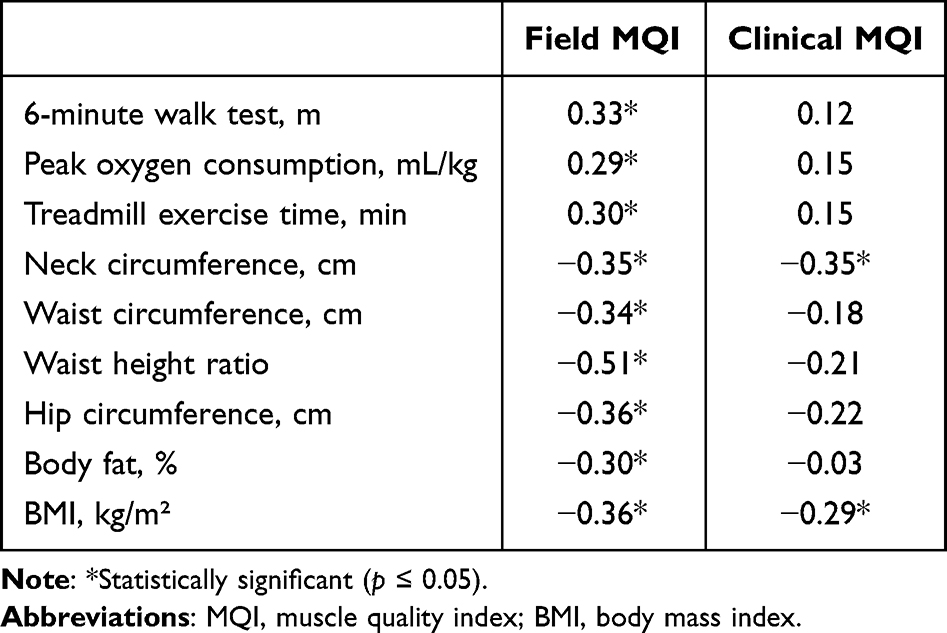 |
Table 3 Spearman Correlation Between MQI and Clinical Variables and Exercise Data |
Laboratory MQI
For correlation analysis, laboratory MQI displayed a positive non-statistical correlation with the 6-minute walk test (r = 0.12, p = 0.32), peak O2 consumption (r = 0.15, p = 0.22), and treadmill exercise time (r = 0.15, p = 0.23). However, laboratory MQI displayed a negative statistical correlation with BMI (r = −0.29, p = 0.017) and neck circumference (r = −0.35, p = 0.004). Furthermore, we found a negatively non-statistical correlation with waist circumference (r = −0.18, p = 0.14), waist height ratio (r = −0.21, p = 0.084), hip circumference (r = −0.22, p = 0.081), and percentage body fat (r = −0.03, p = 0.76) (Table 3).
Discussion
The current study was conducted to investigate the association of different MQI indices with TUG performance, aerobic capacity, and obesity indices. Interestingly, only field MQI predicted the TUG performance in obese older women. Furthermore, this simple method displays a positive correlation with aerobic capacity performance, while demonstrating a negative correlation with diverse obesity indices. In contrast, the significant associations for the Laboratory MQI were more restrained, only showing a negative correlation with BMI and neck circumference (Figure 1). To the best of our knowledge, this is the first study to show that measurement of field MQI may be an easy and useful screening tool in clinical practice to identify obese older adults at a high risk of functional decline based on the TUG test.
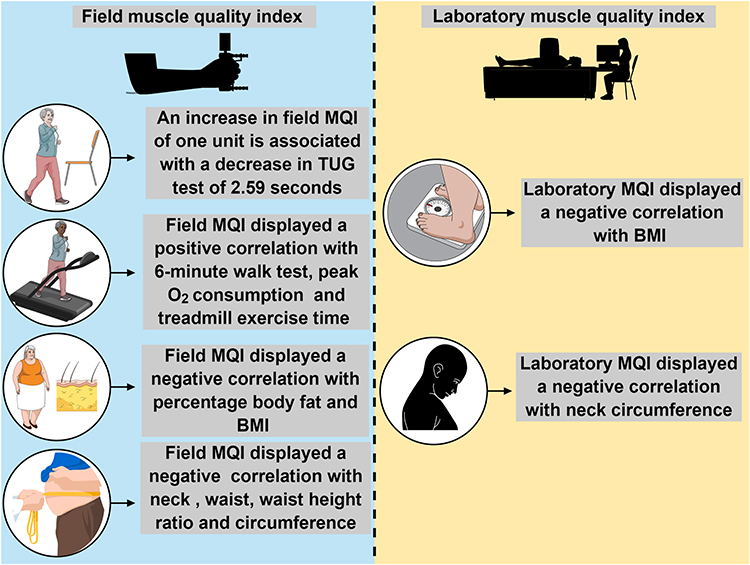 |
Figure 1 Summary of main associations of differents MQI with TUG performance, aerobic capacity, and obesity indices. Abbreviations: TUG, timed-up-and-go test; MQI, muscle quality index; BMI, body mass index. Note: The figure was created in the Mind the Graph platform (www.mindthegraph.com). |
Although hand grip strength does not explicitly evaluate lower extremities in daily activities, previous studies indicated that all TUG parameters significantly correlated with hand grip strength. Porta et al 2018 showed a significant negative correlation between hand grip strength and TUG phase times for women aged 70.10 Wiśniowska-Szurlej et al 2019 found that regardless of sex and cognitive status, older people with lower handgrip strength were characterized by a longer duration of the task.22 Furthermore, gait speed and dynamic balance were positively correlated with hand grip strength. Thus, this possible relationship between field-based estimates of MQI and TUG values could be partially explained by the fact that optimal hand grip strength can reflect the integrity of underlying biological processes linked to age-advance, including neural and motor performance, and overall health status.
In particular, the absolute hand grip strength was high in overweight and obese individuals; however, the relative measures were low, suggesting that the absolute values can be significantly affected by body weight or BMI.46 An interesting finding from the current study was that field MQI negatively correlates with diverse obesity parameters, suggesting that excessive fat mass can impose an unfavorable burden on muscle function. Our results corroborate previous studies, which revealed that long-term exposure to obesity is associated with poor relative hand grip strength.49–51 Mechanistically, these deleterious effects result from complex metabolic, neurological, and muscular changes.52 Notably, chronic low-grade inflammation, anabolic resistance, and oxidative stress, linked to obesity, diminish functionality.46
On the other hand, the associations for the Laboratory MQI were limited, merely displaying a negative correlation with BMI and neck circumference. Moreover, we found that laboratory MQI was not associated with the best results in the TUG test. Contrary to our results, a significant association was demonstrated between muscle quality and physical function (chair rise time and gait speed) in older men.53 Furthermore, muscle quality (leg extension power/lower extremity mineral-free lean mass) was an independent predictor of performance in the 6-minute walk, 8-foot up-and-go, and 30-second chair stand in community-dwelling older women.16 However, those studies used lower limbs normalized to DXA to calculate the laboratory MQI values. We speculate that BMI is a more sensitive measure when compared with the entire arm muscle analyzed by DXA to predict the TUG performance in the present sample. Indeed, BMI represents a global measure to estimate global body fat, and aging has a larger effect on the reduction in strength in the lower limb muscles compared to the upper limb muscles, which may partially illuminate our findings.54,55 Moreover, obese older adults are more vulnerable to balance problems in the lower extremities and, consequently, have more difficulty in the TUG.
In addition, it is essential to consider that different methods used to calculate MQI based on movement type (isometric vs isotonic vs isokinetic) and anatomical location (upper vs lower body) might affect the interpretation of results.13 Lower body MQI in a previous study was better associated with self-reported difficulties and functional impairments than upper body MQI.56 However, measurements of knee extensor muscle strength with one repetition maximum (RM) and dynamometers that can provide different MQI is limited by the need for special equipment.18–20 Also, a comparison between different types of MQI should be evaluated in future studies.
Complications in mobility are often the initial sign of functional decline during aging. The TUG test contains numerous functional mobility tasks that are relevant to the daily life of older adults, such as walking, turning, standing up, and sitting down.7 Based on this importance, Ansai et al explored the differences in performance in TUG subtasks between frail, prefrail, and non-frail older adults.7 The authors found that frail older adults took longer to complete the TUG than prefrail and non-frail individuals, which was explained by walking slower, taking more steps, and altering the quality of movement. Considering that MQ can better explain the syndrome of loss of muscle mass and strength in older adults, this key measure could clarify early physical manifestations of frailty and mobility skills. Thus, future studies are required to evaluate the link between changes in MQI and frailty syndrome.
Interestingly, it was reported that there is a close association between hand grip strength and cardiovascular health, cardiac structure, and function. For instance, higher hand grip strength was related to cardiorespiratory fitness, preserved ejection fraction, lower left ventricular mass-to-volume ratio, and higher left ventricular end-diastolic volume.57–59 However, these studies were conducted in adults and neglected the importance of MQ based on handgrip strength normalized by BMI. An exciting result of our study was that field MQI displayed a positive correlation with the 6-minute walk test, peak O2 consumption, and treadmill exercise time. Despite a small r-effect size (0.2–0.49), the current work represents an essential first step in understanding the interrelationships between MQ and aerobic capacity. Treatments based on the exploitation of these interactions may improve health in obese older women, since MQ and aerobic metabolism are impaired in this condition.60 Greater MQ values accompanied by improved aerobic capacity performance have implications for exercise prescription and could be key determinants for reducing disability and immobility throughout the life span.
Another cross-sectional study with a sample of obese older woman found that individuals with high relative hand grip strength presented a higher chronotropic index and better heart rate recovery in the first- and second-minutes post-treadmill exercise testing.61 These data suggest that muscle strength can modulate adrenergic sensitivity, which seems to contribute to an attenuated heart contractile activity in response to stress. Moreover, our outcomes align with the beneficial consequences of field MQI on cardiometabolic disease risk during aging.62 Thus, the role of MQI in cardiovascular health warrants increased attention because appropriate hand muscle strength scores can be recommended in the prevention and pathogenesis of cardiovascular disease during the advancing age.
Optimal methods for quantifying MQI are still under debate. The most feasible method can vary according to available resources, sensitivity, and application possibilities. Previous studies showed that muscle strength depends on age, sex, body size, physical activity levels, malnutrition, and the sarcopenia process.63,64 These critical factors lead to high heterogeneity of hand grip strength values among diverse samples and produce difficulty in drawing comparative conclusions. Thus, our findings based on hand grip strength adjusted for BMI can be used to reduce the influence of heterogeneity in the results. In terms of practical applications, prior field MQI screening could represent an easy access, low-cost method using portable equipment, to provide meaningful feedback to health professionals to identify possible deficiencies in the functional capacity of the aging population.
It is significant to point out that the current study has some limitations. The present study’s sample was composed only of older women, so the results may not apply to other populations and may not be suitable for generalizability. Thus, our data may not characterize normative data. Normative information can be obtained by conducting an investigation involving a large and randomly selected representative sample from a broad population. Moreover, the cross-sectional nature of this study prevents the ability to identify any causal relationship between study variables and outcomes. Finally, our results are limited to our specific tests, muscle groupings, and measurements. Thus, whether different MQI will continue to determine other functional tests remains a provocative hypothesis for further investigation.
Conclusion
This study found a potential association between muscle quality and functional capacity. Field MQI is superior to laboratory MQI for “Up and Go” test performance prediction in obese older women. Furthermore, field MQI positively correlates with aerobic capacity performance, while no apparent correlation was seen in laboratory MQI. Employing simple tools, early screening of field MQI could identify the physical disability risk, as well as facilitating the planning of appropriate interventions that prevent deficits in functional capacity during aging.
Acknowledgments
We thank all volunteers for participating. In addition, the last author wants to dedicate this paper to his family (Rita de Cassia and Nicolas Cunha).
Author Contributions
All authors made a significant contribution to the work reported, whether that is in the conception, study design, execution, acquisition of data, analysis, and interpretation, or in all these areas. Have drafted or written, or substantially revised or critically reviewed the article. Have agreed on the journal to which the article will be submitted. Reviewed and agreed on all versions of the article before submission, during revision, the final version accepted for publication, and any significant changes introduced at the proofing stage, and agree to take responsibility and be accountable for the contents of the article.
Disclosure
Professor Vicente Paulo Alves Snr reports grants from CAPES - Government, during the conduct of the study. Ms Larissa Lauda Burmann reports grants from CAPES - Agência Governamental, during the conduct of the study. The authors declare that they have no competing interests.
References
1. Nigam Y, Knight J, Bhattacharya S, Bayer A. Physiological changes associated with aging and immobility. J Aging Res. 2012;2012:468469. doi:10.1155/2012/468469
2. Nur H, Sertkaya BS, Tuncer T. Determinants of physical functioning in women with knee osteoarthritis. Aging Clin Exp Res. 2018;30(4):299–306. doi:10.1007/s40520-017-0784-x
3. Abellan van Kan G. Epidemiology and consequences of sarcopenia. J Nutr Health Aging. 2009;13(8):708–712. doi:10.1007/s12603-009-0201-z
4. Papa EV, Dong X, Hassan M. Resistance training for activity limitations in older adults with skeletal muscle function deficits: a systematic review. Clin Interv Aging. 2017;12:955–961. doi:10.2147/CIA.S104674
5. Coelho-Junior HJ, Rodrigues B, Goncalves IO, Asano RY, Uchida MC, Marzetti E. The physical capabilities underlying timed “Up and Go” test are time-dependent in community-dwelling older women. Exp Gerontol. 2018;104:138–146. doi:10.1016/j.exger.2018.01.025
6. Borda MG, Ferreira D, Selnes P, et al. Timed up and go in people with subjective cognitive decline is associated with faster cognitive deterioration and cortical thickness. Dement Geriatr Cogn Disord. 2022;51(1):63–72. doi:10.1159/000522094
7. Ansai JH, Farche ACS, Rossi PG, de Andrade LP, Nakagawa TH, Takahashi ACM. Performance of different timed up and go subtasks in frailty syndrome. J Geriatr Phys Ther. 2019;42(4):287–293. doi:10.1519/JPT.0000000000000162
8. Viccaro LJ, Perera S, Studenski SA. Is timed up and go better than gait speed in predicting health, function, and falls in older adults? J Am Geriatr Soc. 2011;59(5):887–892. doi:10.1111/j.1532-5415.2011.03336.x
9. Thrane G, Joakimsen RM, Thornquist E. The association between timed up and go test and history of falls: the Tromso study. BMC Geriatr. 2007;7:1. doi:10.1186/1471-2318-7-1
10. Porta M, Pilloni G, Corona F, et al. Relationships between objectively assessed functional mobility and handgrip strength in healthy older adults. Eur Geriatr Med. 2018;9(2):201–209. doi:10.1007/s41999-018-0025-7
11. Fabiani E, Herc M, Simunic B, et al. Correlation between timed up and go test and skeletal muscle tensiomyography in female nursing home residents. J Musculoskelet Neuronal Interact. 2021;21(2):247–254.
12. Naimo MA, Varanoske AN, Hughes JM, Pasiakos SM. Skeletal muscle quality: a biomarker for assessing physical performance capabilities in young populations. Front Physiol. 2021;12:706699. doi:10.3389/fphys.2021.706699
13. Fragala MS, Kenny AM, Kuchel GA. Muscle quality in aging: a multi-dimensional approach to muscle functioning with applications for treatment. Sports Med. 2015;45(5):641–658. doi:10.1007/s40279-015-0305-z
14. Misic MM, Rosengren KS, Woods JA, Evans EM. Muscle quality, aerobic fitness and fat mass predict lower-extremity physical function in community-dwelling older adults. Gerontology. 2007;53(5):260–266. doi:10.1159/000101826
15. de Sousa Neto IV, da Cunha Nascimento D, Prestes J, et al. Initial muscle quality affects individual responsiveness of interleukin-6 and creatine kinase following acute eccentric exercise in sedentary obese older women. Biology. 2022;11(4):537. doi:10.3390/biology11040537
16. Straight C, Brady A, Schmidt M, Evans E. Comparison of laboratory-and field-based estimates of muscle quality for predicting physical function in older women. J Aging Res Clin Pract. 2013;2(3):276–279.
17. Nascimento DDC, Prestes J, de Sousa Diniz J, et al. Comparison of field- and laboratory-based estimates of muscle quality index between octogenarians and young older adults: an observational study. J Exerc Rehabil. 2020;16(5):458–466. doi:10.12965/jer.2040668.334
18. Barbat-Artigas S, Rolland Y, Vellas B, Aubertin-Leheudre M. Muscle quantity is not synonymous with muscle quality. J Am Med Dir Assoc. 2013;14(11):852 e851–857. doi:10.1016/j.jamda.2013.06.003
19. Barbat-Artigas S, Rolland Y, Zamboni M, Aubertin-Leheudre M. How to assess functional status: a new muscle quality index. J Nutr Health Aging. 2012;16(1):67–77. doi:10.1007/s12603-012-0004-5
20. da Silva Almeida I, Durigan JLQ, Carvalho THD, et al. A medida da força muscular relativa de preensão manual representa a força muscular global em idosas?Res Soc Dev. 2022;11(11):e560111134018–e560111134018.
21. Wearing J, Konings P, Stokes M, de Bruin ED. Handgrip strength in old and oldest old Swiss adults - a cross-sectional study. BMC Geriatr. 2018;18(1):266. doi:10.1186/s12877-018-0959-0
22. Wisniowska-Szurlej A, Cwirlej-Sozanska A, Woloszyn N, Sozanski B, Wilmowska-Pietruszynska A. Association between handgrip strength, mobility, leg strength, flexibility, and postural balance in older adults under long-term care facilities. Biomed Res Int. 2019;2019:1042834. doi:10.1155/2019/1042834
23. Chua KY, Lim WS, Lin X, Yuan JM, Koh WP. Handgrip strength and timed up-and-go (TUG) test are predictors of short-term mortality among elderly in a population-based cohort in Singapore. J Nutr Health Aging. 2020;24(4):371–378. doi:10.1007/s12603-020-1337-0
24. Batsis JA, Villareal DT. Sarcopenic obesity in older adults: aetiology, epidemiology and treatment strategies. Nat Rev Endocrinol. 2018;14(9):513–537. doi:10.1038/s41574-018-0062-9
25. Alonso A, Beunza JJ, Delgado-Rodriguez M, Martinez-Gonzalez MA. Validation of self reported diagnosis of hypertension in a cohort of university graduates in Spain. BMC Public Health. 2005;5:94. doi:10.1186/1471-2458-5-94
26. Lima-Costa MF, Peixoto SV, Firmo JO. Validade da hipertensão arterial auto-referida e seus determinantes (projeto Bambuí). Rev Saude Publica. 2004;38(5):637–642. Portuguese. doi:10.1590/S0034-89102004000500004
27. Nishime EO, Cole CR, Blackstone EH, Pashkow FJ, Lauer MS. Heart rate recovery and treadmill exercise score as predictors of mortality in patients referred for exercise ECG. JAMA. 2000;284(11):1392–1398. doi:10.1001/jama.284.11.1392
28. World Medical Association. World Medical Association Declaration of Helsinki. Ethical principles for medical research involving human subjects. Bull World Health Organ. 2001;79(4):373–374.
29. von Elm E, Altman DG, Egger M, et al. The strengthening the reporting of observational studies in epidemiology (STROBE) statement: guidelines for reporting observational studies. J Clin Epidemiol. 2008;61(4):344–349. doi:10.1016/j.jclinepi.2007.11.008
30. Bohannon RW, Schaubert KL. Test-retest reliability of grip-strength measures obtained over a 12-week interval from community-dwelling elders. J Hand Ther. 2005;18(4):426–427, quiz 428. doi:10.1197/j.jht.2005.07.003
31. Chan WLS, Pin TW. Reliability, validity and minimal detectable change of 2-minute walk test, 6-minute walk test and 10-meter walk test in frail older adults with dementia. Exp Gerontol. 2019;115:9–18. doi:10.1016/j.exger.2018.11.001
32. Collado-Mateo D, Madeira P, Dominguez-Munoz FJ, Villafaina S, Tomas-Carus P, Parraca JA. The automatic assessment of strength and mobility in older adults: a test-retest reliability study. Medicina. 2019;55(6):54.
33. Andreoli A, Scalzo G, Masala S, Tarantino U, Guglielmi G. Body composition assessment by dual-energy X-ray absorptiometry (DXA). Radiol Med. 2009;114(2):286–300. doi:10.1007/s11547-009-0369-7
34. Bischoff HA, Stahelin HB, Monsch AU, et al. Identifying a cut-off point for normal mobility: a comparison of the timed ‘up and go’ test in community-dwelling and institutionalised elderly women. Age Ageing. 2003;32(3):315–320. doi:10.1093/ageing/32.3.315
35. Shumway-Cook A, Brauer S, Woollacott M. Predicting the probability for falls in community-dwelling older adults using the timed up & go test. Phys Ther. 2000;80(9):896–903. doi:10.1093/ptj/80.9.896
36. ATS Committee on Proficiency Standards for Clinical Pulmonary Function Laboratories. ATS statement: guidelines for the six-minute walk test. Am J Respir Crit Care Med. 2002;166(1):111–117. doi:10.1164/ajrccm.166.1.at1102
37. Roberts HC, Denison HJ, Martin HJ, et al. A review of the measurement of grip strength in clinical and epidemiological studies: towards a standardised approach. Age Ageing. 2011;40(4):423–429. doi:10.1093/ageing/afr051
38. Choquette S, Bouchard DR, Doyon CY, Senechal M, Brochu M, Dionne IJ. Relative strength as a determinant of mobility in elders 67–84 years of age. A nuage study: nutrition as a determinant of successful aging. J Nutr Health Aging. 2010;14(3):190–195. doi:10.1007/s12603-010-0047-4
39. Studenski SA, Peters KW, Alley DE, et al. The FNIH sarcopenia project: rationale, study description, conference recommendations, and final estimates. J Gerontol A Biol Sci Med Sci. 2014;69(5):547–558. doi:10.1093/gerona/glu010
40. Murai J, Nishizawa H, Otsuka A, et al. Low muscle quality in Japanese type 2 diabetic patients with visceral fat accumulation. Cardiovasc Diabetol. 2018;17(1):112. doi:10.1186/s12933-018-0755-3
41. Nogueira Paranhos Amorim D, Nascimento DC, Stone W, Alves VP, Moraes CF, Coelho Vilaca ES. Muscle quality is associated with history of falls in octogenarians. J Nutr Health Aging. 2021;25(1):120–125. doi:10.1007/s12603-020-1485-2
42. Melo GLR, Moraes MR, Nascimento EF, et al. Field-based versus laboratory-based estimates of muscle quality index in adolescents with and without down syndrome. J Intellect Disabil Res. 2022;66(12):1000–1008. doi:10.1111/jir.12959
43. Tajra V, Vieira DC, Tibana RA, et al. Different acute cardiovascular stress in response to resistance exercise leading to failure versus not to failure in elderly women with and without hypertension--a pilot study. Clin Physiol Funct Imaging. 2015;35(2):127–133. doi:10.1111/cpf.12137
44. Vieira DCL, Madrid B, Pires FO, et al. Ratings of perceived exertion in an incremental test in elderly women. Revista Brasileira de Cineantropometria Desempenho Humano. 2014;16:106–115.
45. Kojima G, Masud T, Kendrick D, et al. Does the timed up and go test predict future falls among British community-dwelling older people? Prospective cohort study nested within a randomised controlled trial. BMC Geriatr. 2015;15:38. doi:10.1186/s12877-015-0039-7
46. da Cunha Nascimento D, de Sousa NM, de Sousa Neto IV, et al. Classification of pro-inflammatory status for interleukin-6 affects relative muscle strength in obese elderly women. Aging Clin Exp Res. 2015;27(6):791–797. doi:10.1007/s40520-015-0349-9
47. Ferguson CJ. An effect size primer: a guide for clinicians and researchers. Prof Psychol Res Pr. 2009;40(5):532. doi:10.1037/a0015808
48. Faul F, Erdfelder E, Lang A-G, Buchner A. G* Power 3: a flexible statistical power analysis program for the social, behavioral, and biomedical sciences. Behav Res Methods. 2007;39(2):175–191. doi:10.3758/bf03193146
49. Stenholm S, Sallinen J, Koster A, et al. Association between obesity history and hand grip strength in older adults—exploring the roles of inflammation and insulin resistance as mediating factors. J Gerontol Series A. 2011;66(3):341–348. doi:10.1093/gerona/glq226
50. Bruch JP, Álvares-DA-Silva MR, Alves BC, Dall’alba V. Reduced hand grip strength in overweight and obese chronic hepatitis C patients. Arq Gastroenterol. 2016;53:31–35. doi:10.1590/S0004-28032016000100007
51. Chang C-Y, Chu N-F, Lin M-H, et al. Association between grip strength, obesity, and cardiometabolic risk factors among the community-dwelling elderly population in Taiwan. Int J Environ Res Public Health. 2022;19(18):11359. doi:10.3390/ijerph191811359
52. Wilkinson DJ, Piasecki M, Atherton PJ. The age-related loss of skeletal muscle mass and function: measurement and physiology of muscle fibre atrophy and muscle fibre loss in humans. Ageing Res Rev. 2018;47:123–132. doi:10.1016/j.arr.2018.07.005
53. Fragala MS, Clark MH, Walsh SJ, et al. Gender differences in anthropometric predictors of physical performance in older adults. Gend Med. 2012;9(6):445–456. doi:10.1016/j.genm.2012.10.004
54. Harris TB. Weight and body mass index in old age: do they still matter? J Am Geriatr Soc. 2017;65(9):1898–1899. doi:10.1111/jgs.14952
55. Janssen I, Heymsfield SB, Wang ZM, Ross R. Skeletal muscle mass and distribution in 468 men and women aged 18–88 yr. J Appl Physiol. 2000;89(1):81–88. doi:10.1152/jappl.2000.89.1.81
56. Barbat-Artigas S, Rolland Y, Cesari M, Abellan van Kan G, Vellas B, Aubertin-Leheudre M. Clinical relevance of different muscle strength indexes and functional impairment in women aged 75 years and older. J Gerontol A Biol Sci Med Sci. 2013;68(7):811–819. doi:10.1093/gerona/gls254
57. Zhou M, Zha F, Chen Y, et al. Handgrip strength-related factors affecting health outcomes in young adults: association with cardiorespiratory fitness. Biomed Res Int. 2021;2021:6645252. doi:10.1155/2021/6645252
58. Biolo G, Cederholm T, Muscaritoli M. Muscle contractile and metabolic dysfunction is a common feature of sarcopenia of aging and chronic diseases: from sarcopenic obesity to cachexia. Clin Nutr. 2014;33(5):737–748. doi:10.1016/j.clnu.2014.03.007
59. Beyer SE, Sanghvi MM, Aung N, et al. Prospective association between handgrip strength and cardiac structure and function in UK adults. PLoS One. 2018;13(3):e0193124. doi:10.1371/journal.pone.0193124
60. Edholm P, Veen J, Kadi F, Nilsson A. Muscle mass and aerobic capacity in older women: impact of regular exercise at middle age. Exp Gerontol. 2021;147:111259. doi:10.1016/j.exger.2021.111259
61. Silva CR, Saraiva B, Nascimento DD, et al. Relative handgrip strength as a simple tool to evaluate impaired heart rate recovery and a low chronotropic index in obese older women. Int J Exerc Sci. 2018;11(2):844.
62. Lawman HG, Troiano RP, Perna FM, Wang CY, Fryar CD, Ogden CL. Associations of relative handgrip strength and cardiovascular disease biomarkers in U.S. adults, 2011–2012. Am J Prev Med. 2016;50(6):677–683. doi:10.1016/j.amepre.2015.10.022
63. Marcos-Pardo PJ, González-Gálvez N, López-Vivancos A, et al. Sarcopenia, diet, physical activity and obesity in European middle-aged and older adults: the lifeage study. Nutrients. 2020;13(1):8. doi:10.3390/nu13010008
64. Molenaar JP, McNeil CJ, Bredius MS, Gandevia SC. Effects of aging and sex on voluntary activation and peak relaxation rate of human elbow flexors studied with motor cortical stimulation. Age. 2013;35(4):1327–1337. doi:10.1007/s11357-012-9435-5
 © 2023 The Author(s). This work is published and licensed by Dove Medical Press Limited. The
full terms of this license are available at https://www.dovepress.com/terms
and incorporate the Creative Commons Attribution
- Non Commercial (unported, 3.0) License.
By accessing the work you hereby accept the Terms. Non-commercial uses of the work are permitted
without any further permission from Dove Medical Press Limited, provided the work is properly
attributed. For permission for commercial use of this work, please see paragraphs 4.2 and 5 of our Terms.
© 2023 The Author(s). This work is published and licensed by Dove Medical Press Limited. The
full terms of this license are available at https://www.dovepress.com/terms
and incorporate the Creative Commons Attribution
- Non Commercial (unported, 3.0) License.
By accessing the work you hereby accept the Terms. Non-commercial uses of the work are permitted
without any further permission from Dove Medical Press Limited, provided the work is properly
attributed. For permission for commercial use of this work, please see paragraphs 4.2 and 5 of our Terms.
Recommended articles
High Intensity Interval Training: A Potential Method for Treating Sarcopenia
Liu QQ, Xie WQ, Luo YX, Li YD, Huang WH, Wu YX, Li YS
Clinical Interventions in Aging 2022, 17:857-872
Published Date: 26 May 2022
All Types Obesity and Physical Inactivity Associated with the Risk of Activity of Daily Living Limitations Among People with Asthma
Alhammad SA, Alwadeai KS
Journal of Multidisciplinary Healthcare 2022, 15:1573-1583
Published Date: 22 July 2022
Effect of Sarcopenia on 10-Year Risk of Atherosclerotic Cardiovascular Disease in Patients with Type 2 Diabetes Mellitus
Xia LF, Li JB, Tian GS, Jiang WR, Li YS, Lin CY, Qiu HN, Wu F, Wang JJ, Li CJ, Lin JN
Diabetes, Metabolic Syndrome and Obesity 2024, 17:1621-1634
Published Date: 9 April 2024
Therapeutics for Sarcopenia and Functional Disabilities in Older Adults: A Review of Phase 4 Clinical Trials
Alorfi NM, Alshehri FS, Ashour AM
Drug Design, Development and Therapy 2025, 19:2307-2314
Published Date: 27 March 2025
Semaglutide Therapy and Accelerated Sarcopenia in Older Adults with Type 2 Diabetes: A 24-Month Retrospective Cohort Study
Ren Q, Zhi L, Liu H
Drug Design, Development and Therapy 2025, 19:5645-5652
Published Date: 3 July 2025