")
Back to Journals » Diabetes, Metabolic Syndrome and Obesity » Volume 17
Effect of Sarcopenia on 10-Year Risk of Atherosclerotic Cardiovascular Disease in Patients with Type 2 Diabetes Mellitus
Authors Xia LF, Li JB, Tian GS, Jiang WR, Li YS, Lin CY, Qiu HN, Wu F, Wang JJ, Li CJ, Lin JN
Received 7 December 2023
Accepted for publication 16 March 2024
Published 9 April 2024 Volume 2024:17 Pages 1621—1634
DOI https://doi.org/10.2147/DMSO.S450225
Checked for plagiarism Yes
Review by Single anonymous peer review
Peer reviewer comments 2
Editor who approved publication: Dr Konstantinos Tziomalos
Long-Fei Xia,1 Jing-Bo Li,2 Guo-Sheng Tian,2 Wei-Ran Jiang,3 Yao-Shuang Li,1 Chen-Ying Lin,1 Hui-Na Qiu,2 Fan Wu,4 Jun-Jia Wang,5 Chun-Jun Li,2 Jing-Na Lin2
1Tianjin Union Medical Center, Tianjin Medical University, Tianjin, 300070, People’s Republic of China; 2Department of Endocrinology, Health Management Center, Tianjin Union Medical Center, Nankai University Affiliated Hospital, Tianjin, 300121, People’s Republic of China; 3Eastman Institute for Oral Health, University of Rochester Medical Center, Rochester, NY, USA; 4School of Medicine, Nankai University, Tianjin, 300071, People’s Republic of China; 5Graduate School, Tianjin University of Traditional Chinese Medicine, Tianjin, 301617, People’s Republic of China
Correspondence: Jing-Na Lin; Chun-Jun Li, Email [email protected]; [email protected]
Objective: To investigate the impact of sarcopenia on the 10-year risk of atherosclerotic cardiovascular disease (ASCVD) among individuals with type 2 diabetes mellitus (T2DM).
Methods: This study included the clinical, laboratory, and body composition data of 1491 patients with T2DM who were admitted to the Department of Endocrinology and Metabolism at Tianjin Union Medical Center from July 2018 to July 2023. The China-PAR model was utilized to evaluate cardiovascular disease risk. Associations between ASCVD risk and various clinical parameters were analyzed, and the relationship between body composition parameters and ASCVD risk was assessed using logistic regression.
Results: The analysis revealed that T2DM patients with sarcopenia had a higher 10-year ASCVD risk compared to those without sarcopenia, with reduced muscle mass independently predicting an increased risk of cardiovascular disease. This association was significant among female T2DM patients, while male T2DM patients with sarcopenia showed a marginally higher median ASCVD risk compared to their non-sarcopenic counterparts. ASCVD risk inversely correlated with body muscle parameters and positively correlated with fat content parameters. Specifically, height- and weight-adjusted fat mass (FM, FM%, FMI) were identified as risk factors for ASCVD. Conversely, muscle parameters adjusted for weight and fat (ASM%, SMM%, FFM%, ASM/FM, SMM/FM, FMM/FM) were protective against ASCVD risk. These findings highlight the critical role of sarcopenia in influencing cardiovascular disease risk among Chinese patients with T2DM, as predicted by the China-PAR model.
Conclusion: This study highlights the importance of sarcopenia in T2DM patients, not only as an indicator of ASCVD risk, but possibly as an independent risk factor in this demographics.
Keywords: atherosclerotic cardiovascular disease, ASCVD, type 2 diabetes, T2DM, sarcopenia, fat content, muscle mass
Introduction
Sarcopenia is a disease characterized by the gradual decrease of muscle function, mass, and strength. It is linked to a higher risk of hospitalization, disability, falls, death, and loss of self-care ability.1 Sarcopenia was first described by Irwin Rosenberg in 1988 as an age-related decline in skeletal muscle function and mass.2 Baumgartner further provided a method to assess sarcopenia using height-adjusted appendicular lean mass (kg/m2).3 From a physiological perspective, beyond 40 years of age, there is a progressive and systemic loss of muscle mass; before the age of 70, this degradation rate is estimated to be 8% per decade and subsequently 15–25% per decade.4 Depending on different demographic characteristics and assessment criteria, sarcopenia is present in 10% to 40% of people worldwide.5 Over the past decade, sarcopenia has received increasing attention, particularly with the gradual increase in the world’s life expectancy. Over the next 30 years, there is a projected considerable increase in the prevalence of sarcopenia.6 Sarcopenia will affect more than 200 million elderly individuals with worldwide,6 which raises serious concerns for public health.
Type 2 diabetes mellitus (T2DM) is one of the most serious and pressing health issues in the world. According to predictions from the International Diabetes Federation, the prevalence of T2DM among adults aged 20 to 79 will rise from 9.3% in 2019 to 10.2% by 2030. Specifically, there will be 578 million T2DM patients by 2030 compared to 463 million in 2019. It is projected that diabetes-related healthcare costs worldwide total 727 billion US dollars.7 With population aging and a rise in the incidence of metabolic and musculoskeletal diseases, changes in body composition occur during the aging process, leading to an considerable decline in skeletal muscle mass (SMM) and an elevation in body fat percentage.8,9 Both obesity and low muscle mass are linked to an increased risk of metabolic diseases, like T2DM. Sarcopenia, defined as an age-related decline in muscle mass and function, is considered both a cause and a result of T2DM.10,11 Currently, there is growing attention to sarcopenia in T2DM patients, driven by clinical practice and scientific research, as sarcopenia may significantly affect the quality of life of elderly individuals with T2DM.12
Cardiovascular Disease (CVD) is one of the leading causes of death among diabetic individuals. It represents a significant financial strain on patients, their families, and the healthcare system. It remains a leading cause of death and disability globally, making up for one-third of all global deaths. In 2019, 6.2 million people between the ages of 30 and 70 died from CVD. Compared to 1990, the total number of deaths due to CVD increased by 34.9%.13 Heart metabolism, behavior, environment, genetic factors, as well as socio-economic and psychological risk factors, are the primary contributors to CVD.13,14
Sarcopenia has a bidirectional relationship with CVD.15 Sarcopenia can result in obesity, increased chronic inflammation, and insulin resistance, all of which are closely associated with adverse metabolic effects, resulting in a high incidence of chronic diseases including hypertension, hyperlipidemia, and hypertension. These diseases, in turn, are risk factors for CVD.16 Patients with cardiovascular illness exhibit chronic inflammation, malnutrition, and decreased physical activity as preludes to a catabolic condition that causes rapid muscle loss and the onset of sarcopenia.17 As common age-related conditions, both sarcopenia and CVD have emerged as major concerns in public health. With the gradual formation and updating of consensus on sarcopenia, increasing research has identified the relationship between sarcopenia and CVDs, like congenital heart disease, coronary artery disease, ischemic heart disease, heart failure, and arrhythmias.18,19
CVD risk assessment is a fundamental step of CVD prevention. Several predictive models for CVD risk assessment have been established and applied in public health and clinical practice for different populations. Recently, the China-PAR project, based on data from multiple contemporary adult cohorts in China in 2016, has been developed for predicting atherosclerotic cardiovascular disease (ASCVD) risk and has seen widespread application in practice.20
However, there is currently limited understanding regarding the interplay between sarcopenia and CVD risk assessment in the T2DM population. Therefore, the objective of this research is to examine the impact of sarcopenia on the CVD risk of patients with T2DM. Additionally, our research aims to delineate the specific effects of body composition parameters on heightened CVD risk.
Materials and Methods
Study Participants
The study included 1491 T2DM patients who were admitted to the Department of Endocrinology and Metabolism at the Tianjin Union Medical Center between July 2018 and July 2023. The diagnosis of diabetes was based on the criteria established by the World Health Organization (WHO) in 1999.21 All participants provided written informed consent before their electronic medical records and clinical data were accessed. This research complied with the Helsinki Declaration and was approved by the Medical Ethics Committee of the Tianjin Union Medical Center. Figure 1 shows the research idea of this study.
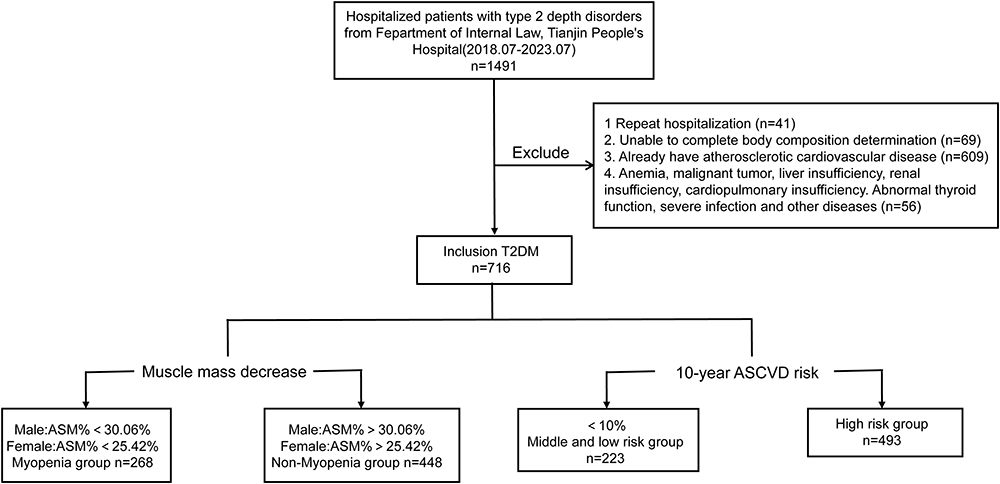 |
Figure 1 Research flow chart. |
The inclusion criteria for the study were individuals aged between 20 and 80 years with a diagnosis of T2DM. In addition, the exclusion criteria were: (1) individuals with repeated hospitalizations (n=41); (2) conditions impacting the precision of body composition measurements, such as local edema, severe arterial occlusion in lower limbs, presence of pacemakers or other metal objects, or any issue preventing the completion of body composition assessments (n=69); (3) history of Atherosclerotic Cardiovascular Disease (ASCVD) (n=609); (4) significant health complications including anemia (Hemoglobin [HBG] ≤90g/L), recent malignant tumors (within 5 years), liver (alanine transaminase [ALT] ≥ 120 U/L) or renal insufficiency (creatinine [Cr] ≥ 265 µmol/L), severe cardiopulmonary or thyroid dysfunctions, or severe infections (n=56); and (5) those in an emergency condition or those who had used lipid-regulating drugs, antihypertensive medications, or glucocorticoids.
Baseline Data Collection
Medical professionals, including doctors and postgraduate medical students, conducted interviews to gather clinical data from the participants. These interviews covered aspects such as medical history (including previous illnesses, family history of cardiovascular disease (CVD) or diabetes, and medication usage), lifestyle habits (such as alcohol consumption and smoking), and general demographic information (age, gender, and the duration of diabetes). A family history of diabetes was defined as having the condition in a first-degree relative—either a parent, sibling, or child. The same criteria applied to a family history of CVD.
For laboratory analysis, venous blood samples were collected the following morning after participants had fasted for at least eight hours. The analyses conducted included Fasting Blood Glucose (FBG), Low-Density Lipoprotein Cholesterol (LDL-C), High-Density Lipoprotein Cholesterol (HDL-C), Triglycerides (TG), Total Cholesterol (TC), Aspartate Aminotransferase (AST), Alanine Aminotransferase (ALT), Uric Acid (UA), Serum Creatinine (SCr), and Blood Urea Nitrogen (BUN), using an automatic biochemical analyzer (TBA-120FR, Toshiba, Japan). The estimated glomerular filtration rate (eGFR) was determined using the Chronic Kidney Disease Epidemiology Collaboration (CKD-EPI) formula.22 Hemoglobin A1c (HbA1c) levels were measured through high-efficiency liquid chromatography using an automatic glycosylated hemoglobin analyzer (HA-8180, ARKRAY, Japan).
Height was measured with an automatic height measuring instrument (DST-600, DONGHUAYUAN, China) by surveyors with medical backgrounds. Blood pressure was taken after at least five minutes of rest, using an arm-type electronic sphygmomanometer (AC-05C, Ling Qian, China), ensuring accurate and consistent measurements across participants.
Body Composition Assessment
Body composition was assessed using bioelectrical impedance analysis (BIA) to measure visceral fat area (VFA), body weight (BW), skeletal muscle mass (SMM), fat-free mass (FFM), fat mass (FM), and appendicular skeletal muscle mass (ASM) utilizing a body composition analyzer (InBody770, Biospace, Korea). ASM was calculated as the total lean mass in the bilateral upper and lower limbs. The body mass index (BMI, kg/m2) was calculated by dividing the weight (kg) by the square of the height (m2).
Corrections for body composition parameters were as follows:
- Fat Mass Percentage (FM%) = (FM / BW) × 100%
- Fat-Free Mass Percentage (FFM%) = (FFM / BW) × 100%
- Skeletal Muscle Mass Percentage (SMM%) = (SMM / BW) × 100%Appendicular Skeletal Muscle Mass Percentage (ASM%) = (ASM / BW) × 100%
- Fat Mass Index (FMI) = FM / (Ht2)
- Fat-Free Mass Index (FFMI) = FFM / (Ht2)
- Skeletal Muscle Mass Index (SMMI) = SMM / (Ht2)Appendicular Skeletal Muscle Mass Index (ASMI) = ASM / (Ht2)
- Fat-Free Mass to Fat Mass Ratio (FFM/FM) = FFM / FM
- Skeletal Muscle Mass to Fat Mass Ratio (SMM/FM) = SMM / FMAppendicular Skeletal Muscle Mass to Fat Mass Ratio (ASM/FM) = ASM / FM
The criteria for diagnosing sarcopenia involved the percentage of ASM relative to body weight (ASM%) falling below the mean value of a reference group of healthy young adults (aged 18–40 years) by more than one standard deviation (SD), following the guidelines suggested by Lim et al.23 Data from 156 healthy adult females and 81 healthy adult males were analyzed to establish sarcopenia thresholds: ASM% less than 30.06% for males and less than 25.42% for females were indicative of sarcopenia. Based on this, the participants were categorized into a sarcopenia group (n = 268) and a non-sarcopenia group (n = 448).
Cardiovascular Disease Risk Assessment
We used the China-PAR model for evaluating the ASCVD risk among participants.20 The China-PAR model is a comprehensive risk assessment framework that incorporates various factors such as age, gender, geographic location within China (Southern or Northern), waist circumference, HDL-C, total cholesterol (TC), blood pressure, antihypertensive medication usage, smoking status, diabetes history, and family history of cardiovascular and cerebrovascular diseases. This model facilitates the estimation of an individual’s 10-year ASCVD risk.
A computational tool based on the China-PAR model was applied to determine the cardiovascular disease (CVD) risk of study participants. Subsequently, participants were categorized into two primary risk groups:24 those with a low-to-moderate risk (risk value less than 10%, n = 223) and those within the high-risk category (risk value greater than or equal to 10%, n = 493).
Statistical Analysis
Statistical analysis was conducted using SPSS software version 26.0. Continuous variables were analyzed using appropriate descriptive methods based on their distribution. Data adhering to a normal distribution were summarized as mean ± standard deviation (X±SD), while skewed continuous data were presented through the median and interquartile range (M(P25,P75)). Frequencies (percentages) (n%) were used to describe categorical data.
For continuous data with a normal distribution, inter-group comparisons were made using Student’s t-test. The non-parametric Mann–Whitney U-test was applied for between-group comparisons of non-normally distributed continuous data. Chi-square test was utilized for comparing categorical data between groups.
Correlations between the 10-year ASCVD risk and variables such as age, diastolic blood pressure (DBP), systolic blood pressure (SBP), duration of diabetes, laboratory examination indicators, and body composition parameters were evaluated using Pearson correlation analyses. Logistic regression models were employed to compute odds ratios (ORs) and their 95% confidence intervals (CIs) for examining the impact of body composition on the risk of high ASCVD. Statistical significance was determined by a two-tailed P-value of less than 0.05.
Results
General Characteristics of the Participants
A total of 716 patients with T2DM were identified as eligible for study analysis. Of these, 268 (37.43%) were diagnosed with sarcopenia, whereas 448 (62.57%) did not have sarcopenia. Comparative analysis was conducted between the sarcopenia group and the non-sarcopenia group, with the latter serving as the control group (Table 1).
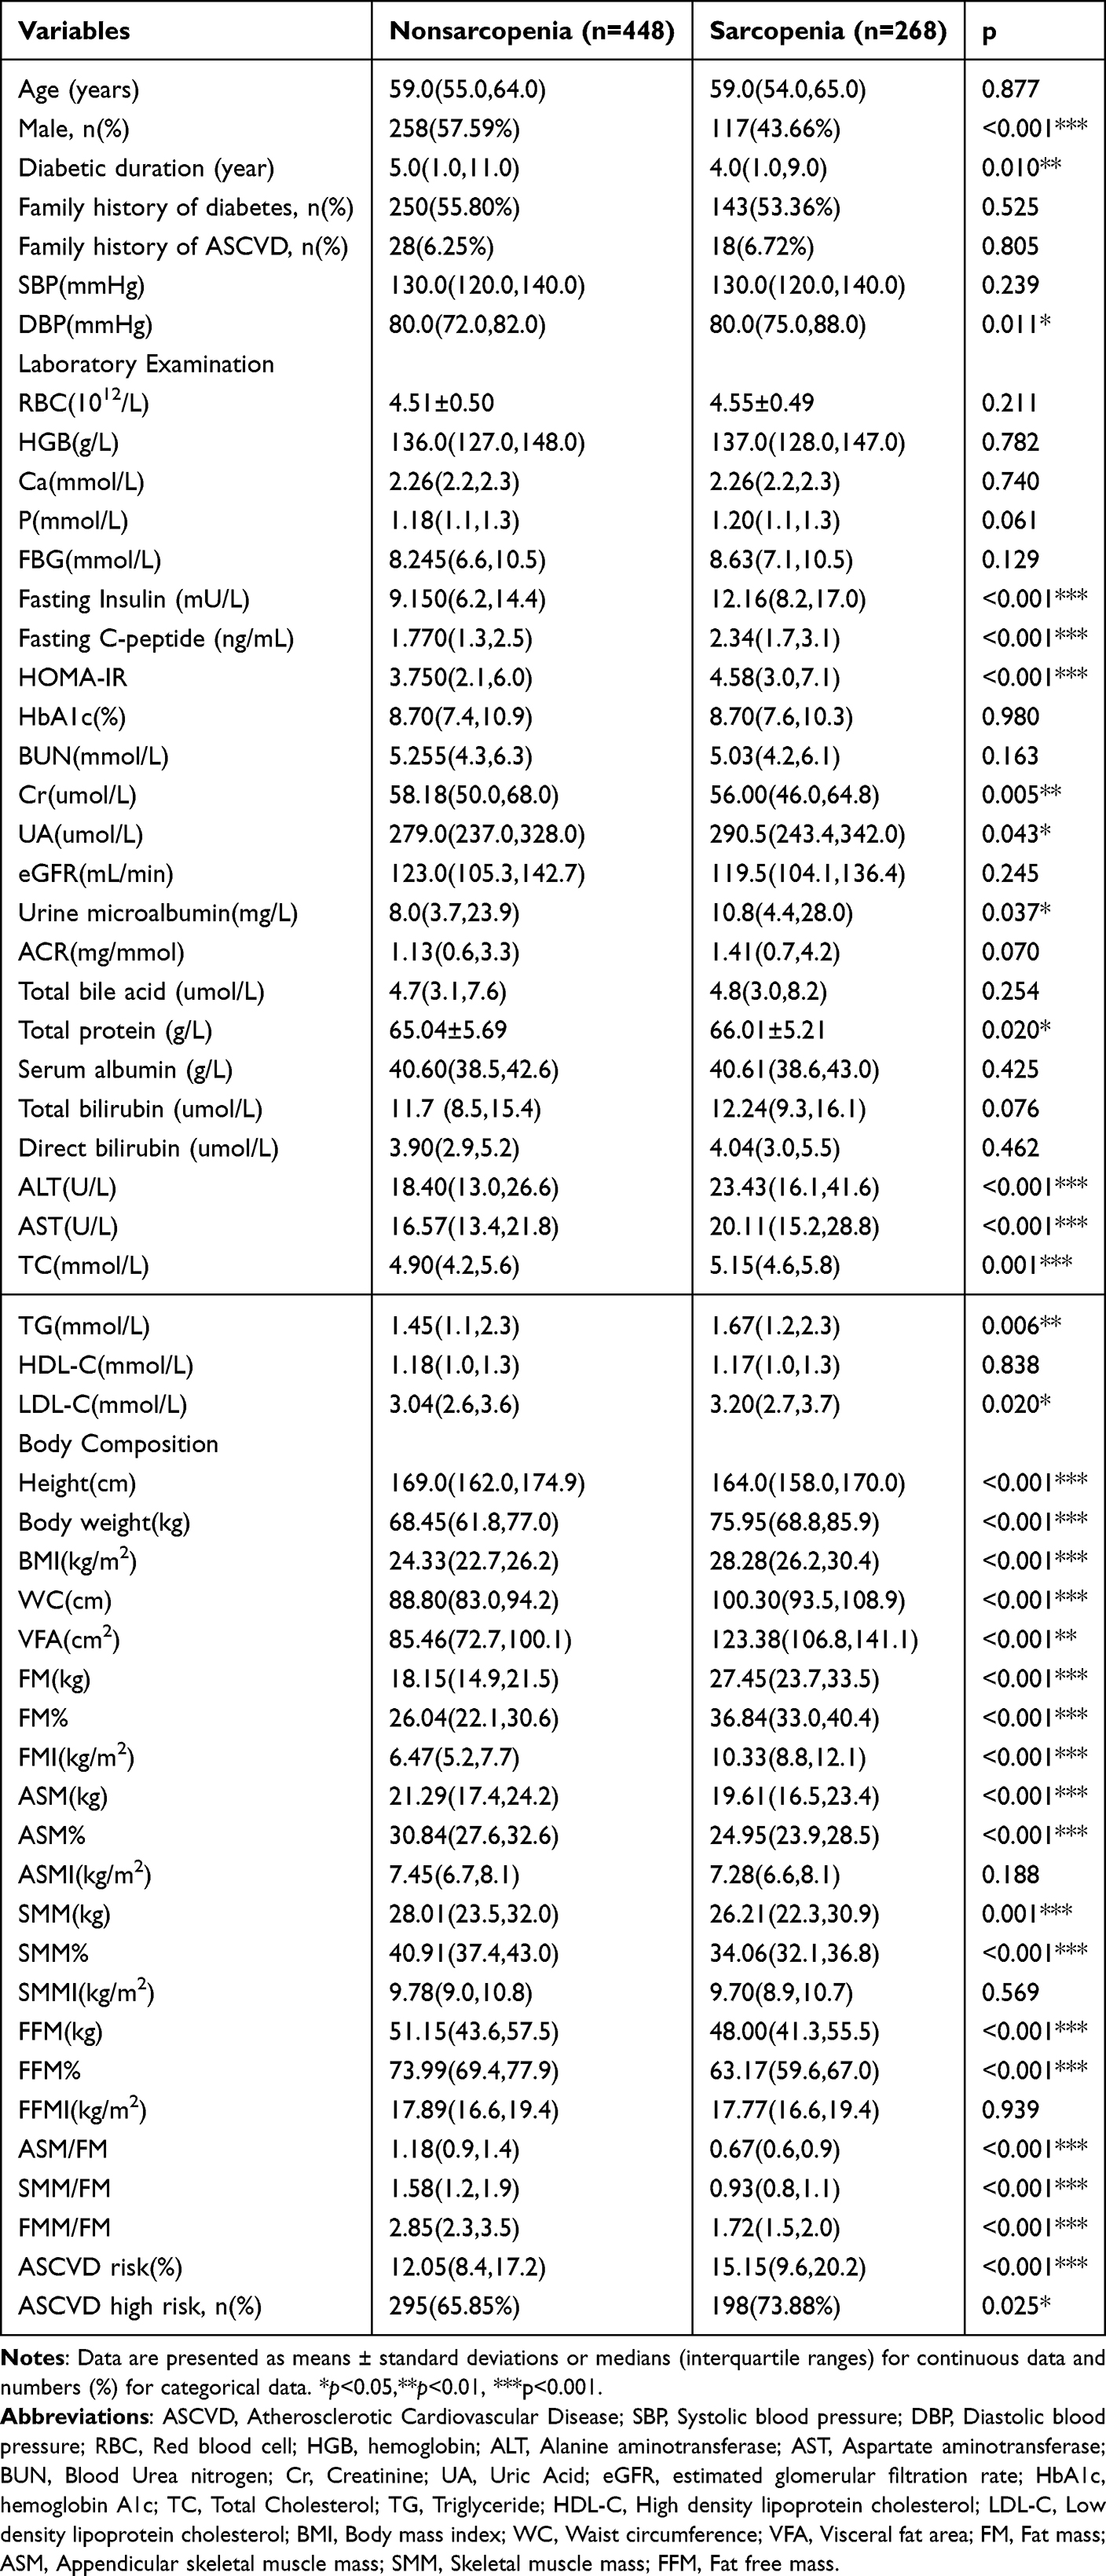 |
Table 1 General Characteristics of the Participants |
The results showed no statistically significant difference was observed between the two groups in terms of age (P=0.877). The sarcopenia group had fewer males (43.66% vs 57.59%, P<0.001) and a shorter diabetes duration (4.0 vs 5.0 years, P=0.010) compared to controls. The rates of family history of diabetes, CVD, and SBP were comparable (P>0.05). However, the sarcopenia group comprised patients with higher DBP (P=0.011).
Laboratory tests showed no significant differences in red blood cell count, hemoglobin, blood calcium, phosphorus, fasting glucose, eGFR, BUN, glycated hemoglobin, microalbumin to creatinine ratio, total bile acid, albumin, bilirubins, and HDL-C (all P>0.05). The sarcopenia group had elevated levels of fasting insulin (P<0.001), C-peptide (P<0.001), and HOMA-IR (P<0.001) compared to controls.
Renal function in the sarcopenia group showed lower SCr levels (P=0.005), higher UA (P=0.043), and microalbumin levels (P=0.037) than controls. Liver function was marked by increased total protein (P=0.020), ALT (P<0.001), and AST (P<0.001). The sarcopenia group also had higher TC (P=0.001), TG (P=0.006), and LDL-C (P=0.020) levels.
With respect to body composition parameters, corrected for height, there were no statistically significant differences in lean body The sarcopenia group had significantly lower height and higher weight, BMI, waist circumference, and visceral fat area compared to controls (all P<0.001). They also had higher fat mass (FM, FM%, FMI, all P<0.001) but lower appendicular skeletal muscle (ASM, ASM%, P<0.001), skeletal muscle mass (SMM, SMM%, P<0.001), and lean body mass (FFM, FFM%, P<0.001). When adjusted for body fat, body composition parameters (ASM/FM, SMM/FM, FMM/FM) were lower in the sarcopenia group (all P<0.001). The sarcopenia group exhibited a higher ASCVD risk score and a greater incidence of high ASCVD risk (P<0.001, P=0.025, respectively).
Baseline Characteristics According to the Presence of Sarcopenia and Gender
Gender Differences in Body Composition: Clinical Characteristics of Sarcopenic and Non-Sarcopenic T2DM Patients (Table 2).
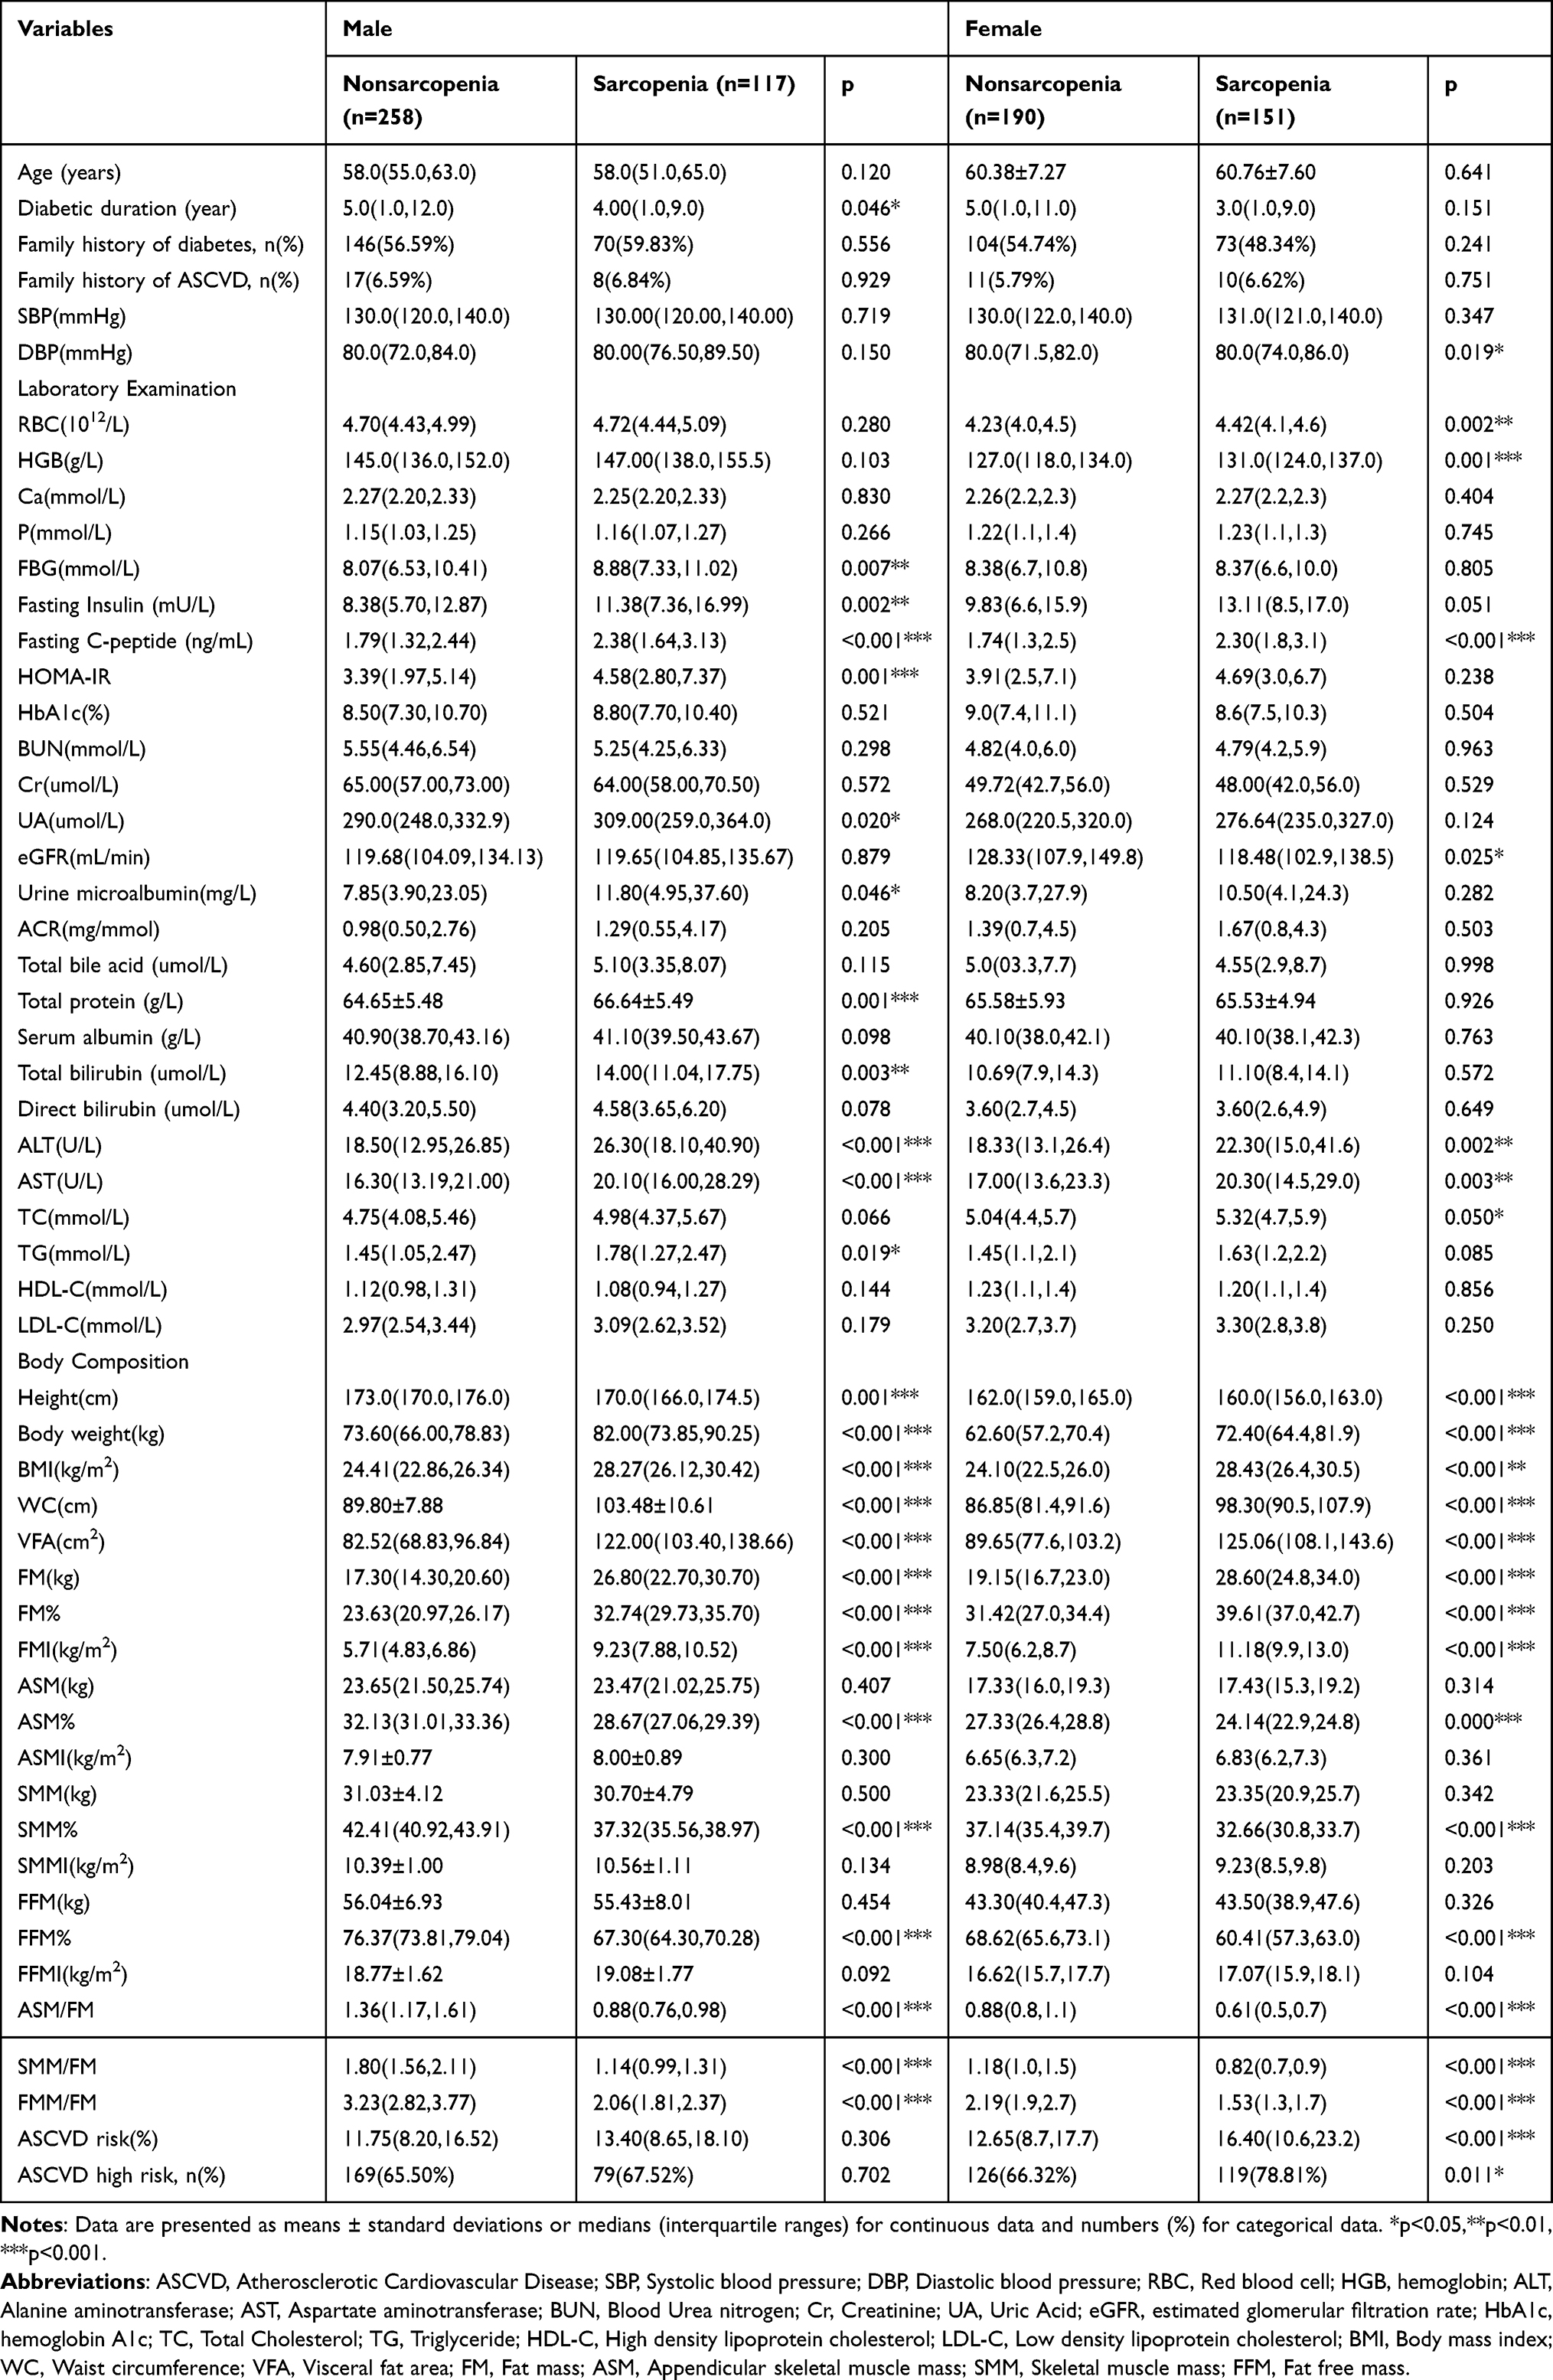 |
Table 2 Baseline Characteristics According to the Presence of Sarcopenia and Gender |
Age, SBP, and the prevalence of a positive family history for CVD and diabetes showed no significant differences between sarcopenia and non-sarcopenia groups across genders (P>0.05). In male participants, the duration of diabetes was significantly shorter in those with sarcopenia (4.00 [1.0,9.0] vs 5.0 [1.0,12.0], P=0.046); however, this difference was not observed in females. Among females, DBP was significantly higher in the sarcopenia group (80.0 [74.0,86.0] vs 80.0 [71.5,82.0], P=0.019), whereas no significant difference was found in males.
No significant differences were found in blood calcium, phosphorus, glycated hemoglobin, BUN, SCr, microalbumin to creatinine ratio, total bile acid, albumin, direct bilirubin, HDL-C, and LDL-C between groups. The sarcopenia group showed higher fasting C-peptide, ALT, and AST in both genders (C-peptide, Male: P<0.001; Female: P<0.001; ALT, Male: P<0.001; Female: P=0.002; AST, Male: P<0.001; Female: P=0.003). Males with sarcopenia had higher fasting insulin, blood glucose, HOMA-IR, UA, microalbumin, total protein, bilirubin, and TG (Glucose: P=0.007; Insulin: P=0.002; HOMA-IR: P=0.001; UA: P=0.020; Microalbumin: P=0.046; Protein: P=0.001; Bilirubin: P=0.003; TG: P=0.019), with no differences in females. Females with sarcopenia had higher RBC, hemoglobin, TC (RBC: P=0.002; HGB: P=0.001; TC: P=0.050), and lower eGFR (P=0.025), with no significant changes in males.
Body composition analyses revealed no significant differences in ASM, SMM, and FFM between groups, adjusted or not for height. The sarcopenia group had lower height but higher weight, BMI, waist circumference, and visceral fat area. Fat mass indicators (FM, FM%, FMI) were consistently higher, while muscle-related measures (ASM%, SMM%, FMM%, ASM/FM, SMM/FM, FMM/FM) were lower, adjusted for weight and fat.
ASCVD risk assessment showed higher risk in female T2DM patients with sarcopenia (16.40 vs 12.65, P<0.001) and a greater prevalence of high ASCVD risk (78.81% vs 66.32%, P=0.011). In males with T2DM, the sarcopenia group had a higher median ASCVD risk, though not statistically significant (13.40 vs 11.75, P=0.306).
Correlation Between Cardiovascular Disease Risk and Clinical Parameters
The analysis revealed significant positive correlations between the 10-year ASCVD risk and age (r=0.644, P<0.001), duration of diabetes (r=0.130, P=0.001), SBP (r=0.531, P<0.001), and DBP (r=0.263, P<0.001). Additionally, positive correlations were observed with fasting insulin (r=0.158, P<0.001), fasting C-peptide (r=0.122, P=0.005), HOMA-IR (r=0.139, P=0.001), BUN (r=0.089, P=0.017), SCr (r=0.077, P=0.041), urine microalbumin (r=0.146, P<0.001), and urine microalbumin-to-creatinine ratio (r=0.124, P=0.001). Negative correlations were found with red blood cell count (r=−0.131, P<0.001), hemoglobin concentration (r=−0.123, P=0.001), and eGFR (r=−0.251, P<0.001). No significant correlations were detected with blood calcium, blood phosphorus, fasting glucose, glycated hemoglobin, UA, total bile acid, direct bilirubin, total bilirubin, albumin, total protein, ALT, AST, TC, TG, HDL-C, and LDL-C.
The analysis demonstrated significant correlations between the 10-year ASCVD risk and body composition parameters. Positive correlations were found with BMI (r=0.166, P<0.001), waist circumference (r=0.106, P=0.005), visceral fat area (r=0.213, P<0.001), fat mass (FM: r=0.200, P<0.001), fat mass percentage (FM%: r=0.263, P<0.001), and fat mass index (FMI: r=0.247, P<0.001). Conversely, a negative correlation was identified with height (r=−0.173, P<0.001), and similarly negative correlations were observed with muscle parameters, both height-corrected and uncorrected (ASM: r=−0.127, P=0.001; ASM%: r=−0.249, P<0.001; ASMI: r=−0.080, P=0.032; SMM: r=−0.151, P<0.001; SMM%: r=−0.285, P<0.001; SMMI: r=−0.105, P=0.005; FFM: r=−0.136, P<0.001; FFM%: r=−0.263, P<0.001; ASM/FM: r=−0.224, P<0.001; SMM/FM: r=−0.231, P<0.001; FMM/FM: r=−0.225, P<0.001). There was no significant correlation with weight and height-corrected fat-free mass (FFMI).
After stratifying by gender, the analysis maintained significant correlations between the 10-year ASCVD risk and age, diabetes duration, SBP, DBP, fasting insulin, SCr, and eGFR in both males and females. No significant correlation with red blood cell count and hemoglobin concentration was found post-gender stratification. In male T2DM patients, fasting C-peptide and BUN showed no significant correlation with 10-year ASCVD risk. Similarly, in female T2DM patients, HOMA-IR, urine microalbumin, and the urine microalbumin-to-creatinine ratio were not significantly correlated with 10-year ASCVD risk.
Regarding body composition, after gender stratification, no significant correlation was found between four-limb skeletal muscle mass (ASM, ASMI) and 10-year ASCVD risk. In males with T2DM, BMI, height, waist circumference, visceral fat area, and both height-corrected and uncorrected fat mass (FM, FMI) showed no significant correlation with 10-year ASCVD risk. In females with T2DM, no significant correlation was observed with skeletal muscle mass (SMM, SMMI) and uncorrected FFM. However, correlations between body composition parameters adjusted for weight and fat (FM%, ASM%, SMM%, FFM%, ASM/FM, SMM/FM, FMM/FM) and the 10-year ASCVD risk remained significant post-gender stratification (Table 3).
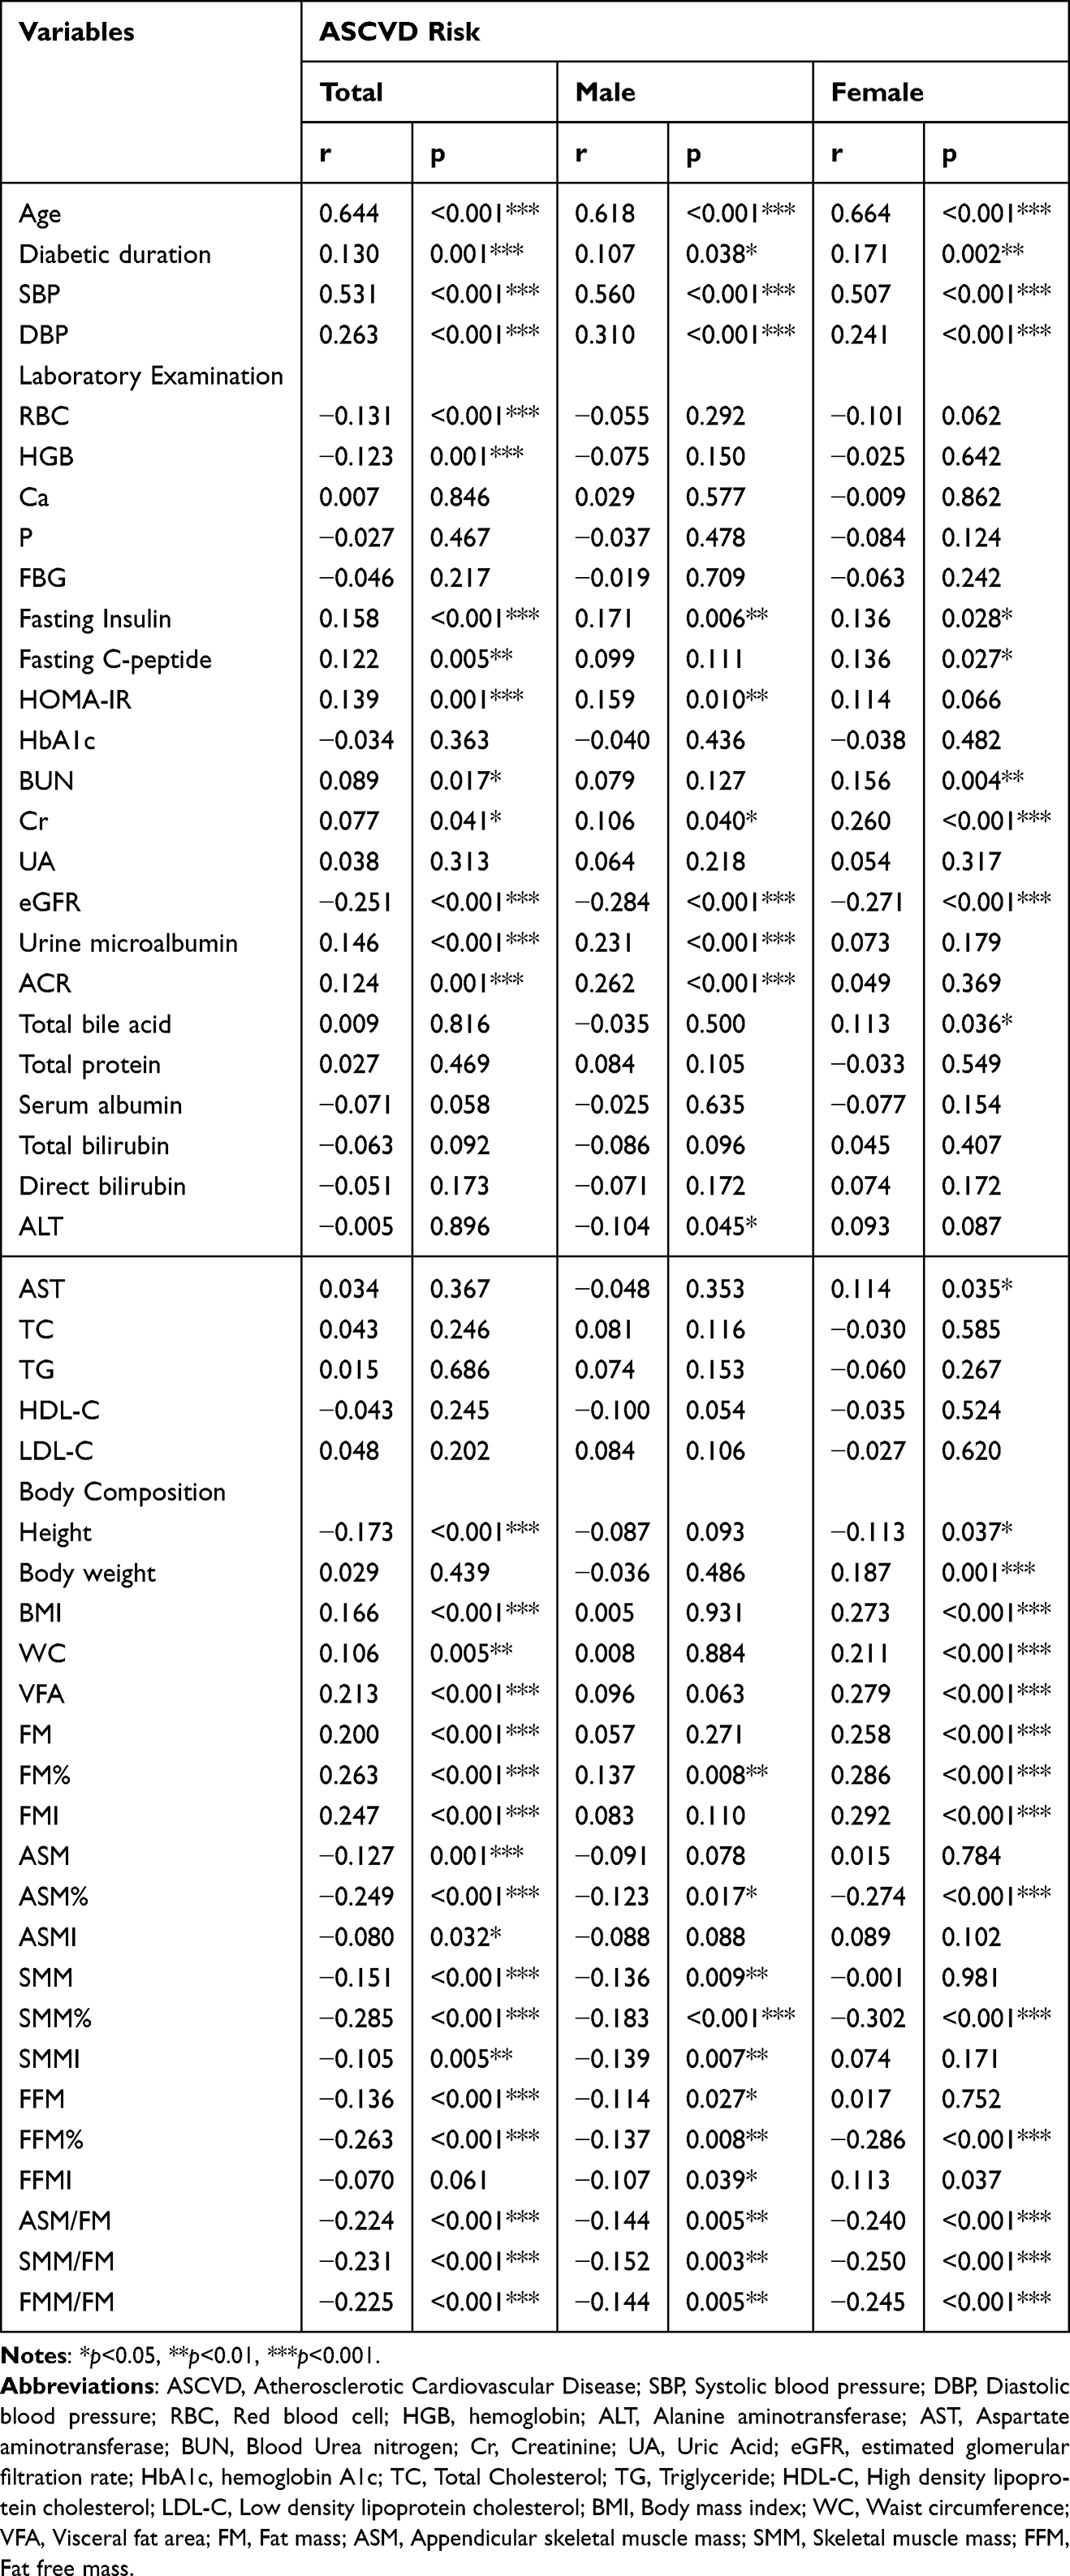 |
Table 3 Correlation Between Cardiovascular Disease Risk and Clinical Parameters |
Logistic Regression Analysis of Body Composition Parameters and High ASCVD Risk
In single-factor logistic regression, BMI (OR, 1.047; P=0.043), visceral fat area (OR, 1.010; P<0.001), and adjusted FM [FM (OR, 1.032; P=0.004); FM% (OR, 1.045; P<0.001); FMI (OR, 1.107; P=0.001)] were ASCVD risk factors. Adjusted muscle mass [ASM% (OR, 0.928; P=0.001); SMM (OR, 0.964; P=0.014); SMM% (OR, 0.921; P<0.001); SMMI (OR, 0.861; P=0.027); FFM (OR, 0.981; P=0.033); FFM% (OR, 0.957; P<0.001)] and muscle-to-fat ratios [ASM/FM (OR, 0.628; P=0.004); SMM/FM (OR, 0.680; P=0.002); FMM/FM (OR, 0.814; P=0.003)] were protective.
In the adjusted multi-factor logistic regression analysis, BMI, visceral fat area, FM (including FM, FM%, FMI), and waist circumference (OR, 1.048; P<0.001) were confirmed as ASCVD risk factors. Conversely, muscle-related measures (ASM%, SMM%, FFM%, ASM/FM, SMM/FM, FMM/FM) continued to be protective against ASCVD risk.
Even after adjusting for SBP, fasting insulin, and eGFR, the findings remained consistent with the initial model, indicating robust associations (Table 4).
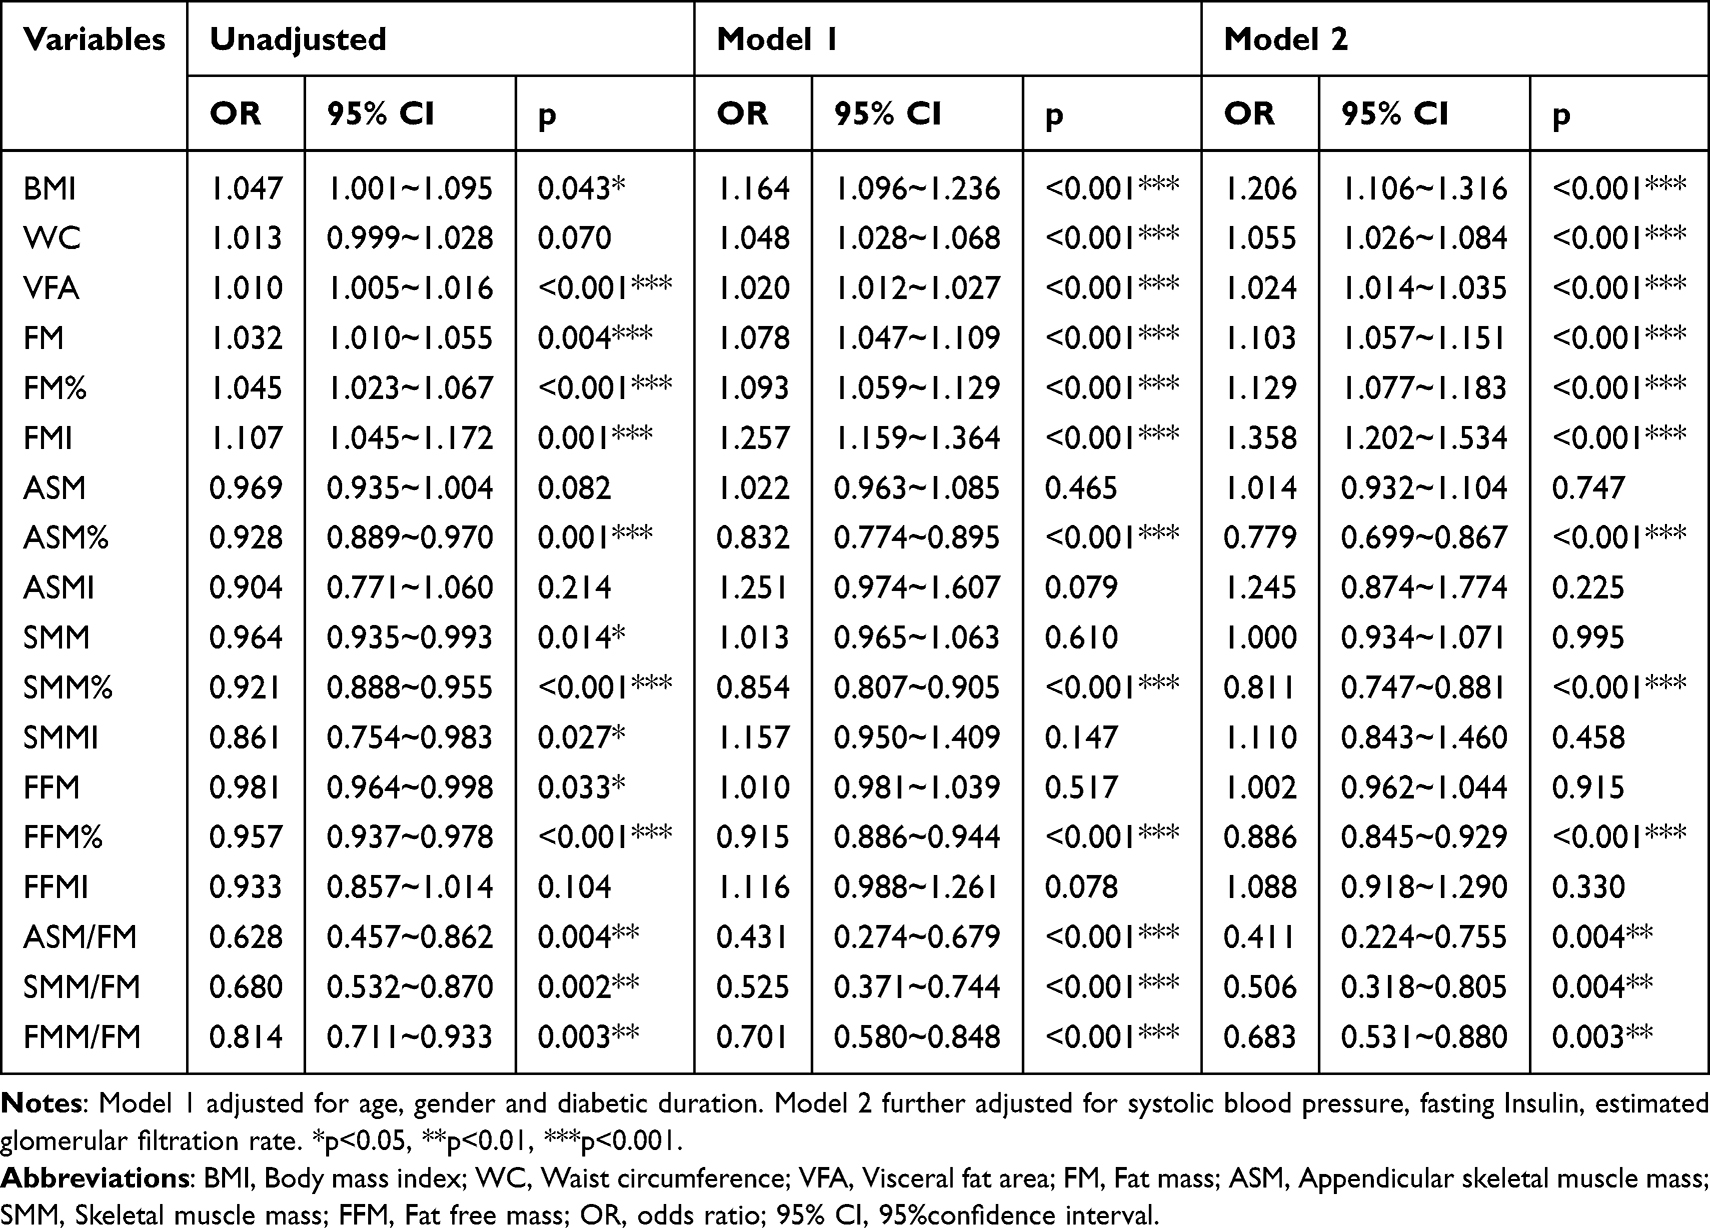 |
Table 4 Logistic Regression Analysis of Body Composition Parameters and High ASCVD Risk |
Discussion
Sarcopenia, an increasingly recognized complex condition, is characterized by a continuous reduction in SMM, strength, and function. While sarcopenia is most prominent in older individuals, it has garnered widespread research interest within the context of various chronic diseases, particularly in patients with T2DM.25,26 Sarcopenia has been identified as a chronic complication of diabetes, and its significant association with adverse health outcomes, including declining kidney function, sleep disorders, peripheral neuropathy, and all-cause mortality risk, has sparked extensive research interest.23 CVD stands as a leading cause of death in diabetic patients, and sarcopenia is closely linked to the risk of CVD.27 Low muscle mass has been reported to be associated with coronary artery calcification and as an independent risk factor for coronary artery disease.28 Furthermore, a study discovered that sarcopenia is linked to increased arterial stiffness in middle-aged and elderly men.29 These research findings imply that sarcopenia may play a crucial role in the close association between diabetes and CVD, serving as a significant link between the two conditions.
Herein, our present study contributes to existing literature by highlighting the significance of sarcopenia as an independent risk factor for ASCVD in patients with T2DM. It extends previous findings by using the China-PAR model, a risk prediction model tailored for the Chinese population, which takes into account regional factors and population characteristics. This model emphasizes the unique impact of sarcopenia on cardiovascular risk in Chinese T2DM patients. The study’s findings underscore the need for incorporating sarcopenia assessment in the routine evaluation of cardiovascular risk in T2DM patients, which could potentially modify clinical practice by prompting earlier interventions to manage sarcopenia and mitigate its impact on ASCVD risk.
Specifically, our results indicate that individuals with coexisting sarcopenia in T2DM face a notably higher 10-year ASCVD risk, with a higher incidence rate of ASCVD high risk. This difference remains significant in female T2DM patients, while in males, the median ASCVD risk in the sarcopenia group is slightly higher than that in the non-sarcopenia group, although no statistically significant difference is found between the two. The study results indicate that sarcopenia is associated with an increased 10-year ASCVD risk in T2DM patients, and the decline in muscle mass can independently predict an elevated risk of CVD. This finding underscores the significance of sarcopenia in T2DM patients, serving not only as an indicator of ASCVD risk but also potentially as an independent risk factor. This research outcome aligns with previous academic studies. PARK et al30 found a significant positive correlation between CVD incidence and sarcopenia in males after considering multiple parameters associated with CVD. They also observed a strong positive correlation between sarcopenia and stroke, as well as a moderate correlation between sarcopenia and angina. Another study conducted by ZENG et al31 in 2022 confirmed the independent correlation between sarcopenia and increased CVD risk in diabetic patients. The study also emphasized the significant association between anemia, sarcopenia, and 10-year CVD risk in T2DM patients.
Recent studies have turned their attention to body composition, particularly the potential impact of fat distribution on CVD risk.32 In the elderly population, there appears to be some inconsistency in the relationship between mortality rate and BMI.33 This phenomenon may be related to the reduction in SMM and increase in fat content in the elderly. Even in relatively young populations, BMI may still fall within the normal range, but sarcopenic obesity tends to occur in the elderly. This implies an association between decreased SMM, elevated fat content, and the increased incidence of related metabolic diseases, including CVD. Our study also confirmed a negative correlation between ASCVD risk and body muscle parameters, and a positive correlation with parameters related to fat content. Height- and weight-adjusted fat mass (FM, FM%, FMI) were identified as risk factors for ASCVD high risk, while body muscle parameters adjusted for weight and fat (ASM%, SMM%, FFM%, ASM/FM, SMM/FM, FMM/FM) were identified as protective factors for ASCVD high risk.
Currently, the mechanisms underlying the relationship between sarcopenia and CVD remain unknown. However, patients with muscle loss often exhibit a high amount of visceral fat or abnormal fat distribution.34 The Framingham Heart Study suggests that excess visceral fat is a predictive factor for CVD, due to its impact on heart metabolism through the secretion of adipocyte-derived factors and other vasoactive substances.35 Additionally, Lim et al propose that sarcopenia is involved in the occurrence and development of CVD through mechanisms such as insulin resistance, oxidative stress, mitochondrial dysfunction, and inflammatory factors.19 Bellanti et al identified markers of increased oxidative stress cycle in sarcopenia, which are associated with CVD risk in sarcopenic obesity.36
Muscles are considered a significant endocrine organ, capable of secreting various biologically active molecules, known as myokines. These include IL-6, IL-15, IL-8, among others, which have protective effects on the cardiovascular system. These molecular factors contribute to reducing adverse cardiac remodeling and maintaining normal cardiovascular function. Therefore, sarcopenia may raise the occurrence of CVD via affecting the production and release of these molecular factors. The interaction between chronic inflammation and oxidative stress in sarcopenia and chronic heart failure is complex and multi-layered. They can affect both muscles and the heart through multiple mechanisms, leading to impaired function and structural changes.37
In comparison to previous studies, our research employs the China-PAR risk prediction model20 to assess ASCVD risk. This model is specifically designed for the Chinese mainland population, providing more accurate risk assessment due to its consideration of regional differences and population characteristics. This further underscores the importance of sarcopenia in T2DM patients in China and its impact on the risk of CVD.
Our study has the following limitations: First, the cross-sectional design only permits the observation of associations between sarcopenia and 10-year ASCVD risk scores without establishing causality. This design inherently lacks the ability to track temporal changes, thereby precluding definitive conclusions about sarcopenia causing increased CVD risk. Second, the recruitment of hospitalized patients introduces potential selection bias, limiting the study’s external validity and generalizability to the broader T2DM population. The absence of participants from community settings or outpatient clinics might skew the representativeness of our findings. Third, the reliance on self-reported histories to exclude cardiovascular diseases, without verification through imaging tests such as coronary angiography or brain MRI, raises the possibility of including participants with undiagnosed CVD, thereby compromising the accuracy of CVD risk assessment. Third, the omission of data on grip strength and gait speed—key sarcopenia indicators—restricts our ability to fully evaluate muscle health. Fourth, while our study did use a recognized method to diagnose sarcopenia based on ASM%, following the guidelines by Lim et al, we acknowledge the AWGS 2019 criteria for “severe sarcopenia” which includes assessments of muscle mass, strength, and physical performance.
In future research, efforts should be made to address these limitations and employ more rigorous methods to explore the causal relationship between sarcopenia and ASCVD risk. This may include adopting a longitudinal study design, recruiting a more representative sample of participants, conducting more comprehensive clinical assessments, including imaging examinations and muscle function tests, and considering other potential confounding factors. Through these improvements, we can gain a deeper understanding of the relationship between sarcopenia and CVD, providing more reliable scientific evidence for prevention and treatment.
In summary, sarcopenia, as a disease closely associated with CVD in T2DM patients, has attracted widespread attention in the current research landscape. The findings of this study further support the significance of sarcopenia in T2DM patients and its contribution to ASCVD risk. The exploration of underlying mechanisms reveals interactions between various factors, including nutritional deficiencies, cell apoptosis, oxidative stress, mitochondrial dysfunction, and chronic inflammation, which may lead to cardiac dysfunction and adverse cardiac remodeling. Additionally, muscles have the capacity to secrete various cardioprotective factors, which is crucial for maintaining normal cardiovascular function. Future research efforts will help us gain a more comprehensive understanding of the relationship between sarcopenia and CVD in T2DM patients, as well as a detailed explanation of the relevant mechanisms. These research outcomes are expected to provide more effective strategies and interventions for the prevention and management of CVD in T2DM patients. Therefore, in-depth research on the association between sarcopenia and CVD will have a positive impact on improving the health status of T2DM patients.
Ethics Approval and Consent to Participate
This proposal obtained approval from the local provincial committee (Medical Ethics Committee of Tianjin People’s Hospital; reference number 2018-C08) in December 2018. Any modifications proposed to the protocol will be subject to a new review and approval. This trial also complies with the principles of the Declaration of Helsinki. All participants will give written informed consent to participate in the study.
Acknowledgments
We gratefully thank Tianjin Science and Technology Committee (J.N.L, Grant Number 18ZXDBSY00120) and the Science and Technology Project of the Tianjin Municipal Health Commission (J.N.L, Grant Number ZD20006) for funding our research.
Funding
Funding for this work was provided by a competitive grant by the Tianjin Science and Technology Committee (J.N.L, Grant Number 18ZXDBSY00120) and the Science and Technology Project of the Tianjin Municipal Health Commission (J.N.L, Grant Number ZD20006).
Disclosure
The authors report no conflicts of interest in this work.
References
1. Beaudart C, Zaaria M, Pasleau F, Reginster JY, Bruyere O, Wright JM. Health outcomes of sarcopenia: a systematic review and meta-analysis. PLoS One. 2017;12(1):e0169548. doi:10.1371/journal.pone.0169548
2. Rosenberg IH. Sarcopenia: origins and clinical relevance. J Nutr. 1997;127(5 Suppl):990S–991S. doi:10.1093/jn/127.5.990S
3. Baumgartner RN, Koehler KM, Gallagher D, et al. Epidemiology of sarcopenia among the elderly in New Mexico. Am J Epidemiol. 1998;147(8):755–763. doi:10.1093/oxfordjournals.aje.a009520
4. Filippin LI, Teixeira VN, da Silva MP, Miraglia F, da Silva FS. Sarcopenia: a predictor of mortality and the need for early diagnosis and intervention. Aging Clin Exp Res. 2015;27(3):249–254. doi:10.1007/s40520-014-0281-4
5. Mayhew AJ, Amog K, Phillips S, et al. The prevalence of sarcopenia in community-dwelling older adults, an exploration of differences between studies and within definitions: a systematic review and meta-analyses. Age Ageing. 2019;48(1):48–56. doi:10.1093/ageing/afy106
6. Ethgen O, Beaudart C, Buckinx F, Bruyere O, Reginster JY. The future prevalence of sarcopenia in Europe: a claim for public health action. Calcif Tissue Int. 2017;100(3):229–234. doi:10.1007/s00223-016-0220-9
7. Saeedi P, Petersohn I, Salpea P, et al. Global and regional diabetes prevalence estimates for 2019 and projections for 2030 and 2045: results from the International Diabetes Federation Diabetes Atlas, 9(th) edition. Diabet Res Clin Pract. 2019;157:107843. doi:10.1016/j.diabres.2019.107843
8. Briggs AM, Woolf AD, Dreinhofer K, et al. Reducing the global burden of musculoskeletal conditions. Bull World Health Organ. 2018;96(5):366–368. doi:10.2471/BLT.17.204891
9. St-Onge MP, Gallagher D. Body composition changes with aging: the cause or the result of alterations in metabolic rate and macronutrient oxidation? Nutrition. 2010;26(2):152–155. doi:10.1016/j.nut.2009.07.004
10. Hong S, Chang Y, Jung HS, Yun KE, Shin H, Ryu S. Relative muscle mass and the risk of incident type 2 diabetes: a cohort study. PLoS One. 2017;12(11):e0188650. doi:10.1371/journal.pone.0188650
11. Wang Y, Rimm EB, Stampfer MJ, Willett WC, Hu FB. Comparison of abdominal adiposity and overall obesity in predicting risk of type 2 diabetes among men. Am J Clin Nutr. 2005;81(3):555–563. doi:10.1093/ajcn/81.3.555
12. Wong E, Backholer K, Gearon E, et al. Diabetes and risk of physical disability in adults: a systematic review and meta-analysis. Lancet Diabetes Endocrinol. 2013;1(2):106–114.
13. Roth GA, Mensah GA, Johnson CO, et al. Global burden of cardiovascular diseases and risk factors, 1990–2019: update from the GBD 2019 Study. J Am Coll Cardiol. 2020;76(25):2982–3021.
14. Yusuf S, Joseph P, Rangarajan S, et al. Modifiable risk factors, cardiovascular disease, and mortality in 155 722 individuals from 21 high-income, middle-income, and low-income countries (PURE): a prospective cohort study. Lancet. 2020;395(10226):795–808. doi:10.1016/S0140-6736(19)32008-2
15. Gao K, Cao LF, Ma WZ, et al. Association between sarcopenia and cardiovascular disease among middle-aged and older adults: findings from the China health and retirement longitudinal study. EClinicalMedicine. 2022;44:101264. doi:10.1016/j.eclinm.2021.101264
16. He N, Zhang Y, Zhang L, Zhang S, Ye H. Relationship between sarcopenia and cardiovascular diseases in the elderly: an overview. Front Cardiovasc Med. 2021;8:743710. doi:10.3389/fcvm.2021.743710
17. Sasaki KI, Kakuma T, Sasaki M, et al. The prevalence of sarcopenia and subtypes in cardiovascular diseases, and a new diagnostic approach. J Cardiol. 2020;76(3):266–272.
18. Lim HS, Park YH, Suh K, et al. Association between sarcopenia, sarcopenic obesity, and chronic disease in Korean elderly. J Bone Metab. 2018;25(3):187–193. doi:10.11005/jbm.2018.25.3.187
19. Lim S, Kim JH, Yoon JW, et al. Sarcopenic obesity: prevalence and association with metabolic syndrome in the Korean Longitudinal Study on Health and Aging (KLoSHA). Diabetes Care. 2010;33(7):1652–1654. doi:10.2337/dc10-0107
20. Yang X, Li J, Hu D, et al. Predicting the 10-year risks of atherosclerotic cardiovascular disease in Chinese population: the China-PAR Project (Prediction for ASCVD Risk in China). Circulation. 2016;134(19):1430–1440. doi:10.1161/CIRCULATIONAHA.116.022367
21. Alberti KG, Zimmet PZ. Definition, diagnosis and classification of diabetes mellitus and its complications. Part 1: diagnosis and classification of diabetes mellitus provisional report of a WHO consultation. Diabet Med. 1998;15(7):539–553. doi:10.1002/(SICI)1096-9136(199807)15:7<539::AID-DIA668>3.0.CO;2-S
22. Mauer SM. Structural-functional correlations of diabetic nephropathy. Kidney Int. 1994;45(2):612–622. doi:10.1038/ki.1994.80
23. Kalyani RR, Corriere M, Ferrucci L. Age-related and disease-related muscle loss: the effect of diabetes, obesity, and other diseases. Lancet Diabetes Endocrinol. 2014;2(10):819–829. doi:10.1016/S2213-8587(14)70034-8
24. Yang XL, Chen JC, Li JX, et al. Risk stratification of atherosclerotic cardiovascular disease in Chinese adults. Chronic Dis Transl Med. 2016;2(2):102–109. doi:10.1016/j.cdtm.2016.10.001
25. Umegaki H. Sarcopenia and frailty in older patients with diabetes mellitus. Geriatr Gerontol Int. 2016;16(3):293–299. doi:10.1111/ggi.12688
26. Wang M, Tan Y, Shi Y, Wang X, Liao Z, Wei P. Diabetes and sarcopenic obesity: pathogenesis, diagnosis, and treatments. Front Endocrinol. 2020;11:568. doi:10.3389/fendo.2020.00568
27. Hida T, Imagama S, Ando K, et al. Sarcopenia and physical function are associated with inflammation and arteriosclerosis in community-dwelling people: the Yakumo study. Mod Rheumatol. 2018;28(2):345–350. doi:10.1080/14397595.2017.1349058
28. Dos Santos MR, Saitoh M, Ebner N, et al. Sarcopenia and endothelial function in patients with chronic heart failure: results from the Studies Investigating Comorbidities Aggravating Heart Failure (SICA-HF). J Am Med Dir Assoc. 2017;18(3):240–245. doi:10.1016/j.jamda.2016.09.006
29. Park SJ, Ryu SY, Park J, Choi SW. Association of sarcopenia with metabolic syndrome in Korean population using 2009–2010 Korea National Health and Nutrition Examination Survey. Metab Syndr Relat Disord. 2019;17(10):494–499. doi:10.1089/met.2019.0059
30. Park S, Ham JO, Lee BK. A positive association between stroke risk and sarcopenia in men aged >/= 50 years,but not women: results from the Korean National Health and Nutrition Examination Survey 2008–2010. J Nutr Health Aging. 2014;18(9):806–812. doi:10.1007/s12603-014-0553-x
31. Zeng F, Huang L, Zhang Y, et al. Additive effect of sarcopenia and anemia on the 10-year risk of cardiovascular disease in patients with type 2 diabetes. J Diabetes Res. 2022;2022:2202511. doi:10.1155/2022/2202511
32. Amato MC, Guarnotta V, Giordano C. Body composition assessment for the definition of cardiometabolic risk. J Endocrinol Invest. 2013;36(7):537–543. doi:10.3275/8943
33. Karcher HS, Holzwarth R, Mueller HP, et al. Body fat distribution as a risk factor for cerebrovascular disease: an MRI-based body fat quantification study. Cerebrovasc Dis. 2013;35(4):341–348. doi:10.1159/000348703
34. Song MY, Ruts E, Kim J, Janumala I, Heymsfield S, Gallagher D. Sarcopenia and increased adipose tissue infiltration of muscle in elderly African American women. Am J Clin Nutr. 2004;79(5):874–880. doi:10.1093/ajcn/79.5.874
35. Fox CS, Massaro JM, Hoffmann U, et al. Abdominal visceral and subcutaneous adipose tissue compartments: association with metabolic risk factors in the Framingham Heart Study. Circulation. 2007;116(1):39–48. doi:10.1161/CIRCULATIONAHA.106.675355
36. Bellanti F, Romano AD, Lo Buglio A, et al. Oxidative stress is increased in sarcopenia and associated with cardiovascular disease risk in sarcopenic obesity. Maturitas. 2018;109:6–12. doi:10.1016/j.maturitas.2017.12.002
37. Sanada K, Miyachi M, Tanimoto M, et al. A cross-sectional study of sarcopenia in Japanese men and women: reference values and association with cardiovascular risk factors. Eur J Appl Physiol. 2010;110(1):57–65. doi:10.1007/s00421-010-1473-z
 © 2024 The Author(s). This work is published and licensed by Dove Medical Press Limited. The full terms of this license are available at https://www.dovepress.com/terms.php and incorporate the Creative Commons Attribution - Non Commercial (unported, v3.0) License.
By accessing the work you hereby accept the Terms. Non-commercial uses of the work are permitted without any further permission from Dove Medical Press Limited, provided the work is properly attributed. For permission for commercial use of this work, please see paragraphs 4.2 and 5 of our Terms.
© 2024 The Author(s). This work is published and licensed by Dove Medical Press Limited. The full terms of this license are available at https://www.dovepress.com/terms.php and incorporate the Creative Commons Attribution - Non Commercial (unported, v3.0) License.
By accessing the work you hereby accept the Terms. Non-commercial uses of the work are permitted without any further permission from Dove Medical Press Limited, provided the work is properly attributed. For permission for commercial use of this work, please see paragraphs 4.2 and 5 of our Terms.