")
Back to Journals » Journal of Multidisciplinary Healthcare » Volume 17
Factors Associated with Elderly Health-Related Quality of Life in Tibet: A Cross-Sectional Study from a Health Ecological Perspective
Authors Pan Q , Hu J, Yangzong, Zhang X, Zhaxidawa
Received 22 August 2023
Accepted for publication 16 November 2023
Published 25 January 2024 Volume 2024:17 Pages 177—190
DOI https://doi.org/10.2147/JMDH.S436486
Checked for plagiarism Yes
Review by Single anonymous peer review
Peer reviewer comments 2
Editor who approved publication: Dr Scott Fraser
Qiuyu Pan,1,2,* Jun Hu,1,3,* Yangzong,1 Xiuling Zhang,4 Zhaxidawa1
1Medical College of Tibet University, Lhasa, Tibet, 850000, People’s Republic of China; 2School of Public Health, North Sichuan Medical College, Nanchong, Sichuan, 610037, People’s Republic of China; 3School of Management, Shandong University of Traditional Chinese Medicine, Jinan, Shandong, 250355, People’s Republic of China; 4The Hospital of Shandong Normal University, Jinan, Shandong, 250014, People’s Republic of China
*These authors contributed equally to this work
Correspondence: Zhaxidawa, Medical College of Tibet University, Lhasa, Tibet, 850000, People’s Republic of China, Email [email protected]
Background: Aging and its consequences are receiving considerable global attention in developed and developing countries. The health-related quality of life (HRQoL) of elderly individuals is crucial for public health and social welfare. Despite advances in understanding the health status of the elderly population in Tibet, a region located on China’s southwest border, a significant research gap remains regarding their HRQoL.
Methods: We conducted a cross-sectional study in Tibet, China, in 2018, which thoroughly examined HRQoL and its determinants in individuals aged 60 and above. The EQ-5D-VAS instrument, consisting of two standardized scales (EQ-5D-3L and EQ-VAS), was utilized to measure HRQoL. We based the selection of potential determinants on a novel health ecological model encompassing various environmental and personal factors. We employed the Least Absolute Shrinkage and Selection Operator regression to systematically pinpoint key predictive factors for dimensionality reduction. The Tobit regression analysis further elucidated the relationship between these factors and the EQ-VAS and EQ-5D-index scores.
Results: Our study encompassed 1604 elderly participants. They presented varying severity levels across all five dimensions of the EQ-5D-3L. The most commonly observed issue was pain/discomfort, with a prevalence of 40.27%. The average EQ-VAS score was 56.15 (SD=21.15), and the mean EQ-5D-index score was 0.78 (SD=0.25). Our multivariate analysis revealed that determinants such as age, sex, number of chronic illnesses, vision problems, hearing problems, physical activity, employment status, social participation, place of residence, and insurance type were significantly associated with HRQoL.
Conclusion: The HRQoL of Tibet’s elderly population presents significant concerns, especially given the region’s challenging natural conditions. This underscores the urgent need for focused policy interventions at the socio-economic strata to extend vital support and aid.
Keywords: HRQoL, the elderly, ecological model, Tibet, high altitude
Introduction
The issue of aging has been a subject of continuous concern in developed countries.1–3 Recently, attention has also been directed towards developing countries, including China.4,5 The health status of the elderly population is related to many factors, including physical activity.6 Meanwhile, it was also reported that different age groups and living situations of the older adults had distinct types of sports and activities, which might affect their quality of life.7 It holds significant implications for public health and social welfare.8,9 However, despite improvements in the health of elderly individuals reported in various regions of China,10,11 limited research has focused on the health-related quality of life (HRQoL) of the elderly population in Tibet.
Tibet, renowned for its exceptional cultural diversity and geographical intricacies, is nestled within the expanse of the Qinghai-Tibet Plateau. This unique region is distinguished by its elevated terrains, averaging over 4000 meters in elevation,12 as depicted in Figure 1. The topography gives rise to challenges, marked by low atmospheric pressure and a tenuous atmosphere, leading to diminished densities of oxygen and carbon dioxide in the air, as evidenced by lower levels of these gases.13,14 These distinct geographical and climatic features pose considerable challenges to the health and well-being of the elderly population in the region.15–17 Therefore, understanding the factors influencing the HRQoL of the elderly in Tibet is essential in developing targeted healthcare and social support interventions to enhance their overall well-being.
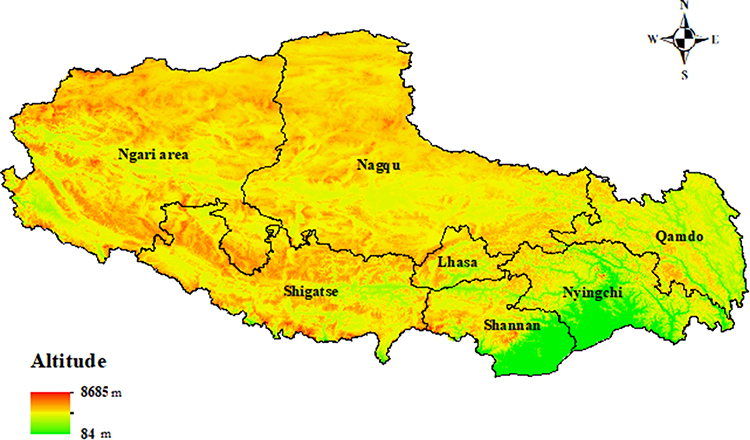 |
Figure 1 Tibet map with elevation. It was created in ArcGIS (Esri, California, USA). Data on elevation were obtained from https://www.gscloud.cn/. |
The World Health Organization (WHO) defines quality of life as an individual’s perception of their position in life, considering cultural and value systems, goals, expectations, standards, and concerns.18 HRQoL focuses on health-related aspects, daily functioning, and fulfillment.19 HRQoL is essential for the aging population because it is influenced by physical, emotional, and mental health, social support, and community engagement.20,21
In 1977, Bronfenbrenner et al proposed an ecology of human development theory that viewed child development in interrelated systems between individuals and surrounding environments.22 Later, this theory was further developed into a health ecological model representing a new research field in preventative medicine and public healthcare.23–25 Drawing upon ecological theory from the biological sciences,26 this model offers a comprehensive framework for understanding the complex interactions between individuals and their environments.27,28 Departing from single-factor explanations, the health ecological model embraces a spectrum of factors across diverse tiers, encompassing personal characteristics, lifestyle, interpersonal interaction, environmental context, and policy provisions29–32 (Figure 2). This holistic perspective enables a comprehensive understanding of HRQoL.33 Consequently, investigations that examine correlates or determinants across multiple levels are anticipated to yield more profound insights into behaviors, surpassing the scope of single-level studies. Therefore, applying the health ecological model seems rational and feasible in this context.
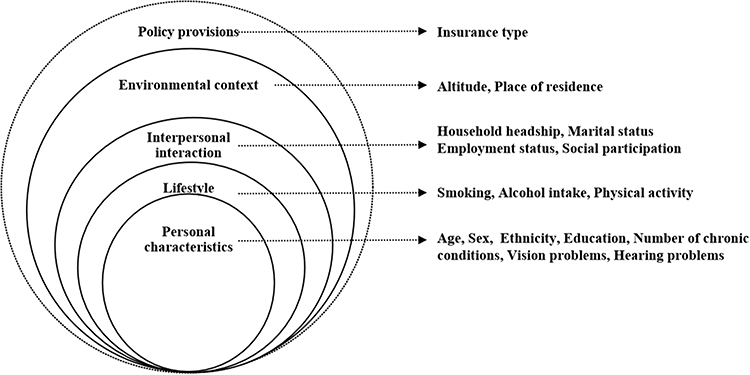 |
Figure 2 The health-related quality of life ecological model. |
This research aimed to evaluate the HRQoL of elderly individuals aged 60 and over in Tibet, situated on China’s southwest frontier, guided by the health ecological model framework. Using the EQ-5D-3L and EQ-VAS tools, we gauged their HRQoL and identified correlated determinants. The primary goal was to furnish crucial insights to facilitate the creation of tailored policies and strategies to enhance the HRQoL of Tibet’s elderly population.
Methods
Study Design and Setting
This was a cross-sectional study conducted in Tibet in 2018, which is primarily a Tibetan-speaking area and covers an expanse of 1.2028 million square kilometers, approximately constituting one-eighth of China’s total land area. Tibet is situated on the largest and highest plateau in the world.14 The elderly aged 60 and above account for 8.52% of the population in Tibet (according to the Seventh National Population Census Report).34
Study Participants and Protocol
The National Health Service Survey (NHSS) is an extensive health assessment of residents utilizing health services in China, conducted quinquennially since 1993. The NHSS employs a multi-stage stratified random cluster sampling approach to designate households for the survey.
In Tibet, to maintain uniformity and precision in data collection, all researchers engaged in this study underwent rigorous training by faculty from the Medical College of Tibet University, who had been part of national training initiatives. Trained investigators then carried out one-on-one, in-person interviews with the selected respondents.
This extensive survey spanned all seven prefectures and cities within Tibet, reaching out to 24 counties, 60 townships (or communities), and 161 villages (or neighborhood committees). In each selected village or neighborhood committee, a random sample of 20 to 60 households was chosen to participate. The cross-sectional survey encapsulated a total of 4234 households, representing 13,102 individuals. For this research, the emphasis was on the elderly segment, specifically those aged 60 and above.
Data Collections
The data of the independent and dependent variables were obtained through a questionnaire (Table 1). The independent variables were selected from five health ecological model categories: Personal characteristics, Lifestyle variables, Interpersonal interaction variables, Environmental context variables, and Policy provisions variables. The dependent variable was the outcome measurement on HRQoL, which was assessed by the EuroQol 5 Dimensions Questionnaire-visual analog scale (EQ-5D-VAS).
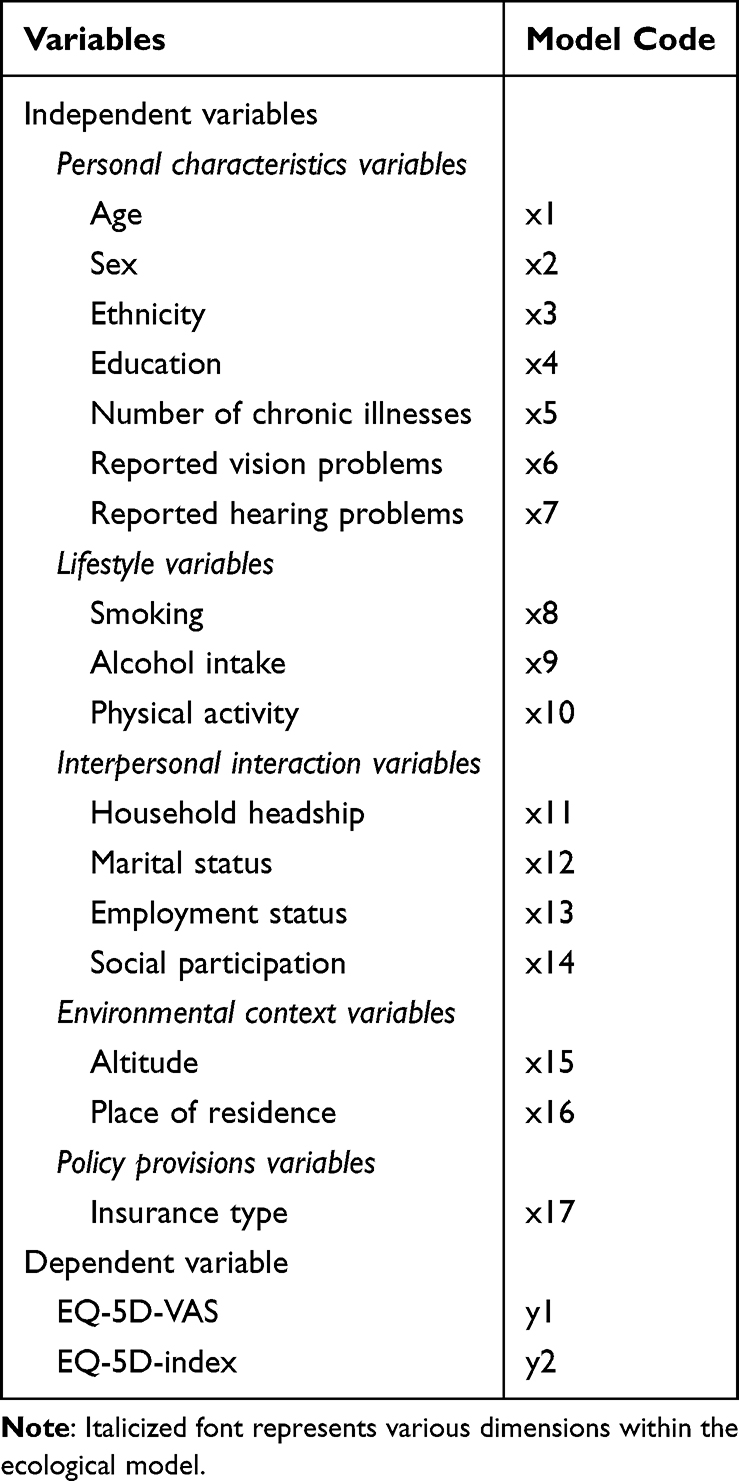 |
Table 1 Dependent and Independent Variables |
Independent Variables Selected Based on the Health Ecological Model
Personal Characteristics Variables
Year of birth was used to calculate the participants’ age at the time of the survey, recorded as a continuous variable. Sex information was collected as “Male” or “Female”. Ethnicity data was categorized based on self-identification as “Tibetan” or “Non-Tibetan”. The level of education was regrouped into three categories: “Tertiary” (including “University” “college”, and “postgraduate”), “Secondary” (including “High school”, “Secondary technical school”, and “Technical school”), and “Elementary or None” (including “Elementary School” and “No degree”). Self-reported chronic conditions, including hypertension, diabetes, rheumatoid arthritis, and others, were included in the analysis based on the number of reported chronic diseases. Participants were asked to self-report any chronic conditions, and the total count of reported chronic diseases was used as a variable in the study. Data on vision and hearing problems were collected as binary variables, with “yes” indicating the presence of the respective problem and “no” indicating its absence. Age (in years), sex (male, female), ethnicity (non-Tibetan, Tibetan), level of education (Tertiary, Secondary, Elementary or None), number of chronic illnesses, vision problem (no, yes), and hearing problem (no, yes) were included as individual variables.
Lifestyle Variables
The lifestyle section included questions on smoking, alcohol intake, and physical activity. Smoking habits were regrouped into “Yes” and “No” (including “Not currently, but I was a smoker before”). Drinking habits were categorized as “Yes” (including “Yes, I have had alcohol in the last 30 days” and “Yes, I drank alcohol 30 days ago”) or “No”. Event attendance frequency in a typical week was regrouped as “Yes” (including “more than 6 times”, “3–5 times”, “1–2 times”, “no to 1 time”) or “No” (“never attend the event”). Smoking (no, yes), alcohol intake (no, yes), and physical activity (no, yes) were included as lifestyle variables.
Interpersonal Interaction Variables
Household headship information was collected as a binary response, categorized as “Yes” or “No”. Marital status data was categorized as “Single”, “In a civil union/de facto/partnered relationship”, “Widow or widower”, “Divorced or permanently separated from a legal spouse”, or “Others”. Employment status was assessed using a binary response format with “Yes” and “No” options. Social participation was assessed using a binary response of “Yes” for those involved in activities such as community security patrol, caring for other elderly individuals, environmental hygiene protection, mediating disputes, accompanying and chatting with others, volunteering for professional technical services, assisting with childcare, or other activities. Alternatively, the response was “No” for those without involvement in these activities. Household headship (no, yes), marital status (neither married nor in a factoring relationship, married or in a factoring relationship), employment status (no, yes), and social participation (no, yes) were included as interpersonal communication variables.
Environmental Context Variables
The living environment, specifically the altitude of the village or neighborhood committee, was assessed in meters above sea level using data from the official website. The residential area was categorized as “rural” or “urban”. The altitude (< 3499 meters, 3500–3999 meters, 4000–4499 meters,> 4500 meters) and residential area (rural, urban) were included as working and living environment variables.
Policy Provisions Variables
The only policy-related variable included in the health model was the type of medical insurance. In China, medical insurance options vary, with coverage available through employers or resident insurance for the unemployed.35,36 Additionally, the analysis marked individuals who opted not to obtain medical insurance as “missing” and excluded. The insurance type (Residents’ and Employees’ medical insurance) was included as policy rovisions variables.
Outcome Variables
The EQ-5D-VAS instrument, developed by the Euroqol group, was used to assess HRQoL.37,38 This widely used international instrument comprises two standardized scales, EQ-5D-3L and EQ-VAS, for measuring health status. Its high reliability, ease of use, universal applicability, and simplicity make it a popular choice for evaluating HRQoL.39 The EQ-VAS is a visual analog scale that evaluates an individual’s perception of health and is used as a quantitative measure of a person’s perception of health.40 It is represented by a VAS score ranging from 0 to 100, similar to a thermometer, where the endpoints signify the worst (score 0) and best (score 100) imaginable states of health.41
The descriptive questionnaire of the EQ-5D-3L consists of 5 dimensions: mobility, self-care, usual activities, pain/discomfort, and anxiety/depression. Each dimension allows respondents to choose from a 3-level response of severity, ranging from 1—no problems, 2—some problems, to 3—severe problems, reflecting potential health states.37
The Chinese valuation algorithm42 was utilized to convert different states into EQ-5D-index. The formula for calculating the EQ-5D-index is as follows:
EQ-5D-index = 1 – (0.039 + 0.099 × mobility2 + 0.105 × self-care2 + 0.074 × usual activities2 + 0.092 × pain/discomfort2 + 0.086 × anxiety/depression2 + 0.246 × mobility3 + 0.208 × self-care3 + 0.193 × usual activities3 + 0.236 × pain/discomfort3 + 0.205 × anxiety/depression3 + 0.022 × N3).
Here, mobility2, self-care2, usual activities2, pain/discomfort2, and anxiety/depression2 represent the levels of mobility, self-care, usual activities, pain/discomfort, and anxiety/depression at level 2, respectively. Similarly, mobility3, self-care3, usual activities3, pain/discomfort3, and anxiety/depression3 represent the levels at level 3. N3 indicates that at least one of the five dimensions is level 3. Furthermore, when all five dimensions are at level 1, the corresponding utility value pair results in HRQoL = 1, indicating a perfect health state. The EQ-5D-index value ranges from –0.149 to 1.42
Statistical Analysis
Data analysis was conducted using R 4.3.1 software (R Development Core Team, 2023).43 Descriptive statistics were computed for the EQ-5D-3L dimensions and all independent variables. Categorical variables, such as sex and education, were presented as frequencies and percentages, while continuous variables, including age and the number of chronic illnesses, were reported as medians with interquartile ranges (IQR) due to the non-normal distribution of the data for all groups.
The non-parametric tests were applied for the non-normal distributed variables. The Mann–Whitney U or Kruskal–Wallis tests were used for two independent variables or more than two independent groups, respectively. In addition, for continuous variable age and the number of chronic illnesses, Spearman correlation coefficient was employed to assess its association with HRQoL, providing a non-parametric measure of the strength and direction of the relationship.
To address potential ceiling effects observed in previous studies using the EQ-5D-3L during the general population surveys,44 Tobit-regression modeling was employed, which is well-suited for correcting inference in the presence of ceiling effects.45,46 Before conducting the Tobit regression, the underlying assumptions of linear modeling were thoroughly assessed, and the Variance Inflation Factor (VIF) was used to examine multicollinearity among independent variables. All statistical tests were conducted at a significance level of 0.05.
Tobit regression modeling was used to examine the influence of independent variables on both the EQ-5D-index and EQ-VAS. Only the variables selected through the Least Absolute Shrinkage and Selection Operator (LASSO) regression, deemed significant predictors based on the health ecological model, were included in the Tobit regression model.
Three to five Tobit models were fitted for model selection to explore the most suitable one. Model 1 included only personal characteristics as independent variables. Model 2 incorporated personal characteristics and lifestyle variables, while Model 3 included personal characteristics, lifestyle variables, and interpersonal interaction variables. Model 4 expanded to encompass personal characteristics, lifestyle, interpersonal interaction, and environmental context variables. Finally, Model 5 included all variables selected through LASSO regression. The best models were determined based on the Log-likelihood, Akaike Information Criterion (AIC), and Bayesian Information Criterion (BIC).
Results
HRQoL Descriptive results
A total of 1604 elderly individuals completed the survey and were included in the final analysis. The most frequently reported issue was pain/discomfort (40.27%). The mean score of EQ-VAS was 56.15 (SD=21.15, range 0–100; skewness − 0.37), while the mean score of EQ-5D-index was 0.78 (SD=0.25, range −0.149 to 1; skewness −1.4). The descriptive results of the number and percentage of respondents reporting each severity level for each dimension in the EQ-5D-3L scale are presented in Table 2.
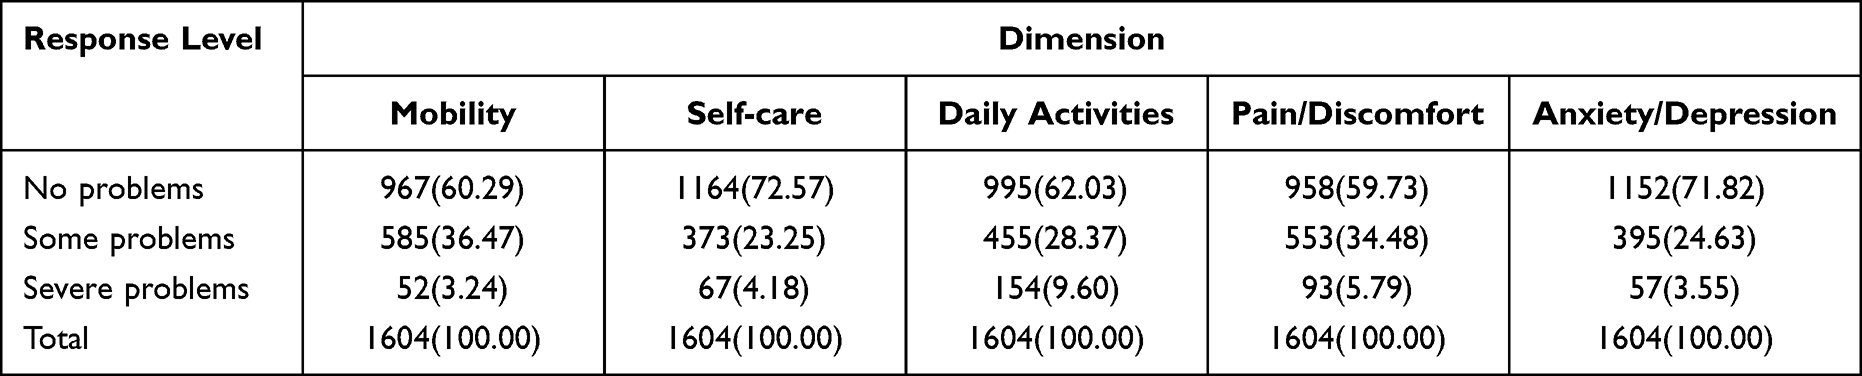 |
Table 2 EQ-5D-3L Frequencies and Proportions by Dimension and Level Among Elderly Individuals in Tibet. n (%) |
Descriptive Results of Factors Associated with HRQoL by Levels of the Ecological Model
Personal Characteristics Variables
The study included participants with a mean age of 69.08 (SD=7.33) years old. Among them, 57.04% were female, and a significant majority of 97.51% belonged to the Tibetan ethnicity. Education levels revealed that 98.07% of individuals had only elementary education or no formal degree. In addition, 36.66%, 20.39%, and 11.53% had one, two, and three or more chronic conditions, respectively. Notably, 45.57% of participants reported vision problems, while 42.83% indicated hearing impairments (Table 3).
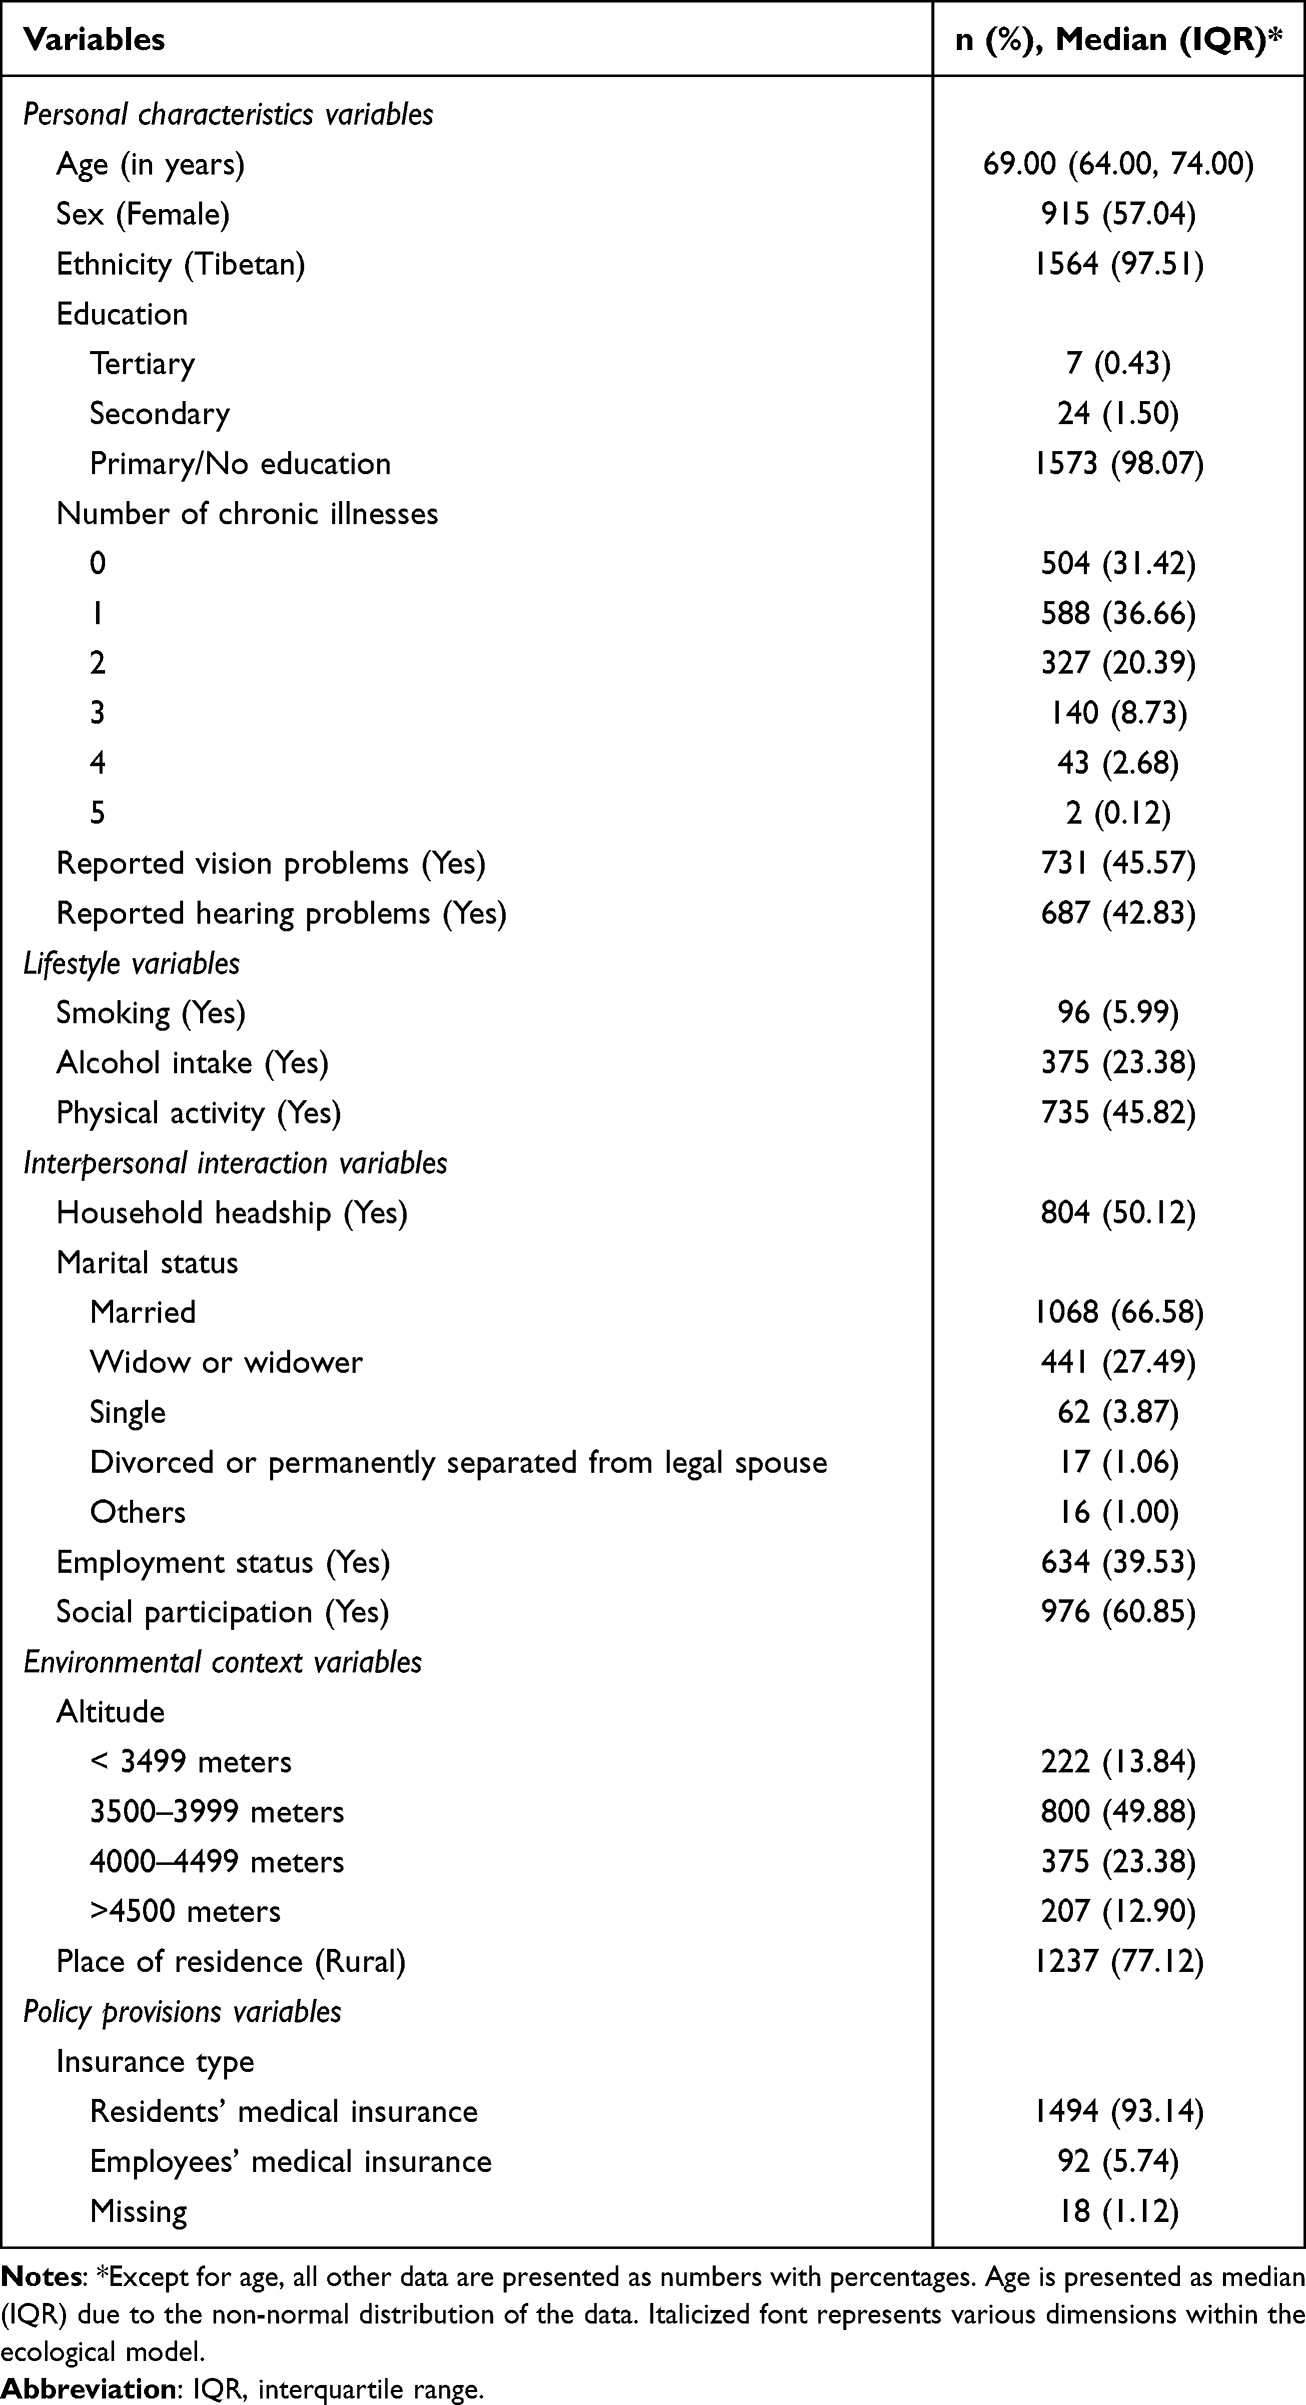 |
Table 3 Participant Characteristics of Elderly Individuals in Tibet |
Lifestyle Variables
In the study, 5.99% of participants reported having a smoking habit, 23.38% indicated having an alcohol intake habit, and 45.82% reported engaging in regular physical activity (Table 3).
Interpersonal Interaction Variables
There were 50.12% of participants in household headship, 66.58% in a de facto marriage, 39.53% under employment, and 60.85% with a history of social participation (Table 3).
Environmental Context Variables
The residents resided at an altitude below 3499, 3500–3999, 4000–4499, and above 4500m accounted for 13.84%, 49.88%, 23.38%, and 12.90% of survey participants, respectively. Additionally, 77.12% of elderly individuals resided in rural areas (Table 3).
Policy Provisions Variables
Regarding medical insurance, 93.14% of elderly individuals had resident statutory medical insurance, while 5.74% had employee statutory medical insurance (Table 3).
Multivariate Regression of Factors Associated with HRQoL by Levels of the Ecological Model
LASSO regression was employed to systematically select the most relevant predictor variables associated with EQ-VAS and EQ-5D-index. For EQ-VAS, a total nine predictor variables were identified. These included variables related to Personal characteristics variables (age, sex, number of chronic illnesses, and reported hearing problems), Lifestyle variables (physical activity), Interpersonal interaction variables (employment status, and social participation), Environmental context variables (place of residence), as well as Policy provisions variables (insurance type). Similarly, for EQ-5D-index, seven predictor variables were chosen, including Personal characteristics variables (age, number of chronic illnesses, reported vision problems, reported hearing problems), Lifestyle variables (Physical activity), and Interpersonal interaction variables (employment status, social participation).
Figure 3 presents LASSO regression was used to develop a mathematical prediction model, with EQ-VAS and EQ-5D-index as the dependent variables, labeled Graph A and Graph B, respectively. These plots were generated to visualize the variable selection process and identify the most relevant predictor variables associated with EQ-VAS and EQ-5D-index, respectively. Figure 4 displays Cross-validation plots (Graphs A and B) for EQ-VAS and EQ-5D-index, respectively. These plots were used to evaluate the model’s performance during the LASSO regression process, ensuring the robustness of the final regression models.
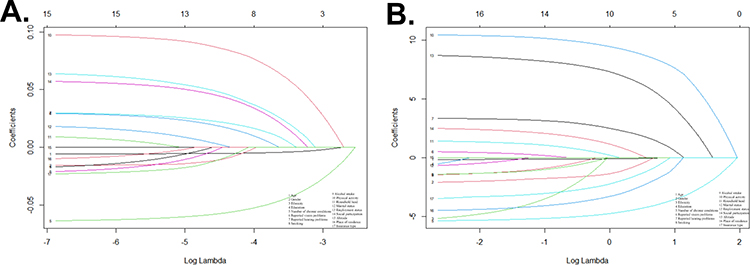 |
Figure 3 LASSO regression plots. A, EQ-VAS; B, EQ-5D-index. The influencing factors associated with HRQoL were identified by the LASSO regression. These factors included the nine most powerful predictors for EQ-VAS (Age, Sex, Number of chronic illnesses, Reported hearing problems, Physical activity, Employment status, Social participation, Place of residence, and Insurance type) and the seven most powerful factors for EQ-5D-index (Age, Number of chronic illnesses, Reported vision problems, Reported hearing problems, Physical activity, Employment status, and Social participation). |
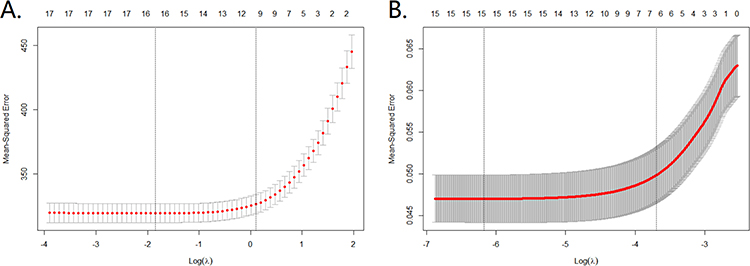 |
Figure 4 Cross-validation plots. A, EQ-VAS, shows the coefficients of each predictor when the predictors were included in the LASSO regression model for EQ-VAS; B, EQ-5D-index, shows the coefficients of each predictor when the predictors were included in the LASSO regression model for EQ-5D-index. |
Finally, the LASSO regression analysis identified the nine most potent factors for EQ-VAS (Age, Sex, Number of chronic illnesses, Reported hearing problems, Physical activity, Employment status, Social participation, Place of residence, and Insurance type) and the seven most powerful factors for EQ-5D-index (Age, Number of chronic illnesses, Reported vision problems, Reported hearing problems, Physical activity, Employment status, and Social participation).
The Tobit regression analysis revealed significant associations influencing individuals’ EQ-VAS and EQ-5D index scores in various dimensions (Table 4). (1) Personal characteristics variables: Older age was significantly correlated with lower EQ-VAS and EQ-5D-index scores. The female sex showed a significant association with lower EQ-VAS scores. Additionally, more chronic illnesses were linked to lower EQ-VAS and EQ-5D-index scores. Vision impairment was significantly related to lower EQ-5D-index scores, while hearing impairment was associated with both lower EQ-VAS and EQ-5D-index scores. (2) Lifestyle variables: Individuals who engaged in regular physical activity showed a significant positive correlation with higher EQ-VAS and EQ-5D-index scores. (3) Interpersonal interaction variables: Being employed and participating in social activities were both significantly associated with higher EQ-VAS and EQ-5D-index scores. (4) Environmental context variables: Living in rural areas significantly affected lower EQ-VAS scores. (5) Policy provisions variables: Individuals with residents’ medical insurance were significantly associated with lower EQ-VAS scores (Table 4).
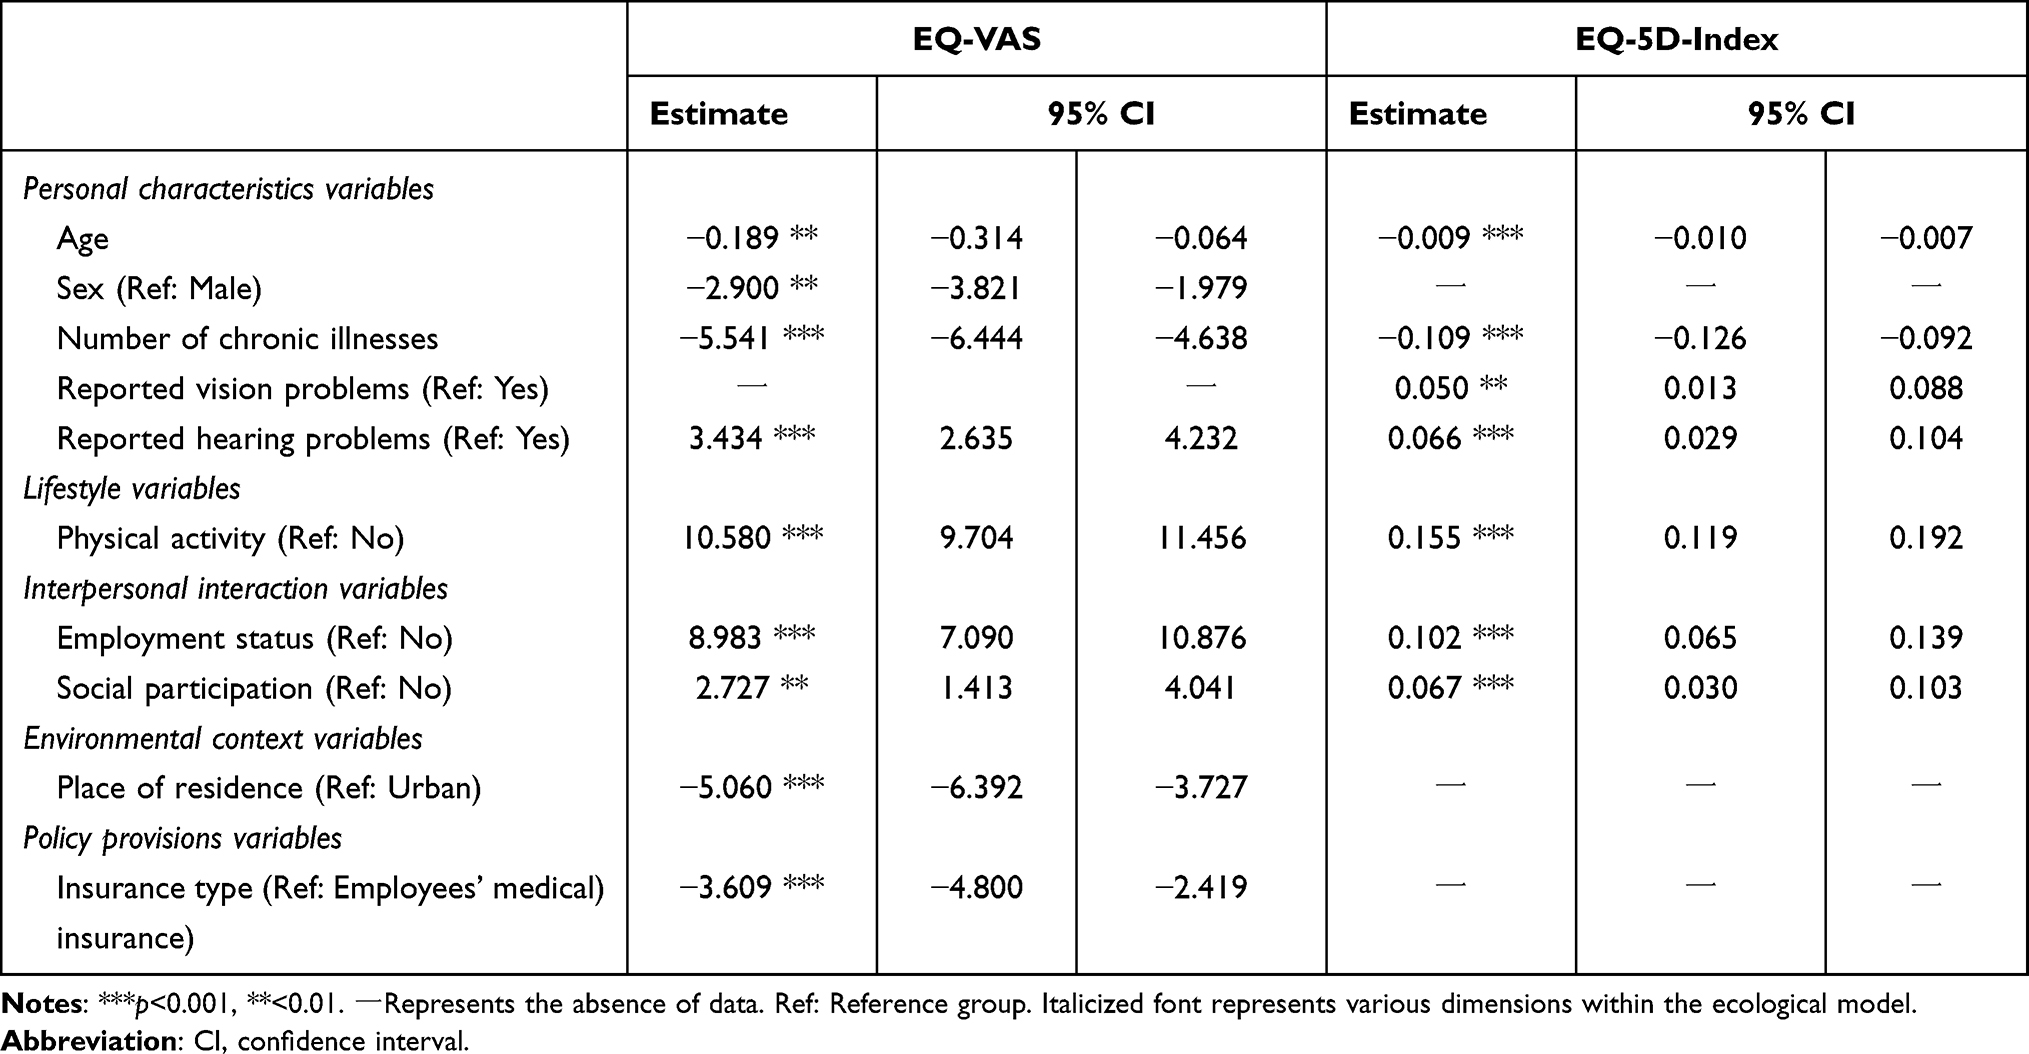 |
Table 4 Tobit Multivariate Regression |
Discussion
Overview of Elderly HRQoL in Southwestern China’s Tibet Region
In our cross-sectional survey in Tibet, an autonomous region of China, we delved into the HRQoL and its related determinants for individuals aged 60 and older. Special attention was given to socially vulnerable groups, emphasizing the pinpointing of salient influencing factors. To capture the multifaceted essence of this construct, these determinants were structured according to the tiers of the ecological model.
The finding of the study revealed that the HRQoL of elderly individuals in Tibet was lower than that of Shandong, an eastern coastal province in China, with a higher life quality score (EQ-5D-index, 0.84).47 It also fell below the values observed in Hainan, a southern coastal province (EQ-5D-index, 0.79; EQ-VAS: 66.90),48 and was lower than the average level among elderly individuals in China during the same period (EQ-VAS, 76.01±14.99).49 These findings unveiled a concerning portrayal of the health status and health awareness among elderly Tibetans. Our results are consistent with previous research, such as the work by Liang (2022), which highlighted the relatively lower health level of elderly individuals in Tibet.50
It is worth mentioning that, according to the WHO, the elderly is typically used for individuals aged 65 years and above. However, considering the small proportion of the older population and relatively low life expectancy in Tibet,51,52 we used an age cutoff of 60 years and over to define the elderly population in our present study.
Relationships Between Factors and HRQoL Based on Health Ecological Model
Personal Characteristics Variables
As individuals age, there is an inherent deterioration in physical capabilities, frequently paralleled by heightened health issues. This underscores the essentiality of daily healthcare for the elderly, particularly those in their advanced years. While there have been commendable strides in enhancing the HRQoL of older populations in China, consistent challenges persist. These encompass deficient social security provisions, a limited spectrum of mental and cultural activities, marked disparities between urban and rural settings, evident socio-economic gradients, and region-specific disparities, especially evident in Tibet.
A demonstrable association exists between being female and diminished HRQoL,41,53 consistent with prior studies. This relationship was significantly manifest in HRQoL as gauged by EQ-VAS. Many factors might explain this difference, from heightened incidences of chronic ailments, gynecological issues, and emotional disturbances to the compounded burdens women frequently bear from both professional and domestic spheres.
The study revealed that, among elderly individuals in Tibet, a higher burden of chronic diseases was linked to an increased likelihood of lower EQ-VAS and EQ-5D index scores. Prior investigations have confirmed that chronic diseases presented significant challenges to the HRQoL and overall well-being of older adults.54 A broader spectrum of chronic non-communicable diseases (including arthritis, back pain, depression/anxiety, diabetes, hypertension, osteoporosis, and stroke) correlated with diminished HRQoL.55 Notably, individuals grappling with multiple chronic diseases in their later years displayed heightened vulnerability in both psychological and physical well-being.56
Furthermore, the study underscored a strong correlation between visual impairment and a lower EQ-5D-index. Visual impairment negatively impacts HRQoL due to its association with increased difficulties in daily activities and overall well-being.57,58 Importantly, even minor degrees of vision loss have been linked to restricted functioning and diminished HRQoL.57
Moreover, the research uncovered a significant link between hearing impairment and lower HRQoL, as indicated by both the EQ-VAS and EQ-5D index. Longworth et al have observed a substantial influence of hearing on evaluating EQ-5D health states.59 Furthermore, they, along with Yang et al, have proposed that the impact of hearing on HRQoL depends on the severity of health conditions and the extent of hearing-related elements.59,60
Lifestyle Variables
This study has unveiled a robust correlation between physical activity and enhanced HRQoL, as evidenced by both EQ-VAS and EQ-5D index scores. These findings were in line with previous research.61,62 Adopting a healthy lifestyle is a buffer against HRQoL decline in older adults, which is unsurprising given that appropriate physical activity can yield many benefits to individuals.63,64
Integrating physical activity into daily routines is highly beneficial, offering many health advantages. Balance-centric and functional exercises can notably curtail the incidence of falls. Additionally, indulging in a spectrum of physical activities can amplify various dimensions of physical prowess. Multifaceted activities, encompassing balance, strength, endurance, gait, and functional training, are instrumental in mitigating risks tied to fall-induced injuries. To realize maximum benefits, it is recommended that older individuals engage in moderate-intensity, multi-component exercises at least three days a week. This regimen enhances their overall physical competence and significantly reduces fall hazards. Furthermore, varied exercise regimens can fortify bone density and serve as a protective measure against osteoporosis.63,64
Interpersonal Interaction Variables
Within the scope of this study, a thorough examination of the interplay between employment status and HRQoL was undertaken, bolstered by evidence from both the EQ-VAS and EQ-5D index. Consistent with prior research,65 a significant connection between HRQoL and employment status was substantiated, underscoring the pivotal role of this variable within this context. Notably, a discernible pattern emerged, revealing that gainfully employed individuals tend to manifest elevated levels of HRQoL compared to their retired counterparts.66
Numerous factors contributed to this phenomenon. Chief among these was the presence of a consistent and dependable income, recognized as a critical determinant that augmented financial security for those engaged in gainful employment. Furthermore, psychological well-being and active social participation are recognized as influential contributors, with robust social engagement contributing positively to the enrichment of HRQoL.
Furthermore, the intricate connection between social involvement and HRQoL is intricately interwoven with psychological and social well-being. Interpersonal interactions, whether fostered through employment or active social engagement, are poignant reflections of an individual’s societal value. While the role of income is undeniably significant, it is imperative to acknowledge the central importance of the complex interplay between an individual’s social functioning and psychological well-being.
Environmental Context Variables
Elderly individuals residing in the rural regions of Tibet demonstrated diminished EQ-VAS scores. This trend paralleled observations from a study conducted in South Korea.33 This correspondence could be attributed to discrepancies in fundamental infrastructure (including transportation accessibility, cultural amenities, and medical provisions)67 between rural and urban locales, which might lead to a scarcity of social resources available to rural inhabitants. As a result, this divergence could potentially affect social support and the quality of healthcare services, thereby impacting the ultimate outcomes of HRQoL.
Policy Provisions Variables
While medical insurance can be categorized as an individual factor, it also falls under the purview of policy provision due to its nationwide promotion for acquisition at the national level in China.68 In this study, the possession of medical insurance by non-working residents exhibited a noteworthy correlation with EQ-VAS scores. Additionally, gainful employment guaranteed a stable income, upheld individuals’ social roles and self-esteem, and granted access to a broader spectrum of societal resources, including medical insurance distinct from residential coverage. This intricate interplay assumed a pivotal role in both sustaining and potentially elevating the levels of HRQoL.
In summary, based on the findings presented, it is evident that a subset of elderly individuals residing at home in Tibet encountered socio-economic disadvantages. This subgroup comprised rural-dwelling older adults who potentially faced amplified disparities due to constrained financial resources and the coexistence of multiple chronic conditions. Despite the challenging high-altitude terrain and its adverse impact on health, socio-economic factors, such as per capita GDP and income levels, appear to exert a more pronounced influence on the HRQoL of the elderly population in Tibet.69
Boosting access to financial and social resources that improve living conditions can significantly affect the HRQoL of the elderly. This enhanced access can influence their capacity to preserve autonomy and age in familiar settings. While this study’s primary metric captures individual perceptions, it is crucial to recognize that elements beyond personal agency influence HRQoL. Our research in Tibet employs an ecological framework, positing HRQoL as a multifaceted entity. This framework encompasses health and social wellness, individual traits, physical engagements, interpersonal dynamics, environmental settings, and policy-driven provisions.
Limitations
The strengths of our study include its large sample size in a unique geographic high-altitude area. We analyzed the HRQoL of the elderly in the health ecological model, which was rarely reported previously. This study is not without its limitations. Primarily, there is a possibility that elderly participants who opted to partake in the survey might represent a subset that is healthier and more socially active compared to those who refrained. This potential selection bias poses challenges for the broader applicability of our results. Moreover, specific dimensions of the ecological model, such as chronic illness prevalence, dietary habits, physical activity patterns, and routines of daily living, were not exhaustively incorporated. This might have placed constraints on capturing a well-rounded representation of these elements within our investigative framework. Furthermore, the study’s cross-sectional nature limits our capacity to assert unequivocal causative links between the examined variables and HRQoL.
Conclusion
Employing the ecological model’s expansive lens has enriched our comprehension of the HRQoL of older adults. By situating them at the center of their ecosystem, the instrument utilized in this model offers a more encompassing perspective that captures a plethora of determinants influencing their well-being. To elevate the quality of life for Tibet’s elderly population, proactive initiatives are necessary. This includes rolling out specialized educational and cultural programs to bolster their spiritual and cultural horizons, potentially incorporating traditional activities such as the Tibetan Guozhuang dance. Through volunteer activities or other communal engagements, facilitating avenues for social interaction among retired individuals can further enrich their lives. A collective approach, which amalgamates local support with voluntary contributions, crafts a nuanced strategy that holistically examines individual, societal, economic, and environmental factors.
Ethics Approval
This study was performed in line with the principles of the Declaration of Helsinki. Approval was granted by the Ethics Committee of Tibet University Affiliated Foking Maternity and Children’s Hospital (approval number: FK2012-02).
Consent to Participate
Informed consent was obtained from all individual participants included in the study.
Acknowledgments
We acknowledge the researchers and respondents for their support.
Funding
Data was supplied by the project team of The Sixth National Health Service Survey in Tibet, China [18080027].
Disclosure
The authors report no conflicts of interest in this work.
References
1. Beard JR, Officer A, de Carvalho IA., et al. The World report on ageing and health: a policy framework for healthy ageing. Lancet. 2016;387(10033):2145–2154. doi:10.1016/S0140-6736(15)00516-4
2. World Health Organization. World Report on Ageing and Health. World Health Organization; 2015.
3. Rudnicka E, Napierała P, Podfigurna A, Męczekalski B, Smolarczyk R, Grymowicz M. The World Health Organization (WHO) approach to healthy ageing. Maturitas. 2020;139:6–11. doi:10.1016/j.maturitas.2020.05.018
4. Tucker KL, Buranapin S. Nutrition and aging in developing countries. J Nutr. 2001;131(9):2417S–2423S. doi:10.1093/jn/131.9.2417S
5. Fang EF, Scheibye-Knudsen M, Jahn HJ, et al. A research agenda for aging in China in the 21st century. Ageing Res Rev. 2015;24:197–205. doi:10.1016/j.arr.2015.08.003
6. Parra-Rizo MA, Vásquez-Gómez J, Álvarez C, et al. Predictors of the level of physical activity in physically active older people. Behav Sci. 2022;12(9):331. doi:10.3390/bs12090331
7. Parra-Rizo MA, Díaz-Toro F, Hadrya F, Pavón-León P, Cigarroa I. Association of co-living and age on the type of sports practiced by older people. Sports. 2022;10(12):200. doi:10.3390/sports10120200
8. Matsumoto K, Matsui T, Suwa H, Yasumoto K. Stress estimation using biometric and activity indicators to improve Qol of the elderly. Sensors. 2023;23(1):535. doi:10.3390/s23010535
9. Munawar K, Fadzil Z, Choudhry FR, Kausar R. Cognitive functioning, dependency, and quality of life among older adults. Activities Adapt Aging. 2023:1–26. doi:10.1080/01924788.2023.2193786
10. Shek DTL. Introduction: quality of life of Chinese people in a changing world. Soc Indic Res. 2010;95(3):357–361. doi:10.1007/s11205-009-9534-6
11. Ping W, Zheng J, Niu X, et al. Evaluation of health-related quality of life using EQ-5D in China during the COVID-19 pandemic. PLoS One. 2020;15(6):e0234850. doi:10.1371/journal.pone.0234850
12. Ma S, Wang LJ, Jiang J, Chu L, Zhang JC. Threshold effect of ecosystem services in response to climate change and vegetation coverage change in the Qinghai-Tibet Plateau ecological shelter. J Cleaner Prod. 2021;318:128592. doi:10.1016/j.jclepro.2021.128592
13. Yu L, Zhang M, Wang L, Qin W, Jiang D, Li J. Variability of surface solar radiation under clear skies over Qinghai-Tibet Plateau: role of aerosols and water vapor. Atmos. Environ. 2022;287:119286. doi:10.1016/j.atmosenv.2022.119286
14. Tibet autonomous region people’s government. Understanding Tibet. Available from: http://www.xizang.gov.cn/rsxz/.
15. Jie Yang Y. Study on the strategy of mass health and physical fitness promotion in Tibetan plateaus from the perspective of environmental science. IOP Conf Ser. 2020;440(4):042019. doi:10.1088/1755-1315/440/4/042019
16. Huang X, Dai S, Xu H. Predicting tourists’ health risk preventative behaviour and travelling satisfaction in Tibet: combining the theory of planned behaviour and health belief model. Tourism Manage Perspect. 2020;33:100589. doi:10.1016/j.tmp.2019.100589
17. Pinzón-Rondón AM, Botero JC, Mosquera-Gómez LE, Botero-Pinzon M, Cavelier JE. Altitude and quality of life of older people in Colombia: a multilevel study. J Appl Gerontol. 2022;41(6):1604–1614. doi:10.1177/07334648221078577
18. Whoqol Group. The World Health Organization Quality of Life assessment (WHOQOL): position paper from the World Health Organization. Soc Sci Med. 1995;41(10):1403–1409. doi:10.1016/0277-9536(95)00112-k
19. Torrance GW. Utility approach to measuring health-related quality of life. J Chronic Dis. 1987;40(6):593–600. doi:10.1016/0021-9681(87)90019-1
20. Measuring Healthy Days: population Assessment of Health-Related Quality of Life. National Center for Chronic Disease Prevention and Health Promotion. Atlanta, GA: Div. of Adult and Community Health; 2000. Available from: https://ntrl.ntis.gov/NTRL/dashboard/searchResults/titleDetail/PB2002104934.xhtml.
21. Ribeiro O, Teixeira L, Araújo L, Rodríguez-Blázquez C, Calderón-Larrañaga A, Forjaz MJ. Anxiety, depression and quality of life in older adults: trajectories of influence across age. Int J Environ Res Public Health. 2020;17(23):9039. doi:10.3390/ijerph17239039
22. Bronfenbrenner U. Toward an experimental ecology of human development. Am Psychol. 1977;32(7):513–531. doi:10.1037/0003-066X.32.7.513
23. Reifsnider E, Gallagher M, Forgione B. Using ecological models in research on health disparities. J Prof Nurs. 2005;21(4):216–222. doi:10.1016/j.profnurs.2005.05.006
24. Micallef D, Parker L, Brennan L, Schivinski B, Jackson M. Improving the health of emerging adult gamers—a scoping review of influences. Nutrients. 2022;14(11):2226. doi:10.3390/nu14112226
25. Ecological Model. Available from: https://www.acha.org/HealthyCampus/HealthyCampus/Ecological_Model.aspx.
26. Rosenfield PL. The potential of transdisciplinary research for sustaining and extending linkages between the health and social sciences. Soc Sci Med. 1992;35(11):1343–1357. doi:10.1016/0277-9536(92)90038-R
27. McLeroy KR, Bibeau D, Steckler A, Glanz K. An ecological perspective on health promotion programs. Health Edu Quart. 1988;15(4):351–377. doi:10.1177/109019818801500401
28. Secretary’s advisory committee on national health promotion and disease prevention objectives for 2020. health.gov. Available from: https://health.gov/our-work/national-health-initiatives/healthy-people/healthy-people-2020/secretarys-advisory-committee-2020.
29. A new way to talk about the social determinants of health. Available from: https://www.rwjf.org/en/insights/our-research/2010/01/a-new-way-to-talk-about-The-social-determinants-of-health.html.
30. Rigolon A, Fernandez M, Harris B, Stewart W. An ecological model of environmental justice for recreation. Leisure Sci. 2022;44(6):655–676. doi:10.1080/01490400.2019.1655686
31. Lang S, Gibson S, Ng KW, Truby H. Understanding children and young people’s experiences pursuing weight loss maintenance using the socio-ecological model: a qualitative systematic literature review. Obes Rev. 2021;22(5):e13172. doi:10.1111/obr.13172
32. Glanz K, Rimer BK, Viswanath K. Health Behavior and Health Education: Theory, Research, and Practice. John Wiley & Sons; 2008.
33. Lee S, Hong SH, Song HY. Factors associated with health-related quality of life among older adults in rural south korea based on ecological model. Int J Environ Res Public Health. 2022;19(12):7021. doi:10.3390/ijerph19127021
34. Official website of the Chinese government. seventh national population census bulletin. Available from: https://www.gov.cn/guoqing/2021-05/13/content_5606149.htm.
35. Zhu K, Zhang L, Yuan S, Zhang X, Zhang Z. Health financing and integration of urban and rural residents’ basic medical insurance systems in China. Int J Equ Health. 2017;16(1):194. doi:10.1186/s12939-017-0690-z
36. Wu Y, Huang Y, Lu J. Potential effect of medical insurance on medicare: evidence from China. Iran J Public Health. 2016;45(10):1247–1260.
37. Group TE. EuroQol - A new facility for the measurement of health-related quality of life. Health Policy. 1990;16(3):199–208. doi:10.1016/0168-8510(90)90421-9
38. EuroQol Research Foundation. EQ-5D-3L User Guide; 2018. Available from: https://euroqol.org/publications/user-guides.
39. Shan LL, Shi MDY, Tew M, Westcott MJ, Davies AH, Choong PF. Measuring quality of life in chronic limb-threatening ischemia patients and informal carers: a scoping review. Ann Surg. 2022;276(5):e331–e341. doi:10.1097/SLA.0000000000005477
40. Marzouk M, McKeown DJ, Borg DN, Headrick J, Kavanagh JJ. Perceptions of fatigue and neuromuscular measures of performance fatigability during prolonged low-intensity elbow flexions. Exp Physiol. 2023;108(3):465–479. doi:10.1113/EP090981
41. Siqeca F, Yip O, Mendieta MJ, et al. Factors associated with health-related quality of life among home-dwelling older adults aged 75 or older in Switzerland: a cross-sectional study. Health Qual Life Outcome. 2022;20(1):166. doi:10.1186/s12955-022-02080-z
42. Liu GG, Wu H, Li M, Gao C, Luo N. Chinese time trade-off values for EQ-5D health states. Value Health. 2014;17(5):597–604. doi:10.1016/j.jval.2014.05.007
43. R: the R project for statistical computing. Available from: https://www.r-project.org/.
44. Herdman M, Gudex C, Lloyd A, et al. Development and preliminary testing of the new five-level version of EQ-5D (EQ-5D-5L). Qual Life Res. 2011;20(10):1727–1736. doi:10.1007/s11136-011-9903-x
45. McBee M. Modeling outcomes with floor or ceiling effects: an introduction to the Tobit model. Gift Child Quart. 2010;54(4):314–320. doi:10.1177/0016986210379095
46. Johnson JK, Louhivuori J, Siljander E. Comparison of well-being of older adult choir singers and the general population in Finland: a case-control study. Musicae Sci. 2017;21(2):178–194. doi:10.1177/1029864916644486
47. Zhao Q, Wang J, Nicholas S, et al. Health-related quality of life and health service use among multimorbid middle-aged and older-aged adults in china: a cross-sectional study in Shandong Province. Int J Environ Res Public Health. 2020;17(24):9261. doi:10.3390/ijerph17249261
48. Chen C, Liu GG, Shi QL, et al. Health-related quality of life and associated factors among oldest-old in China. J Nutr Health Aging. 2020;24(3):330–338. doi:10.1007/s12603-020-1327-2
49. Jiang D, Yan Y, Zhou H, Wang Q. The association between personal social capital and health-related quality of life among Chinese older people: a cross-sectional study. Frontiers in Nutrition. 2022;9. doi:10.3389/fnut.2022.995729
50. Liang Q, Zhang X, Song X. Spatial distribution and influencing factors of health status among china’s elderly population. Chin J Gerontol. 2022;42(8):1994–2000. doi:10.3969/j.issn.1005-9202.2022.08.059
51. Medical Aid to Tibet. “Group” assistance by medical professionals enhancing the health and well-being of people of all ethnicities in Tibet — an overview of the “group” assistance by medical professionals in Tibet. Available from: http://lyfzt.xizang.gov.cn/ztzl_69/tuanjie/202206/t20220601_301104.html.
52. Qiao X. Changes in life expectancy and regional disparities in elderly health at the national and provincial levels. Pop Eco. 2023;5:1–20.
53. Alcañiz M, Solé-Auró A. Feeling good in old age: factors explaining health-related quality of life. Health Qual Life Outcome. 2018;16(1):48. doi:10.1186/s12955-018-0877-z
54. Van Wilder L, Rammant E, Clays E, Devleesschauwer B, Pauwels N, De Smedt D. A comprehensive catalogue of EQ-5D scores in chronic disease: results of a systematic review. Qual Life Res. 2019;28(12):3153–3161. doi:10.1007/s11136-019-02300-y
55. Lima MG, César CLG, Goldbaum M, Carandina L, Ciconelli RM, Ciconelli RM. Impact of chronic disease on quality of life among the elderly in the state of São Paulo, Brazil: a population-based study. Rev Panam Salud Publica. 2009;25(4):314–321. doi:10.1590/s1020-49892009000400005
56. Ge L, Ong R, Yap CW, Heng BH. Effects of chronic diseases on health‐related quality of life and self‐rated health among three adult age groups. Nurs Health Sci. 2018;12585. doi:10.1111/nhs.12585
57. Taipale J, Mikhailova A, Ojamo M, et al. Low vision status and declining vision decrease health-related quality of life: results from a nationwide 11-year follow-up study. Qual Life Res. 2019;28(12):3225–3236. doi:10.1007/s11136-019-02260-3
58. Purola PKM, Koskinen SVP, Uusitalo HMT. Comparison of three health-related quality of life instruments in relation to visual acuity: EQ-5D, 15D, and EUROHIS-QOL8. Qual Life Res. 2023;32(2):543–552. doi:10.1007/s11136-022-03293-x
59. Longworth L, Yang Y, Young T, et al. Use of generic and condition-specific measures of health-related quality of life in NICE Decision-making: a systematic review, statistical modelling and survey. NIHR J Library. 2014;2012:1.
60. Yang Y, Rowen D, Brazier J, Tsuchiya A, Young T, Longworth L. An exploratory study to test the impact on three “bolt-on” items to the EQ-5D. Value Health. 2015;18(1):52–60. doi:10.1016/j.jval.2014.09.004
61. Choi JI, Cho YH, Kim YJ, et al. The relationship of sitting time and physical activity on the quality of life in elderly people. Int J Environ Res Public Health. 2021;18(4):1459. doi:10.3390/ijerph18041459
62. Wheeler R, Lobley M. Health-related quality of life within agriculture in England and Wales: results from a EQ-5D-3L self-report questionnaire. BMC Public Health. 2022;22(1):1395. doi:10.1186/s12889-022-13790-w
63. Bull FC, Al-Ansari SS, Biddle S, et al. World Health Organization 2020 guidelines on physical activity and sedentary behaviour. Br J Sports Med. 2020;54(24):1451–1462. doi:10.1136/bjsports-2020-102955
64. Jakicic JM, Kraus WE, Powell KE, et al. Association between bout duration of physical activity and health: systematic review. Med Sci Sports Exerc. 2019;51(6):1213–1219. doi:10.1249/MSS.0000000000001933
65. Ray TK, Kenigsberg TA, Pana-Cryan R. Employment arrangement, job stress, and health-related quality of life. Safety Science. 2017;100:46–56. doi:10.1016/j.ssci.2017.05.003
66. Baumann D, Ruch W, Margelisch K, Gander F, Wagner L. Character strengths and life satisfaction in later life: an analysis of different living conditions. Appl Res Qual Life. 2020;15(2):329–347. doi:10.1007/s11482-018-9689-x
67. Krishnappa L, Gadicherla S, Chidambaram P, Murthy NS. Quality of life (QOL) among older persons in an urban and rural area of Bangalore, South India. J Family Med Prim Care. 2021;10(1):272–277. doi:10.4103/jfmpc.jfmpc_1241_20
68. Tao W, Zeng Z, Dang H, et al. Towards universal health coverage: lessons from 10 years of healthcare reform in China. BMJ Global Health. 2020;5(3):e002086. doi:10.1136/bmjgh-2019-002086
69. Wei C, Lei M, Wang S. Spatial heterogeneity of human lifespan in relation to living environment and socio-economic polarization: a case study in the Beijing-Tianjin-Hebei region, China. Environ Sci Pollut Res. 2022;29(27):40567–40584. doi:10.1007/s11356-022-18702-4
 © 2024 The Author(s). This work is published and licensed by Dove Medical Press Limited. The full terms of this license are available at https://www.dovepress.com/terms.php and incorporate the Creative Commons Attribution - Non Commercial (unported, v3.0) License.
By accessing the work you hereby accept the Terms. Non-commercial uses of the work are permitted without any further permission from Dove Medical Press Limited, provided the work is properly attributed. For permission for commercial use of this work, please see paragraphs 4.2 and 5 of our Terms.
© 2024 The Author(s). This work is published and licensed by Dove Medical Press Limited. The full terms of this license are available at https://www.dovepress.com/terms.php and incorporate the Creative Commons Attribution - Non Commercial (unported, v3.0) License.
By accessing the work you hereby accept the Terms. Non-commercial uses of the work are permitted without any further permission from Dove Medical Press Limited, provided the work is properly attributed. For permission for commercial use of this work, please see paragraphs 4.2 and 5 of our Terms.