")
Back to Journals » OncoTargets and Therapy » Volume 9
Expression of OVOL2 is related to epithelial characteristics and shows a favorable clinical outcome in hepatocellular carcinoma
Authors Fu H, Qi L, Chen L, He Y, Zhang N, Guo H
Received 12 April 2016
Accepted for publication 6 July 2016
Published 29 September 2016 Volume 2016:9 Pages 5963—5973
DOI https://doi.org/10.2147/OTT.S110409
Checked for plagiarism Yes
Review by Single anonymous peer review
Peer reviewer comments 4
Editor who approved publication: Dr William C. Cho
Hui Fu,1,2,* Lisha Qi,2,3,* Lu Chen,1,2 Yuchao He,1,2 Ning Zhang,1,2 Hua Guo1,2
1Department of Tumor Cell Biology, National Clinical Research Center for Cancer, Tianjin Medical University Cancer Institute and Hospital, 2The Key Laboratory of Tianjin Cancer Prevention and Treatment, National Clinical Research Center for Cancer, 3Department of Pathology, National Clinical Research Center for Cancer, Tianjin Medical University Cancer Institute and Hospital, Tianjin, People’s Republic of China
*These authors contributed equally to this work
Abstract: Metastasis involves epithelial–mesenchymal transition (EMT) and mesenchymal–epithelial transition. Ovol2 belongs to the Ovo-like family (Ovol) of evolutionarily conserved zinc-finger transcription factors that regulate gene expression in various differentiation processes. Recent studies have demonstrated that Ovols affect mesenchymal–epithelial transition by inducing the expression of miR-200 in a range of human cancers. Downregulated Ovol2 expression is involved in the invasion and metastasis of breast and prostate cancers, but little is known about its expression and prognostic value in other cancers, including hepatocellular carcinoma (HCC). This study was designed to explore the clinical and prognostic significance of Ovol2 in patients with HCC. The expression of Ovol2 in tumor samples from patients with HCC and HCC cell lines was examined using Western blotting, real-time polymerase chain reaction, and immunohistochemistry. The expression levels of EMT-related markers, including E-cadherin, N-cadherin, and vimentin, were detected in relation to Ovol2 expression. The prognostic significance of Ovol2 in patients with HCC was statistically analyzed by Kaplan–Meier and Cox regression analyses. Ovol2 expression was significantly lower in HCC tissues than in adjacent noncancerous tissues. Low expression of Ovol2 was detected in HCC tissues with poor histological differentiation, microvascular invasion, and cirrhosis. A significant relationship was observed between Ovol2 and EMT marker expression levels. Kaplan–Meier analysis showed that overall survival was significantly worse in patients with HCC with low Ovol2 expression, indicating that Ovol2 deletion was an independent predictor of unfavorable prognosis in patients with HCC. Elevated Ovol2 expression may suppress HCC cell invasion and metastasis via restricting EMT.
Keywords: Ovol2, hepatocellular carcinoma, prognosis, epithelial–mesenchymal transition, mesenchymal–epithelial transition
Introduction
Globally, hepatocellular carcinoma (HCC) remains the sixth most common cancer and third for cancer-related deaths, with 86% occurring in developing countries (~50% in the People’s Republic of China).1,2 Increasing prevalence rates of HCC have been observed worldwide.3,4 However, most HCCs are generally diagnosed at advanced stages.5 Although some advances in surgical technologies and medical management have been reported, the clinical outcome remains unsatisfactory because of the high incidence of recurrence and metastasis after hepatic resection.6,7 Therefore, identifying new sensitive and reliable biomarkers for the diagnosis, prognosis, and target therapy of HCC is extremely important. Significant efforts have been made to elucidate the molecular mechanism of HCC metastasis.
Epithelial–mesenchymal transition (EMT) is a critical cellular process required for embryonic development, adult wound healing, chronic inflammation, and hypoxia.5,8 During EMT, epithelial cells lose their apicobasal polarity, which is maintained by a cytoskeleton structure, apical tight junctions, and cell junction, and become mesenchymal cell types.9,10 EMT is characterized by the downregulation of epithelial markers, such as E-cadherin, and upregulation of mesenchymal markers (eg, fibronectin, vimentin, and N-cadherin).9,11 Mesenchymal–epithelial transition (MET) describes the reverse process.5 Cancer cells undergo EMT to enable metastasis and invasion, which can be triggered by secreted growth factors and cytokines.9 The metastatic cascade is a multifaceted process, in which EMT mediates the initial transformation from benign to invasive carcinoma, and MET is critical for colonization in the later stages of metastasis.6,12 Despite the widely recognized implications for EMT in cancer progression, rigorous functional studies on MET in the metastatic cascade are scarce.
One candidate that may induce tumor cells to undergo MET is Ovo-like 2 (Ovol2), a member of the Ovol family of zinc-finger transcription factors (TFs) known to prevent mesenchymal transdifferentiation and maintain epithelial identity.13 Functional studies in human and selected model organisms (eg, Caenorhabditis elegans, Drosophila, zebrafish, chick, and mice) have corroborated that Ovol genes are involved in the epithelial development and differentiation of a wide variety of organs from epidermis, hair follicles, and kidney to male germ cells.13–16 The Ovol family (including Ovol1, Ovol2, and Ovol3) of zinc-finger TFs functions downstream of key developmental pathways (eg, Wnt, epidermal growth factor, and bone morphogenetic protein/transforming growth factor beta).13,17,18 During mammary morphogenesis, Ovol operates as a “critical molecular brake on MET” by preventing the terminal end bud cells that have gained partial plasticity from undergoing complete EMT.19,20 Studies have indicated that Ovols affect MET of prostate cancer (PC) and breast cancer (BC) and regulate cancer progression.21,22 Ovol2 suppresses nearly all known EMT-inducing TFs by directly binding to their promoters.13 Watanabe et al19 reported that Ovol2 expression levels are closely related to the overall survival (OS) and metastasis-free survival of postoperative patients with BC. However, no studies exist regarding the expression levels and prognostic value of Ovol2 in other cancers, including HCC. In the present study, we detected the expression dynamics of Ovol2 in HCC cells and tissues, analyzed the relationships among Ovol2 expression, clinicopathological features, and EMT-related markers, and evaluated the significance of Ovol2 in the prediction of HCC prognosis.
Materials and methods
Patients and samples
The study samples included 24 frozen tissues for Western blotting and quantitative real-time polymerase chain reaction (PCR). Furthermore, 74 formalin-fixed, paraffin-embedded tissues (among which there were 33 sets of matched HCC tissues and noncancerous tissues) were collected from patients who underwent hepatectomy for HCC between 2014 and 2015 at the Department of Liver Cancer, Tianjin Medical University Cancer Institute and Hospital. Frozen HCC tissues were collected immediately after resection. The matched noncancerous liver tissue without evidence of liver metastases was acquired at least 10 cm away from the tumor. Tissues from the tumor center (c), the tumor invasion front (e2), and the middle between the tumor center and tumor invasion front (e1) were obtained, frozen in liquid nitrogen, and stored at −80°C for further preparation. Written informed consent was obtained from all patients enrolled in this study. This research is in compliance with the Helsinki Declaration and was approved by the Ethics Committees of Tianjin Medical University.
Western blotting and quantitative real-time PCR
Frozen tissues were minced into 1 mm3 cubes. Tissues or cells were lysed with ice-cold Triton X-100 buffer (40 mM Tris, 120 mM NaCl, 1% Triton X-100, 1 mM NaF, and 1 mM Na3VO4) added with a protease inhibitor cocktail (Hoffman-La Roche Ltd., Basel, Switzerland). The tissues or cell lysates were then centrifuged at 15,000× g at 4°C for 15 minutes, and the tissue concentrations were measured with a bicinchoninic acid assay. Approximately 60 mg of protein was separated by 8% or 10% sodium dodecyl sulfate polyacrylamide gel electrophoresis and transferred to a polyvinylidene difluoride membrane (EMD Millipore, Billerica, MA, USA), which was blocked with 5% nonfat milk. The membrane was then incubated with primary antibodies. Signals were developed with electro-chemi-luminescence (EMD Millipore) after incubation with horseradish peroxidase-conjugated secondary antibody. The antibodies used in Western blotting are listed in Table S1.
Total RNA was extracted from tissues and cells using Trizol (Thermo Fisher Scientific, Waltham, MA, USA) according to the manufacturer’s protocol. Reverse transcription was performed with a kit (TaKaRa, Dalian, People’s Republic of China) according to the manufacturer’s protocol. A forward primer specific for Ovol2 (5′-CAGTTGCTCACATTCACCAAAG-3′) and a reverse primer (5′-GAAATACCTCTCCTTCCGTGTG-3′) were used. Quantitative real-time polymerase chain reactions were performed with 1 μL of cDNA and SYBR Green Real-time PCR Master Mix (TaKaRa). The relative gene expression levels were analyzed using the 2−ΔΔCt method, with glyceraldehyde-3-phosphate dehydrogenase as an endogenous control gene.
Tissue microarrays and immunohistochemistry analysis
Approximately 2 mm-thick formalin-fixed, paraffin-embedded tissue cores were obtained from representative cancerous and surrounding tissues to construct tissue microarray (TMA) slides. TMA slides were deparaffinized and rehydrated according to standard protocols. For antigen retrieval, the sections were boiled under high pressure in citrate buffer (pH 6.0) for 3 minutes. Endogenous peroxidase was quenched with 3% H2O2 for 10 minutes at room temperature. After rinsing the sections with phosphate buffered saline for 3 minutes, the primary antibodies were incubated overnight at 4°C, followed by incubation with horseradish peroxidase-conjugated goat antimouse immunoglobulin G and goat antirabbit immunoglobulin G (dilution 1:200; Zhongshan, Beijing, People’s Republic of China) for 1 hour. Staining was performed by incubating for 1 minute with 3,3′-diaminobenzidine. The slides were counterstained with hematoxylin, followed by dehydration and mounting. The percentages for positive cells were scored as follows: 0 (0%–25%), 1 (26%–50%), 2 (50%–75%), and 3 (76%–100%). Staining intensity was stratified into the following three categories: 0 (negative), 1 (weak), and 2 (strong). The sum of the above two scores was defined as the final immunohistochemistry (IHC) staining score as follows: 0–1, low expression; 2–3, moderate expression; and 4–5, high expression. The antibodies used in IHC analysis are listed in Table S1.
Cell lines
Five HCC cell lines (Huh7, Hep3B, HCC-LM3, MHCC97L, and MHCC97H), purchased from the American Type Culture Collection (Manassas, VA, USA), were maintained in Dulbecco’s Modified Eagle Medium – high glucose (Hyclone Laboratories Inc, Novato, CA, USA) supplemented with 10% fetal bovine serum and 1% glutamine Pen-Strep solution at 37°C and 5% CO2.
Statistical analysis
Statistical analysis was conducted using SPSS 16.0 software (SPSS Inc., Chicago, IL, USA). Wilcoxon matched-pairs test was used to evaluate the significance of Ovol2 expression in HCC and adjacent noncancerous tissues. Chi-square test and Pearson’s test were applied to assess the correlation among Ovol2 expression, clinicopathological characteristics, and EMT biomarker expression. Univariate and multivariate analyses were performed with the Cox proportional hazards regression model. All data were expressed through at least three independent determinations. Statistical significance was initially set at values of P<0.05.
Results
Expression of Ovol2 was downregulated in HCC tissues
To identify the expression levels and role of Ovol2 in HCC, we analyzed the protein (n=7) and messenger RNA (mRNA) (n=10) levels in fresh tissues from patients with HCC using Western blotting and real-time PCR. The protein levels of Ovol2 exhibited a significant decrease in HCC tumor tissues compared with adjacent noncancerous tissues (Figure 1A). Real-time PCR showed low mRNA levels in ten HCC tissues and high mRNA levels in the matched noncancerous tissues (Figure 1B), because EMT occurs predominantly at the invading tumor edge. We also detected Ovol2 expression levels in compartment-specific tissues from the tumor invasion front (e1 and e2) and tumor center (c) (Figure 1C). A significant decrease in the expression of Ovol2 was noted in the tumor invasion front compared with the tumor center. We then examined Ovol2 expression in 33 sets of HCC and adjacent nontumorous tissues by IHC. The expression of Ovol2 by immunoreactivity with the specific monoclonal antibody was generally localized in both the nucleus (pointed with red arrowheads) and cytoplasm of HCC cells (Figure 1D). This was consistent with the previous study, in which, Ito et al23 assessed the immunoreactivity of Ovol2 in hair bulb and in pilomatricoma and yielded the similar results. The distribution pattern of this protein expression may be related with the differentiation of the tumor. Similar findings were also documented in the expression pattern of ZEB2, another EMT TF, in HCC, which displayed both cytoplasmic and nuclear staining.10 The underlying mechanisms still need further to be clarified. Ten (30.3%) HCC tissues were positively stained for Ovol2, whereas 23 (69.7%) matched nontumorous tissues were positively stained for Ovol2 (Figure 1D) (P<0.001; Table 1).
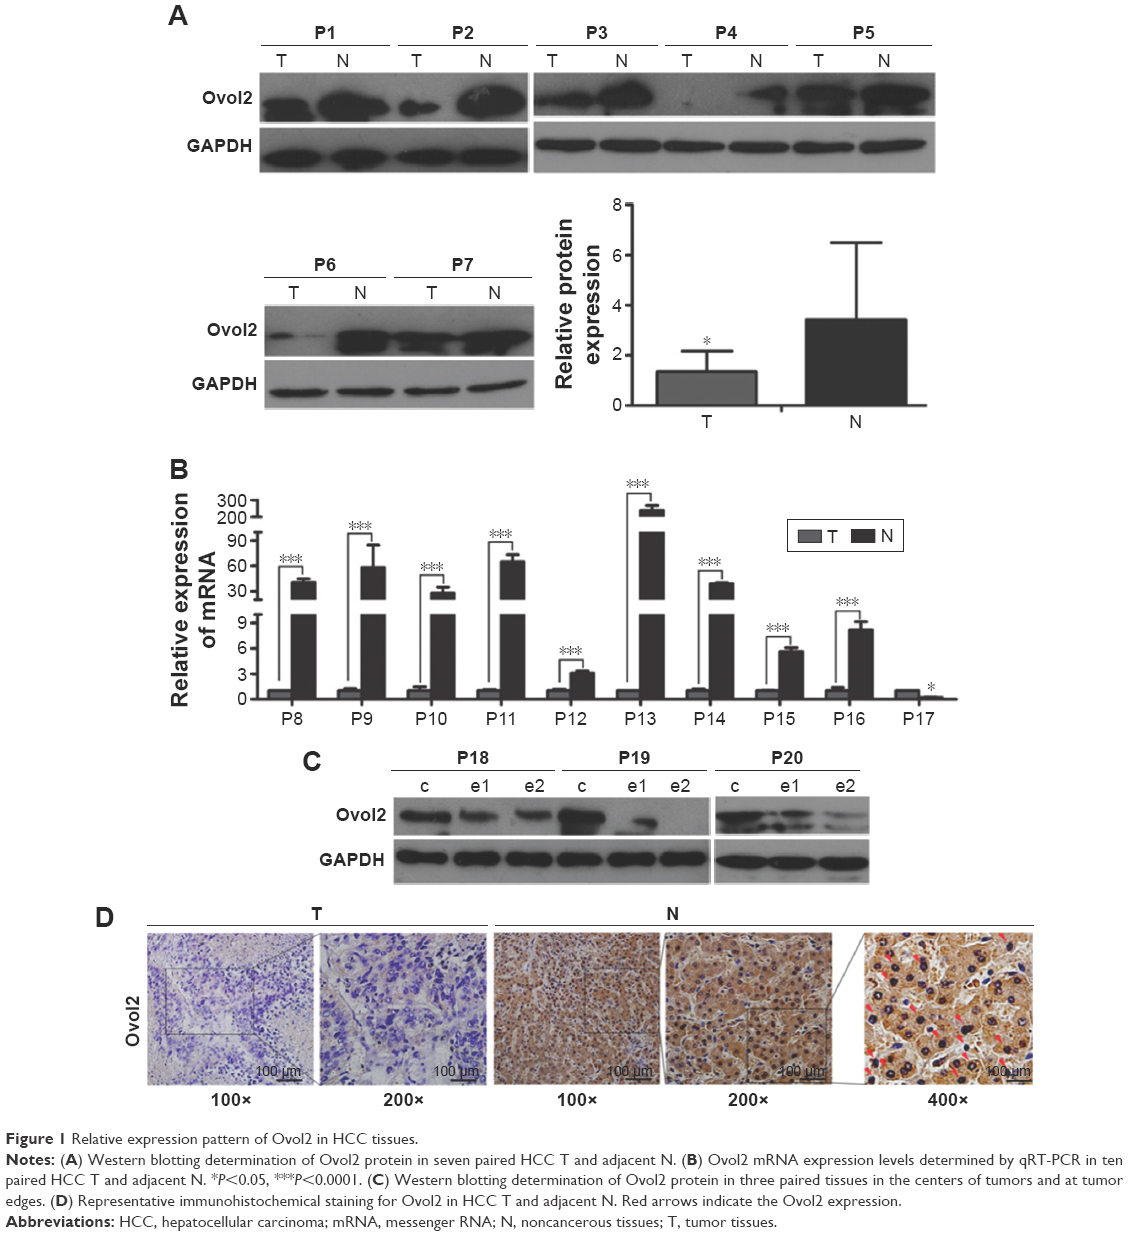 | Figure 1 Relative expression pattern of Ovol2 in HCC tissues. |
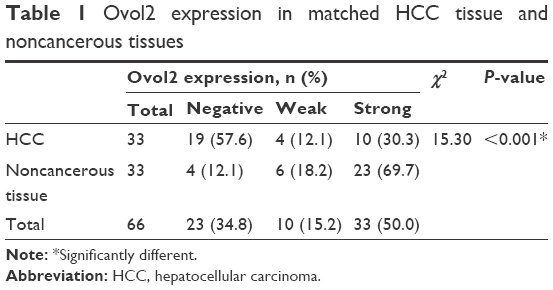 | Table 1 Ovol2 expression in matched HCC tissue and noncancerous tissues |
Relationship between Ovol2 expression and clinicopathologic features of HCC
Considering the low Ovol2 mRNA and protein expressions in HCC tissues, we investigated the relationship between Ovol2 expression and clinicopathological features, such as age, sex, tumor size, histological differentiation, microvascular invasion, clinical stage, serum alpha fetal protein, hepatitis B virus, hepatitis C virus, cirrhosis, and satellite markers (Table 2). As shown in Table 2, 74 patients with HCC were subdivided into the following three groups based on the Ovol2 expression levels: 55 patients with no expression (74.32%, negative), eight patients with weak expression (10.81%, weak), and eleven patients with strong expression (14.86%, strong). Ovol2 protein expression was significantly correlated with histological differentiation (P=0.016), microvascular invasion (P=0.033), and cirrhosis (P=0.035). No significant association was found with age, sex, tumor size, clinical stage, serum alpha fetal protein, hepatitis B virus surface antigen positivity, hepatitis C virus surface antigen positivity, and satellite markers.
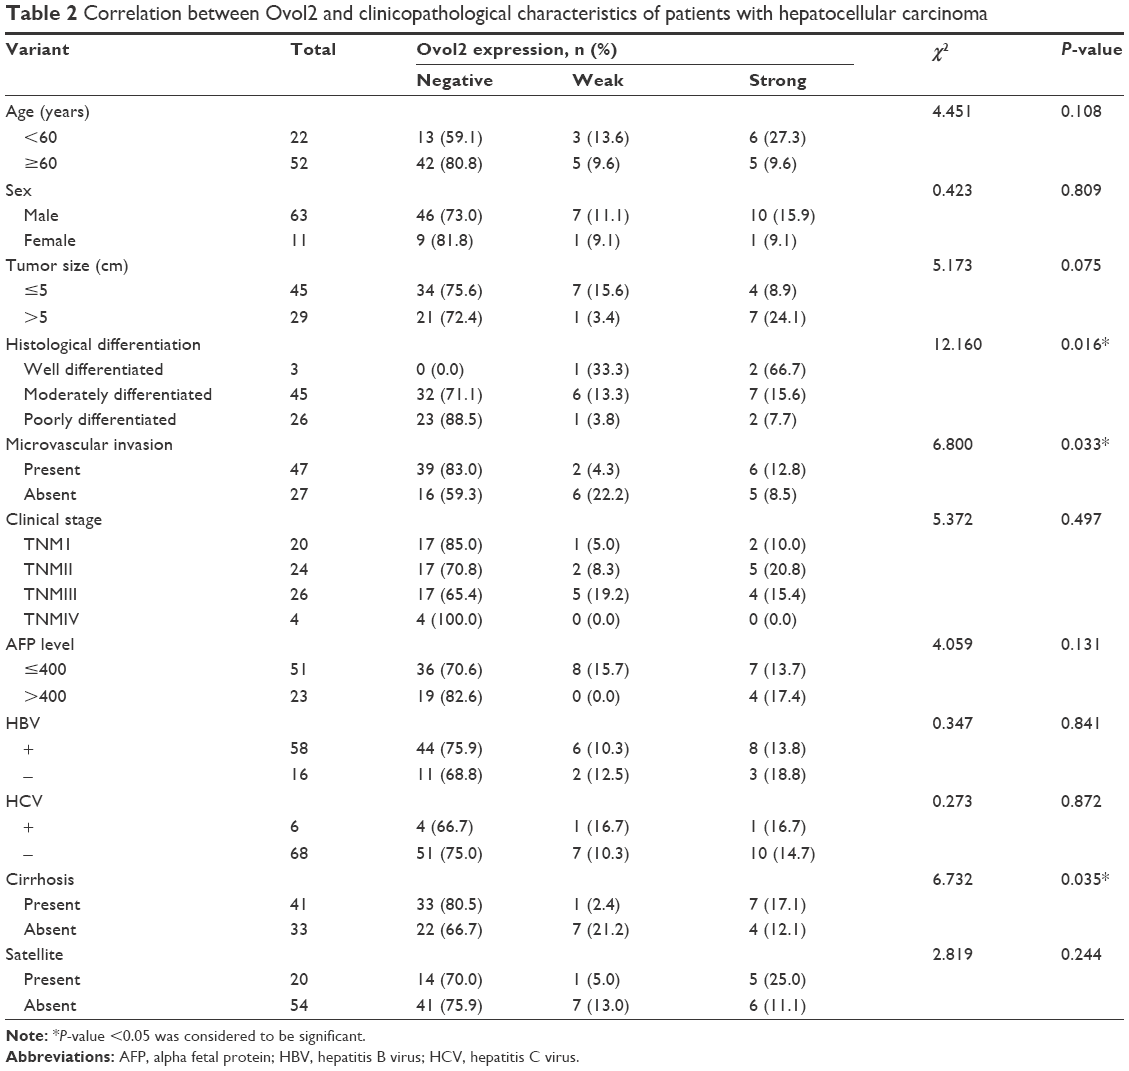 | Table 2 Correlation between Ovol2 and clinicopathological characteristics of patients with hepatocellular carcinoma |
Correlation of Ovol2 expression with expression of the EMT indicator proteins
EMT plays an important role in invasion and metastasis.24 E-cadherin and N-cadherin, two most widely distributed members of the cadherin family, mediate cell–cell adhesion, tumor cell migration, and tumor invasion.25 As a hallmark of EMT, E-cadherin is cleaved at the plasma membrane and subsequently degraded during the destabilization of adherents junctions.13 Loss of E-cadherin is closely related to the metastasis of lung cancer, liver cancer, PC, and BC.14,15 Specifically, the upregulation of N-cadherin balances the decreased expression of E-cadherin in the metastasis of tumor cells.13,17 N-cadherin is crucial for the invasion and migration of tumor cells, thereby contributing to tumor cell metastasis and invasion.18 Vimentin is widely expressed in fibroblasts, endothelial cells, and lymphocytes in interstitial cells but undetectable in normal epithelial cells.26 As a canonical symbol of EMT, vimentin was also observed in various epithelial tumors and closely related to tumor cell differentiation, invasion, and metastasis.27 To detect the relationship between the expression of Ovol2 and the expression of EMT markers, IHC for E-cadherin, N-cadherin, vimentin, and Ovol2 was performed on 74 cases of formalin-fixed, paraffin-embedded TMA slides of human HCC tissues. As shown in Figure 2A, positive N-cadherin staining appeared in the cytomembrane or cytoplasm of tumor cells; positive vimentin staining was present in the cytoplasm of mesenchymal cells; positive E-cadherin staining was mainly detected in the cytomembrane of tumor cells; and positive Ovol2 staining was detected in both the nucleus and cytoplasm of tumor tissues. The histological grade of HCC is a significant prognosis factor after surgery. Poorly differentiated HCCs are associated with higher microvascular invasion and worse survival compared with moderately and well-differentiated HCCs.9,28 In the study, the histological differentiation of three patients were identified as well differentiated (++), 45 patients were identified as moderately differentiated (+), and 26 patients was identified as poorly differentiated (−). When analyzed in detail, we found that positive N-cadherin staining and vimentin staining were mainly detected in poorly differentiated (−) HCC. Positive E-cadherin and Ovol2 were mainly detected in well-differentiated (++) HCC. As shown in Table 3, the expression of Ovol2 was positively correlated with E-cadherin (P=0.038) and negatively correlated with N-cadherin (P=0.023), whereas no significant difference was found in positive vimentin expression between different positive Ovol2 staining degrees (P>0.05). However, we detected negative Ovol2 expression in poorly differentiated tumor tissues with strong staining for vimentin (8/8) (Figure 2A) (Table 3). Using Western blotting, we found that Ovol2 was highly expressed in epithelial HCC cell lines (Huh7 and Hep3B) compared with mesenchymal HCC cell lines (MHCC97L, MHCC97H, and LM3) (Figure 2B). Thus, we further confirmed that the expression of Ovol2 is related to epithelial characteristics of HCC cells. In four independent clinical samples, patients with higher Ovol2 expression were correlated with higher E-cadherin expression, whereas lower expression levels of N-cadherin, vimentin, and Ovol2 repressed EMT-inducing TFs, including Snail and Slug (Figure 2C).
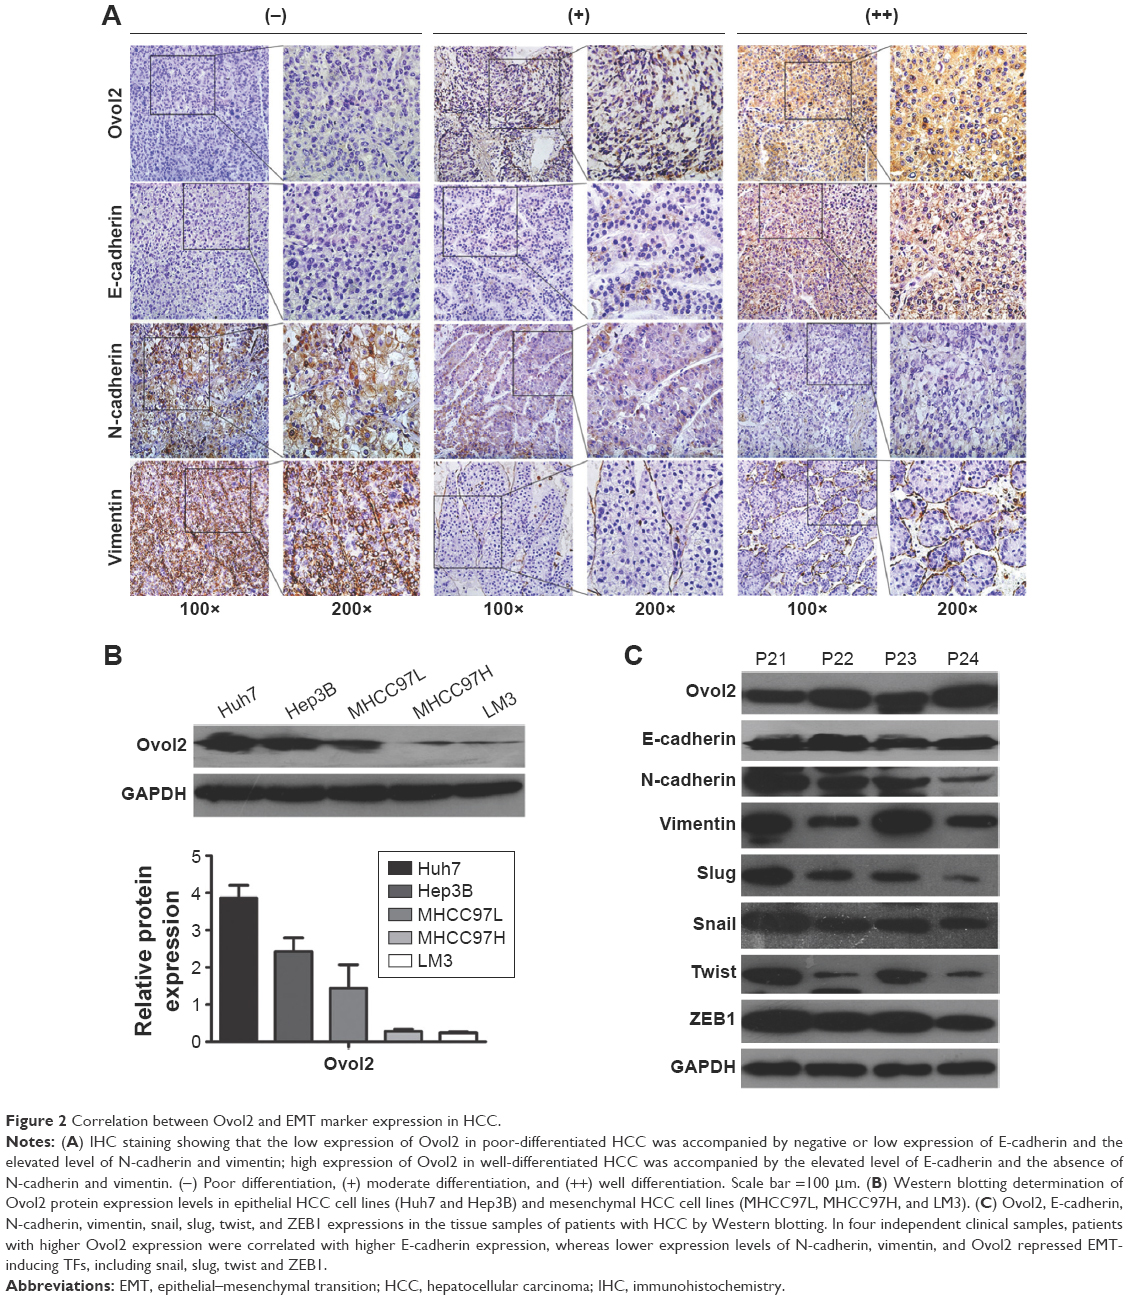 | Figure 2 Correlation between Ovol2 and EMT marker expression in HCC. |
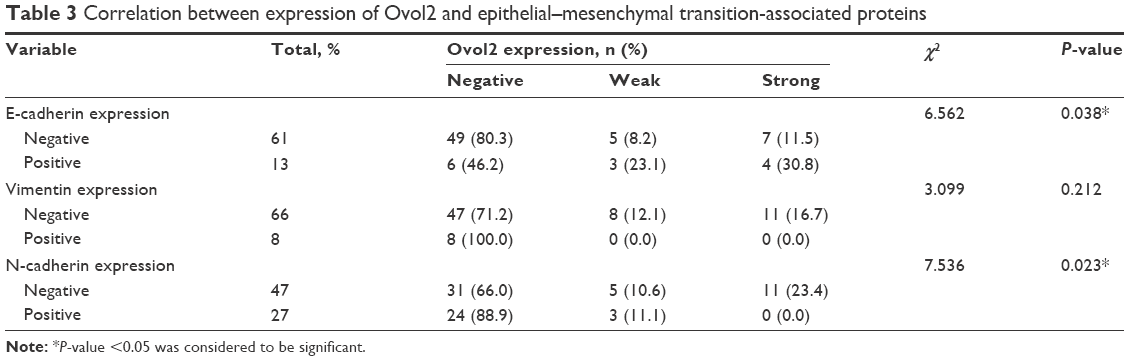 | Table 3 Correlation between expression of Ovol2 and epithelial–mesenchymal transition-associated proteins |
Correlation of Ovol2 expression with the survival of patients with HCC
Kaplan–Meier survival analyses for the 74 patients were performed to investigate the association between Ovol2 expression and survival. Patients with high Ovol2 levels had better prognosis than those with low Ovol2 levels (P<0.05) (Figure 3). Univariate analyses (Table 4) indicated that OS was significantly correlated with tumor multiplicity (P=0.037) and Ovol2 expression (P=0.036). Multivariate Cox regression analysis demonstrated that Ovol2 (HR =4.019, 95% CI, 0.871–9.551; P=0.047) expression could be an independent marker for OS. Furthermore, tumor multiplicity was also an independent predictor for OS (Table 4).
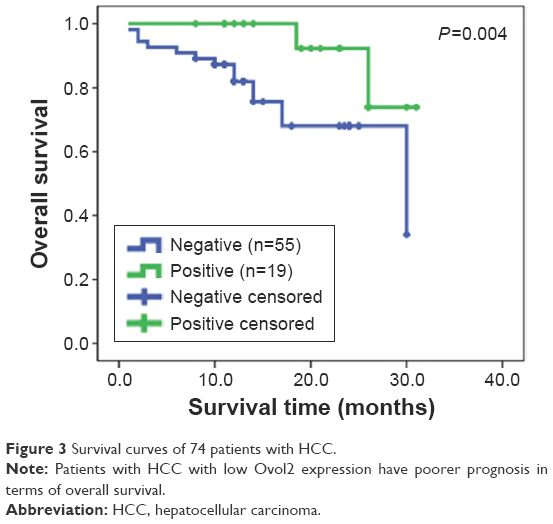 | Figure 3 Survival curves of 74 patients with HCC. |
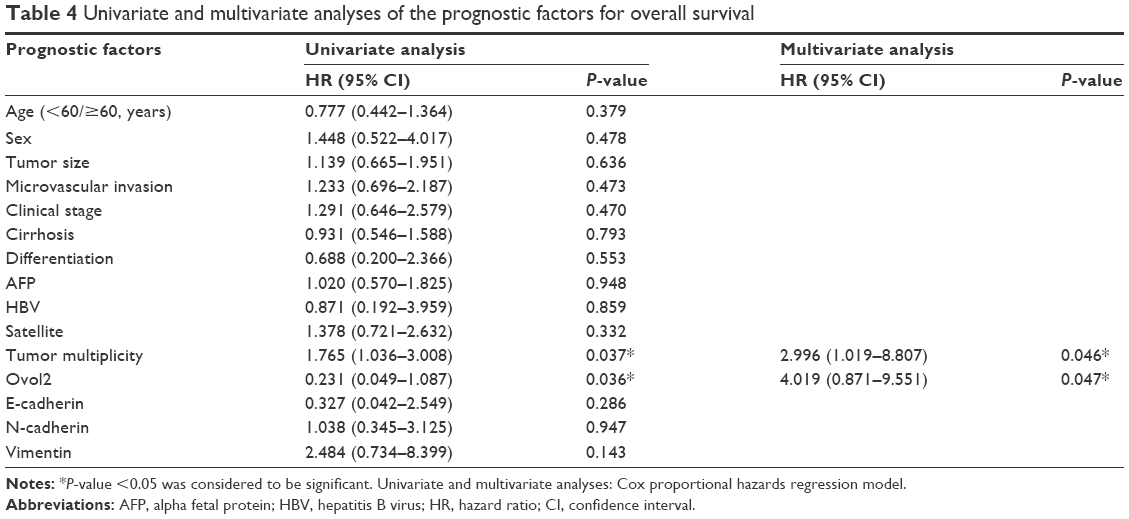 | Table 4 Univariate and multivariate analyses of the prognostic factors for overall survival |
Discussion
Evidence from clinical studies suggested that EMT has been increasingly recognized to occur during the progression of various carcinomas.12,29–31 Accumulating evidence suggested that EMT is a key physiological process in HCC recurrence and metastasis. Expression levels of EMT-related markers are associated with HCC recurrence and metastasis.8 Multiple pro-EMT TFs, including Twist and Snail, are expressed in ~40%–70% of HCC and associated with poor prognosis.25,32 In this situation, an urgent need exists to identify treatment strategies that reduce the ability of tumor cells to undergo EMT.
Metastasis is believed to begin when some cancer cells of the primary tumor undergo EMT and migrate to distant organs, where they undergo MET and grow into secondary tumors.33,34 Understanding the basic principles of the interconnection between EMT/MET is crucial in preventing cancer metastasis. During EMT, epithelial cells downregulate the expression of E-cadherin, occludin, tight junction protein 1, or cytokeratin but upregulate the expression of N-cadherin, vimentin, zinc-finger domain proteins (SNAI1/SAIL, SNAI2/SLUG, and ZEB2/SIP1), matrix metalloproteinases, and the basic helix-loop-helix domain protein Twist1.6,14,35,36 Several oncogenic signaling pathways (ie, peptide growth factors, Ras, integrin, Wnt/β-catenin, and Notch) were confirmed to induce MET.2 However, the mechanisms mediating MET are rarely understood. During MET, the epithelium-associated genes are unregulated, and the mesenchymal-associated genes are downregulated.2 C-met has been reported to induce MET in cancer cells.37 Vincan et al demonstrated that Frizzled-7 (FZD7) is necessary for MET of colorectal cancer cells, because loss of FZD7 results in the persistence of a mesenchymal state (increased SNAI2/decreased E-cadherin).33 The role of DNA methylation in MET induction has been recently highlighted as well. Snail plays an important role in the DNA methylation of E-cadherin, and stable RNA interference of Snail expression results in complete MET in carcinoma cell lines.34,35,38 Current studies described Ovols as active gatekeepers acting both as a driver of MET and a brake holder of EMT.20,36,39,40 Roca et al21 reported that Ovols influence MET by interacting with AP1, STAT1, STAT3, and nuclear factor kappa B TFs in BC and PC; furthermore, the AP1/MYC TF pair plays an important role in regulating gene expression in MET. Roca et al22 recently revealed the novel role of Ovols as important regulators of MET in BC and PC cells by repressing ZEB1 and inducing ESRP1 and miR-200. Inhibition of Ovols can induce complete EMT, and their overexpression can lead to complete MET.20 Ovol2, a well-studied regulator in various differentiation processes,39–41 can drive MET through the suppression of nearly all known EMT TFs by directly binding to their promoters in multiple cancers.13 Ovol2-null mice die during midgestation,20 whereas Ovol2-deficient mammary stem/progenitor cells are prone to undergo EMT and exhibit reduced morphogenic and regenerative capacity.19 A previous study has shown that the expression of Ovol2 is positively correlated with the OS and metastasis-free survival of postoperative patients with BC.19 In this study, we present novel evidence significant for understanding the correlations between the expression levels of Ovol2 and EMT-associated markers in HCC. Our results suggested that Ovol2 may be used as a prognostic factor for HCC.
We first investigated Ovol2 expression in patients with HCC and further analyzed the relationship between the expression of Ovol2 and the expression of EMT indicator proteins. Furthermore, the relationship between the expression of these proteins and clinicopathological variables was determined. We found that Ovol2 expression was lower in HCC tissues than in adjacent noncancerous tissues (Figure 1). Notably, the expression levels of Ovol2 were much higher in the tumor centers than those at the edges. Clinically, patients with HCC with high Ovol2 expression had a better prognosis than those with low expression. These results indicated that Ovol2 expression may be correlated with HCC progression.
The loss of E-cadherin (CDH1) and the upregulation of vimentin and N-cadherin are widely considered the hallmarks of EMT.12,25,42,43 Moreover, TFs that are central to promote EMT programs, such as Snail, Slug, Twist, and ZEB1, are regarded as important markers of EMT.44 Our study showed that Ovol2 expression levels in HCC were positively correlated with the expression of the epithelial marker E-cadherin and inversely correlated with the expression of the mesenchymal marker N-cadherin. Vimentin expression in invasive cancer cells was observed, particularly in poorly differentiated tissues.23,27,45 Thus, further studies require a large sample size, especially for cases with poor differentiation, to confirm the relationship between the expression levels of Ovol2 and vimentin in HCC. Consistent with the findings of Western blotting of clinical HCC tissues, we observed that N-cadherin, vimentin, Snail, Slug, Twist, and ZEB1 were downregulated, whereas E-cadherin was unregulated in tissues with higher expression levels of Ovol2. Altogether, these data demonstrated that Ovol2 inhibited EMT of HCC cells. Tumor multiplicity and Ovol2 expression were valuable predictors for OS by univariate analysis. When adjusted by multivariate analysis using Cox proportional hazard model, Ovol2 expression and tumor multiplicity were independent predictors for OS.
Conclusion
We demonstrated for the first time the expression patterns of Ovol2 in HCC cell lines and tissues. Ovol2 downregulation was correlated with upregulated mesenchymal markers and could predict an unfavorable prognosis. Although the precise mechanisms of Ovol2 function in tumor development require further investigation, our results confirmed the value of Ovol2 as a novel and reliable marker and a potential therapeutic target for HCC.
Acknowledgments
This work was supported by the National High Technology Research and Development Program of China (2015AA020403), National Natural Science Foundation of China (81201646, 81472683), and Tianjin Research Program of Application Foundation and Advanced Technology (13JCYBJC23600).
Disclosure
The authors report no conflicts of interest in this work.
References
Avizienyte E, Brunton VG, Fincham VJ, Frame MC. The SRC-induced mesenchymal state in late-stage colon cancer cells. Cells Tissues Organs. 2005;179(1–2):73–80. | ||
Sipos F, Galamb O. Epithelial-to-mesenchymal and mesenchymal-to-epithelial transitions in the colon. World J Gastroenterol. 2012;18(7):601–608. | ||
Kikuchi L, Oliveira CP, Carrilho FJ. Nonalcoholic fatty liver disease and hepatocellular carcinoma. Biomed Res Int. 2014;2014:106247. | ||
Nakanishi M, Rosenberg DW. Roles of cPLA2alpha and arachidonic acid in cancer. Biochim Biophys Acta. 2006;1761(11):1335–1343. | ||
Lamouille S, Xu J, Derynck R. Molecular mechanisms of epithelial-mesenchymal transition. Nat Rev Mol Cell Biol. 2014;15(3):178–196. | ||
Lee JM, Dedhar S, Kalluri R, Thompson EW. The epithelial-mesenchymal transition: new insights in signaling, development, and disease. J Cell Biol. 2006;172(7):973–981. | ||
Qin L, Yin YT, Zheng FJ, et al. WNT5A promotes stemness characteristics in nasopharyngeal carcinoma cells leading to metastasis and tumorigenesis. Oncotarget. 2015;6(12):10239–10252. | ||
van Zijl F, Zulehner G, Petz M, et al. Epithelial-mesenchymal transition in hepatocellular carcinoma. Future Oncol. 2009;5(8):1169–1179. | ||
Kim BK, Han KH, Park YN, et al. Prediction of microvascular invasion before curative resection of hepatocellular carcinoma. J Surg Oncol. 2008;97(3):246–252. | ||
Cai MY, Luo RZ, Chen JW, et al. Overexpression of ZEB2 in peritumoral liver tissue correlates with favorable survival after curative resection of hepatocellular carcinoma. PLoS One. 2012;7(2):e32838. | ||
Lim J, Thiery JP. Epithelial-mesenchymal transitions: insights from development. Development. 2012;139(19):3471–3486. | ||
Zhu AX, Rosmorduc O, Evans TR, et al. SEARCH: a phase III, randomized, double-blind, placebo-controlled trial of sorafenib plus erlotinib in patients with advanced hepatocellular carcinoma. J Clin Oncol. 2015;33(6):559–566. | ||
Yilmaz M, Christofori G. EMT, the cytoskeleton, and cancer cell invasion. Cancer Metastasis Rev. 2009;28(1–2):15–33. | ||
Bosch FX, Andl C, Abel U, Kartenbeck J. E-cadherin is a selective and strongly dominant prognostic factor in squamous cell carcinoma: a comparison of E-cadherin with desmosomal components. Int J Cancer. 2005;114(5):779–790. | ||
Bellovin DI, Bates RC, Muzikansky A, Rimm DL, Mercurio AM. Altered localization of p120 catenin during epithelial to mesenchymal transition of colon carcinoma is prognostic for aggressive disease. Cancer Res. 2005;65(23):10938–10945. | ||
Wells J, Lee B, Cai AQ, et al. Ovol2 suppresses cell cycling and terminal differentiation of keratinocytes by directly repressing c-Myc and Notch1. J Biol Chem. 2009;284(42):29125–29135. | ||
Wheelock MJ, Shintani Y, Maeda M, Fukumoto Y, Johnson KR. Cadherin switching. J Cell Sci. 2008;121(pt 6):727–735. | ||
Suyama K, Shapiro I, Guttman M, Hazan RB. A signaling pathway leading to metastasis is controlled by N-cadherin and the FGF receptor. Cancer Cell. 2002;2(4):301–314. | ||
Watanabe K, Villarreal-Ponce A, Sun P, et al. Mammary morphogenesis and regeneration require the inhibition of EMT at terminal end buds by Ovol2 transcriptional repressor. Dev Cell. 2014;29(1):59–74. | ||
Jia D, Jolly MK, Boareto M, et al. OVOL guides the epithelial-hybrid-mesenchymal transition. Oncotarget. 2015;6(17):15436–15448. | ||
Roca H, Pande M, Huo JS, et al. A bioinformatics approach reveals novel interactions of the OVOL transcription factors in the regulation of epithelial – mesenchymal cell reprogramming and cancer progression. BMC Syst Biol. 2014;8:29. | ||
Roca H, Hernandez J, Weidner S, et al. Transcription factors OVOL1 and OVOL2 induce the mesenchymal to epithelial transition in human cancer. PLoS One. 2013;8(10):e76773. | ||
Ito T, Tsuji G, Ohno F, et al. Activation of the OVOL1-OVOL2 axis in the hair bulb and in pilomatricoma. Am J Pathol. 2016;186(4):1036–1043. | ||
Suetsugu A, Nagaki M, Aoki H, Motohashi T, Kunisada T, Moriwaki H. Characterization of CD133+ hepatocellular carcinoma cells as cancer stem/progenitor cells. Biochem Biophys Res Commun. 2006;351(4):820–824. | ||
Li K, Wang X, He W, Lin N, Fan QX. Expression of N-cadherin in esophageal squamous cell carcinoma and silencing expression of N-cadherin using RNA interference on invasiveness of EC9706 cells. Ai Zheng. 2009;28(1):8–13. | ||
Mendez MG, Kojima S, Goldman RD. Vimentin induces changes in cell shape, motility, and adhesion during the epithelial to mesenchymal transition. FASEB J. 2010;24(6):1838–1851. | ||
Karihtala P, Auvinen P, Kauppila S, Haapasaari KM, Jukkola-Vuorinen A, Soini Y. Vimentin, zeb1 and Sip1 are up-regulated in triple-negative and basal-like breast cancers: association with an aggressive tumour phenotype. Breast Cancer Res Treat. 2013;138(1):81–90. | ||
Jonas S, Bechstein WO, Steinmüller T, et al. Vascular invasion and histopathologic grading determine outcome after liver transplantation for hepatocellular carcinoma in cirrhosis. Hepatology. 2001;33(5):1080–1086. | ||
Gotzmann J, Mikula M, Eger A, et al. Molecular aspects of epithelial cell plasticity: implications for local tumor invasion and metastasis. Mutat Res. 2004;566(1):9–20. | ||
Polyak K, Weinberg RA. Transitions between epithelial and mesenchymal states: acquisition of malignant and stem cell traits. Nat Rev Cancer. 2009;9(4):265–273. | ||
Thiery JP, Sleeman JP. Complex networks orchestrate epithelial-mesenchymal transitions. Nat Rev Mol Cell Biol. 2006;7(2):131–142. | ||
Sun T, Zhao N, Zhao XL, et al. Expression and functional significance of Twist1 in hepatocellular carcinoma: its role in vasculogenic mimicry. Hepatology. 2010;51(2):545–556. | ||
Vincan E, Darcy PK, Farrelly CA, Faux MC, Brabletz T, Ramsay RG. Frizzled-7 dictates three-dimensional organization of colorectal cancer cell carcinoids. Oncogene. 2007;26(16):2340–2352. | ||
Jorda M, Vinyals A, Marazuela A, et al. Id-1 is induced in MDCK epithelial cells by activated Erk/MAPK pathway in response to expression of the Snail and E47 transcription factors. Exp Cell Res. 2007;313(11):2389–2403. | ||
Fitzgerald MP, Gourronc F, Teoh ML, et al. Human chondrosarcoma cells acquire an epithelial-like gene expression pattern via an epigenetic switch: evidence for mesenchymal-epithelial transition during sarcomagenesis. Sarcoma. 2011;2011:598218. | ||
Li S, Yang J. Ovol proteins: guardians against EMT during epithelial differentiation. Dev Cell. 2014;29(1):1–2. | ||
Scotlandi K, Baldini N, Oliviero M, et al. Expression of Met/hepatocyte growth factor receptor gene and malignant behavior of musculoskeletal tumors. Am J Pathol. 1996;149(4):1209–1219. | ||
Bathula CS, Garrett SH, Zhou XD, Sens MA, Sens DA, Somji S. Cadmium, vectorial active transport, and MT-3-dependent regulation of cadherin expression in human proximal tubular cells. Toxicol Sci. 2008;102(2):310–318. | ||
Lee B, Villarreal-Ponce A, Fallahi M, et al. Transcriptional mechanisms link epithelial plasticity to adhesion and differentiation of epidermal progenitor cells. Dev Cell. 2014;29(1):47–58. | ||
Yaswen P. Reinforcing targeted therapeutics with phenotypic stability factors. Cell Cycle. 2014;13(24):3818–3822. | ||
Shi M, Zhang CQ, Zhang YQ, Liang XM, Li JQ. Micrometastases of solitary hepatocellular carcinoma and appropriate resection margin. World J Surg. 2004;28(4):376–381. | ||
Qi X, Jia J, Fan D, Han G. Brivanib for hepatocellular carcinoma trials: selection bias from barcelona clinic liver cancer stage? J Clin Oncol. 2014;32(9):968. | ||
Duseja A. Staging of hepatocellular carcinoma. J Clin Exp Hepatol. 2014;4(suppl 3):S74–S79. | ||
Vauthey JN, Ribero D, Abdalla EK, et al. Outcomes of liver transplantation in 490 patients with hepatocellular carcinoma: validation of a uniform staging after surgical treatment. J Am Coll Surg. 2007;204(5):1016–1027; discussion 1027–1028. | ||
Karihtala P, Auvinen P, Kauppila S, Haapasaari KM, Jukkola-Vuorinen A, Soini Y. Vimentin, zeb1 and Sip1 are up-regulated in triple-negative and basal-like breast cancers: association with an aggressive tumour phenotype. Breast Cancer Res Treat. 2013;138(1):81–90. |
Supplementary material
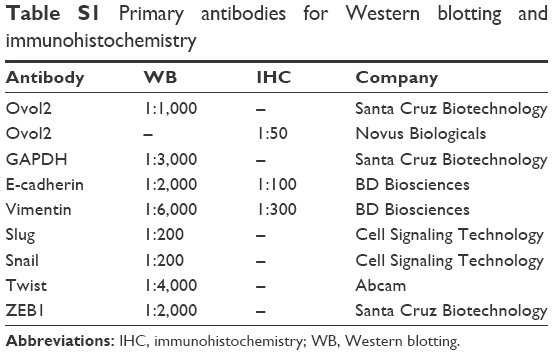 | Table S1 Primary antibodies for Western blotting and immunohistochemistry |
 © 2016 The Author(s). This work is published and licensed by Dove Medical Press Limited. The full terms of this license are available at https://www.dovepress.com/terms.php and incorporate the Creative Commons Attribution - Non Commercial (unported, v3.0) License.
By accessing the work you hereby accept the Terms. Non-commercial uses of the work are permitted without any further permission from Dove Medical Press Limited, provided the work is properly attributed. For permission for commercial use of this work, please see paragraphs 4.2 and 5 of our Terms.
© 2016 The Author(s). This work is published and licensed by Dove Medical Press Limited. The full terms of this license are available at https://www.dovepress.com/terms.php and incorporate the Creative Commons Attribution - Non Commercial (unported, v3.0) License.
By accessing the work you hereby accept the Terms. Non-commercial uses of the work are permitted without any further permission from Dove Medical Press Limited, provided the work is properly attributed. For permission for commercial use of this work, please see paragraphs 4.2 and 5 of our Terms.