")
Back to Journals » Diabetes, Metabolic Syndrome and Obesity » Volume 15
Expression of Ferroptosis-Related Genes is Correlated with Immune Microenvironment in Diabetic Kidney Disease
Authors Ni L, Cao J, Yuan C, Zhou LT, Wu X
Received 4 September 2022
Accepted for publication 26 November 2022
Published 28 December 2022 Volume 2022:15 Pages 4049—4064
DOI https://doi.org/10.2147/DMSO.S388724
Checked for plagiarism Yes
Review by Single anonymous peer review
Peer reviewer comments 2
Editor who approved publication: Dr Konstantinos Tziomalos
Lihua Ni,1,* Jingyuan Cao,2,* Cheng Yuan,3 Le-Ting Zhou,4 Xiaoyan Wu1
1Department of Nephrology, Zhongnan Hospital of Wuhan University, Wuhan, People’s Republic of China; 2The Affiliated Taizhou People’s Hospital of Nanjing Medical University, Taizhou School of Clinical Medicine, Nanjing Medical University, Taizhou, People’s Republic of China; 3Department of Gynecological Oncology, Zhongnan Hospital of Wuhan University, Wuhan, People’s Republic of China; 4Department of Nephrology, The Affiliated Wuxi People’s Hospital of Nanjing Medical University, Wuxi, People’s Republic of China
*These authors contributed equally to this work
Correspondence: Xiaoyan Wu; Le-Ting Zhou, Email [email protected]; [email protected]
Objective: This study aims to explore the correlation between ferroptosis and immune microenvironment (IME) in diabetic kidney disease (DKD) to provide a new clue for exploring the underlying molecular mechanisms.
Methods: Corresponding RNA data of DKD patients were downloaded from GEO databases. The weighted gene co-expression network analysis (WGCNA) was used to construct the network, and the selected hub genes, then, overlapped with ferroptosis-related genes (FRGs) from FerrDb. Consensus clustering was performed to identify new molecular subgroups. ESTIMATE, TIMER and ssGSEA analyses were applied to determinate the IME and immune status. Functional analyses including GO, KEGG and GSEA were conducted to elucidate the underlying mechanisms.
Results: Two molecular subtypes were identified based on the expression of FRGs. ESTIMATE algorithm revealed that there were significant differences in ESTIMATE score between these two clusters of DKD patients, with no significant difference found in stromal score and immune score. In addition, TIMER algorithm indicated there was a significant difference in the degree of T cell infiltration. The ssGSEA algorithm showed immunity was mainly concentrated in thick ascending limb and distal convoluted tubule in adult kidney. GO, KEGG and GSEA analyses revealed that the differentially expressed genes (DEGs) were mainly enriched in immune and metabolism associated pathways.
Conclusion: The ferroptosis may be induced by dysregulation of IME, thereby accelerating the progression of DKD. Our work could be applied to provide a new clue for exploring the underlying molecular mechanisms and sheds novel light on the therapy strategy of DKD.
Keywords: diabetic kidney disease, DKD, ferroptosis, immune microenvironment, IME, metabolism
Introduction
With the continuous growth of the elderly population, the incidence of chronic diseases such as diabetes is increasing year by year, which is a major challenge facing the public medical system.1,2 Diabetes is a disease with a longer course. If not treated in time, the development of the disease will lead to microvascular lesions and other complications.3 Among them, diabetic kidney disease (DKD) is a high-risk complication caused by progressive diabetes, which leads to a continuous decline in the patient’s renal function and seriously affects the patient’s health and even endangers the patient’s life.4,5 DKD develops in about 40% of the patients with diabetic and is the first cause of most end-stage renal disease among the world.6 The pathogenesis of DKD is complex and multifactorial with the participation of many pathways and mediators, such as hemodynamic abnormalities, metabolic disorders, hormone synthesis, reactive oxygen species (ROS), protein kinase (PKC), mitogen-activated protein kinase (MAPKs) and so on. Each pathway causes damage via multiple regulators or interacts with other pathways. The exact pathogenic mechanism and molecular incidence of DN are still largely uncertain.
Ferroptosis is considered as cell death dependent on intracellular iron, which is characterized by the increase of ROS to lethal levels.7 Although the interaction between ferroptosis and acute kidney injury (AKI) had been continuously explored, studies on ferroptosis and chronic renal disease remain lacking. Due to the sensitivity of renal tubules to ROS, ferroptosis also occurs in the development of DKD by increasing oxidative stress and reducing antioxidant capacity.8–10 Therefore, ferroptosis may provide a new explanation for the pathogenesis of DKD.
Li et al9 demonstrated that up-regulating NFE2-related factor 2 (NRF2) by treating with fenofibrate inhibited diabetes-related ferroptosis, which consequently delayed progression of DKD. Feng et al10 indicated that ferroptosis might enhance DN and damage renal tubules in diabetic models through HIF-1α/HO-1 pathway. Considering the relationship between ferroptosis and ROS, we speculated that ferroptosis may provide a new explanation for the pathogenesis of DKD. Previously, the renin–angiotensin–aldosterone system and oxidative stress factors were considered major causes of DKD. However, increasing evidence revealed immune and inflammation play an important role in DKD.11–13 Immune cells participate the process of cell reprogramming. In this process, the cells themselves modify the microenvironment by secreting various biological factors, thereby giving the surrounding cells the ability to decide survival and development. In the early stage of DKD, T cells and macrophages migrate and accumulate in the glomeruli and interstitium, which release pro-inflammatory cytokines and ROS.13 However, targeted immunosuppressive therapy cannot effectively inhibit the progress of end-stage renal disease (ESRD) including DKD.14,15 In addition to immune factors, the ultimate precise pathogenic mechanisms of DKD remain elusive. Significantly, various immune cells types are involved in the maintenance of iron homeostasis, which means immune microenvironment (IME) plays a vital role in controlling iron metabolism.16 Additionally, ferroptosis was found to work synergistically with immunoregulation in tumor immune microenvironment.17 The lethal ferroptosis in tumors cells can expose tumor antigens, thereby improving the immunogenicity of the microenvironment and enhancing the effectiveness of immunotherapy.18 Therefore, we hypothesized ferroptosis may be induced by IME, thereby accelerating the progression of DKD.
Here, we use data mining and data analysis techniques, and explore the correlation between ferroptosis-related genes (FRGs) and IME in DKD to provide a new clue for exploring the underlying molecular mechanisms.
Materials and Methods
Microarray Data Acquisition
The expression profile was downloaded from the GEO; By setting “diabetic kidney disease” OR “diabetic nephropathy” as the search keywords, we obtained the GSE30122 dataset, including 9 DKD glomeruli samples, 10 DKD tubuli samples and corresponding control samples, which was available on the GPL571 platform. GSE30122 dataset was composed of the following subseries: GSE30528, GSE30529 and GSE30566. The GSE30528 was selected as the training set (9 DKD and 13 control samples), and GSE30122 as test set (19 DKD and 50 control samples). In addition, we selected GSE96804, a dataset with more DKD patients, as the validation set (41 DKD and 20 control samples). The workflow is shown in Figure 1.
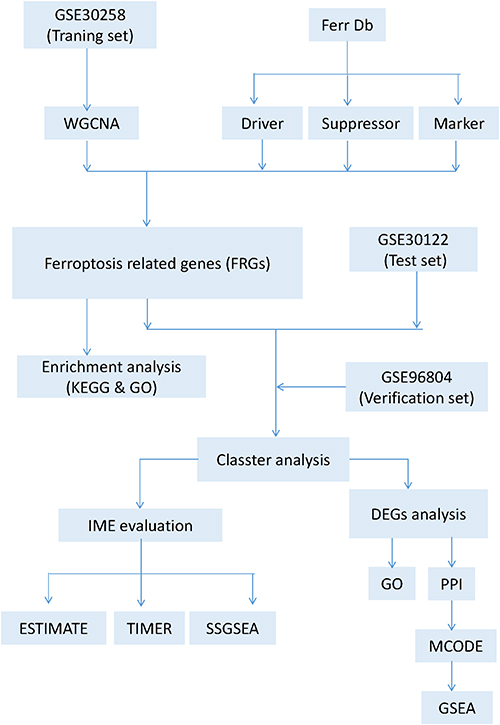 |
Figure 1 Flow chart of data preparation, processing and analysis. |
Construction of Weighted Gene Co-Expression Network Analysis
All genes in the DKD and control samples were sequenced according to median absolute deviation (MAD) values, and the top 50% of the genes were selected for weighted gene co-expression network analysis (WGCNA). At first, the Pearson’s correlation matrices and average linkage method were both performed for all pairwise genes. Then, a weighted adjacency matrix was constructed using a power function. The specific operation parameters and methods referred to our previously published literature.19 FRGs (including 220 ferroptosis driver genes, 162 ferroptosis-related suppressors and 123 ferroptosis-related markers genes.) were obtained from the ferroptosis-related database FerrDb (http://www.zhounan.org/ferrdb/index.html).
Gene Enrichment Analysis
Gene ontology (GO) enrichment analysis including cell components, molecular functions, and biological processes was based on David database (https://david. ncifcrf.gov/summary.jsp). The potential pathways can be analyzed though the Kyoto Encyclopedia Gene and Genome (KEGG).
Identification of Molecular Subtypes and IME Evaluation
Consistent clustering provided quantitative evidence for determining the number and members of possible clusters, which was performed using ConsensusClusterPlus.20 Then, we determined the clusters with a specific cluster count (k). The ESTIMATE algorithm was performed to calculate stromal score, immune score and ESTIMATE score. TIMER immune infiltrating analysis was used to estimate the abundance of immune infiltrating cells. The single-sample gene set enrichment analysis (ssGSEA) was conducted to evaluate immune signature in DKD samples.
Differentially Expressed Genes (DEGs) Analysis
According to the level of FRGs in DKD samples, molecular subtypes were divided by consistent clustering. The DEGs were identified by linear models for microarray data (Limma) between the clusters. The threshold values were |log2 FC| >1.5 and P<0.05.
Construction of the PPI Network and Module Analysis
STRING online database (https://string-db.org/) was searched to analyze and evaluate the interaction correlations among DEGs. After removing the unlinked nodes, the remaining genes were constructed into PPI network by Cytoscape (version 3.5.1). Molecular Complex Detection (MCODE), a plug-in of Cytoscape, was widely used to evaluate core networks and molecules in the PPI network. Under statistical parameters of MCODE (scores ≥3 and node ≥4), the molecules in the network may play an important role in regulating or being regulated in ferroptosis process.
Gene Set Enrichment Analysis
Gene set enrichment analysis (GSEA) was used to evaluate the distribution trend of genes in a predefined gene set in the gene table sorted by phenotypic correlation, so as to judge their contribution to phenotype. In order to further explore the function, GSEA was used to explore the functional signaling pathways with the gene set ranging 5 to 5000, and 1000 resampling.
Results
WGCNA and Key Modules Identification
First, the gene expression matrix of GSE30528 was obtained after data preprocessing. Subsequently, we selected genes with variances greater than 50% median absolute deviation (MAD). We used the Pearson’s correlation coefficient to cluster the samples, and no outlier samples were deleted (Figure 2A). When the soft threshold was equal to 9, the connectivity between genes met the scale-free network distribution to construct the WGCNA network (Figure 2B). To classify genes with similar expression profiles into gene modules, average linkage hierarchical clustering was conducted according to the TOM-based dissimilarity measure with a minimum size (gene group) of 50 for the gene dendrogram. Finally, 18 modules were identified with a distance of less than 0.25 (Figure 2C and D). It is worth noting that the darkorange module (r = 0.75, p = 5.5e-5), orange module (r = −0.71, p = 2.4e-4), sienna3 module (r = −0.67, p = 6.6e-4), turquoise module (r = −0.93, p = 2.4e-10) and white module (r = −0.62, p = 2.1e-3) were significantly correlated with disease status, suggesting that these genes in above modules may play a protective role in DKD (Figure 2E). Furthermore, we also confirmed there was a highly significant correlation between Gene Significance (GS) for weight vs Module Membership (MM) in these modules (orange module: r = 0.56, Figure 3A; turquoise module: r = 0.93, Figure 3B; white module: r = 0.68, Figure 3C; darkorange module: r = 0.77, Figure 3D and sienna3 module: r = 0.37, Figure 3E).
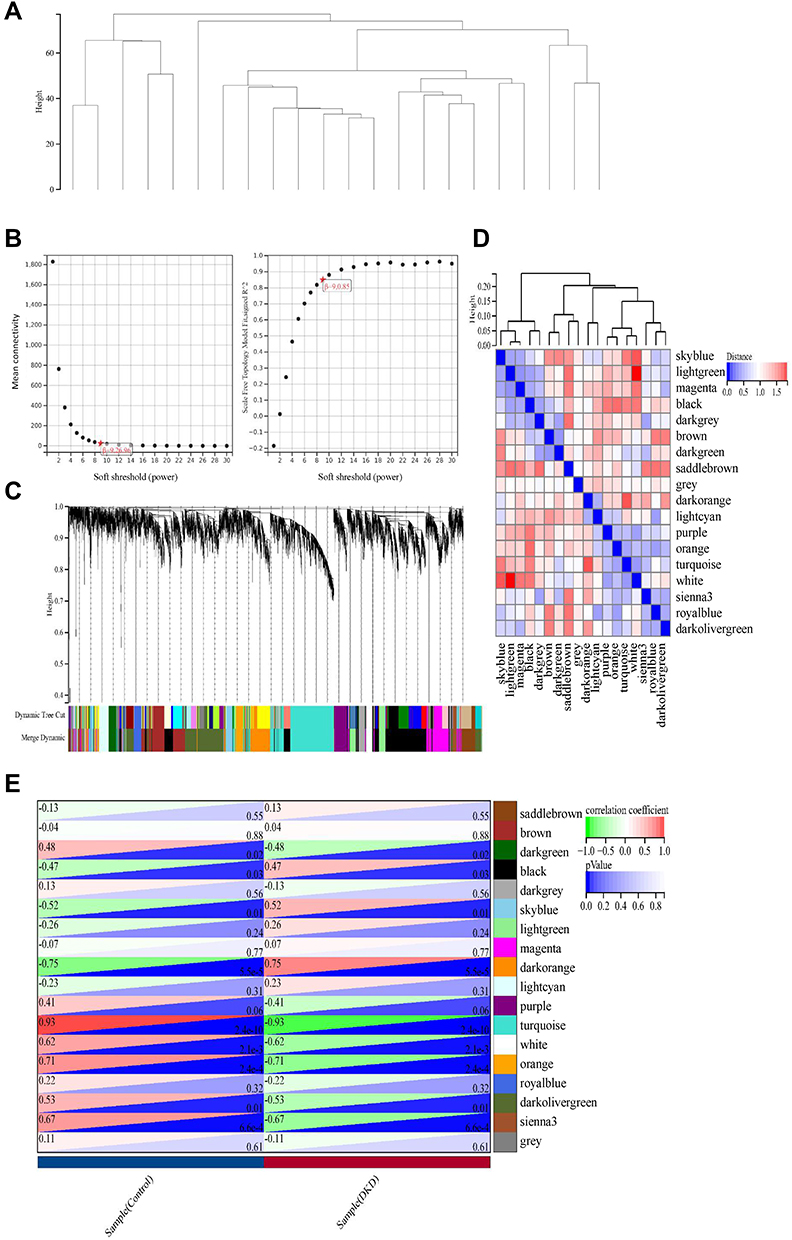 |
Figure 2 Preprocessing of WGCNA. (A) Hierarchical clustering of module hub genes that summarize the modules yielded in the clustering analysis. (B) Analysis of the scale-free fit index for various soft-thresholding powers, and the mean connectivity for various soft-thresholding powers. (C) The cluster dendrogram of genes in GSE30528. (D) Interaction relationship analysis of co-expressed genes. (E) Heatmap plot of the adjacencies in the hub gene network. |
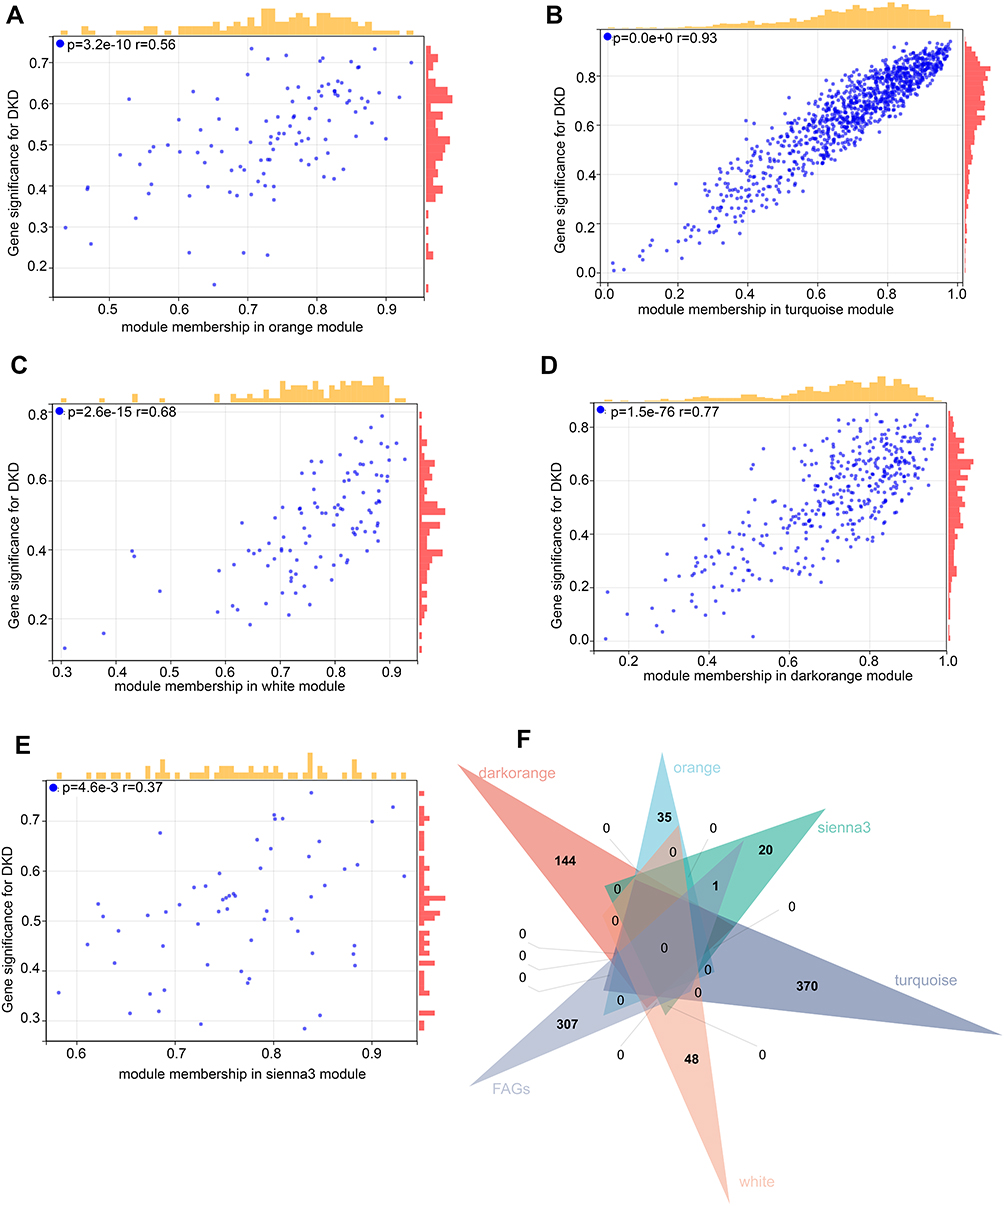 |
Figure 3 Ferroptosis-related Genes (FRGs) in hub gene modules. (A–E) Gene Significance (GS) for weight vs Module Membership (MM) in orange, turquoise, white, dark orange and sienna3 module. (F) Venn diagram to find the FRGs in 5 hub modules. |
Functional Enrichment Analysis of FRGs
We overlapped the FRGs in the above five modules. Seven FRGs (LINC00472, NNMT, OSBPL9, VEGFA, UBC, GPX2 and ALOX5) were closely related to the disease status of DKD (Figure 3F). The results of GO showed that FRGs were mainly enriched in intracellular vesicle-related functions (Figure 4A), and KEGG enriched in metabolic related pathways (Figure 4B).
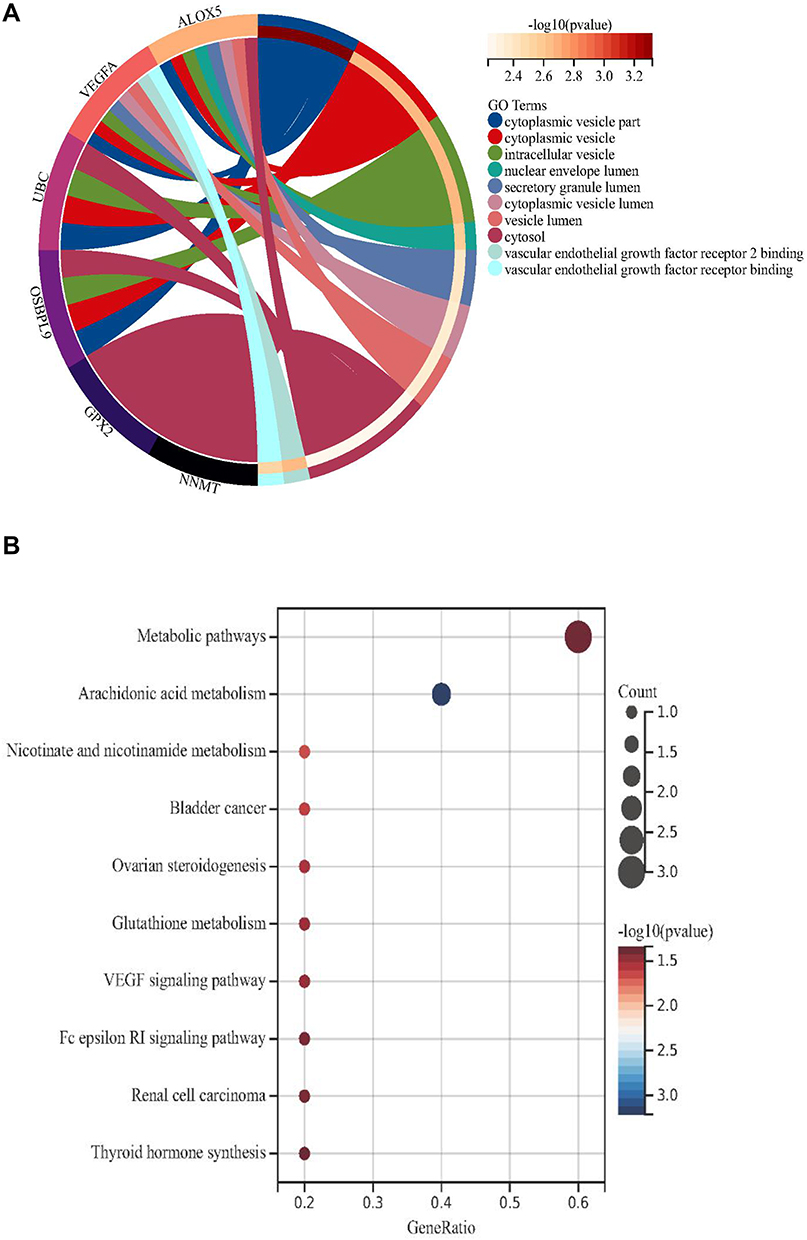 |
Figure 4 The results of enrichment analysis for ferroptosis-related genes (FRGs). (A) The GO analysis. (B) The KEGG enrichment analysis. |
Identification of Two Molecular Subtypes Based on FRGs
GSE30122 was selected as the test set. Cluster analysis was performed to divide the DKD patients into subgroups based on seven FRGs. Based on the evaluation of the cumulative distribution function (CDF) curve and relative change in area under CDF curve, when the k value increases, the offline area of the CDF curve gradually increases. Before the cluster analysis, the validation set (GSE96804) was used to judge the clinical diagnostic value. Except for ALOX5, the expression levels of other FRGs were significantly different between DKD patients and controls (Supplementary Figure S1A). The ROC curves suggested all FRGs have clinical diagnostic value (Supplementary Figure S1B-H). Therefore, seven FRGs including ALOX5 were still performed for subsequent cluster and functional analysis.
Based on the assessment of the downward trend of CDF value, two molecular subtypes were identified based on the expression of FRGs (Figure 5A and B). In addition, according to the evaluation of the average consistency in the cluster group, the number of clusters with the highest average consistency was k = 2 (Figure 5C). Therefore, the optimal clustering stability was identified when k = 2.
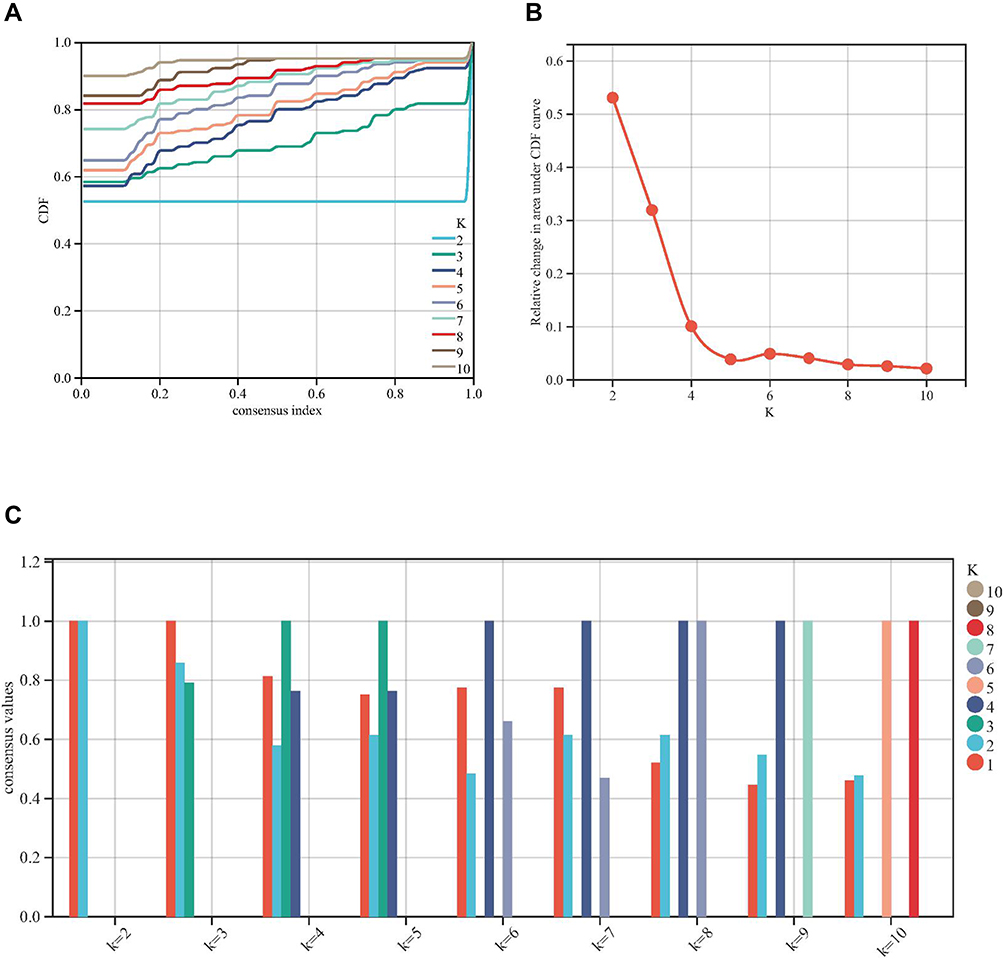 |
Figure 5 Consensus cluster based on ferroptosis-related genes (FRGs). (A-C) k = 2 was identified the optimal value for consensus clustering. |
IME Between the Molecular Subtypes
When DKD patients were divided into two clusters according to FRGs, the heat map for cluster is shown in Figure 6A, the expression level of FRGs between clusters is presented in Figure 6B. Next, we performed immune analyses to explore IME between the two clusters. ESTIMATE algorithm revealed that there were significant differences in ESTIMATE score between these two clusters of DKD patients, with no significant difference in stromal and immune score (P < 0.05, Figure 6C). Then, TIMER algorithm indicated there was a significant difference in the degree of T cell infiltration (P < 0.05, Figure 6D). The ssGSEA algorithm was further performed. Interestingly, immunity was mainly concentrated in thick ascending limb and distal convoluted tubule in adult kidney (Figure 6E).
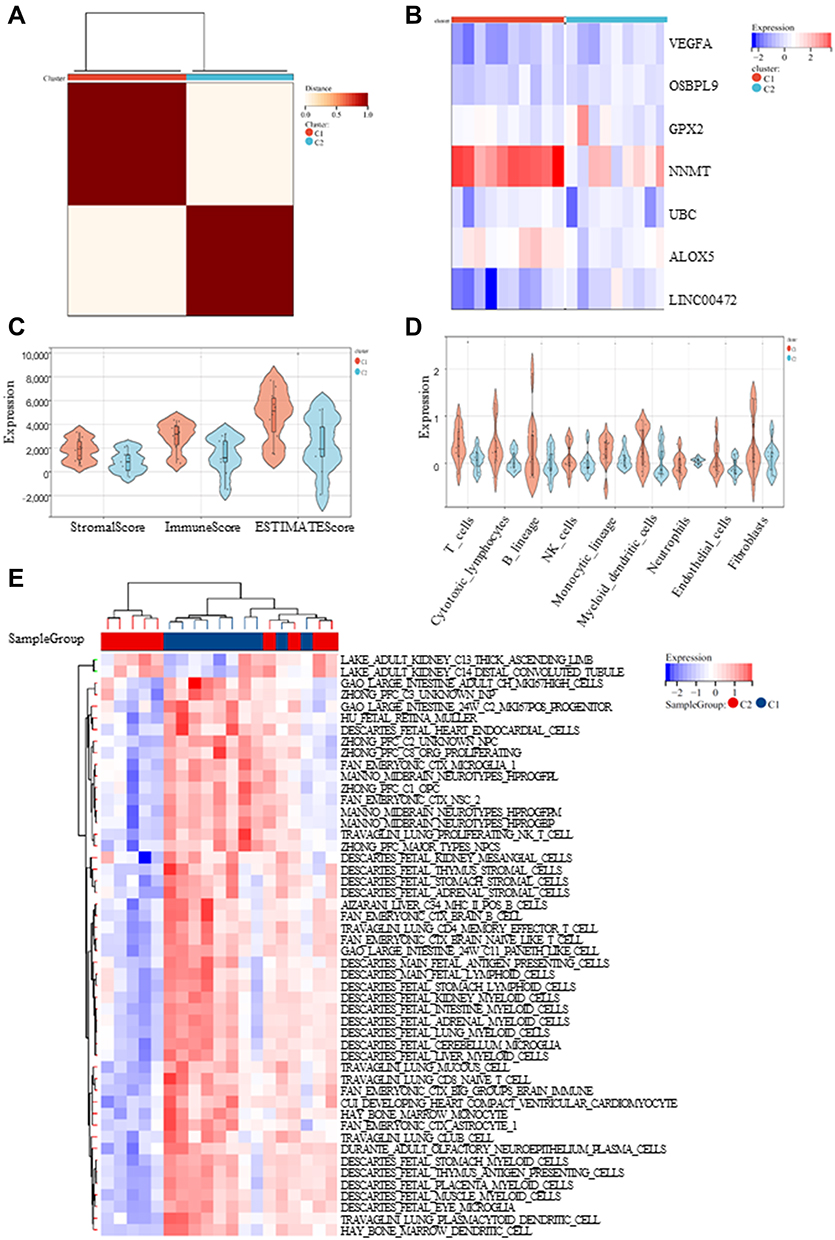 |
Figure 6 Immune analyses in the 2 clustered molecular subtypes. (A) The expression profile of DKD samples were divided into 2 subtypes; (B) The heatmap visualizing the expression of ferroptosis-related genes (FRGs) in the 2 subtypes; (C-E) ESTIMATE, TIMER and ssGSEA algorithm was further performed to analyze their cell type signature. |
DEGs and Functional Analyses
DEGs between the two clusters were identified, and functional analyses were performed to explore the underlying signaling mechanisms. A total of 679 DEGs including 297 genes were upregulated and 400 genes were downregulated (|log2 FC| >1.5 and P<0.05, Figure 7A and B). GO enrichment analysis revealed that the DEGs were enriched in T cell proliferation and T cell activation related immune function (Figure 7C), which was consistent with the results of TIMER algorithm.
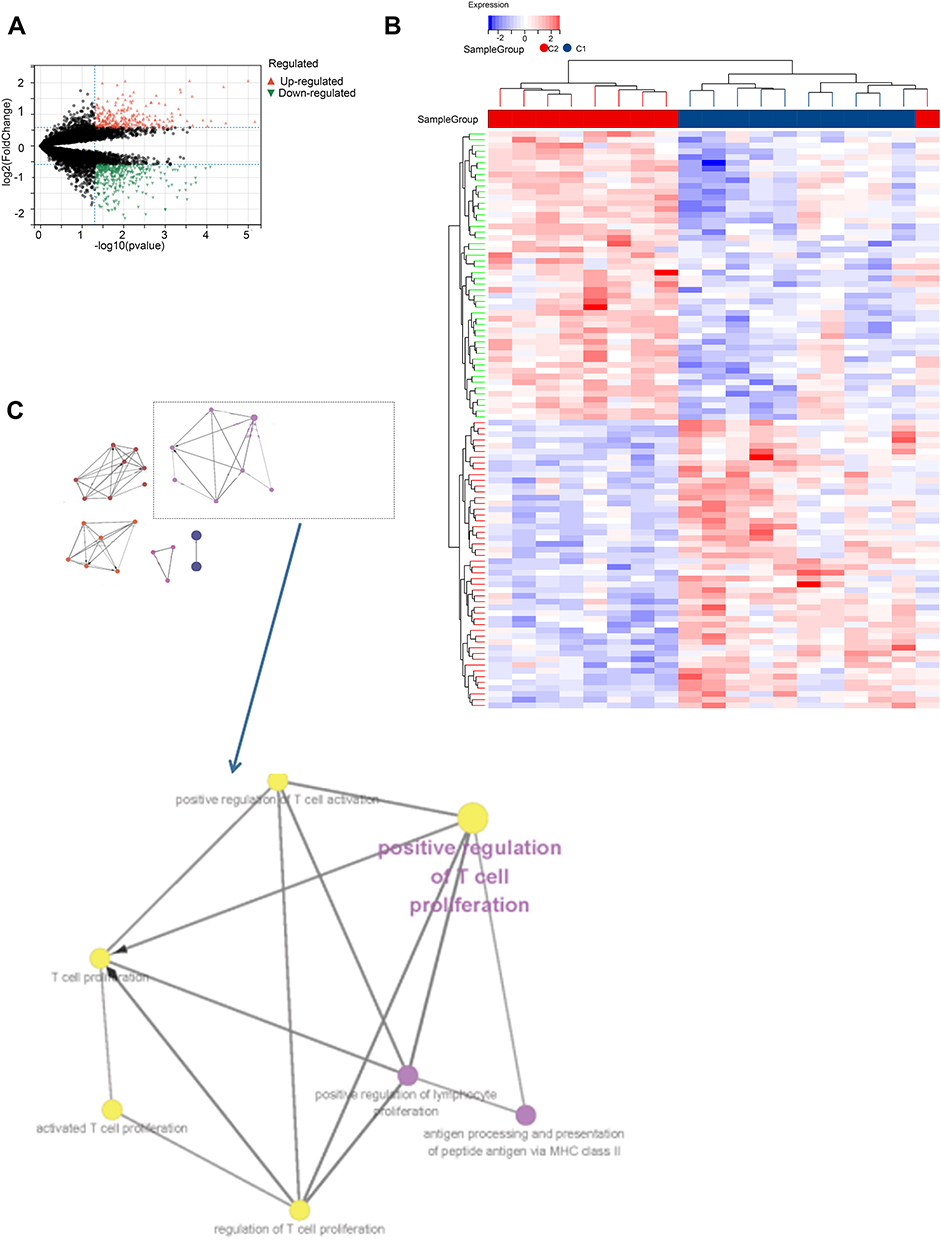 |
Figure 7 The differentially expressed genes (DEGs) analysis between the clustered subtypes. (A) Volcano map; (B) The heatmap; (C) The visualizing the biological processes enriched by GO analysis. |
Then, PPI network (Figure 8A) was constructed and five submodels (Figure 8B-F) were identified by MCODE plug-in, all of which were closely associated with metabolism and immunity, especially, such as organic acid catabolic process and carboxylic acid catabolic process in MCODE 1, immune system process in MCODE 2, T cell activation in MCODE 3 and lipid metabolic process in MCODE 5 (Figure 9A). To identify the potential functions, GSEA was conducted to identify KEGG pathways enriched in the DKD samples between clusters, which following the minimum gene set was 5, the maximum gene set was 5000, and 1000 resampling. Consistently, GSEA revealed that P53 signaling pathway and starch and sucrose metabolism were activated in cluster 1 (Figures 9B).
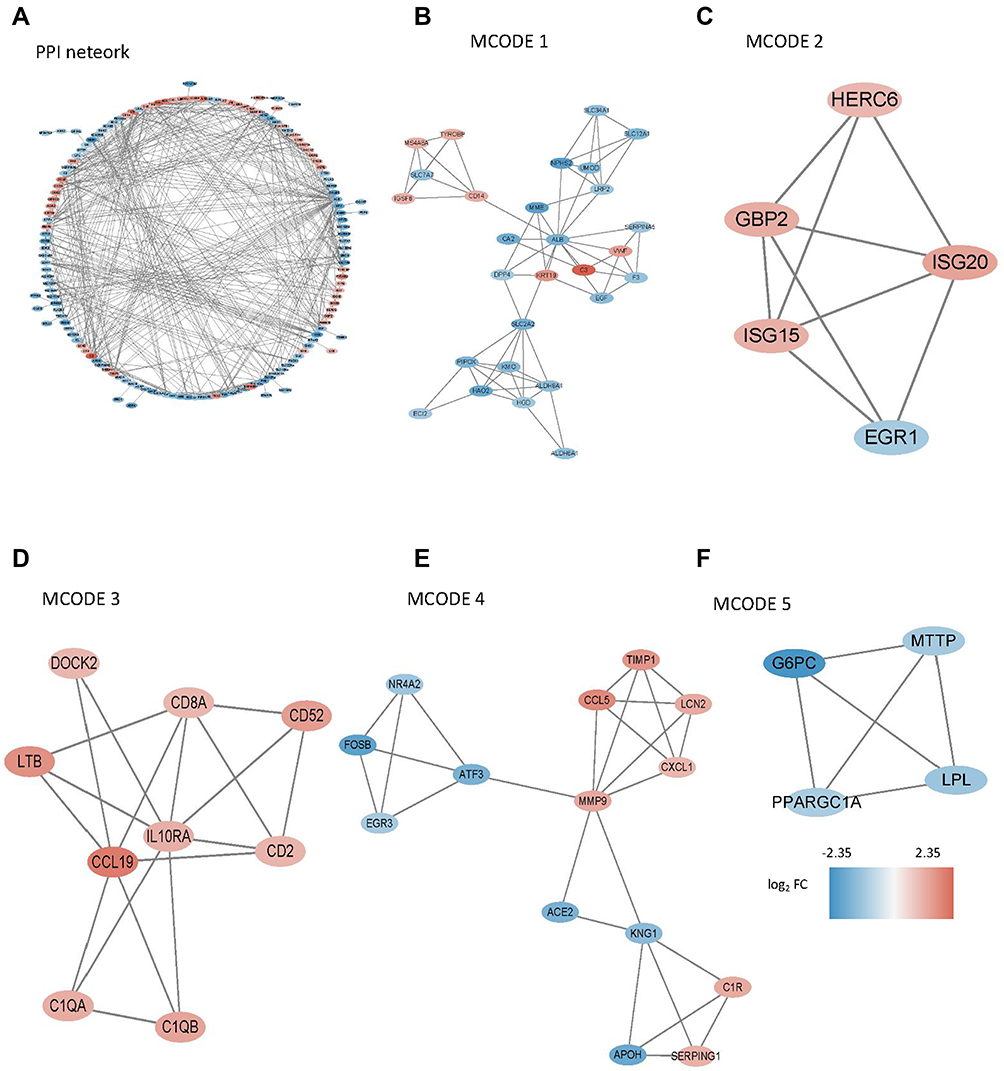 |
Figure 8 PPI network was constructed and five submodels were identified by MCODE plug-in. (A) PPI network of all DEGs; (B-F) Five submodels identified by MCODE. |
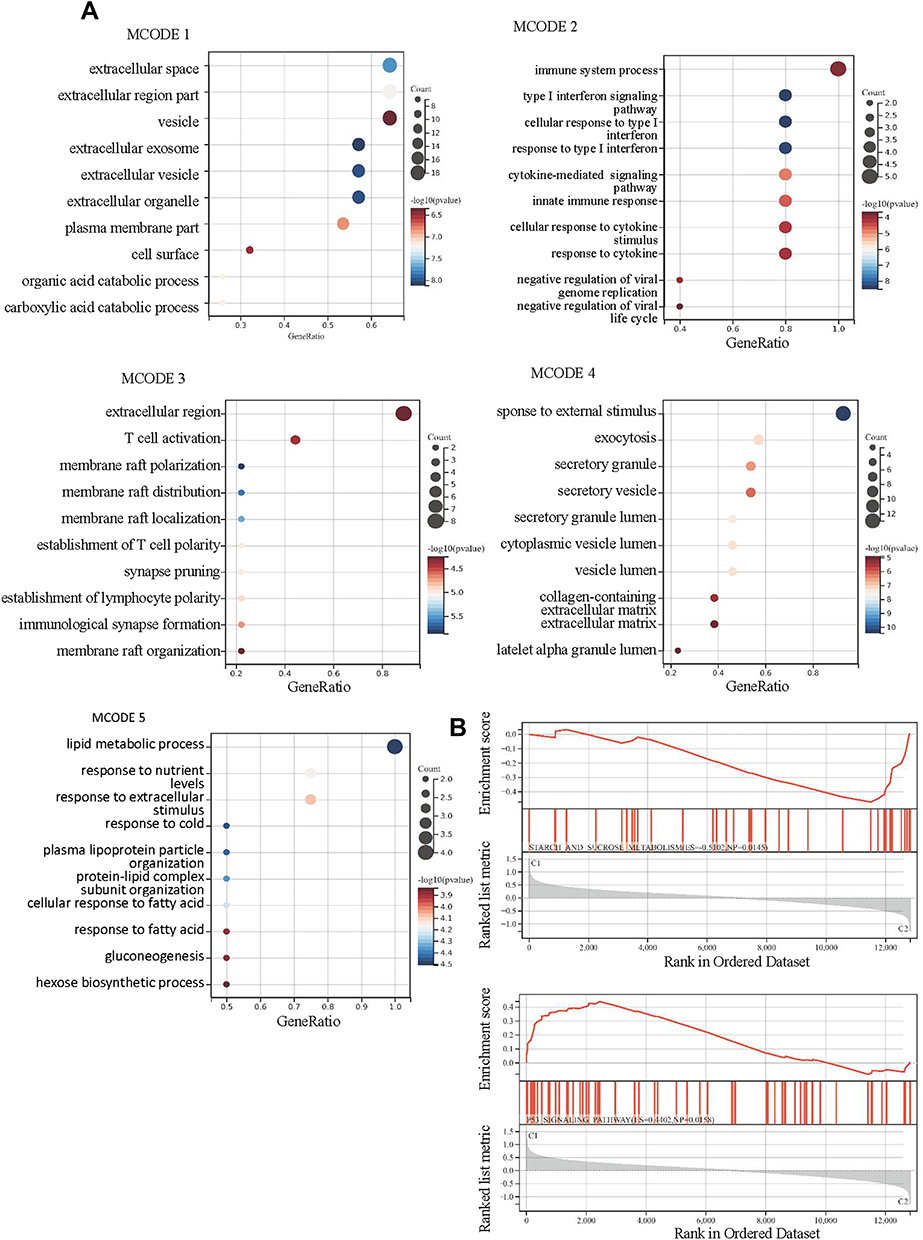 |
Figure 9 The results of enrichment analysis for differentially expressed genes (DEGs) between the clustered subtypes. (A) GO analysis in 5 MCODE; (B) GSEA. |
Discussion
Ferroptosis is a special type of regulatory cell death, which is different from necrosis and apoptosis.21 The iron metabolism is regulated by many signals, such as lysosomes activity, excessive activation of heme oxygenase-1 (HMOX1) and the suppression of nitrogen fixation 1 (NFS1).22 Abnormal iron metabolism may cause iron overload, deposition of lipid peroxidation products, ROS overproduction and weakened antioxidant capacity.23 The accumulation of ROS induced by oxidative stress activates various signaling pathways, leading to DNA damage and cell apoptosis is considered to be one of the important mechanisms.24,25 In our current study, we firstly found the correlation between FRGs and IME in DKD, which might provide a new clue for exploring the underlying molecular mechanisms.
Initially, we selected the microarray data (GSE30528) as a training set, including 9 DKD glomeruli samples and 13 glomeruli controls. Two molecular subtypes were classified based on the expression of FRGs in test set (GSE30122). Then, TIMER algorithm indicated differences in the degree of T cell infiltration were in distinct clusters associated with FGR. Therefore, we speculated that T cell infiltration may be a factor that induced ferroptosis. The immune disorders of DKD patients were interfered by a variety of factors, especially end-stage patients receiving regular hemodialysis (HD), those who were susceptible to infections.26,27 It has also been reported that the decrease of T cells in HD patients may be related to the increased tendency of T cell apoptosis.28 DKD is a common complication of type 1 and type 2 diabetes. Type 1 diabetes is an immune system disease, and their CD4+ T cell ratio is increased.29 T cell proliferation, cytokine production and renal T cell infiltration were also observed in DKD animal model, which means T cell activation may play a major role in the initiation of DKD.30–33 The equilibrium between proinflammatory features and stabilizing regulatory T cells seems to regulate the faint balance between systemic and local requirements for inflammatory stimuli.34,35 However, the mechanism of T cell infiltration regulates ferroptosis in DKD has not been clarified.
Therefore, in order to further explore the mechanism affecting the IME, we analyzed the expression profiles of DKD samples with different FRGs clusters. A total of 679 DEGs including 297 genes were upregulated and 400 genes were downregulated in cluster 2, which were enriched in extracellular related biological processes and metabolic related biological processes. Similarly, KEGG enrichment analysis also identified some signaling pathways associated with immune and metabolism. PPI network was constructed and five submodels were identified, all of which were closely associated with metabolism and immunity. Consistently, GSEA revealed that P53 signaling pathway and starch and sucrose metabolism were activated in cluster 1. These phenomena indicated that metabolism and immune may be associated with the contribution of ferroptosis in DKD patients. Indeed, multiple factors are involved in metabolism implicated by ferroptosis, such as amino acid and lipid metabolism.36 The energy metabolism pathway of DKD has undergone a series of reorganization and adjustment, which is reflected by starch and sucrose metabolism in GSEA. Ferroptosis is an iron-dependent form of cell death resulting from lipid-based reactive oxygen species, along with increased metabolism of arachidonic acid compromised by conglutination and infiltration of immune cells.37,38 Numerous metabolic pathways involving iron, lipids, and amino acids regulated the process of ferroptosis in DKD.39–42 The importance of ferroptosis in regulating IME had been implicated in cancers.17,43,44 Tumor cells need more iron than normal cells to promote their rapid proliferation, which make them more vulnerable to iron overload and ROS accumulation. The possible mechanism for the correlation between ferroptosis and IME was that ferroptotic cells release HMGB1 (a key factor in immunogenicity), which could attract immune cells to their location.45–47 Besides, ferroptotic cells could release a potential signal – amino acid oxidation products – to attract immune cells to participate in immune regulation.48 Taken together, metabolism disorder initiated in the ferroptosis, which was directly or indirectly affected by IME, leading to cell damage in DKD. There were several limitations to the present study. Firstly, the sample size was small; thus, there may be some deviation in the final results. Secondly, without their own data to verify, the statistical results may be overestimated.
In summary, two molecular subtypes were identified based on FRGs in DKD via consensus clustering. Immune analysis and functional analyses revealed that ferroptosis may be induced by dysregulation of IME, thereby accelerating the progression of DKD, and metabolism-related pathways may play an important role. Our work could shed a novel light on the mechanism of DKD cell death and provides potential target for therapeutic drug for DKD patients.
Data Sharing Statement
The data that support the findings of this study are openly available in GEO (https://www.ncbi.nlm.nih.gov/gds/).
Statement of Ethics
According to the Ethics Committee of Zhongnan Hospital of Wuhan University, the analysis of the data from the public database does not involve the collection of biological samples, which can be exempt from approval.
Author Contributions
All authors contributed to data analysis, drafting or revising the article, have agreed on the journal to which the article will be submitted, gave final approval of the version to be published, and agree to be accountable for all aspects of the work.
Funding
This work was supported by grants from the National Natural Science Foundation of China (82200807, 82100763, 82100721and 81900698), Hubei Provincial Natural Science Foundation of China (2021CFB090), China Postdoctoral Science Foundation (2022M710686) and the Foundation of Jiangsu Commission of Health (M2021048), the Fundamental Research Funds for the Central University (2042021kf0150 and 2042020kf0137), Zhongnan Hospital of Wuhan University Science, Technology and Innovation Seed Fund, Project (cxpy2020027 and znpy2019036). Excellent Doctor (Post), Zhongnan Hospital of Wuhan University (ZNYB2020009), Zhongnan Hospital of Wuhan University Science, Technology and Innovation Seed Fund, Project znpy2019036 and znpy2017044. Hubei Province Health and Family Planning Scientific Research Project (WJ2019MB103). The Clinical Research Project for Wu Jieping Medical Foundation (320.6750.19089-58). The Research Fund from Medical Sci-Tech Innovation Platform of Zhongnan Hospital, Wuhan University (PTXM2020028 and XKJS202035).
Disclosure
The authors declare that they have no competing interests in this work.
References
1. Shlisky J, Bloom DE, Beaudreault AR., et al. Nutritional considerations for healthy aging and reduction in age-related chronic disease. Adv Nutrition. 2017;8(1):17–26. doi:10.3945/an.116.013474
2. Cao X, Chen P. The effects of alprostadil combined with α-lipoic acid in the treatment of senile diabetic nephropathy. Am J Transl Res. 2021;13(9):10823–10829.
3. Simó R, Ciudin A, Simó-Servat O, Hernández C. Cognitive impairment and dementia: a new emerging complication of type 2 diabetes-The diabetologist’s perspective. Acta Diabetol. 2017;54(5):417–424. doi:10.1007/s00592-017-0970-5
4. Umanath K, Lewis JB. Update on Diabetic Nephropathy: core Curriculum 2018. Am J Kidney Dis. 2018;71(6):884–895. doi:10.1053/j.ajkd.2017.10.026
5. Lin YC, Chang YH, Yang SY, Wu KD, Chu TS. Update of pathophysiology and management of diabetic kidney disease. J Formosan Med Assoc. 2018;117(8):662–675. doi:10.1016/j.jfma.2018.02.007
6. Alicic RZ, Rooney MT, Tuttle KR. Diabetic kidney disease: challenges, progress, and possibilities. Clin J Am Soc Nephrol. 2017;12(12):2032–2045. doi:10.2215/CJN.11491116
7. Lei P, Bai T, Sun Y. Mechanisms of ferroptosis and relations with regulated cell death: a review. Front Physiol. 2019;10:139. doi:10.3389/fphys.2019.00139
8. Kim S, Kang SW, Joo J, et al. Characterization of ferroptosis in kidney tubular cell death under diabetic conditions. Cell Death Dis. 2021;12(2):160. doi:10.1038/s41419-021-03452-x
9. Li S, Zheng L, Zhang J, Liu X, Wu Z. Inhibition of ferroptosis by up-regulating Nrf2 delayed the progression of diabetic nephropathy. Free Radic Biol Med. 2021;162:435–449. doi:10.1016/j.freeradbiomed.2020.10.323
10. Feng X, Wang S, Sun Z, et al. Ferroptosis enhanced diabetic renal tubular injury via HIF-1α/HO-1 pathway in db/db mice. Front Endocrinol (Lausanne). 2021;12:626390. doi:10.3389/fendo.2021.626390
11. Navarro-González JF, Mora-Fernández C, Muros de Fuentes M, García-Pérez J. Inflammatory molecules and pathways in the pathogenesis of diabetic nephropathy. Nat Rev Nephrol. 2011;7(6):327–340. doi:10.1038/nrneph.2011.51
12. Macisaac RJ, Ekinci EI, Jerums G. Markers of and risk factors for the development and progression of diabetic kidney disease. Am J Kidney Dis. 2014;63(2 Suppl 2):S39–62. doi:10.1053/j.ajkd.2013.10.048
13. Galkina E, Ley K. Leukocyte recruitment and vascular injury in diabetic nephropathy. J Am Soc Nephrol. 2006;17(2):368–377. doi:10.1681/ASN.2005080859
14. Fernández-Real JM, Vendrell J, García I, Ricart W, Vallès M. Structural damage in diabetic nephropathy is associated with TNF-α system activity. Acta Diabetol. 2012;49(4):301–305. doi:10.1007/s00592-011-0349-y
15. Mima A, Qi W, King GL. Implications of treatment that target protective mechanisms against diabetic nephropathy. Semin Nephrol. 2012;32(5):471–478. doi:10.1016/j.semnephrol.2012.07.010
16. Ganz T, Nemeth E. Iron homeostasis in host defence and inflammation. Nat Rev Immunol. 2015;15(8):500–510. doi:10.1038/nri3863
17. Tang B, Zhu J, Li J, et al. The ferroptosis and iron-metabolism signature robustly predicts clinical diagnosis, prognosis and immune microenvironment for hepatocellular carcinoma. Cell Commun Signal. 2020;18(1):174. doi:10.1186/s12964-020-00663-1
18. Zhang F, Li F, Lu GH, et al. Engineering Magnetosomes for Ferroptosis/Immunomodulation Synergism in Cancer. ACS nano. 2019;13(5):5662–5673. doi:10.1021/acsnano.9b00892
19. Ni L, Yuan C, Zhang C, et al. Co-expression network analysis identified LTF in association with metastasis risk and prognosis in clear cell renal cell carcinoma. Onco Targets Ther. 2020;13:6975–6986. doi:10.2147/OTT.S251000
20. Wilkerson MD, Hayes DN. ConsensusClusterPlus: a class discovery tool with confidence assessments and item tracking. Bioinformatics. 2010;26(12):1572–1573. doi:10.1093/bioinformatics/btq170
21. Wang Y, Peng X, Zhang M, Jia Y, Yu B, Tian J. Revisiting tumors and the cardiovascular system: mechanistic intersections and divergences in ferroptosis. Oxid Med Cell Longev. 2020;2020:9738143. doi:10.1155/2020/9738143
22. Hassannia B, Vandenabeele P, Vanden Berghe T. Targeting ferroptosis to iron out cancer. Cancer Cell. 2019;35(6):830–849. doi:10.1016/j.ccell.2019.04.002
23. Ravingerová T, Kindernay L, Barteková M, et al. The molecular mechanisms of iron metabolism and its role in cardiac dysfunction and cardioprotection. Int J Mol Sci. 2020;21:21. doi:10.3390/ijms21217889
24. Yang L, Guan G, Lei L, Liu J, Cao L, Wang X. Oxidative and endoplasmic reticulum stresses are involved in palmitic acid-induced H9c2 cell apoptosis. Biosci Rep. 2019;39:5. doi:10.1042/BSR20190225
25. Ma B, Guan G, Lv Q, Yang L. Curcumin ameliorates palmitic acid-induced Saos-2 cell apoptosis via inhibiting oxidative stress and autophagy. Evid Based Complement Alternat Med. 2021;2021:5563660. doi:10.1155/2021/5563660
26. Betjes MG, Langerak AW, van der Spek A, de Wit EA, Litjens NH. Premature aging of circulating T cells in patients with end-stage renal disease. Kidney Int. 2011;80(2):208–217. doi:10.1038/ki.2011.110
27. Costa E, Lima M, Alves JM, et al. Inflammation, T-cell phenotype, and inflammatory cytokines in chronic kidney disease patients under hemodialysis and its relationship to resistance to recombinant human erythropoietin therapy. J Clin Immunol. 2008;28(3):268–275. doi:10.1007/s10875-007-9168-x
28. Borges A, Borges M, Fernandes J, et al. Apoptosis of peripheral CD4(+) T-lymphocytes in end-stage renal disease patients under hemodialysis and rhEPO therapies. Ren Fail. 2011;33(2):138–143. doi:10.3109/0886022X.2011.553300
29. Jailwala P, Waukau J, Glisic S, et al. Apoptosis of CD4+ CD25(high) T cells in type 1 diabetes may be partially mediated by IL-2 deprivation. PLoS One. 2009;4(8):e6527. doi:10.1371/journal.pone.0006527
30. Meyers JH, Chakravarti S, Schlesinger D, et al. TIM-4 is the ligand for TIM-1, and the TIM-1-TIM-4 interaction regulates T cell proliferation. Nat Immunol. 2005;6(5):455–464. doi:10.1038/ni1185
31. Pichler R, Afkarian M, Dieter BP, Tuttle KR. Immunity and inflammation in diabetic kidney disease: translating mechanisms to biomarkers and treatment targets. Am J Physiol Renal Physiol. 2017;312(4):F716–f731. doi:10.1152/ajprenal.00314.2016
32. Moon JY, Jeong KH, Lee TW, Ihm CG, Lim SJ, Lee SH. Aberrant recruitment and activation of T cells in diabetic nephropathy. Am J Nephrol. 2012;35(2):164–174. doi:10.1159/000334928
33. Zeng C, Shi X, Zhang B, et al. The imbalance of Th17/Th1/Tregs in patients with type 2 diabetes: relationship with metabolic factors and complications. J Mol Med. 2012;90(2):175–186. doi:10.1007/s00109-011-0816-5
34. Yatim N, Jusforgues-Saklani H, Orozco S, et al. RIPK1 and NF-κB signaling in dying cells determines cross-priming of CD8+ T cells. Science. 2015;350(6258):328–334. doi:10.1126/science.aad0395
35. Martin-Sanchez D, Ruiz-Andres O, Poveda J, et al. Ferroptosis, but not necroptosis, is important in nephrotoxic folic acid-induced AKI. J Am Soc Nephrol. 2017;28(1):218–229. doi:10.1681/ASN.2015121376
36. Fang X, Wang H, Han D, et al. Ferroptosis as a target for protection against cardiomyopathy. Proc Natl Acad Sci U S A. 2019;116(7):2672–2680. doi:10.1073/pnas.1821022116
37. Vinten-Johansen J, Jiang R, Reeves JG, Mykytenko J, Deneve J, Jobe LJ. Inflammation, proinflammatory mediators and myocardial ischemia-reperfusion Injury. Hematol Oncol Clin North Am. 2007;21(1):123–145. doi:10.1016/j.hoc.2006.11.010
38. Boag SE, Andreano E, Spyridopoulos I. Lymphocyte communication in myocardial ischemia/reperfusion injury. Antioxid Redox Signal. 2017;26(12):660–675. doi:10.1089/ars.2016.6940
39. Sha W, Hu F, Xi Y, Chu Y, Bu S. Mechanism of ferroptosis and its role in type 2 diabetes mellitus. J Diabetes Res. 2021;2021:9999612. doi:10.1155/2021/9999612
40. Wu K, Fei L, Wang X, et al. ZIP14 is involved in iron deposition and triggers ferroptosis in diabetic nephropathy. Metallomics. 2022;14(7). doi:10.1093/mtomcs/mfac034
41. Jin T, Chen C. Umbelliferone delays the progression of diabetic nephropathy by inhibiting ferroptosis through activation of the Nrf-2/HO-1 pathway. Food Chem Toxicol. 2022;163:112892. doi:10.1016/j.fct.2022.112892
42. Stockwell BR, Jiang X, Gu W. Emerging mechanisms and disease relevance of ferroptosis. Trends Cell Biol. 2020;30(6):478–490. doi:10.1016/j.tcb.2020.02.009
43. Xu Z, Peng B, Liang Q, et al. Construction of a ferroptosis-related nine-lncRNA signature for predicting prognosis and immune response in hepatocellular carcinoma. Front Immunol. 2021;12:719175. doi:10.3389/fimmu.2021.719175
44. Zhang K, Ping L, Du T, et al. A ferroptosis-related lncRNAs signature predicts prognosis and immune microenvironment for breast cancer. Front Mol Biosci. 2021;8:678877. doi:10.3389/fmolb.2021.678877
45. Wen Q, Liu J, Kang R, Zhou B, Tang D. The release and activity of HMGB1 in ferroptosis. Biochem Biophys Res Commun. 2019;510(2):278–283. doi:10.1016/j.bbrc.2019.01.090
46. Yu Y, Xie Y, Cao L, et al. The ferroptosis inducer erastin enhances sensitivity of acute myeloid leukemia cells to chemotherapeutic agents. Mol Cell Oncol. 2015;2(4):e1054549. doi:10.1080/23723556.2015.1054549
47. Yamazaki T, Hannani D, Poirier-Colame V, et al. Defective immunogenic cell death of HMGB1-deficient tumors: compensatory therapy with TLR4 agonists. Cell Death Differ. 2014;21(1):69–78. doi:10.1038/cdd.2013.72
48. Friedmann Angeli JP, Krysko DV, Conrad M. Ferroptosis at the crossroads of cancer-acquired drug resistance and immune evasion. Nat Rev Cancer. 2019;19(7):405–414. doi:10.1038/s41568-019-0149-1
 © 2022 The Author(s). This work is published and licensed by Dove Medical Press Limited. The full terms of this license are available at https://www.dovepress.com/terms.php and incorporate the Creative Commons Attribution - Non Commercial (unported, v3.0) License.
By accessing the work you hereby accept the Terms. Non-commercial uses of the work are permitted without any further permission from Dove Medical Press Limited, provided the work is properly attributed. For permission for commercial use of this work, please see paragraphs 4.2 and 5 of our Terms.
© 2022 The Author(s). This work is published and licensed by Dove Medical Press Limited. The full terms of this license are available at https://www.dovepress.com/terms.php and incorporate the Creative Commons Attribution - Non Commercial (unported, v3.0) License.
By accessing the work you hereby accept the Terms. Non-commercial uses of the work are permitted without any further permission from Dove Medical Press Limited, provided the work is properly attributed. For permission for commercial use of this work, please see paragraphs 4.2 and 5 of our Terms.