Back to Journals » Journal of Hepatocellular Carcinoma » Volume 10
Expression of CKS2 in Hepatocellular Carcinoma: Correlation with Survival Outcomes and Immune Microenvironment
Authors Zhi R ![]() , Hao P
, Hao P ![]() , Li W, Zhao H
, Li W, Zhao H ![]()
Received 21 July 2023
Accepted for publication 3 October 2023
Published 9 October 2023 Volume 2023:10 Pages 1767—1784
DOI https://doi.org/10.2147/JHC.S427624
Checked for plagiarism Yes
Review by Single anonymous peer review
Peer reviewer comments 3
Editor who approved publication: Dr Mohamed Shaker
Renhou Zhi, Pengfei Hao, Weibin Li, Haoliang Zhao
Department of General Surgery, Third Hospital of Shanxi Medical University, Shanxi Bethune Hospital, Shanxi Academy of Medical Sciences, Tongji Shanxi Hospital, Taiyuan, 030032, People’s Republic of China
Correspondence: Haoliang Zhao, Department of General Surgery, Third Hospital of Shanxi Medical University, Shanxi Bethune Hospital, Shanxi Academy of Medical Sciences, Tongji Shanxi Hospital, No. 99 Longcheng Street, Xiaodian District, Taiyuan, 030032, People’s Republic of China, Tel +86 138 0340 0588, Email [email protected]
Purpose: Cyclin-dependent kinase regulatory subunit 2 (CKS2) has an important function in regulating cancer progression and cell cycle. This research aims to ascertain how CKS2 plays its part through multi-omics analyses, to reveal its relationship with the immune microenvironment in hepatocellular carcinoma (HCC).
Material and Methods: Multiple databases were used to determine the transcriptional data of CKS2, epigenetic changes, and effects thereof upon the prognosis of HCC patients. The biological functions of CKS2 in HCC were expounded by functional enrichment analysis. TIMER, GSEA, TIP, and online single-cell sequencing databases were adopted for revealing correlations of CKS2 expression with infiltration of immune cells, immunomodulators, immunity cycle, and immune markers in the immune microenvironment of HCC. In addition, qRT-PCR and Western blot were used to validate gene expression in tissues from HCC patients.
Results: Open database analysis confirmed that CKS2 is highly expressed in HCC and that it is related to poor prognosis in HCC patients. Aberrant methylation levels of the two methylation sites of CKS2 in HCC contributed to its high expression and were correlated significantly with survival. The CKS2 expression was positively correlated with most immunomodulators and infiltration levels for B and CD8+T cells, dendritic cells, and macrophages, especially exhausted CD8+T cells. Besides, the CKS2 expression was also found to have significant correlations with immunity cycle steps and diverse immune markers in HCC. The high CKS2 expression was confirmed in HCC at both mRNA and protein levels, showing a significant increase compared to normal tissue.
Conclusion: CKS2 is a potential prognostic biomarker of HCC and can promote the progression of HCC via its influences on the immune environment. Additionally, a positive correlation between CKS2 and immune markers was observed, highlighting its potential as an immunotherapeutic target.
Keywords: hepatocellular carcinoma, CKS2, tumor immune microenvironment, immune cycle, immune markers, immunomodulators
Introduction
Hepatocellular carcinoma (HCC), accounting for 75–85% of all primary liver cancers, is the sixth most commonly diagnosed cancer.1,2 In recent years, it has been reported that the morbidity and mortality of liver cancer continue to rise, accompanied by a low five-year relative survival rate.3 Risks of cancer mainly include hepatitis B or C viral infection, alcoholism, non-alcoholic fatty liver disease, obesity, and metabolic syndrome.4 Only a small number of patients with early liver cancer benefit from radical treatment, including resection, local ablation, or liver transplantation.5 For advanced patients, although significant progress has been achieved in multimodal therapy, including radiotherapy, chemotherapy, and targeted therapy,6–11 the prognosis remains far from satisfactory. Notably, the latest research indicates the potential for immunotherapy as a cure for HCC in the future,12 and in particular, a revolutionary breakthrough has been obtained for immune-checkpoint inhibitors in the treatment of HCC.13 However, most patients did not respond well to this treatment.14 The phenomenon has kindled our interest in studying the underlying molecular mechanism that regulates tumor immunotherapy responses and immune microenvironments. Therefore, searching for new prognostic biomarkers and underlying targets for immune-related therapy is important.
The cyclin-dependent kinase regulatory subunit (CKS) family consists of two members: CKS1 and CKS2. They are members of highly conserved small (9 KDa) cyclin-dependent kinase (CDK)-binding proteins which are indispensable components in cell cycle regulation.15,16 Growing evidence has shown the over-expression of CKS2 in diverse tumors, such as colon, breast, and cholangiocarcinoma,17–19 and the involvement of CKS2 in the progression of tumors. Furthermore, it has been shown that the high expression of this gene in adrenocortical carcinoma and lung adenocarcinoma not only accelerates tumor growth, but also influences immune infiltration and controls the immune microenvironment.20,21 Although CKS2 is found to function actively in biological behaviors of HCC cells in recent research and has some biological functions in HCC cells,22,23 the exact roles of CKS2 and its correlations with immune microenvironments in HCC still call for further clarification.
The expression of CKS2 in several types of cancers was comprehensively studied using several public databases.20,21,24 Additionally, the correlation between CKS2 and the prognosis of HCC patients was evaluated. The DNA methylation sites and survival rates were also comprehensively analyzed to identify epigenetic changes. The study discussed correlations of the level of gene mRNA with those of immune infiltration cells, immunomodulators, immune markers, and immunity cycle steps in HCC.
Materials and Methods
HCCDB Database
HCCDB (http://lifeome.net/database/hccdb/home.html) contains 3917 samples related to the expression of HCC genes, covering 15 published data sets for the expression of liver cancer genes.25 The database includes 13 microarray data sets and two RNA-Seq data sets (ICGC and TCGA) from GEO. In this study, we used HCCDB to provide a visual data set for the differential expression analysis of CKS2 in HCC.
UALCAN Database
UALCAN (http://ualcan.path.uab.edu) functions as a comprehensive interactive online portal to analyze OMICS data of cancers (TCGA, MET500, CPTAC, and CBTTC).26 Among them, subgroups based on stages of individual cancers and pathological grades were studied further. The histological grades of HCC were divided into four grades from I to IV, which separately represent well, moderately, poorly differentiated, and undifferentiated cases. The American Joint Committee on Cancer (AJCC) stage provided the basis for stages of individual cancers.
GEPIA Dataset
The newly developed interactive online database GEPIA (http://gepia.cancer-pku.cn/) contains expression information pertaining to 8587 normal tissue specimens and 9736 tumors from TCGA and GTEx.27 It was adopted for analysis of the correlations between the CKS2 expression and the survival time, including disease-free survival (DFS) and overall survival (OS).
SMART Dataset
SAMRT (http://www.bioinfo-zs.com/smartapp/) is an online Web application that we used to analyze DNA methylation data of the CKS2 gene in the TCGA project.28
Analysis Based on the LinkedOmics Database
The LinkedOmics database (http://www.linkedomics.org/login.php) includes numerous data sets and clinical data on 32 types of cancers, as well as data on 11,158 patients in the TCGA project.29 The database was applied in the analysis of those genes that have positive correlations with CKS2. The top 50 genes with positive correlations were shown by heat map.
GO and KEGG Analysis
Based on positively correlated genes in the LinkedOmics database, the gene ontology (GO) analysis and Kyoto Encyclopedia of Gene and Genome (KEGG) () analysis were performed using the ggplot2 package in R software. GO analysis included results of gene annotation of cellular components (CCs), biological processes (BPs), and molecular functions (MFs).
GSEA Database
Gene set enrichment analysis (GSEA) (http://www.gsea-msigdb.org/gsea/index.jsp) is an initial database containing 1325 biologically defined gene sets. The database was used to interpret gene expression data and to conduct various analyses by focusing on genomes, that is, genomes that share common biological functions, chromosome locations, or regulation.30
TIMER Database
TIMER (https://cistrome.shinyapps.io/timer/) is an online server used for analysis of immune infiltration in diverse cancers in the TCGA database.31 High-through put sequencing (RNA-Seq expression profile) data were also adopted for analysis of immune cell infiltration in tumor tissues. It offers infiltration of immune cells in six classes (CD4+ T, CD8+ T, B, neutrophils, dendritic cells (DCs), and macrophages). It was employed not only for discerning the differential expression of CKS2 between tumor and non-tumor tissues in different cancer types, but also for evaluating the correlation between the CKS2 expression and the level of multiple immune cell infiltration in HCC. Moreover, genetic markers, such as TAMs, DCs, neutrophils, Th1 and Th2 cells, Tregs, B cells, NK cells, and exhaustion of T cells, for infiltration of immune cells in HCC were explored.
Online Single Cell Sequencing Database
By combining 10xGenomics with SMART-seq2 single cell RNA sequencing techniques, Zhang et al characterized the immune cells in multiple tissues of patients with liver cancer, assessed the characteristics of dynamic migration and state transformation of immune cells, and explored their potential value in the treatment of liver cancer. The current study examined the proportions of various CD8+ T cell subtypes as well as the expression of CKS2 in proliferative and exhausted CD8+ T cells, both in HCC and surrounding tissues in this database (http://cancer-pku.cn:3838/HCC).32
TIP server
Tracking tumor immunophenotype (TIP), when used as a server, can be used to track, analyze, and visualize the cancer-immunity cycle with seven steps and infiltration of immune cells by systematically integrating two existing third-party methods “CIBERSORT” and “ssGSEA”.33 The cancer-immunity cycle mirrors anticancer immune responses and consists of seven steps: releasing antigens of cancer cells (Step 1), presenting cancer antigens (Step 2), priming and activation (Step 3), transporting immune cells towards tumors (Step 4), infiltrating immune cells into tumors (Step 5), identifying cancer cells by T cells (Step 6), and killing cancer cells (Step 7).
Ethical Identity
The study was authorized by the Shanxi Bethune Hospital’s Medical Ethics Committee and conducted by the Declaration of Helsinki. The YXLL-2023-076 is the number for the ethical approval. This study was undertaken to experimentally validate the post-surgical tissues of 20 patients who were admitted to the Third Hospital of Shanxi Medical University from March 2023 to June 2023, excluded preoperative chemoradiotherapy, and underwent surgery for HCC that had been pathologically confirmed. Written informed consent was obtained from all patients participating in the study.
Quantitative Real‑time Polymerase Chain Reaction (qRT‑PCR)
In surgically removed cancer specimens and associated paracancerous tissues from 20 HCC patients, QRT-PCR was utilized to identify the CKS2 expression. Using the TRIzol reagent, total RNA was isolated from tissues (Invitrogen, Germany). Using reverse transcriptase and oligodeoxyribonuclease, whole RNA was used to amp up first-strand cDNA (Invitrogen, USA). Using the ABI Prism 7000 from Applied Biosystems, USA, a fully automated qRT-PCR was conducted. Sangon developed and produced primers (Shanghai, China). The 2−ΔΔCt method was used to calculate the relative gene expression levels. The primer sequences were as follows:
CKS2, F: 5′-ACGAGTACCGGCATGTTATGTTACC-3′,
R: 5′-TCCTCCACTCCTCTTCAGACATCAG-3′;
GAPDH, F: 5′-CAGGAGGCATTGCTGATGAT-3′, R: 5′-GAAGGCTGGGGCTCATTT-3′.
Western Blot Analysis
From a total of 20 pairs of patient tissues that had been collected, five pairs of tumor and paraneoplastic tissues were chosen, and total protein was extracted using radioimmunoprecipitation assay lysis buffer (Sangon, Shanghai, China), and the protein quality was assessed using the bicinchoninic acid method.
Poly(vinylidene fluoride) membranes were used to transfer the proteins that had been separated on 15% sodium dodecyl-sulfate polyacrylamide gel electrophoresis (SDS-PAGE) gels. A rapid closure solution was used to seal the membranes before primary and secondary antibodies were added. Protein bands were identified using electrochemical luminescence solution and anti-CKS2 antibody (ab155078, 1:1000) from Abcam and anti-beta-Actin antibody (GB15003, 1:2000) from Servicebio. Using Image Lab software, the expression of the relevant proteins was examined.
Statistical Analysis
The CKS2 expression in the HCCDB database was analyzed through functional t-tests. The Survival Analysis module of Expression Analysis in GEPIA2 was adopted to compare cancer patient survival in different groups. This was followed by the calculation of hazard ratios and log-rank P values. The Methylation Box Plot module in Methylation DIY in the Shiny Methylation Analysis Resource Tool (SMART) dataset was used to evaluate the difference in methylation levels of two methylation sites in the CKS2 gene between cancer and normal tissues. The correlation (gene-level) module assessed the correlations of the CKS2 expression with methylation levels of the above two sites, and the Survival module was used to evaluate the correlation between the two sites and prognosis. Spearman correlation analysis was conducted to estimate the correlation between CKS2 and immune infiltrating cells. The correlations between this gene and co-expression genes, immune markers, immune regulators, and immune circulation were assessed via Pearson correlation analysis. The absolute value of correlation strength was graded as weak (0.00 < r ≤0.30), medium (0.30 < r ≤ 0.60), strong (0.60 < r ≤ 0.80), and extremely strong (0.80 < r ≤ 1.00). Double-tail P < 0.05 is regarded as indicative of statistical significance. QRT-PCR and Western blot analysis were performed using the ggplot2 package in R software and GraphPad Prism software respectively. Statistical methods used to analyze differences in mRNA and protein expression are the t-test and paired t-test, respectively.
Results
The CKS2 Expression in Various Human Cancers and in-Depth Verification in HCC
TIMER was used to demonstrate the results. The results showed that the mRNA expression level of CKS2 in LIHC, urothelial carcinoma of bladder, invasive breast carcinoma, squamous cell carcinoma of cervix, lung adenocarcinoma, cholangiocarcinoma, endocervical adenocarcinoma, colon adenocarcinoma, glioblastoma multiforme, esophageal carcinoma, squamous cell carcinoma of head and neck, and stomach adenocarcinoma was significantly higher than that in corresponding normal tissues (Figure 1A). Then the HCCDB database was applied to assess the levels of expression reported by previous HCC studies from TCGA. Ten out of twelve datasets confirmed that CKS2 has a significantly higher mRNA expression level in HCC tissues compared with corresponding normal tissue (Figure 1B).
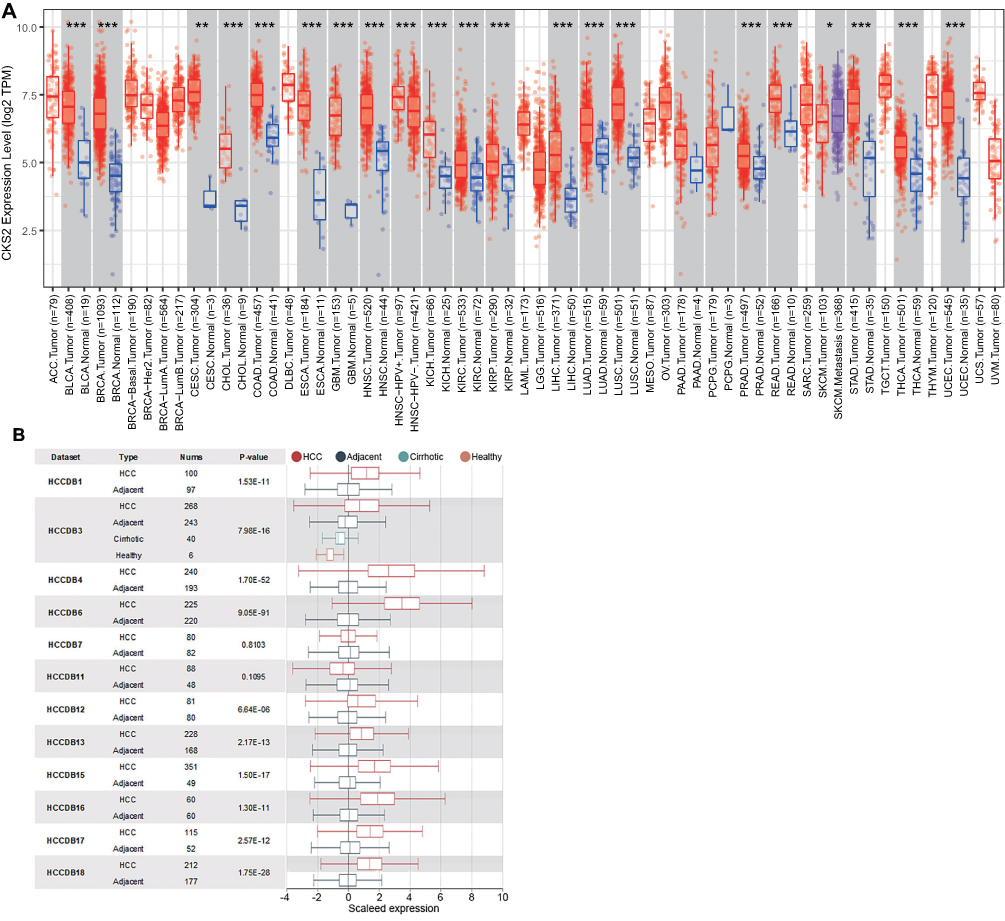 |
Figure 1 Expression of CKS2 in pancarcinoma and HCC. (A) The expression level of CKS2 in different tumor types was analyzed using TIMER database based on TCGA database. Statistical significance was indicated by *P< 0.05, **P< 0.01 and ***P< 0.001. (B) CKS2 expression in HCC and non-cancerous paracancerous tissues in the HCCDB. |
The CKS2 Expression in Subgroups Based on Different Pathological Stages and Grades in Patients with HCC
Stratified by pathological grades and AJCC stages, the research studied various CKS2 levels of expressions in HCC. In accordance with different stages of individual cancers and pathological grades, the results proved a higher CKS2 expression in HCC tissues in contrast to normal tissues. First, the over-expression of CKS2 was correlated with pathological grades (Figure 2A). Besides, the CKS2 expression in Stages 1, 2, and 3 increased significantly than in normal tissues, but it decreased in Stage 4, and there was no significant difference compared with normal tissue specimens (Figure 2B). We considered that the central necrosis in the advanced stage of the tumor leads to the decrease of the CKS2 expression. Therefore, the results indicated that the CKS2 expression plays an important role in the occurrence and progression of HCC.
 |
Figure 2 Expression of CKS2 in HCC patients with different pathological grades and stages. (A) CKS2 expression in normal tissues and HCC tissues of varying grades. (B) CKS2 expression in normal tissues and different stages of HCC tissues. *** P<0.001 showed statistical significance. |
The CKS2 Expression is Survival-Associated
LIHC data from TCGA in the GEPIA database were used to determine the associations of the CKS2 expression with survival outcomes. In liver hepatocellular carcinoma (LIHC), the group with high expression of CKS2 has significantly shorter DFS and OS than the group with low CKS2 expression (Figure 3A and B). Hence, the high expression of CKS2 is inferred as a risk factor contributing to the unfavorable prognosis of HCC patients.
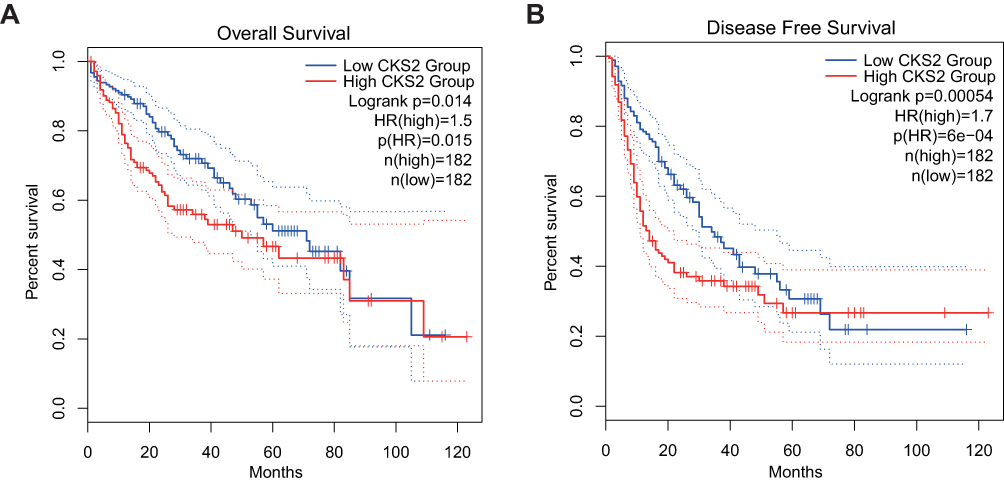 |
Figure 3 The value of CKS2 expression for prognosis in HCC. (A) Overall survival (OS) and (B) disease-free survival (DFS) from the TCGA database for the LIHC. |
The Difference in the Methylation Levels of Methylation Sites in CKS2 in HCC and Its Relationship with the mRNA Expression and Prognostic Value
Compared with normal tissues, the methylation level of gene methylation sites in cancer tissues is significantly abnormal, which is not only related to gene expression, but also related to tumor prognosis.34–36 So we used SMART dataset to study the LIHC samples from TCGA. The results revealed significantly different methylation levels of five CpG sites, cg14307853 is hypermethylated, whereas cg13651859, cg24622726, cg00292435, and cg00922328 are hypomethylated in CKS2 in HCC when compared with normal tissues (Figure 4A and Supplementary Figure 1). However, only the methylation levels of cg14307853 and cg13651859 had statistically negative correlations with mRNA level of expression of this gene (Figure 4B and Supplementary Figure 2). Moreover, the research also explored the prognostic values of the two CpG sites and demonstrated their significant correlations with the prognosis of HCC patients. (Figure 4C). High CKS2 expression is a related factor that is detrimental to the prognosis of liver cancer, as we have previously demonstrated (Figure 3A and B). In light of this, the results indicated that cg14307853, which is negatively correlated with CKS2 expression and has a high methylation level in HCC, has a better prognosis in its high group, whereas cg13651859, which is also negatively correlated with CKS2 expression and has a low methylation level in HCC, has a poor prognosis in its high group in HCC, which is consistent with prior expectations.
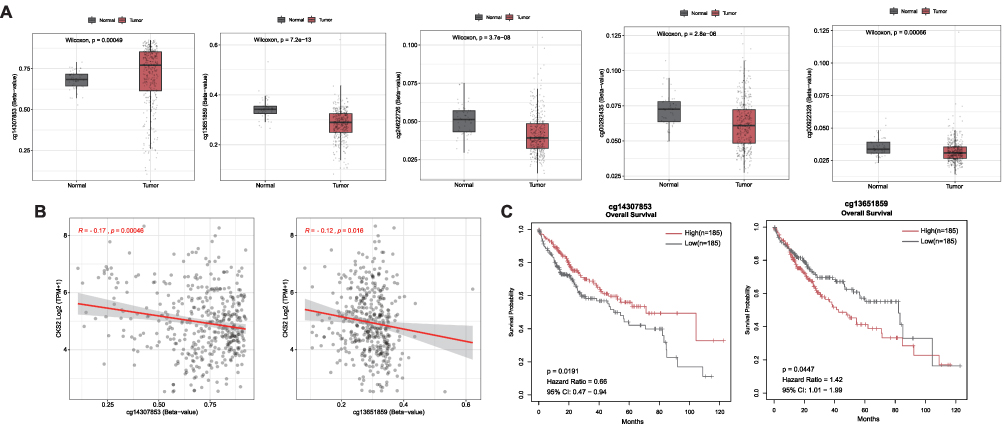 |
Figure 4 Methylation of CKS2 in HCC. (A) Expression of CKS2 gene methylation at different CpG sites in normal and tumor tissues. (B) Correlation between CKS2 expression and methylation levels at different CpG sites. (C) Prognostic values of cg14307853 and cg13651859 in CKS2 in HCC (The “high” and “low” groups of methylation sites were obtained from the cut-off values of 50% of the methylation levels of methylation sites in the CKS2 of HCC patients. The survival module in the SMART web for analyzing DNA methylation in the TCGA database is used to analyze their correlation with patient survival). |
Functional Annotations
The LinkedOmics database was adopted for analyzing genes co-expressed with CKS2 in the LIHC cohort of TCGA. The heat map displays the top 50 genes having significant associations with CKS2 (Figure 5A), followed by extraction of all co-expressed genes (P < 0.05) for KEGG and GO analysis. Meaningful GO of BPs, CCs, and MFs was demonstrated. The results showed that significant CCs, BPs, and MFs represented positive regulation of peroxisome, G1/S phase transition of cell cycle, and DNA-binding transcription activator activity, respectively (Figure 5B). KEGG analysis provided key pathways for the above genes: ribosome, complement and coagulation cascades, DNA replication, fatty acid degradation, beta-alanine metabolism, and cell cycle (Figure 5C).
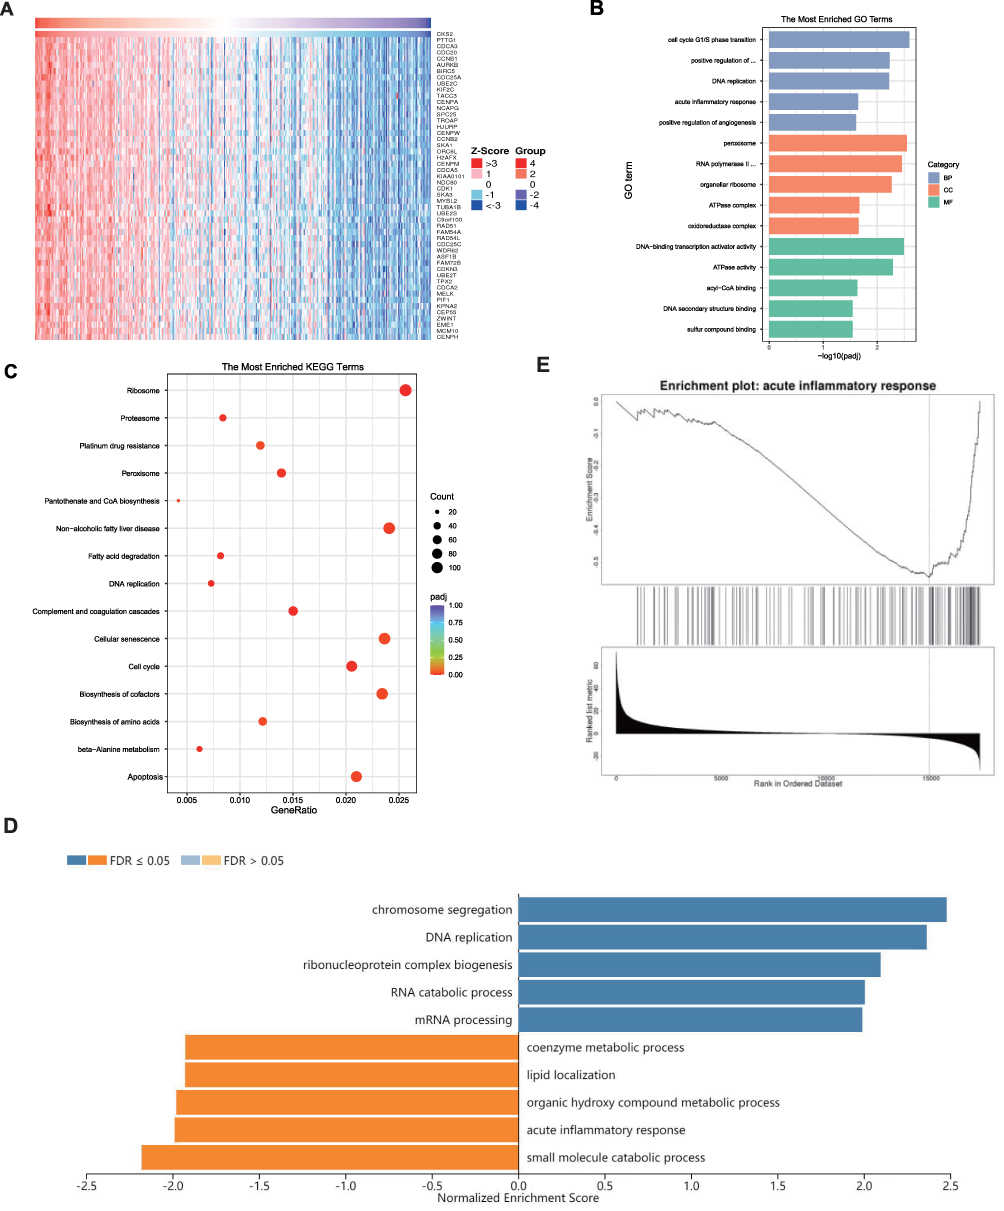 |
Figure 5 Functional annotations. (A) Heatmap shows the top 50 genes that are positively associated with CKS2. Enrichment studies of (B) GO and (C) KEGG for genes associated with CKS2. CC – cellular component; BP – biological process; MF – molecular function; (D) Enriched GO annotations of CKS2 in LIHC from the TCGA database by GSEA. (E) Enrichment of negatively associated genes in the pathway for the acute inflammatory response. |
For further investigating enrichment pathways and the significance of CKS2 in the biological process of HCC, the GSEA database was applied in the analysis of co-expressed genes. Results showed the main involvement of CKS2 in DNA replication and chromosome segregation, but acute inflammatory reaction and small molecule catabolic process was inhibited (Figure 5D and E). These results suggest that CKS2 is not only involved in tumor progression, but also in the process of inhibiting inflammation and regulating immune response.
Correlation of CKS2 and the Level of Immune Cell Infiltration
The TIMER database was applied to explore the correlation between the mRNA expression level of CKS2 and infiltrating immune cells in HCC. Results confirmed the significant association between the high CKS2 expression and infiltration of most immune cells. As shown in (Figure 6A), the CKS2 expression was positively correlated with infiltration levels of B cells (r = 0.419, P = 5.09×10⁻¹⁶), CD8+T cells (r = 0.33, P = 3.76 × 10⁻¹⁰), macrophages (r = 0.364, P = 3.86×10⁻¹²), and DCs (r = 0.401, P = 1.41×10⁻¹⁴). Therefore, it is conceivable that CKS2 plays an important part in infiltrating diverse immune cells, such as CD8+ T and B cells, DCs, macrophages, and so on.
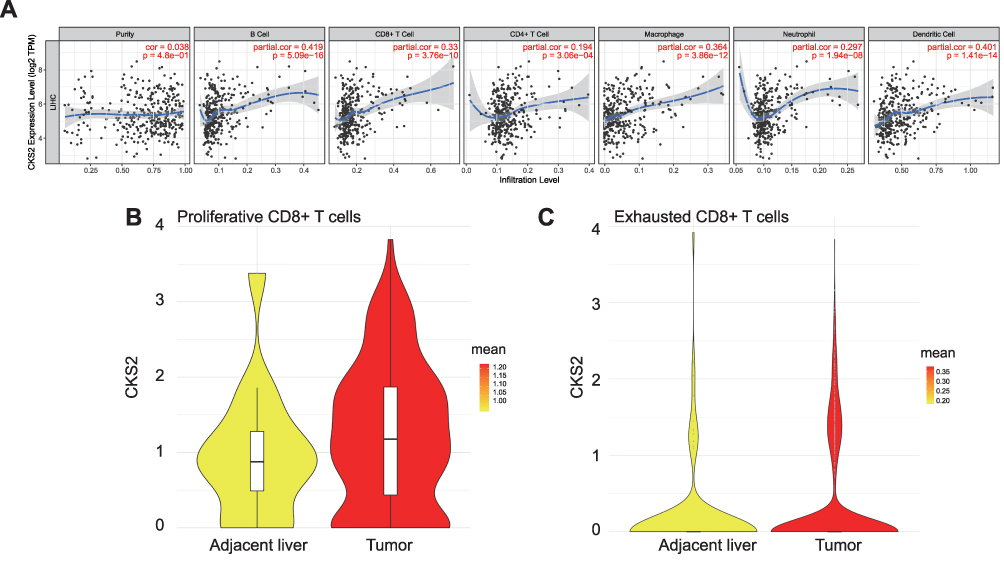 |
Figure 6 CKS2 is correlated with immune cell infiltration levels. (A) The positive correlation between CKS2 expression and infiltrating levels of (B) cells, CD8+ T cells, CD 4+ T cells, and macrophage cells, as evaluated by the TIMER database. The CKS2 expression in (B) proliferative CD8+ T cells and (C) exhausted CD8+ T cells. |
CD8+T cells showed a significant correlation with CKS2 among all immune cells related to CKS2. In addition, in a subsequent immunomarker correlation analysis, we confirmed that immunomarkers of exhausted T cells were more strongly associated with CKS2 than other immune cell markers (Table 1). Currently, cancer immunotherapy using CD8+T cell immune checkpoint inhibitors such as anti-PD1 antibodies and anti-CTLA4 antibodies has produced some curative results.37 Therefore, we performed CD8+T cell analysis the better to understand the change of CD8+T cells and explore the therapeutic potential closer to the clinic in immunotherapy in HCC. Proportions of different CD8+T cells in the Single-cell Sequencing Database were studied. Previous studies32 have shown that the proportions of CD8-c2-IL7R representing naive T cells, CD8-c3-CX3CR1 representing effector function T cells, CD8-c4-SELL and CD8-c5-GZMK representing effector memory T cells do not change much in tumor compared with adjacent liver in HCC, and that there is a significant decrease in CD8-c6-KLRD1 representing effector function T cells and CD8-c8-SLC4A10 representing mucosal-associated invariant T cells, while there is a significant increase in CD8-c1-MKI67 representing proliferative T cells and in CD8-c7-PDCD1 representing exhausted T cells (characterized by the lose robust effector functions, expressing multiple inhibitory receptors on the CD8+T cells surface, such as PD-1, TIM-3, CTLA-4, TIGIT, LAG3, and others)(Supplementary Figure 3). Therefore, it is logical to assume that exhausted T cells predominate among the proliferative T cells. Then, the correlation between the CKS2 expression and proliferative CD8+T cells and exhausted CD8+T cells was further studied. The CKS2 expression of proliferative CD8+T cells and exhausted CD8+T cells in tumors was found to be higher compared with corresponding normal tissues, which was consistent with that of tumor cells (Figure 6B and C).
 |
Table 1 Correlation Analysis Between CKS2 and Related Immune Markers |
The Correlation Between the CKS2 Expression and Immune Markers
The study further investigated how the CKS2 expression is correlated with immune markers in diverse subsets of immune cells, such as monocytes, TAMs, neutrophils, M1 and M2 macrophages, DCs, NK cells, B cells, and T cells with different functions (exhausted T cells, Tregs, Th1, and Th2). We adjusted the correlation with tumor purity and found that the CKS2 expression level was significantly correlated with multiple immune markers of various immune cells in HCC (Table 1). What is noteworthy is that the CKS2 expression was moderately correlated with most immune markers of monocytes, M2 macrophages, and TAMS. However, the CKS2 expression had no significant correlation with markers of M1 macrophages. The above results indicated a probability of involvement of CKS2 in regulating macrophage polarization in HCC.
What interested us most was the CKS2 expression being positively correlated with DC marker ITGAX (CD11C). It was confirmed that the infiltration of DC was enhanced by the high expression of CKS2. In addition, the CKS2 expression also had positive correlations with gene markers of Tregs, Th1, and Th2. However, the CKS2 expression and gene markers of NK cells were not significantly correlated. The results suggested positive correlations of the CKS2 expression with expression of PDL-1, LAG3, GZMB, PD-1, TIM-3, and CTLA4 of exhausted T cells. Hence, the above results further revealed the correlations of high CKS2 expression with infiltration of diverse immune cells, suggesting that it exerted a significant immunosuppressive effect.
Correlation Between the CKS2 Expression Level and Immunomodulators
We found that CKS2 had positive correlations with numerous immunomodulators (Figure 7). The group of high CKS2 expression had positive correlations with the expression of all receptors and MHC molecules. In addition, the group of high CKS2 expression showed positive correlations with most chemokines and immunostimulatory factors, especially XCL1, CCL26, CD276, and MICB. These immunomodulators were directly or indirectly involved in tumor progression. The results indicate that CKS2 may regulate the tumor immune environment through immunomodulators.
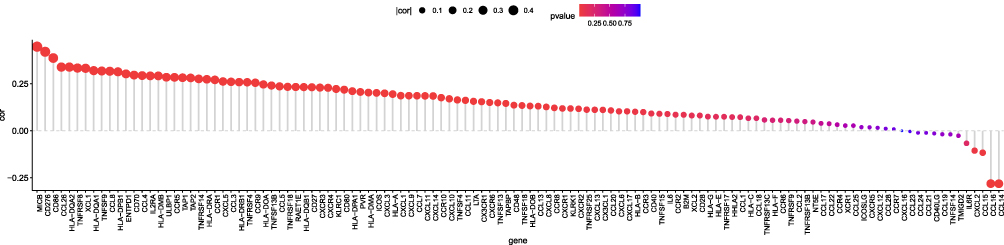 |
Figure 7 Correlation of CKS2 expression level with immunomodulators. |
Correlations Between the CKS2 Expression Level and Immune Cycle Steps and Characteristic Genes
We used the TIP online server to determine the correlation between the activity of some steps in the immune cycle and the CKS2 expression. Groups of high and low gene expression exhibited significant differences in activities in Steps 1, 5, and 6. Besides, the two groups also showed significant differences in activities of CD8, Th1, and MDSC cell recruitment in Step 4. The high expression of CKS2 had positive correlations with Steps 1 and 4 (recruiting CD8 T, MDSC, and Th1 cells), and the activities in these steps in the immunity cycle increased. However, it was negatively correlated with Steps 5 and 6, and the activities of these two immunity cycle steps decreased (Figure 8A). Furthermore, we verified that the characteristic genes in Step 6, including immune checkpoint PDL1 (CD274), PD1 (PDCD1), and CTLA4, had positive correlations with high CKS2 expression (Figure 8B). However, a high level of expressions of immune-checkpoint genes means that the immune activity is suppressed, so the activity of Step 6 is reduced, agreeing with the results of previous research.
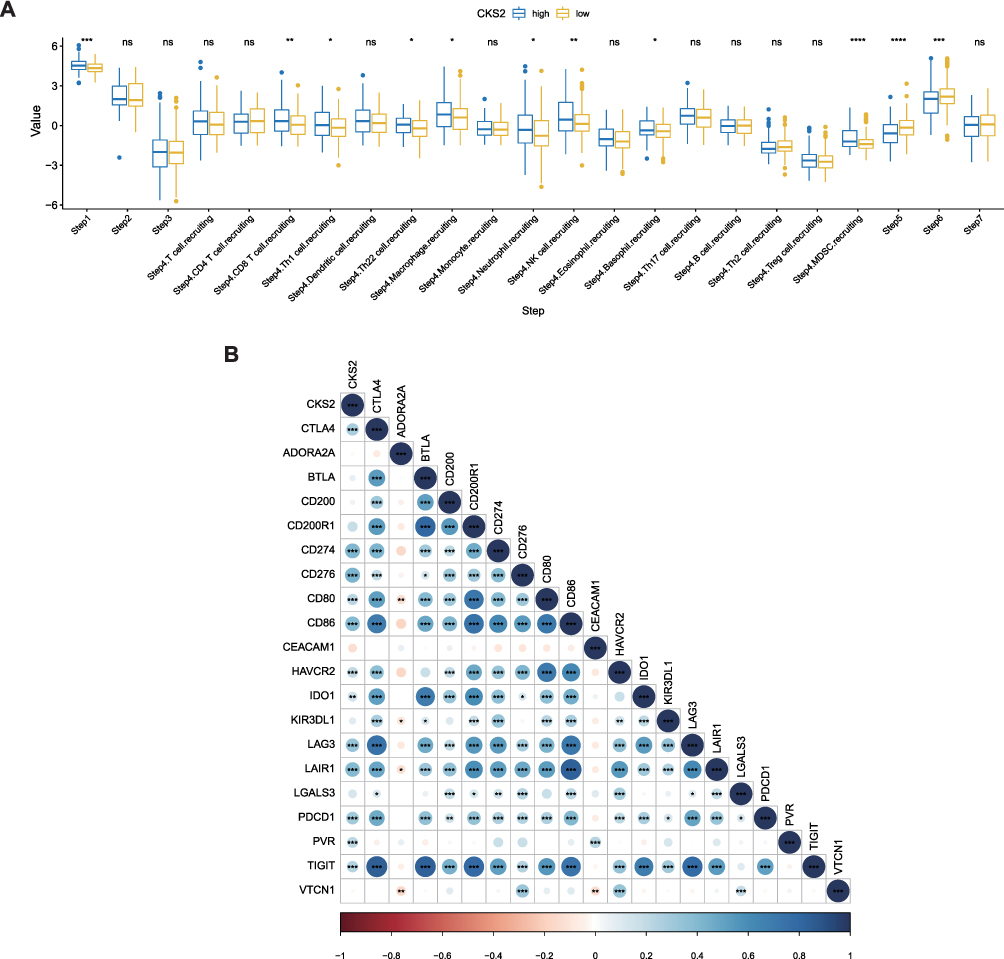 |
Figure 8 CKS2 suppress immune activity in HCC. (A) Correlation between CKS2 expression and seven steps of immune cycle. (B) Correlation of CKS2 with inhibitory characteristic immune checkpoints. PDL1 (CD274), PD1 (PDCD1).The values and color show the Pearson correlation coefficient. Asterisks displayed using the Pearson test algorithm represent the magnitude of a statistically significant P-value (*P < 0.05; **P < 0.01; ***P < 0.001; ****P < 0.0001). |
Validation of the CKS2 Expression in HCC
Variations of the CKS2 expression in tissue samples from 20 HCC patients were discovered using qRT-PCR (Figure 9A). The mRNA expression level of CKS2 in HCC is substantially higher than that of normal tissues, and the difference is statistically significant. Western blot experiment was used to examine the expression of CKS2 in five HCC patient samples (Figure 9B). It demonstrates that CKS2 protein expression is substantially higher in HCC than in paratumor tissues, and this difference is statistically significant (Figure 9C) (*P < 0.05; **P < 0.01; ***P < 0.001).
 |
Figure 9 CKS2 expression in paracancerous tissues and tumor tissues as detected by qRT-PCR and Western blot. (A) qRT-PCR analysis of the expression of the CKS2 protein in paracancerous tissues and tumor tissues in HCC. (B) Western blot pictures showing HCC tumor tissue and paracancerous tissue expressing the CKS2 protein. (C) Western blot analysis of the expression of the CKS2 protein in tumor and paracancerous tissue in HCC. (*P < 0.05; ***P < 0.001). |
Discussion
Despite recent advancements in HCC intervention and treatment, particularly the use of immune checkpoint inhibitors, the prognosis for HCC is dismal due to its low immune response rate.14,38 Numerous academics are now interested in researching new prognostic indicators related to the development of HCC and its control mechanism with the tumor immune microenvironment.
Recent research has demonstrated that the oncogene SMYD5, which promotes the proliferation, migration, and invasion of HCC cells, is highly expressed in HCC by promoter hypomethylation. High levels of SMYD5 expression are associated with a poorer prognosis and may serve as a biomarker for the treatment of HCC.39 Similarly, ELOVL1, which is associated with a poor prognosis in HCC, has been found to be resistant to immunotherapy despite its high expression and involvement in immune cell infiltration and the regulation of the immunological markers PD-1 and CTLA4.40 Additionally, a systematic review indicated that NRP1 is a potentially useful biomarker for HCC, and that its overexpression is significantly related to both disease development and lower survival rates, as well as an elevated risk of vascular invasion and metastasis.41 Flavia et al verified the substantial link between the high expression of FOXO3 and the risk of invasion as a novel biomarker in HCC, as well as its diagnostic and prognostic utility in another review encompassing 1059 HCC cases.42 In an HCC investigation, researchers also developed an immune-related model made up of 11 genes, which can both identify prognostic stratification and offer a fresh viewpoint for the search for immunotherapeutic medicines.43 Our attention has also been drawn to the fact that more HCC investigations have verified the carcinogenic impact of a few tumor-related genes associated with prognosis.
CKS2 has been extensively studied as a tumor-related prognostic factor in different malignancies. According to a study published in epithelial ovarian cancer, CKS2 can both accelerate the growth and spread of tumors and serve as a standalone indicator of a poor prognosis.44 In another study based on bioinformatics analysis and immunohistochemistry, CKS2 was shown to be overexpressed in lower-grade glioma as a biomarker of prognosis, and it was primarily responsible for controlling the cell cycle to advance tumor growth. Additionally, this work shows that hypomethylated DNA may be related to the high expression of CKS2.24 Additionally, CKS2, a major prognostic gene for adrenocortical carcinoma, may aid in risk stratification in a study based on transcriptome level, and analysis reveals a negative correlation between CKS2 and CD8+T cell infiltration.20 Another study involving lung adenocarcinoma revealed that patients with high CKS2 expression levels had low overall survival rates and that CKS2 deletion therapy could reduce the capacity of the tumor cell for malignancy. This study also showed a negative correlation between immune cell infiltration and CKS2 expression.21 In conclusion, CKS2 can be a reliable prognostic indicator for many malignancies because it is an oncogene in many tumors that can not only promote tumor progression but also have a correlation with the immune microenvironment; however, research into the specific biological mechanism of HCC remains insufficient. In this work, we examined the gene and showed how its expression and prognosis were correlated, as well as how it related to the control of the immune microenvironment.
We demonstrated that CKS2 is overexpressed in different types of cancers. High expression of CKS2 in HCC was found to have associations with the poor prognosis, which was confirmed by the liver cancer cohort in TCGA. With the increase of tumor grade and stage, its expression increased progressively, indicating its role in facilitating the progression of HCC. Additionally, the CKS2 expression had negative correlations with methylation levels of cg14307853 and cg13651859 in CKS2, which were correlated with prognosis, but in the opposite way. This is sufficient evidence that the high expression of CKS2 in HCC may be subject to epigenetic regulation, similar to its function in low-grade gliomas,24 and that it may not only be a marker associated with the prognosis of HCC, but may promote the progression of HCC.
To explore the signaling events that control abnormal expression of CKS2, we analyzed the co-expression network of CKS2. Our functional enrichment analyses showed that CKS2 was mainly involved in chromosome segregation, DNA replication, and G1/S phase transition of the cell cycle; however, it inhibited the small-molecule catabolic process and acute inflammatory responses. The above results are completely consistent with the molecular pathway in the occurrence and development of HCC. Therefore, it is inferred that CKS2 is a potential therapeutic target for HCC, and CKS2 participates in regulating immune responses to HCC.
For this reason, we explored immune correlation analysis, and one of the significant findings implied that the mRNA expression of CKS2 was correlated with immune infiltration and diverse immune markers. As in adrenocortical carcinoma and lung adenocarcinoma, CKS2 was also associated with immune infiltration in HCC.20,21 The CKS2 expression had positive correlations with infiltration of B cells, CD8+T cells, DCs, and macrophages in the immune microenvironment of HCC. Since infiltration of CD8+T cells is an important indicator for immunotherapy responses and prognosis of tumors, we further confirmed that infiltration of CD8+T cells in HCC mainly occurred in exhausted CD8+T cells. In addition, exhausted CD8+T cells in tumors also showed a higher CKS2 expression than normal tissues, which was consistent with that of tumor cells. The immune cells were characterized by using the immune markers studied here. In our study, correlations of the CKS2 expression with immune markers suggested that CKS2 has a key function in tumor immunoregulation of HCC. Firstly, there was no significant correlation between the immune markers NOS2 and ROS of M1 macrophages and the expression of CKS2, but the immune markers M2 macrophages (VSIG4 and CSF1R) were correlated with the expression of this gene. The results showed that CKS2 also had the potential to polarize TAMS, which could promote the development of HCC by immunosuppression.45 Furthermore, we confirmed that this gene is correlated with CCR8, TGFB1, PD-1, TIM-3, CTLA4, and other markers, revealing that it may lead to the immunosuppressive effect of HCC by causing T cell exhaustion. Moreover, we confirmed the existence of a significant correlation of expression of this gene with various markers of Th1, Th2, and DC, suggesting that CKS2 leads to DC infiltration, which partly leads to immune defense dysfunction.46 In summary, the regulation of immune cells in HCC by CKS2, as similar to the function of SSRP1 in HCC in a previous study,47 may be involved in the recruitment and regulation of immune-infiltrating cells in the immune microenvironment, resulting in immune escape of HCC.
Information on 120 immunomodulators was collected from Charoenton et al, including receptors, MHC, immune stimulators, and chemokines.48 These immunomodulators are not only directly involved in tumor progression, but also in their important biological processes, including microenvironmental changes such as angiogenesis and immune cell infiltration.49–51 The results of this study confirmed that CKS2 was positively correlated with most immunomodulators. First, the group with high CKS2 expression showed positive correlations with the expression of all MHC molecules, suggesting that its antigen presentation and processing ability was improved. Additionally, the group with high CKS2 expression was found to have positive correlations with all receptors and most of the chemokines and immunostimulatory factors. These receptors, immunostimulatory factors, and chemokines promoted immune cells to proliferate and to be recruited. These results indicate that CKS2 may regulate immune cell infiltration by increasing the expression of immunomodulators, which leads to the change in the immune microenvironment of HCC and participates in the progression of HCC.
The typical activity in the cancer immunity cycle was shown by the direct comprehensive performance of functions of immunomodulators.52 Correlations of the difference in CKS2 gene expression with the seven steps of the immune cycle were expounded. In the high-CKS2 group, the activities in Step 1 and part of Step 4 were up-regulated, while that in Step 5 was down-regulated. Changes in the activity of these steps may affect the proportion, or the level of infiltration, of immune cells in TME. It is interesting that activities in Step 6 in the high-CKS2 group were down-regulated, which is probably because of the high expression of immune-checkpoint genes PD1 (PDCD1), PDL1 (CD274), and CTLA4. Eventually, the ability of immune cells to kill cancer cells decreases.
High expression of CKS2 accelerated immune cell infiltration into the HCC tissue, which may induce immune responses to exert antitumor effects. Meanwhile, in response to TILs-induced immune attack, tumor cells may up-regulate the level of expressions of immune-checkpoint genes, which aim to suppress T cell activity leading to immune escape, dubbed as acquired immune resistance.53 The acquired immune resistance process agrees with the results of previous research: high expression of CKS2 has positive correlations with immune-checkpoint genes.
A stronger response to ICIs therapy is predicted by immune cell infiltration, particularly large numbers of CD8+T cells, in tumors, according to earlier research.54 To develop new treatment options and enhance the effectiveness of immunotherapy, a thorough analysis of the immune infiltration landscape associated with CKS2 can serve as a foundation for future research into the potential mechanism of the interaction between liver cancer cells and the immune microenvironment. Our study shows that the pro-carcinogenic role of CKS2 in HCC and its potential mechanism of its high expression and recruitment of immune cells and induction of immune escape contribute to a poor prognosis. Given its function in the development of HCC, CKS2 may provide a promising target for the anti-tumor therapy of HCC. Therefore, CKS2 may be used as a therapeutic target in HCC to lessen or eliminate the tumor-promoting effect, enhance immune escape, reactivate immune function, and improve prognosis. CKS2 may also be used to assess the degree of immune cell infiltration in HCC and predict the response to immunotherapy, allowing for the accurate screening of patients who will benefit from immunotherapy.
Conclusion
The research findings showed correlations of the CKS2 expression with poor outcomes among HCC patients. A series of immunoassays related to CKS2 further revealed its relationship with the immune microenvironment, which provided new perspectives for the future study of immunotherapy. CKS2 may serve as a new marker for forecasting immunotherapy responses and prognosis, thus more effectively screening patients who might benefit from immunotherapy.
Abbreviations
CKS2, Cyclin-dependent kinase regulatory subunit 2; HCC, Hepatocellular carcinoma; TAM, Tumor associated macrophages.
Acknowledgments
The results shown here are in whole based upon data generated by the TCGA Research Network: https://www.cancer.gov/tcga. The databases accessed for this study all comply with relevant data protection and privacy legislation.
Author Contributions
All authors made a significant contribution to the work reported, whether that is in the conception, study design, execution, acquisition of data, analysis and interpretation, or in all these areas; took part in drafting, revising or critically reviewing the article; gave final approval of the version to be published; have agreed on the journal to which the article has been submitted; and agree to be accountable for all aspects of the work.
Funding
This study was funded by Shanxi Province“136 Revitalization Medical Project Construction Funds” (No: 2019XY014).
Disclosure
The authors report no conflicts of interest in this work.
References
1. Forner A, Reig M, Bruix J. Hepatocellular carcinoma. Lancet. 2018;391(10127):1301–1314. doi:10.1016/S0140-6736(18)30010-2
2. Sung H, Ferlay J, Siegel RL, et al. Global cancer statistics 2020: GLOBOCAN estimates of incidence and mortality worldwide for 36 cancers in 185 countries. CA Cancer J Clin. 2021;71(3):209–249. doi:10.3322/caac.21660
3. Siegel RL, Miller KD, Jemal A. Cancer statistics, 2020. CA Cancer J Clin. 2020;70(1):7–30. doi:10.3322/caac.21590
4. Villanueva A. Hepatocellular Carcinoma. N Engl J Med. 2019;380(15):1450–1462. doi:10.1056/NEJMra1713263
5. Reig M, Forner A, Rimola J, et al. BCLC strategy for prognosis prediction and treatment recommendation: the 2022 update. J Hepatol. 2022;76(3):681–693. doi:10.1016/j.jhep.2021.11.018
6. Seong J. Challenge and hope in radiotherapy of hepatocellular carcinoma. Yonsei Med J. 2009;50(5):601–612. doi:10.3349/ymj.2009.50.5.601
7. Zheng Z, Liang W, Wang D, et al. Adjuvant chemotherapy for patients with primary hepatocellular carcinoma: a meta-analysis. Int J Cancer. 2015;136(6):E751–E759. doi:10.1002/ijc.29203
8. Marin J, Cives-Losada C, Asensio M, Lozano E, Briz O, Macias R. Mechanisms of anticancer drug resistance in hepatoblastoma. Cancers. 2019;11(3):407. doi:10.3390/cancers11030407
9. Cerrito L, Ponziani FR, Garcovich M, et al. Regorafenib: a promising treatment for hepatocellular carcinoma. Expert Opin Pharmacother. 2018;19(17):1941–1948. doi:10.1080/14656566.2018.1534956
10. Ikeda M, Kobayashi M, Tahara M, Kaneko S. Optimal management of patients with hepatocellular carcinoma treated with lenvatinib. Expert Opin Drug Saf. 2018;17(11):1095–1105. doi:10.1080/14740338.2018.1530212
11. Killock D. Nivolumab keeps HCC in check and opens avenues for checkmate. Nat Rev Clin Oncol. 2017;14(7):392. doi:10.1038/nrclinonc.2017.70
12. Shi Y, Men X, Li X, Yang Z, Wen H. Research progress and clinical prospect of immunocytotherapy for the treatment of hepatocellular carcinoma. Int Immunopharmacol. 2020;82:106351. doi:10.1016/j.intimp.2020.106351
13. Llovet JM, Castet F, Heikenwalder M, et al. Immunotherapies for hepatocellular carcinoma. Nat Rev Clin Oncol. 2021;19(3):151–172. doi:10.1038/s41571-021-00573-2
14. Ribas A, Wolchok JD. Cancer immunotherapy using checkpoint blockade. Science. 2018;359:1350–1355. doi:10.1126/science.aar4060
15. Pines J. Cell cycle: reaching for a role for the Cks proteins. Curr Biol. 1996;6(11):1399–1402. doi:10.1016/S0960-9822(96)00741-5
16. Reynard GJ, Reynolds W, Verma R, Deshaies RJ. Cks1 is required for G(1) cyclin-cyclin-dependent kinase activity in budding yeast. Mol Cell Biol. 2000;20(16):5858–5864. doi:10.1128/MCB.20.16.5858-5864.2000
17. Yu M, Zhong M, Qiao Z. Expression and clinical significance of cyclin kinase subunit 2 in colorectal cancer. Oncol Lett. 2013;6(3):777–780. doi:10.3892/ol.2013.1456
18. Wang J, Xu L, Liu Y, et al. Expression of cyclin kinase subunit 2 in human breast cancer and its prognostic significance. Int J Clin Exp Pathol. 2014;7(12):8593–8601.
19. Shen D-Y, Zhan Y-H, Wang Q-M, Rui G, Zhang Z-M. Oncogenic potential of cyclin kinase subunit-2 in cholangiocarcinoma. Liver Int. 2013;33(1):137–148. doi:10.1111/liv.12014
20. Yang Z, Cheng H, Zhang Y, Zhou Y. Identification of NDRG family member 4 (NDRG4) and CDC28 protein kinase regulatory subunit 2 (CKS2) as key prognostic genes in adrenocortical carcinoma by transcriptomic analysis. Med Sci Monit. 2021;2021:27.
21. Wang Z, Zhang M, Wu Y, Yu Y, Zheng Q, Li J. CKS2 overexpression correlates with prognosis and immune cell infiltration in lung adenocarcinoma: a comprehensive study based on bioinformatics and experiments. J Cancer. 2021;12(23):6964–6978. doi:10.7150/jca.63625
22. Ji X, Xue Y, Wu Y, Feng F, Gao X. High-expressed CKS2 is associated with hepatocellular carcinoma cell proliferation through down-regulating PTEN. Pathol Res Pract. 2018;214(3):436–441. doi:10.1016/j.prp.2017.12.006
23. Shen D-Y, Fang Z-X, You P, et al. Clinical significance and expression of cyclin kinase subunits 1 and 2 in hepatocellular carcinoma. Liver Int. 2010;30(1):119–125. doi:10.1111/j.1478-3231.2009.02106.x
24. Hu M, Li Z, Qiu J, et al. CKS2 (CDC28 protein kinase regulatory subunit 2) is a prognostic biomarker in lower grade glioma: a study based on bioinformatic analysis and immunohistochemistry. Bioengineered. 2021;12(1):5996–6009. doi:10.1080/21655979.2021.1972197
25. Lian Q, Wang S, Zhang G, et al. HCCDB: a database of hepatocellular carcinoma expression atlas. Genomics Proteomics Bioinformatics. 2018;16(4):269–275. doi:10.1016/j.gpb.2018.07.003
26. Chandrashekar DS, Bashel B, Balasubramanya SAH, et al. UALCAN: a portal for facilitating tumor subgroup gene expression and survival analyses. Neoplasia. 2017;19(8):649–658. doi:10.1016/j.neo.2017.05.002
27. Tang Z, Li C, Kang B, Gao G, Li C, Zhang Z. GEPIA: a web server for cancer and normal gene expression profiling and interactive analyses. Nucleic Acids Res. 2017;45(W1):W98–W102. doi:10.1093/nar/gkx247
28. Li Y, Ge D, Lu C. The SMART App: an interactive web application for comprehensive DNA methylation analysis and visualization. Epigenetics Chromatin. 2019;12(1):71. doi:10.1186/s13072-019-0316-3
29. Vasaikar SV, Straub P, Wang J, Zhang B. LinkedOmics: analyzing multi-omics data within and across 32 cancer types. Nucleic Acids Res. 2018;46(D1):D956–D963. doi:10.1093/nar/gkx1090
30. Subramanian A, Tamayo P, Mootha VK, et al. Gene set enrichment analysis: a knowledge-based approach for interpreting genome-wide expression profiles. Proc Natl Acad Sci U S A. 2005;102(43):15545–15550. doi:10.1073/pnas.0506580102
31. Li T, Fan J, Wang B, et al. TIMER: a web server for comprehensive analysis of tumor-infiltrating immune cells. Cancer Res. 2017;77(21):e108–e110. doi:10.1158/0008-5472.CAN-17-0307
32. Zhang Q, He Y, Luo N, et al. Landscape and dynamics of single immune cells in hepatocellular carcinoma. Cell. 2019;179(4):829–845.e820. doi:10.1016/j.cell.2019.10.003
33. Xu L, Deng C, Pang B, et al. TIP: a web server for resolving tumor immunophenotype profiling. Cancer Res. 2018;78(23):6575–6580. doi:10.1158/0008-5472.CAN-18-0689
34. Kulis M, Esteller M. DNA methylation and cancer. Adv Genet. 2010;70:27–56.
35. Paredes J, Albergaria A, Oliveira JOT, Jerónimo C, Milanezi F, Schmitt FC. P-cadherin overexpression is an indicator of clinical outcome in invasive breast carcinomas and is associated with CDH3 promoter hypomethylation. Clin Cancer Res. 2005;11(16):5869–5877. doi:10.1158/1078-0432.CCR-05-0059
36. Chen C-Y, J-J W, Lin Y-J, et al. Significance of hypermethylation of tumor-suppressor genes PTGER4 and ZNF43 at CpG sites in the prognosis of colorectal cancer. Int J Mol Sci. 2022;23:18.
37. Sangro B, Sarobe P, Hervás-Stubbs S, Melero I. Advances in immunotherapy for hepatocellular carcinoma. Nat Rev Gastroenterol Hepatol. 2021;18(8):525–543. doi:10.1038/s41575-021-00438-0
38. Forner A, Bruix J. Biomarkers for early diagnosis of hepatocellular carcinoma. Lancet Oncol. 2012;13:750–751. doi:10.1016/S1470-2045(12)70271-1
39. Chi G, Pei J, Li X, et al. SMYD5 acts as a potential biomarker for hepatocellular carcinoma. Exp Cell Res. 2022;414(2):113076. doi:10.1016/j.yexcr.2022.113076
40. Zhang Y, Pang S, Sun B, et al. ELOVLs predict distinct prognosis value and immunotherapy efficacy in patients with hepatocellular carcinoma. Front Oncol. 2022;2022:12.
41. Fernández-Palanca P, Payo-Serafín T, Fondevila F, et al. Neuropilin-1 as a potential biomarker of prognosis and invasive-related parameters in liver and colorectal cancer: a systematic review and meta-analysis of human studies. Cancers. 2022;14(14):3455. doi:10.3390/cancers14143455
42. Fondevila F, Fernández-Palanca P, Méndez-Blanco C, et al. Association of FOXO3 expression with tumor pathogenesis, prognosis and clinicopathological features in hepatocellular carcinoma: a systematic review with meta-analysis. Cancers. 2021;13(21):5349. doi:10.3390/cancers13215349
43. Tang Y, Guo C, Yang Z, Wang Y, Zhang Y, Wang D. Identification of a tumor immunological phenotype-related gene signature for predicting prognosis, immunotherapy efficacy, and drug candidates in hepatocellular carcinoma. Front Immunol. 2022;2022:13.
44. Xu JH, Wang Y, Xu D. CKS2 promotes tumor progression and metastasis and is an independent predictor of poor prognosis in epithelial ovarian cancer. Eur Rev Med Pharmacol Sci. 2019;23:3225–3234. doi:10.26355/eurrev_201904_17681
45. Yeung OWH, C-M L, Ling -C-C, et al. Alternatively activated (M2) macrophages promote tumour growth and invasiveness in hepatocellular carcinoma. J Hepatol. 2015;62(3):607–616. doi:10.1016/j.jhep.2014.10.029
46. Wirtz TH, Brandt EF, Berres M-L. Liver DCs in health and disease. Int Rev Cell Mol Biol. 2019;348:263–299.
47. Luo G, Xu J, Xia Z, et al. SSRP1 is a prognostic biomarker correlated with CD8+ T cell infiltration in hepatocellular carcinoma (HCC). Biomed Res Int. 2021;2021:1–10. doi:10.1155/2021/4014797
48. Charoentong P, Finotello F, Angelova M, et al. Pan-cancer immunogenomic analyses reveal genotype-immunophenotype relationships and predictors of response to checkpoint blockade. Cell Rep. 2017;18(1):248–262. doi:10.1016/j.celrep.2016.12.019
49. Ehling J, Tacke F. Role of chemokine pathways in hepatobiliary cancer. Cancer Lett. 2016;379(2):173–183. doi:10.1016/j.canlet.2015.06.017
50. Nagarsheth N, Wicha MS, Zou W. Chemokines in the cancer microenvironment and their relevance in cancer immunotherapy. Nat Rev Immunol. 2017;17(9):559–572. doi:10.1038/nri.2017.49
51. Lin T, Zhang E, Mai -P-P, Zhang Y-Z, Chen X, Peng L-S. CXCL2/10/12/14 are prognostic biomarkers and correlated with immune infiltration in hepatocellular carcinoma. Biosci Rep. 2021;41(6). doi:10.1042/BSR20204312
52. Chen DS, Mellman I. Oncology meets immunology: the cancer-immunity cycle. Immunity. 2013;39(1):1–10. doi:10.1016/j.immuni.2013.07.012
53. Sanmamed MF, Nie X, Desai SS, et al. A Burned-Out CD8+ T-cell subset expands in the tumor microenvironment and curbs cancer immunotherapy. Cancer Discov. 2021;11(7):1700–1715. doi:10.1158/2159-8290.CD-20-0962
54. Zhang Y, Zhang Z. The history and advances in cancer immunotherapy: understanding the characteristics of tumor-infiltrating immune cells and their therapeutic implications. Cell Mol Immunol. 2020;17:807–821. doi:10.1038/s41423-020-0488-6
 © 2023 The Author(s). This work is published and licensed by Dove Medical Press Limited. The
full terms of this license are available at https://www.dovepress.com/terms
and incorporate the Creative Commons Attribution
- Non Commercial (unported, 3.0) License.
By accessing the work you hereby accept the Terms. Non-commercial uses of the work are permitted
without any further permission from Dove Medical Press Limited, provided the work is properly
attributed. For permission for commercial use of this work, please see paragraphs 4.2 and 5 of our Terms.
© 2023 The Author(s). This work is published and licensed by Dove Medical Press Limited. The
full terms of this license are available at https://www.dovepress.com/terms
and incorporate the Creative Commons Attribution
- Non Commercial (unported, 3.0) License.
By accessing the work you hereby accept the Terms. Non-commercial uses of the work are permitted
without any further permission from Dove Medical Press Limited, provided the work is properly
attributed. For permission for commercial use of this work, please see paragraphs 4.2 and 5 of our Terms.
Recommended articles
Machine Learning-Based Sialylation-Associated Gene Signature Predicts Prognosis and Immune Landscape in Hepatocellular Carcinoma: Validation via Multi-Omics Analysis and in vitro Assays
Zheng Z, Wang Y, Zhang W, Du G, Luo B
Journal of Hepatocellular Carcinoma 2026, 13:575986
Published Date: 18 February 2026
Hydrogel-Based Immunomodulation of Tumor Immune Microenvironment in Hepatocellular Carcinoma: Current Strategies and Future Directions
Zhang S, Ding L, Hou T, Lin D, Qu Y
International Journal of Nanomedicine 2026, 21:576091
Published Date: 4 March 2026
Pleione bulbocodioides Polysaccharides Reprogram Tumor-Associated Macrophages via JAK2/STAT3 Inhibition to Suppress Hepatocellular Carcinoma
Yang Y, Zhang Y, Feng X, Gao F, Ma Y, Yang S
Journal of Hepatocellular Carcinoma 2026, 13:578276
Published Date: 27 March 2026