Back to Journals » Diabetes, Metabolic Syndrome and Obesity » Volume 16
Evaluation of Trace Elements Levels and Construction of Auxiliary Prediction Model in Patients with Diabetes Ketoacidosis in Type 1 Diabetes
Authors Chai J, Sun Z, Zhou Q, Xu J ![]()
Received 21 August 2023
Accepted for publication 22 October 2023
Published 30 October 2023 Volume 2023:16 Pages 3403—3415
DOI https://doi.org/10.2147/DMSO.S425156
Checked for plagiarism Yes
Review by Single anonymous peer review
Peer reviewer comments 2
Editor who approved publication: Dr Konstantinos Tziomalos
Jiatong Chai,1 Zeyu Sun,1 Qi Zhou,2 Jiancheng Xu1
1Department of Laboratory Medicine, First Hospital of Jilin University, Changchun, People’s Republic of China; 2Department of Pediatrics, First Hospital of Jilin University, Changchun, People’s Republic of China
Correspondence: Jiancheng Xu, Email [email protected]
Background: Trace elements play an important role in reflecting physical metabolic status, but have been rarely evaluated in diabetes ketoacidosis (DKA). Since clinical biochemical parameters are the first-line diagnostic data mastered by clinical doctors and DKA has a rapid progression, it is crucial to fully utilize clinical data and combine innovative parameters to assist in assessing disease progression. The aim of this study was to evaluate the levels of trace elements in DKA patients, followed by construction of predictive models combined with the laboratory parameters.
Methods: A total of 96 T1D individuals (48 DKA patients) were collected from the First Hospital of Jilin University. Serum calcium (Ca), magnesium (Mg), zinc (Zn), copper (Cu), iron (Fe) and selenium (Se) were measured by Inductively Coupled Plasma Mass Spectrometry, and the data of biochemical parameters were collected from the laboratory information system. Training and validation sets were used to construct the model and examine the efficiency of the model. The lambda-mu-sigma method was used to evaluate the changes in the model prediction efficiency as the severity of the patient’s condition increases.
Results: Lower levels of serum Mg, Ca and Zn, but higher levels of serum Fe, Cu and Se were found in DKA patients. Low levels of total protein (TP), Zn and high levels of lipase would be an efficient combination for the prediction of DKA (Area under curves for training set and validation set were 0.867 and 0.961, respectively). The examination test confirmed the clinical applicability of the constructed models. The increasing predictive efficiency of the model was found with NACP.
Conclusion: More severe oxidative stress in DKA led to further imbalance of trace elements. The combination of TP, lipase and Zn could predict DKA efficiently, which would benefit the early identification and prevention of DKA to improve prognosis.
Keywords: type 1 diabetes, diabetes ketoacidosis, diabetic complication, trace elements, prediction model
Introduction
Type 1 diabetes (T1D) is an endocrine disorder in which pancreatic β cells stop producing insulin, typically due to autoimmune destruction.1 This long-term autoimmune destruction will lead to insulinopenia, followed by hyperglycemia and the breakdown of insulin-dependent processes of cellular energy storage and synthesis.2,3 Accelerated glycogenolysis and lipolysis will provide substrates for ketogenesis through the breakdown of triacylglycerol from fat and the increase of circulating plasma amino acids.4,5 In addition, α-cell glucagon production will be enhanced by loss of the paracrine suppressive effect exerted by β-cells,6,7 and glucagon shifts hepatic intracellular metabolism towards production of ketones.8 These relatively strong metabolic acids will cause the accumulation of hydrogen ions, and the buffering capacity of the kidney will be quickly exceeded, resulting in the development of metabolic acidosis and the morbidity of ketoacidosis (DKA).9
Recent literatures demonstrated a plausible link between elevated levels of circulating ketones and oxidative stress.10 The condition of ketosis was known to increase extra-mitochondrial oxidation of fatty acids and generation of hydrogen peroxide, thereby increasing oxidative stress in hyperketonemic diabetic patients (HKD).11 Aggravated oxidative stress would cause more serious abnormal biochemical reactions (such as increasing lipolysis or ketone body production), which could promote the occurrence of DKA. Also, imbalances of trace elements might lead to high susceptibility to oxidative damage of tissues and eventually to the development of diabetic complications.12 Progression of diabetes and the complications might also lead to perturbation in trace elements metabolism and homeostasis.13 A previous study reported that zinc (Zn) concentrations were significantly decreased during the ketotic state.14 Copper (Cu) and iron (Fe) were reported to be related to oxidation of aminoacetone to methylglyoxal (MG) which was promoted in DKA patients.15 1.25(OH)2D3-induced Ca2+ signals (Ca2+ oscillations) could regulate insulin secretion from pancreatic β-cells.16 Hence, the significant decreasing of insulin in DKA always led to calcium (Ca) depletion.17 In addition, imbalance of magnesium (Mg) homeostasis would also be found in DKA patients due to the electrolyte disturbances.18 Selenium (Se) prevented diabetes complications by Se dependent glutathione peroxidase and other selenoproteins involved in the antioxidant system. Hence, the evaluation of trace elements would benefit further study on oxidative damage in T1D patients, and provide reference for nutrition supplements during the disease progression.
The diagnosis of DKA always depended on the examination of glucose, ketone body and blood gas analysis. However, a previous study had pointed that the precursor symptom with slight abnormal glucose levels was sometimes found in DKA, which indicated the urgent need for research on auxiliary parameters to evaluate the risk of DKA in T1D patients.3 In addition, abnormal results of glucose, ketone body or blood gas analysis have always been observed after the occurrence of T1D. Hence, if an early warning and preventive measures (such as strengthening daily nursing, improving the awareness of blood glucose control, etc.) to DKA could be performed using the common clinical parameters, the prognosis would be improved significantly. Clinical parameters were used in prediction studies to select related factors with diseases, and the calculation methods were performed to receive the best combination of predicted parameters, which was widely used in recent years and provide new reference for clinical application. The research of prediction models for diabetes always focused on kidney disease,19,20 while there were few studies on DKA with acute onset as the main manifestation. Hence, the importance of diversification for prevention and predicted methods should be emphasized due to the characteristics of acute onset and dangerous onset of DKA.
The aim of this study was to evaluate the levels of trace elements in DKA patients. A prediction model was constructed using biochemical parameters and trace elements to identify specific parameters of morbidity of DKA, which would benefit the auxiliary prediction in T1D patients. The dynamic change between numbers of abnormal clinical parameters (NACP) and prediction efficiency was evaluated to improve practical value.
Materials and Methods
Individuals
A total of 96 patients with T1D were enrolled in this study (43 males and 53 females aged 2–22 years old) from 2019 to 2020, in which 47 patients were diagnosed with DKA. Ninety-six age- and sex-matched healthy individuals were recruited as the healthy population (HP). The individuals were tested in the First Hospital of Jilin University, T1D patients were defined according to the examination of auto-antibodies and current criteria of the American Diabetes Association.21 The total research protocol is shown in Figure 1. DKA was defined as blood glucose >11 mmol/L, pH ≤7.3 or bicarbonate ≤15 mmol/L and ketonemia ≥3 mmol/L,22 and the patients were without mineral dietary supplement in last 3 months. The healthy individuals were examined by doctors to ensure they had no symptoms of any systemic diseases and unhealthy habits. Demographic data for these subjects were obtained from the patients’ medical records. The first laboratory clinical parameters results were collected in the medical record system. Written informed consent was obtained from all individuals. This was approved by the Ethics Committee of the First Hospital of Jilin University (number: 19Q046-001).
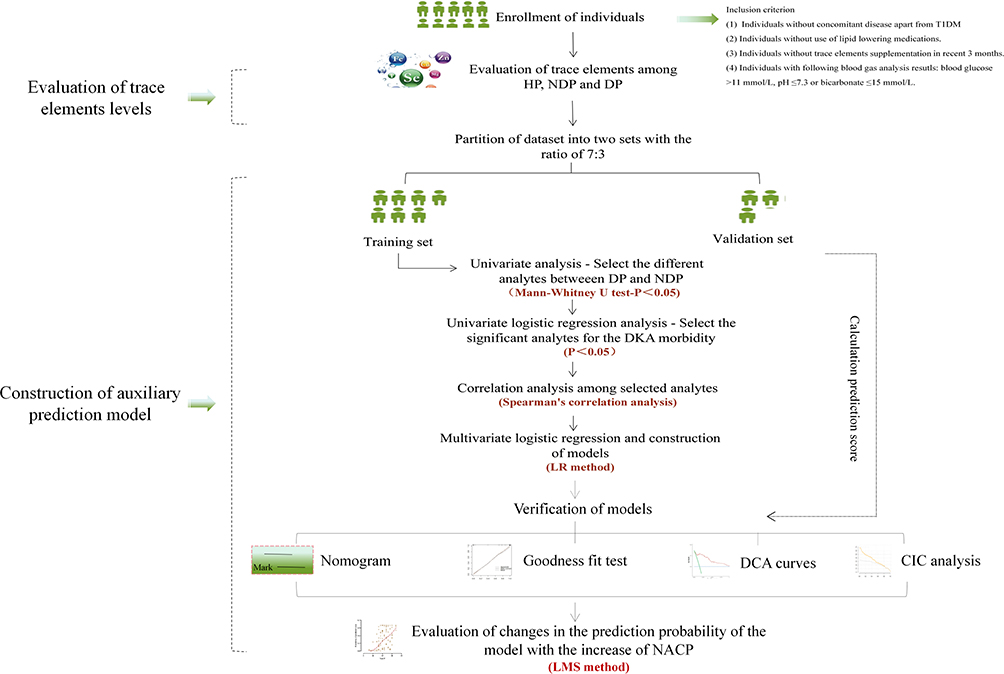 |
Figure 1 The protocol of the whole study. Abbreviations: HP, healthy population; DP, DKA population; NDP, non-DKA population; DCA, decision clinical analysis; CIC, clinical influence curve. |
Blood Sampling
Blood samples from individuals were taken in the morning after overnight fasting into special metal-free tubes for analysis of trace elements. Serum samples were isolated into metal-free Eppendorf test tubes after blood centrifugation, and stored at −80°C until further analysis. The specific procedures of samples were consistent with our previous study.23
Biochemical Analysis
The first blood sample of the patient was used to measure clinical parameters on automatic analyzer 7600–210 (Hitachi High-Technologies, Tokyo, Japan), including creatine kinase (CK), creatine kinase isoenzyme (CK-MB), prealbumin (PAB), lactate dehydrogenase (LDH), indirect bilirubin (IBil), aspartate aminotransferase (AST), alanine aminotransferase (AAT), γ-Glutamine transpeptidase (γ-GGT), cholinesterase, total protein (TP), albumin (Alb), globulin (Glb), total bilirubin (TBil), direct bilirubin (DBil), total bile acid (TBA), amylase (AMY), lipase, urea, uric acid, creatinine (Cre), retinol binding protein (RBP), cystatin C, cholesterol (CHO), triglyceride (TG), alkaline phosphatase (ALP), high density lipoprotein (HDL), apolipoprotein A (Apo A), low density lipoprotein (LDL), lipoprotein a, total iron binding force (TIBF), ferritin (SF), unsaturated iron binding force (UIBC). The reference intervals in our hospital for the above parameters were as follows: trace elements (Ca: 90.00–106.80 mg/L; Mg: 17.76–24.48 mg/L; Fe: 0.50–1.23 mg/L; Zn: 0.637–1.092 mg/L; Cu: 0.806–1.562 mg/L; Se: 0.099–0.158 mg/L); cardiac markers parameters (CK, 50.00–310.00 U/L; CK-MB, 0–25.00 U/L; LDH, 120.00–250.00 U/L); liver function parameters (AST,15.00–40.00 U/L; AAT, 9.00–50.00 U/L; γ-GGT, 10.00–60.00 U/L; ALP, 45.00–125.00 U/L; cholinesterase, 4620.00–11500.00 U/L; TP, 65.00–85.00 g/L; Glb, 20.00–40.00 g/L; Alb, 40.00–55.00 g/L; TBil, 6.80–30.00 μmol/L; DBil, 0–8.60 μmol/L; IBil, 5.10–21.40 μmol/L; TBA, 0.10–10.00 μmol/L; PAB, 0.20–0.43 g/L; AMY, 35.00–135.00 U/L; lipase, 21.00–67.00 U/L); kidney function parameters (urea, 3.10–8.00 mmol/L; uric acid, 210.00–430.00 μmol/L; Cre, 57.00–97.00 μmol/L; RBP, 36.00–75.00 mg/L; cystatin C, 0.38–1.26 mg/L); CHO, 2.60–6.00 mmol/L; TG, 0.28–1.80 mmol/L; HDL, 0.76–2.10 mmol/L; Apo A, 1.00–1.60 g/L; LDL, 2.06–3.10 mmol/L; lipoprotein a, 0–0.30 g/L; SF, 20.00–300.00 μg/L; TIBF, 45.00–70.00 μmol/L; UIBC, 25.06–51.91 μmol/L). Inductively Coupled Plasma Spectrometer (ICP-MS, Agilent, 7700X, USA) was performed by an experienced technician to determine serum Ca, Mg, Fe, Zn, Cu, Se. The quality control of the samples was performed strictly according to the standard reference materials of the China Center for Reference Materials. The ICP-MS system operated at the condition of 1550W RF power and 1.05L/min spray gas flow rate. The recovery rate (accuracy) of standard trace elements was between 93.0 and 98.9%. All element levels were calculated in milligrams per liter.
Statistical Analysis Process
Statistical analysis was performed by STATA 15.0 and SPSS 17.0. The figure was drawn by GraphPad Prism 8.0 software. LMS chartmaker Light 2.54 was used to perform the continuous centile curves.
Basic Statistical Analysis
Mann–Whitney U-test was used to determine difference parameters and were shown as median. The parameters would be considered as abnormal if the value was out of defined reference intervals, and the total NACP were summarized in each of DKA patients (DP) and non-DKA patients (NDP).
Process of Prediction Models Construction
T1D individuals were randomly divided into training set and validation set with the ratio of 7:3. Training set was for model construction and the validation set was for accuracy evaluation. The parameters without significant difference between DP and NDP (P<0.05) were screened out by univariate analysis. Univariate logistic regression analysis was used to examine whether the clinical parameter and trace elements play significant roles in DKA morbidity. Odds ratio (OR) and 95% confidence intervals (CIs) were calculated. The analytes with significant difference (P<0.05) were selected as the predicted factor in the training set. Correlation analysis was performed by Spearman method. If significant correlation was found between two clinical parameters, one of them should be eliminated to screen out the effective parameters and avoid multicollinearity bias in the multifactor analysis.24 Multivariate logistic regression was performed to select the best prediction combination of parameters using the forward LR method. The coefficients received in the training set were used to calculate the predicted score in the validation set. The formula was as follows:  (β was the coefficient, AC was analyte concentration). Receiver operating characteristic (ROC) curves were performed in training set and validation set using the prediction probability. Area under curve (AUC) > 0.75 was considered as the performance of a good model.24 Decision clinical analysis (DCA) and decision influence curve (CIC) were used to evaluate the suitability in clinic.
Evaluation of the Relationship Between NACP and the Predicted Value of Models
NACP were summarized and the predicted value of models for each individual were calculated in SPSS. The coefficient of skewness median coefficient of variation (LMS) curve was used to visualize the dynamic change of the predicted efficiency of the established model with NACP. The continuous centile curves were fitted with maximum penalized likelihood rate and several parameters [Box-Cox transformation λ (L), median μ (M), and coefficient of variation σ (S)]. The freedom of L, M, S could be adjusted and fit so as to make the curve of NACP and predicted value continuous.
Results
The Basic Characteristics of Study Individuals
A total of 96 T1D patients were enrolled and 47 of them were hospitalized with DKA. Ninety-six healthy individuals were enrolled as control group. Significant difference of basic information (age, BMI, duration of illness) was not found among the three groups (DP, NDP, HP). More individuals were found with unhealthy habits (alcohol and cigarette smoking) in DP, and the condition of blood glucose control in DP were worse than that in NDP. Other results of arterial blood gas analysis in DP all showed significant acidosis characteristics (Table 1).
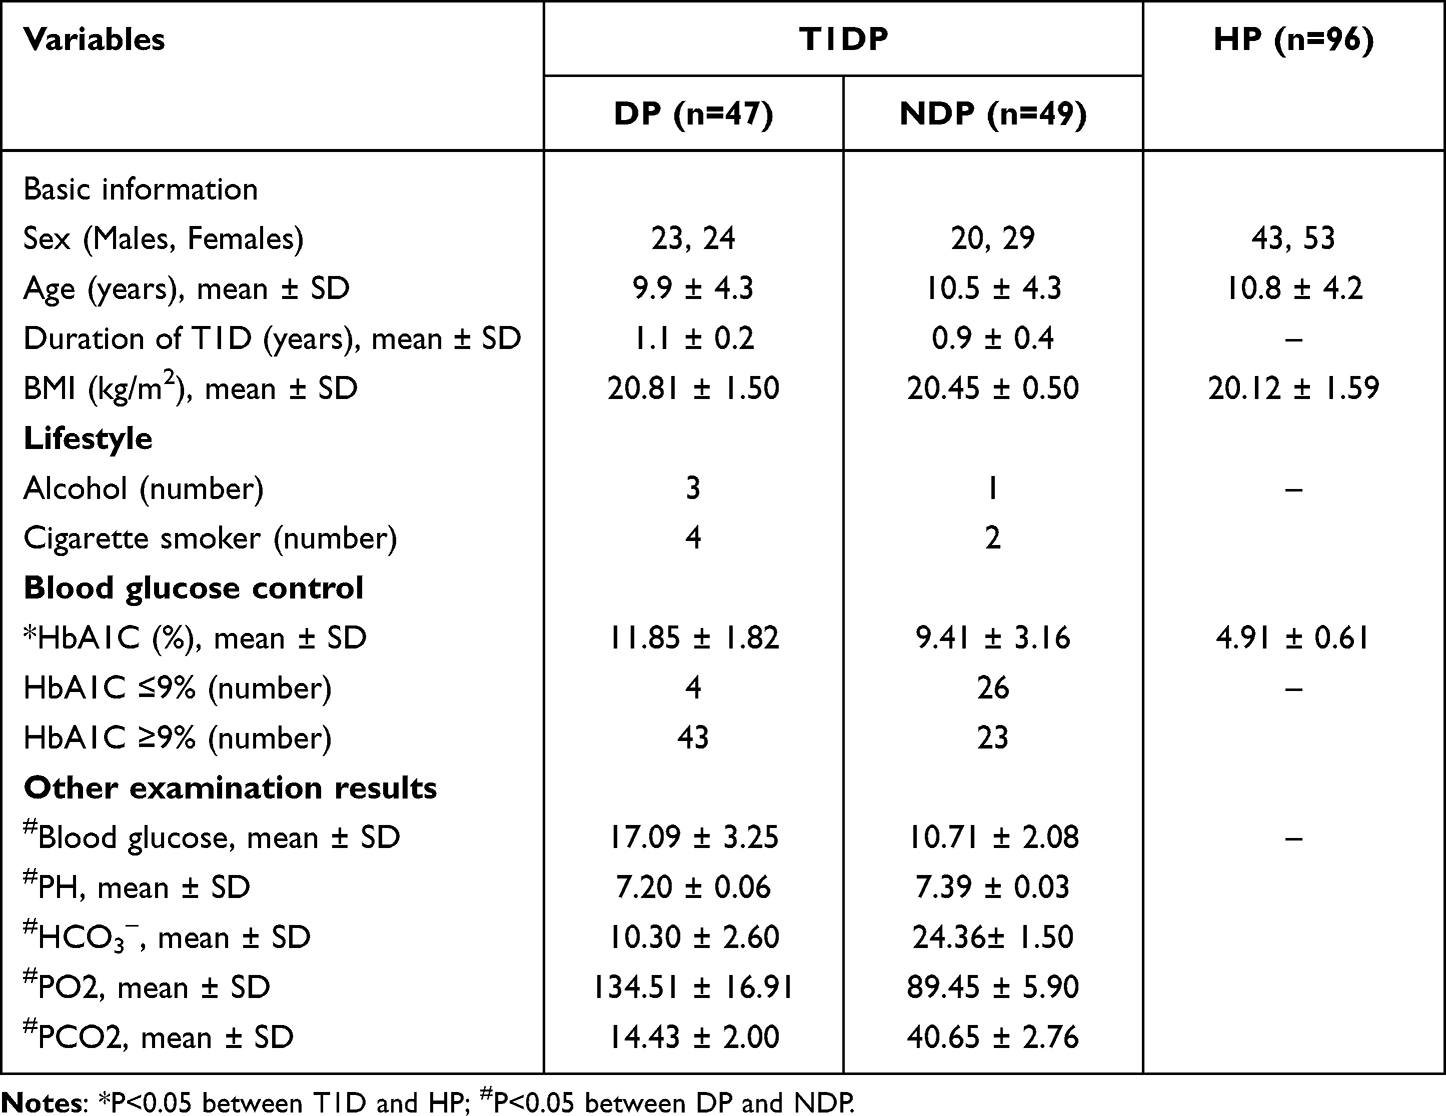 |
Table 1 Basic Characteristics of Enrolled Population |
Evaluation of Trace Elements Levels
Serum Ca and Mg were significantly higher in HP than those in DP and NDP (HPCa vs NDPCa vs DPCa: 66.20 mg/L, 52.55 mg/L, 50.81 mg/L; HPMg vs NDPMg vs DPMg: 14.75 mg/L, 11.74 mg/L, 10.37 mg/L). Subtle difference was found between DP and NDP for serum Ca, but lower levels of Mg were found in DP. Serum Fe, Cu and Se all showed lower levels in HP than those in the disease group, but elevated trend with the aggravation of T1D. Higher levels were found in DP for the three elements (HPFe vs NDPFe vs DPFe: 0.37 mg/L, 0.63 mg/L, 0.87 mg/L; HPCu vs NDPCu vs DPCu: 0.29 mg/L, 0.55 mg/L, 0.62 mg/L; HPSe vs NDP Se vs DP Se: 0.09 mg/L, 0.11 mg/L, 0.12 mg/L). Serum Zn showed a lower trend in DP than those in HP and NDP, and significant difference (P <0.05) between DP and NDP was found in serum Fe and Zn. The detailed results are shown in Figure 2.
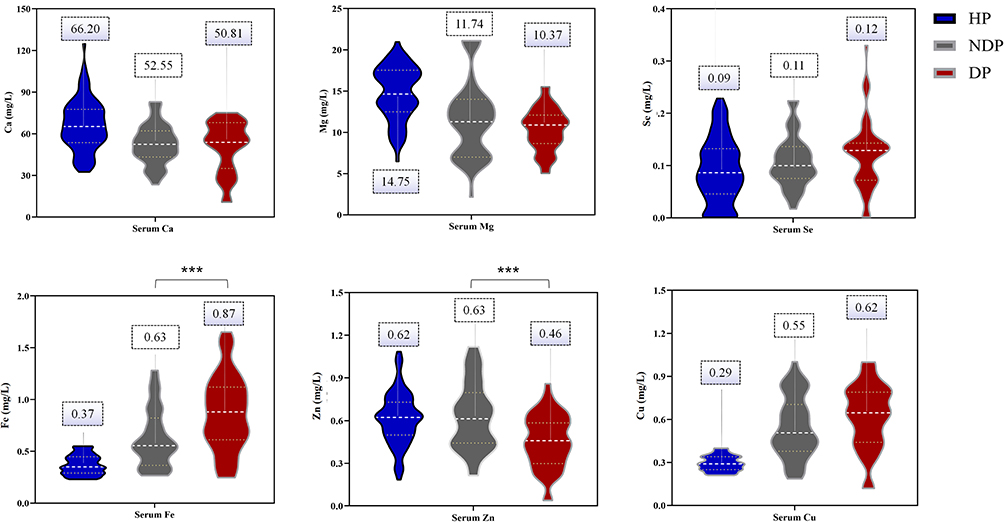 |
Figure 2 The comparison of trace elements levels among HP, NDP and DP. ***Indicates the significant difference between DP and NDP. |
Construction of Prediction Model
The whole individual groups of DP and NDP were randomly divided into training set and validation set with the ratio of 7:3. The specific information of two sets is shown in Table 2.
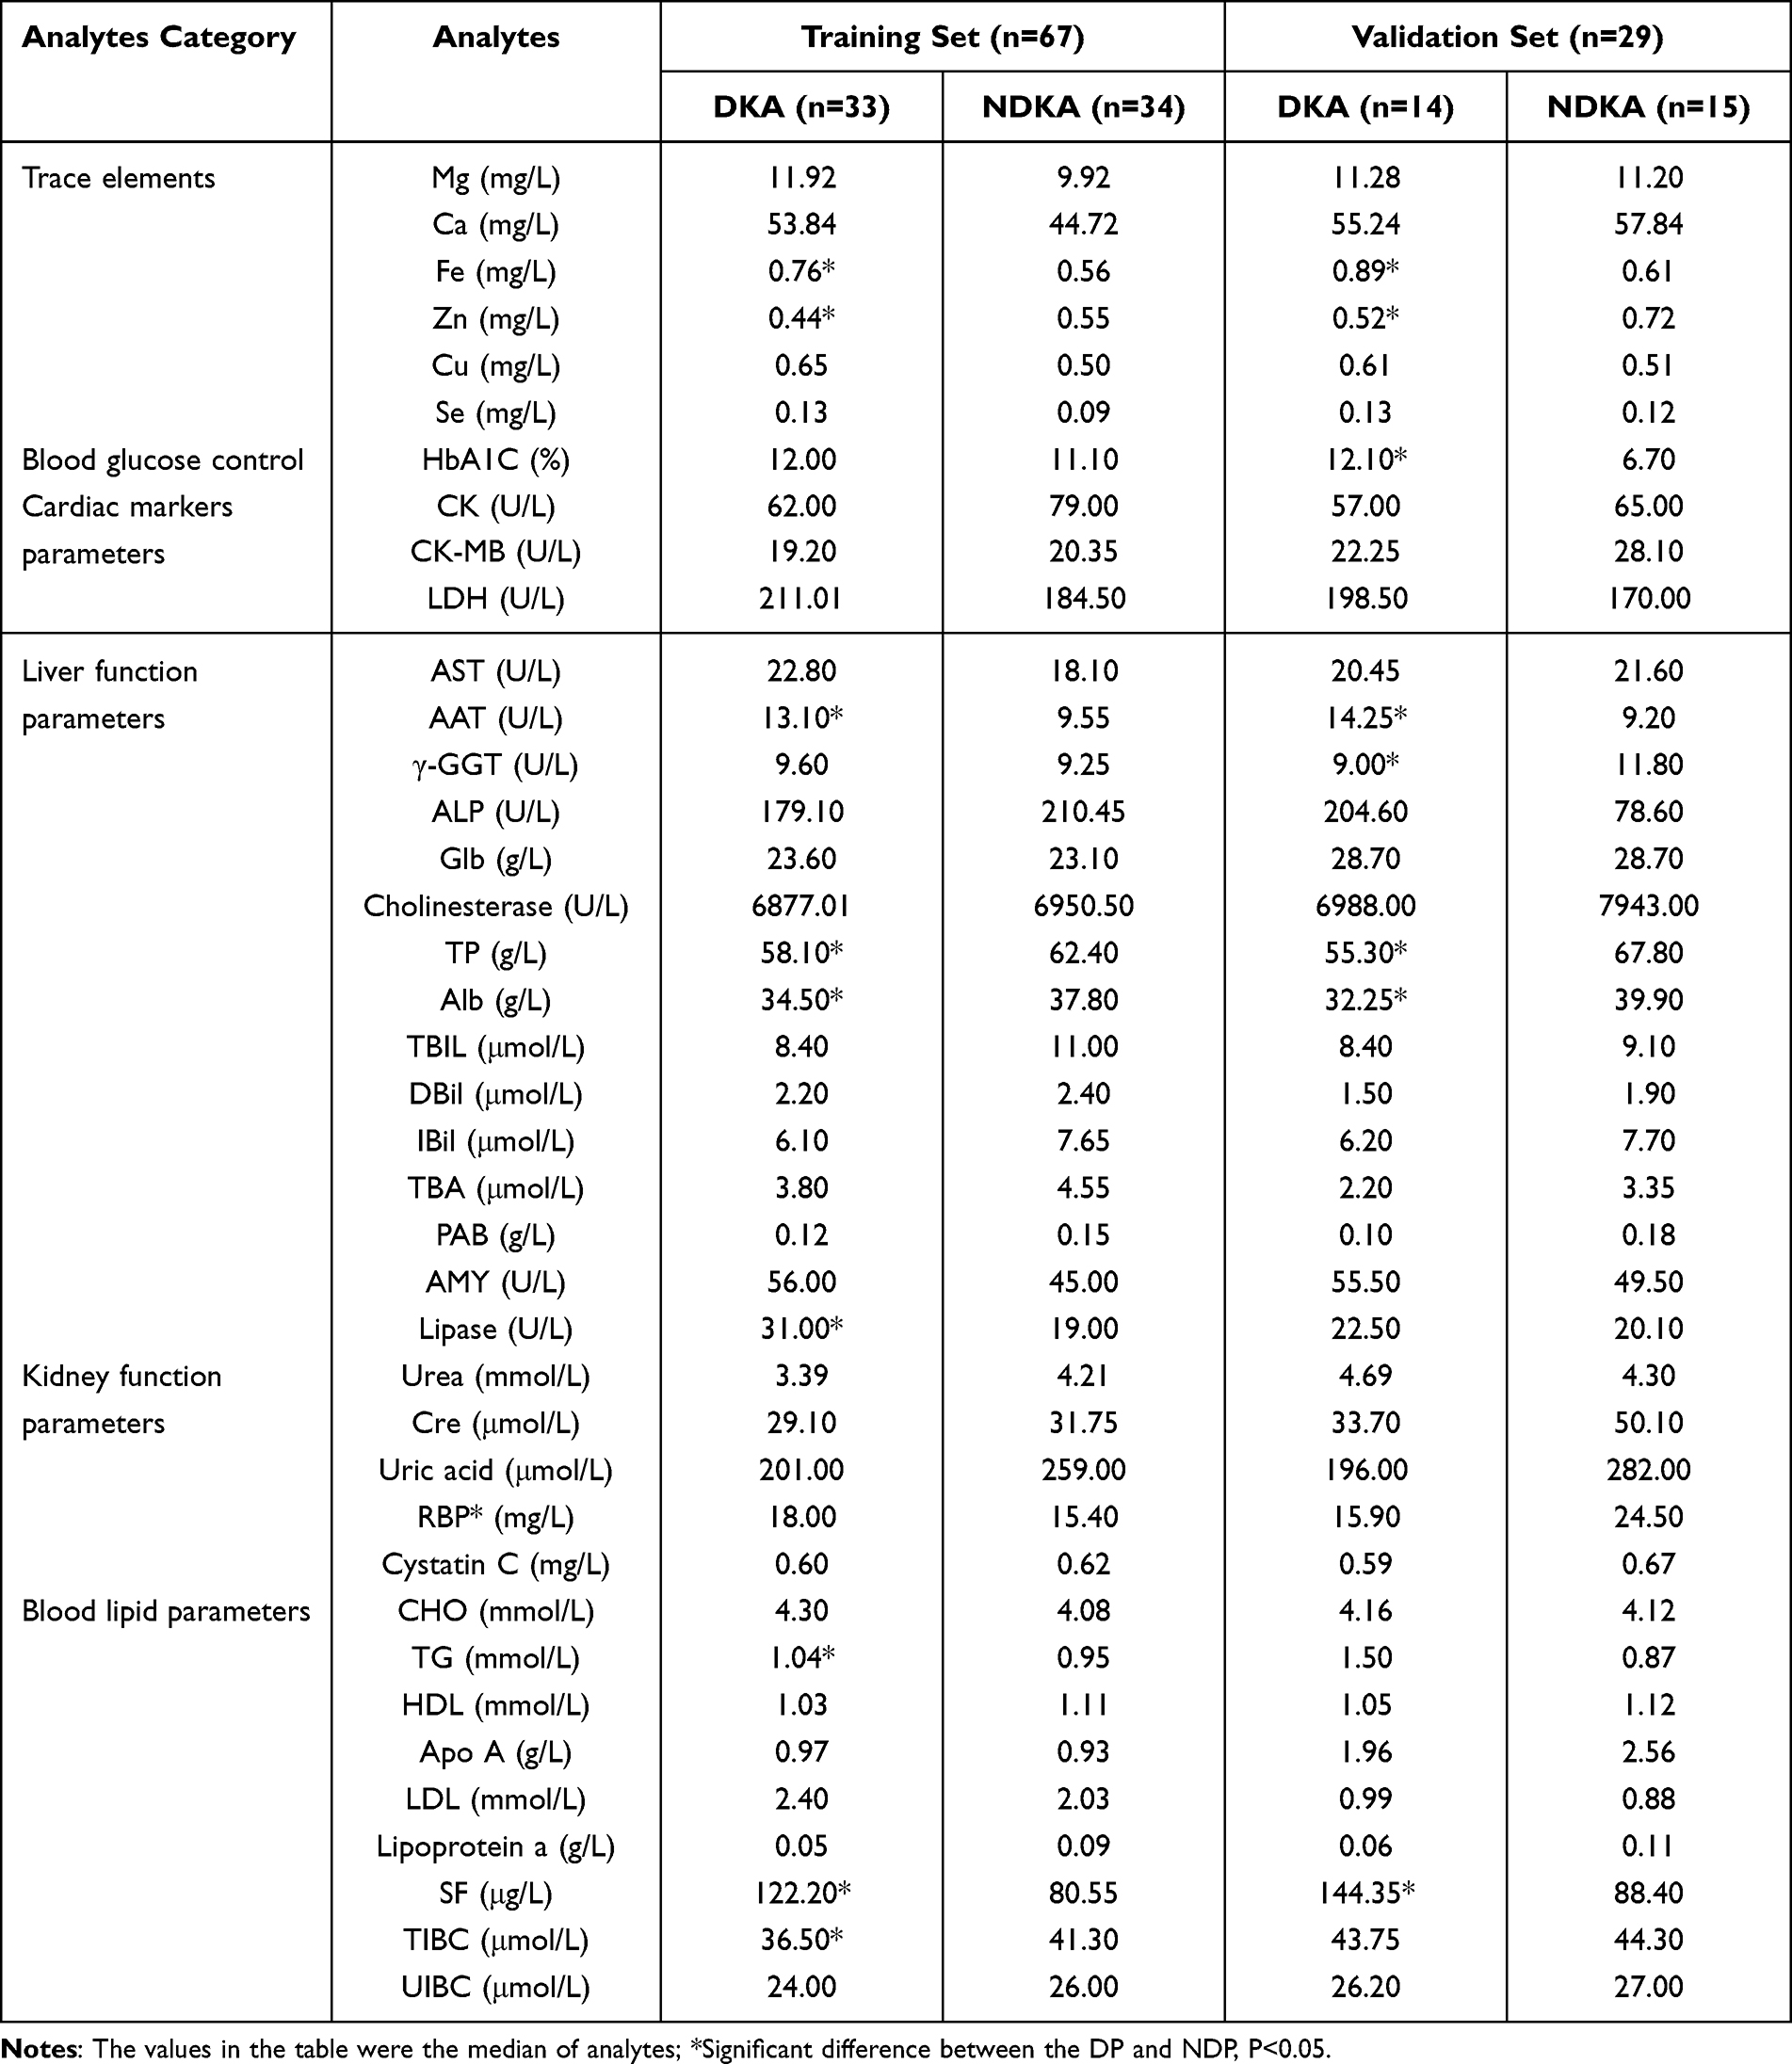 |
Table 2 Baseline Characteristics in Training Cohort and Validation Cohort |
Analytes Selection and Construction for Prediction Model
Preliminary univariate analysis showed that there were significant differences (P<0.05) in Fe (P=0.018), Zn (P=0.014), AAT (P=0.035), TP (P<0.001), Alb (P<0.001), RBP (P=0.025), lipase (P=0.004), TG (P=0.032), TIBC (P=0.026) and SF (P=0.005) between DP and NDP.
Sex, age and the selected analytes in the preliminary univariate analysis were performed with univariate logistic regression. Sex (P=0.069), age (P=0.214), TG (P=0.102) and Fe (P=0.254) were absent of significant influence on DKA morbidity. AAT (P=0.036), TP (P=0.001), Alb (P=0.001), lipase (P=0.015), TIBC (P=0.029), SF (P=0.008) and Zn (P=0.010) were selected for following correlation analysis. The analytes with significant statistical difference and their odd ratios (OR) are exhibited in Figure 3a. Correlation analysis results had shown that Alb was significantly related to TP (P<0.001) and Zn (P=0.044), SF was positively related to lipase (P=0.002), which led to the elimination of Alb and SF to avoid multicollinearity bias in the multifactor analysis. The correlation coefficient among analytes is shown in Figure 3b. AAT, TP, lipase, RBP, TIBC and Zn were selected for construction of model. The multiple logistic regression and LR method finally selected the combination of TP, lipase and Zn as the most suitable prediction model. The specific information of the model is shown in Figure 4a.
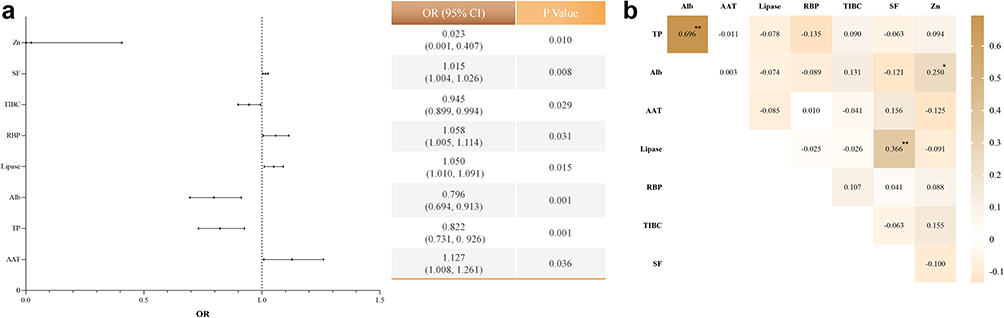 |
Figure 3 (a) stands for the forest plot of laboratory indicators based on the univariate logistic regression analysis; (b) stands for the correlation analysis results between selected parameters; *P<0.05; **P<0.01. Abbreviations: OR, odd ratio; CI, confidence intervals. |
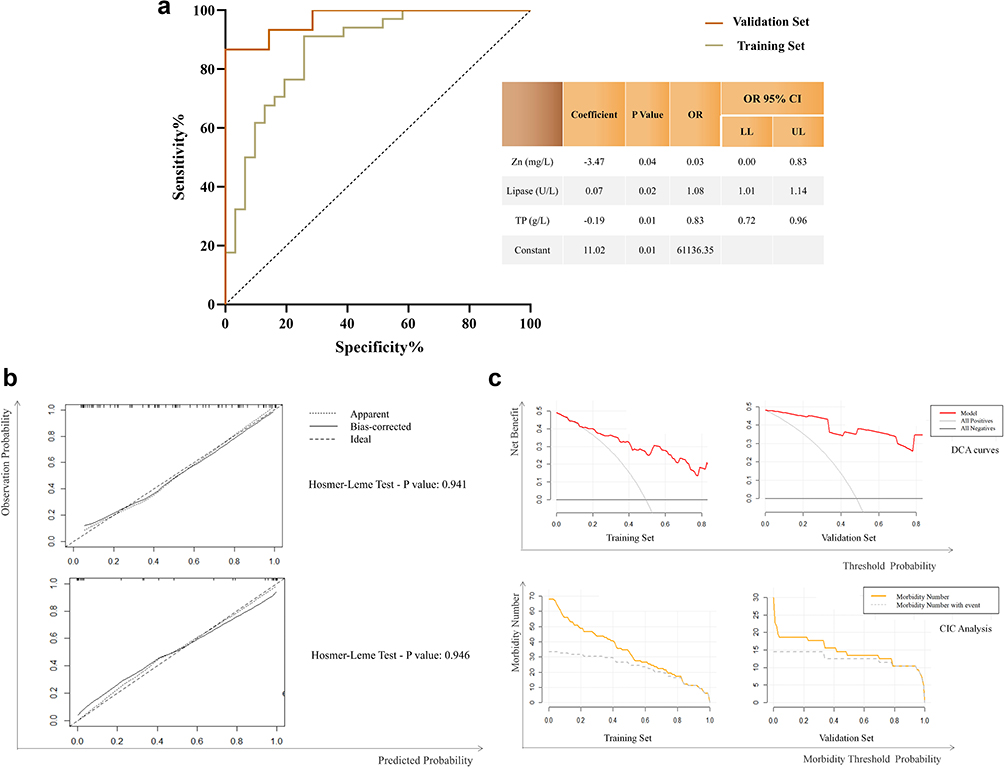 |
Figure 4 (a) ROC curves and the specific information of the model; (b) calibration curve of model; (c) The DCA and CIC curves. The names and units of the horizontal and vertical axes of each graph are the same, so they are represented by the total coordinate axis. |
Validation of Prediction Model
Prediction score in validation set was calculated by the coefficients received from the training set.

The satisfactory results were received in training set and validation set with AUC of 0.867 and 0.961, respectively. ROC curves and the specific result of the model are shown in Figure 4a. Hosmer-Leme showed goodness-of-fit test results in the calibration curve with satisfactory P value of each model in the two sets, shown in Figure 4b. Within a reasonable threshold probability range, the prediction model showed a good clinical application effect as a whole (Figure 4b and c). When the threshold probability was greater than 50% of the prediction score probability in CIC, the prediction model determined that the high-risk DKA population was highly matched with the actual DKA population, which confirmed the high clinical efficiency of the prediction model. Dynamic nomogram for model is shown in Figure 5 (Figure 5a), the red point was an example for application of the model. Lower levels of Zn, TP and higher levels of lipase indicated higher possibility for DKA morbidity. LMS curves showed that the predicted value of established models increased with NACP, which was shown in Figure 5 (Figure 5b).
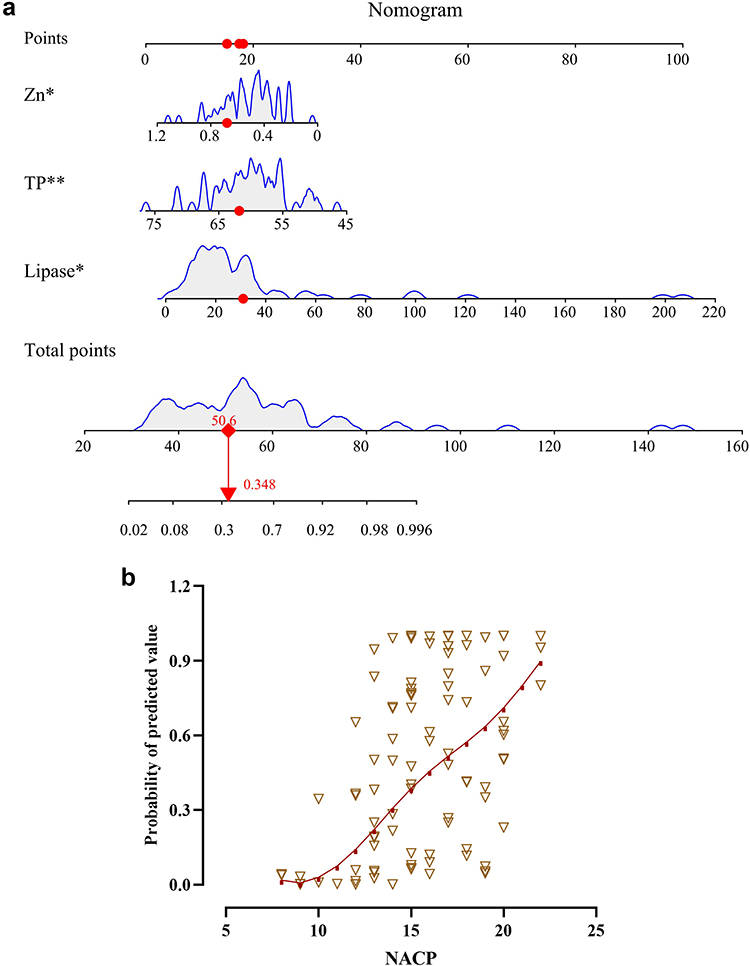 |
Figure 5 (a) the dynamic nomogram of model which could show the specific influence of each analyte to T1D prediction. The red point in the figure is an example of the data; *P<0.05;**P<0.01. (b) the LMS curves of the relationship between NACP and the probability efficiency of the model. The red line shows the P50, and the brown triangle represents the scatter plot of the data. |
Discussion
DKA is a serious complication accompanied by oxidative stress and showed significant change in trace elements levels, which was rarely studied before. The early recognition of DKA and reducing rates of recurrent DKA are crucial due to the acute and severe symptoms which might lead to death. The patients’ hospital data could reflect the physical pattern in DKA, which should be fully used to perform various predicted methods innovatively. This study evaluated the levels of trace elements among HP, NDP and DP, followed by constructing the efficient predicted models for DKA.
Higher HbA1C levels were found in DKA, which was consistent with the conclusion that T1D patients with poor glucose control were more susceptible to DKA. However, the patients with poor glucose control were commonly found with deleterious lifestyles, such as cigarette smoking or alcohol consumption. Hence, it is a reminder that daily care and healthy habits might affect the progress of diabetes, and then affect the incidence of DKA.
Evaluation of Trace Elements Levels Between DP and NDP
Several Ca transport-related factors decreased in T1D and resulted in depletion of the endoplasmic reticulum (ER) Ca pool, followed by ER stress and oxidative stress.25,26 In this study, the levels of serum Ca in HP were significantly higher than those of the two disease groups, and lower levels of Ca were found in DP than in NDP but with no significant difference. This phenomenon indicated that Ca balance was more severely impaired in DKA patients. In addition, appropriate Ca supplementation could decrease the incidence of diabetes,27,28 and might provide reference on the prevention of diabetes progression and DKA.
Decreasing trend was also found in serum Mg with the progression of disease. Low levels of serum Mg and high levels of urine Mg were found in DKA in a study about cats.29 Higher glucose might be one of the reasons because hyperglycemia could contribute to the hypomagnesemia which indicates the strong relationship between serum Mg and glycemic control. In addition, excessive ketone bodies were produced in DKA, which were shown to induce oxidative stress in cardiomyocytes, erythrocytes and endothelial cells.30–32 The abnormal oxidative status would lead to kidney damage, followed by renal reabsorption dysfunction and acid-base imbalance, which could lead to redistribution and excessive excretion of serum Mg.33
Cu and serum Zn was confirmed to have a protective role in humans by regulating inflammation, reducing oxidative stress, and being involved in lipid and glucose metabolism.12,34 Conversely, excessive accumulation of Cu and Zn were found to cause dose-dependent oxidative toxicity35 and were positively related to elevated glucose.36 Higher levels of serum Cu and lower levels of Zn were found in DP of this study. Oxidation of aminoacetone (AA) to methylglyoxal (MG), NH4+ and H2O2 had been reported to be catalyzed by a Cu-dependent semicarbazide sensitive amine oxidase (SSAO) as well as by Cu- and Fe-catalyzed reactions with oxygen.15 Hence, the high production of AA in DKA patients would be accompanied by the significant increasing trend of Cu and Fe. Severe toxicity and cell damage were also typical characteristics of DKA, which would lead to high levels of Cu. Similar findings of high Cu levels in diabetes were also found in previous studies.37–39 In addition, low levels of Zn were observed in T1D patients and DKA patients showed lower Zn levels than the non-DKA patients, which indicated the worse homeostasis of glucose and damaged antioxidant capacity in DKA. The decreasing trend of Zn was also observed in patients with high levels of ketone bodies.14 Abnormal Zn and Cu metabolism appears to accompany and might cause diabetes complications.
A close connection was found for Fe with triggering oxidative stress and tissue damage in human and experimental animal diabetes.40,41 High levels of serum Fe were deemed as the main characteristic of DKA42 and positively related with metabolic syndrome (MetS),36 which was similar with this study. Excessive serum Fe was observed in the MetS group,43,44 which indicated that elevated serum Fe45 as well as dietary Fe46 were associated with an increased risk of diabetes progression. Fe deposition was considered to be closely related to changes in Fe transport regulation associated with steatosis, insulin resistance and chronic inflammation.43,47 Fe overload could itself trigger diabetes in hereditary hemochromatosis syndrome patients.48 Hence, the control of Fe would benefit the progression of diabetes and some complications. In addition, the effects of Se were related to antioxidant defense, synthesis of thyroid hormones and muscle performance.49 However, subtle differences were found among HP, DP and NDP, which indicated subtle influence of Se in DKA patients of this study.
Construction of Predicted Models for DKA
Patients with lower levels of TP, Zn and higher levels of lipase could efficiently predict DKA. The dynamic changes of Alb and Glb would influence the total levels of proteins. The redox state of Alb sulfhydryl in serum plays a leading role in redox regulation,50,51 which might accurately reveal oxidative stress and be accelerated to decompose when the human body faced severe oxidative stress.52 In addition, the damage of liver function caused by DKA would also affect protein synthesis. Some T1D individuals were found with high levels of lipase,53 and serum pancreatic enzyme elevation was common in children with DKA. High mRNA expression of endothelial and hormone-sensitive lipase was found in T1D patients, which was related to the control of glucose.54 Interestingly, it was found that the lipase activity of T1D patients with long-term onset was significantly reduced due to the impairment of pancreatic exocrine function,55 while patients with DKA were often accompanied by acute metabolic disorders and decreased enzyme clearance due to their acute onset. Therefore, high levels of lipase were of high value in the diagnosis of DKA.56,57 In addition, patients with higher pancreatic enzyme levels would have more severe acidosis.57 The proportion of DKA patients with elevated lipase was higher than that of with elevated AMY.58,59 This meant that lipase was more valuable than AMY in evaluating the fat and pancreas metabolism of DKA. Hence, the combination of TP, lipase and Zn would efficiently reflect the damaged protein, lipid and oxidative metabolism so as to predict DKA in T1D patients.
LMS method was commonly used in evaluating the levels of analytes with age,60 so as to observe the dynamic changes of analytes with independent variable. An increased prediction efficiency was observed with NACP, which suggested that this prediction model had a significant reference value for predicting severe DKA patients. In addition, common T1D patients who are lacking common DKA symptoms but have a great many of the abnormal clinical parameters should also be alerted to the occurrence of DKA through this model.
Limitations
Firstly, the sample size of this study is relatively small. In addition, the external verification was absent in this study, which would obstruct deeper validation of the model.
Conclusion
Significantly lower levels of Zn and higher levels of Fe were found in DKA patients than those of T1D patients. Low levels of TP, Zn and high levels of lipase would be an efficient combination for DKA prediction, and the increasing predicted efficiency of constructed model was found with NACP. The findings about trace elements and the constructed prediction model in this study would benefit the explanation of the condition for oxidative stress and the improvement of early warning for DKA.
Ethical Approval
All procedures performed were in accordance with the ethical standards of the institutional and/or national research committee, and with the Declaration of Helsinki and its later amendments or comparable ethical standards.
Consent to Participate
The names and other basic information of all participants are hidden, and the publication of the article will not cause any conflict and dispute over copyright.
Author Contributions
All authors made a significant contribution to the work reported, whether that is in the conception, study design, execution, acquisition of data, analysis and interpretation, or in all these areas; took part in drafting, revising or critically reviewing the article; gave final approval of the version to be published; have agreed on the journal to which the article has been submitted; and agree to be accountable for all aspects of the work.
Funding
This work was supported by Jilin Science and Technology Development Program (no. 20200404171YY to Dr. Qi Zhou).
Disclosure
The authors declare no potential conflicts of interest with respect to the authorship, and/or publication of this article.
References
1. Syed FZ. Type 1 Diabetes Mellitus. Ann Intern Med. 2022;175(3):Itc33–itc48. doi:10.7326/aitc202203150
2. Maahs DM, Hermann JM, Holman N, et al. Rates of diabetic ketoacidosis: international comparison with 49,859 pediatric patients with type 1 diabetes from England, Wales, the U.S., Austria, and Germany. Diabetes Care. 2015;38(10):1876–1882. doi:10.2337/dc15-0780
3. Danne T, Garg S, Peters AL, et al. International consensus on risk management of diabetic ketoacidosis in patients with type 1 diabetes treated with Sodium-Glucose Cotransporter (SGLT) Inhibitors. Diabetes Care. 2019;42(6):1147–1154. doi:10.2337/dc18-2316
4. Adrogué HJ, Wilson H, Boyd AE, Suki WN, Eknoyan G. Plasma acid-base patterns in diabetic ketoacidosis. N Engl J Med. 1982;307(26):1603–1610. doi:10.1056/nejm198212233072603
5. Hoffman WH, Burek CL, Waller JL, Fisher LE, Khichi M, Mellick LB. Cytokine response to diabetic ketoacidosis and its treatment. Clin Immunol. 2003;108(3):175–181. doi:10.1016/s1521-6616(03)00144-x
6. Kawamori D. Exploring the molecular mechanisms underlying α- and β-cell dysfunction in diabetes. Diabetol Int. 2017;8(3):248–256. doi:10.1007/s13340-017-0327-x
7. Yosten GLC. Yosten GLC Alpha cell dysfunction in type 1 diabetes. Peptides. 2018;100:54–60. doi:10.1016/j.peptides.2017.12.001
8. Taborsky GJ. The physiology of glucagon. J Diabetes Sci Technol. 2010;4(6):1338–1344. doi:10.1177/193229681000400607
9. Castellanos L, Tuffaha M, Koren D, Levitsky LL. Management of diabetic ketoacidosis in children and adolescents with type 1 diabetes mellitus. Paediatr Drugs. 2020;22(4):357–367. doi:10.1007/s40272-020-00397-0
10. Kanikarla-Marie P, Jain SK. Hyperketonemia and ketosis increase the risk of complications in type 1 diabetes. Free Radic Biol Med. 2016;95:268–277. doi:10.1016/j.freeradbiomed.2016.03.020
11. Jain SK, Kannan K, Lim G. Ketosis (acetoacetate) can generate oxygen radicals and cause increased lipid peroxidation and growth inhibition in human endothelial cells. Free Radic Biol Med. 1998;25(9):1083–1088. doi:10.1016/s0891-5849(98)00140-3
12. Xu J, Zhou Q, Liu G, Tan Y, Cai L. Analysis of serum and urinal copper and zinc in Chinese northeast population with the prediabetes or diabetes with and without complications. Oxid Med Cell Longev. 2013;2013:635214. doi:10.1155/2013/635214
13. Viktorínová A, Toserová E, Krizko M, Ďuračková Z. Altered metabolism of copper, zinc, and magnesium is associated with increased levels of glycated hemoglobin in patients with diabetes mellitus. Metabolism. 2009;58(10):1477–1482. doi:10.1016/j.metabol.2009.04.035
14. Faure P, Corticelli P, Richard MJ, et al. Lipid peroxidation and trace element status in diabetic ketotic patients: influence of insulin therapy. Clin Chem. 1993;39(5):789–793. doi:10.1093/clinchem/39.5.789
15. Dutra F, Araki D, Bechara EJ. Aminoacetone induces loss of ferritin ferroxidase and iron uptake activities. Free Radic Res. 2003;37(10):1113–1121. doi:10.1080/10715760310001604116
16. Sergeev IN, Rhoten WB. 1,25-Dihydroxyvitamin D3 evokes oscillations of intracellular calcium in a pancreatic beta-cell line. Endocrinology. 1995;136(7):2852–2861. doi:10.1210/endo.136.7.7789310
17. Ahn C, Kang JH, Jeung E-B. Calcium homeostasis in diabetes mellitus. J Vet Sci. 2017;18(3):261–266. doi:10.4142/jvs.2017.18.3.261
18. Su D, Li Y, Guo M, et al. Clinical analysis of electrolyte disorders in patients with diabetic ketoacidosis. Clin Lab. 2021;67(01/2021). doi:10.7754/Clin.Lab.2020.200309
19. Hu Y, Shi R, Mo R, Hu F. Nomogram for the prediction of diabetic nephropathy risk among patients with type 2 diabetes mellitus based on a questionnaire and biochemical indicators: a retrospective study. Aging. 2020;12(11):10317–10336. doi:10.18632/aging.103259
20. Jiang S, Fang J, Yu T, et al. Novel model predicts diabetic nephropathy in type 2 diabetes. Am J Nephrol. 2020;51(2):130–138. doi:10.1159/000505145
21. ADA. American diabetes association standards of medical care in diabetes-2016 abridged for primary care providers. Clin Diabetes. 2016;34(1):3–21. doi:10.2337/diaclin.34.1.3
22. The management of diabetic ketoacidosis in adults. Available from: http://www.diabetologists-abcd.orguk/JBDS/JBDS.htm.
23. Chai J, Wang Y, Sun Z, Zhou Q, Xu J. Evaluation among trace elements, clinical parameters and type 1 diabetes according to sex: a new sight of auxiliary prediction in negative insulin auto-antibodies population. J Trace Elem Med Biol. 2023;75:127100. doi:10.1016/j.jtemb.2022.127100
24. Wang Y, Gao D, Li X, et al. Early changes in laboratory tests predict liver function damage in patients with moderate coronavirus disease 2019: a retrospective multicenter study. BMC Gastroenterol. 2022;22(1):113. doi:10.1186/s12876-022-02188-y
25. Ahn C, An BS, Jeung E-B. Streptozotocin induces endoplasmic reticulum stress and apoptosis via disruption of calcium homeostasis in mouse pancreas. Mol Cell Endocrinol. 2015;412:302–308. doi:10.1016/j.mce.2015.05.017
26. DeLeo FR, Goedken M, McCormick SJ, Nauseef WM. A novel form of hereditary myeloperoxidase deficiency linked to endoplasmic reticulum/proteasome degradation. J Clin Invest. 1998;101(12):2900–2909. doi:10.1172/jci2649
27. Pittas AG, Dawson-Hughes B, Li T, et al. Vitamin D and calcium intake in relation to type 2 diabetes in women. Diabetes Care. 2006;29(3):650–656. doi:10.2337/diacare.29.03.06.dc05-1961
28. van Dam RM, Hu FB, Rosenberg L, Krishnan S, Palmer JR. Dietary calcium and magnesium, major food sources, and risk of type 2 diabetes in U.S. black women. Diabetes Care. 2006;29(10):2238–2243. doi:10.2337/dc06-1014
29. Norris CR, Nelson RW, Christopher MM. Serum total and ionized magnesium concentrations and urinary fractional excretion of magnesium in cats with diabetes mellitus and diabetic ketoacidosis. J Am Vet Med Assoc. 1999;215(10):1455–1459.
30. Jain SK, McVie R. Hyperketonemia can increase lipid peroxidation and lower glutathione levels in human erythrocytes in vitro and in type 1 diabetic patients. Diabetes. 1999;48(9):1850–1855. doi:10.2337/diabetes.48.9.1850
31. Kanikarla-Marie P, Jain SK. Hyperketonemia (acetoacetate) upregulates NADPH oxidase 4 and elevates oxidative stress, ICAM-1, and monocyte adhesivity in endothelial cells. Cell Physiol Biochem. 2015;35(1):364–373. doi:10.1159/000369702
32. Pelletier A, Coderre L. Ketone bodies alter dinitrophenol-induced glucose uptake through AMPK inhibition and oxidative stress generation in adult cardiomyocytes. Am J Physiol Endocrinol Metab. 2007;292(5):E1325–32. doi:10.1152/ajpendo.00186.2006
33. Mooren FC. Magnesium and disturbances in carbohydrate metabolism. Diabetes Obes Metab. 2015;17(9):813–823. doi:10.1111/dom.12492
34. Hara T, Takeda TA, Takagishi T, Fukue K, Kambe T, Fukada T. Physiological roles of zinc transporters: molecular and genetic importance in zinc homeostasis. J Physiol Sci. 2017;67(2):283–301. doi:10.1007/s12576-017-0521-4
35. Muthuraman P, Ramkumar K, Kim DH. Analysis of dose-dependent effect of zinc oxide nanoparticles on the oxidative stress and antioxidant enzyme activity in adipocytes. Appl Biochem Biotechnol. 2014;174(8):2851–2863. doi:10.1007/s12010-014-1231-5
36. Lu CW, Lee YC, Kuo CS, Chiang CH, Chang HH, Huang K-C. Association of serum levels of zinc, copper, and iron with risk of metabolic syndrome. Nutrients. 2021;13(2):548. doi:10.3390/nu13020548
37. Salmonowicz B, Krzystek-Korpacka M, Noczyńska A. Trace elements, magnesium, and the efficacy of antioxidant systems in children with type 1 diabetes mellitus and in their siblings. Adv Clin Exp Med. 2014;23(2):259–268. doi:10.17219/acem/37074
38. Lin CC, Huang HH, Hu CW, et al. Trace elements, oxidative stress and glycemic control in young people with type 1 diabetes mellitus. J Trace Elem Med Biol. 2014;28(1):18–22. doi:10.1016/j.jtemb.2013.11.001
39. Zargar AH, Bashir MI, Masoodi SR, et al. Copper, zinc and magnesium levels in type-1 diabetes mellitus. Saudi Med J. 2002;23(5):539–542.
40. Young IS, Tate S, Lightbody JH, McMaster D, Trimble ER. The effects of desferrioxamine and ascorbate on oxidative stress in the streptozotocin diabetic rat. Free Radic Biol Med. 1995;18(5):833–840. doi:10.1016/0891-5849(94)00202-u
41. Nickander KK, McPhee BR, Low PA, Tritschler H. Alpha-lipoic acid: antioxidant potency against lipid peroxidation of neural tissues in vitro and implications for diabetic neuropathy. Free Radic Biol Med. 1996;21(5):631–639. doi:10.1016/0891-5849(96)00172-4
42. Alqarihi A, Gebremariam T, Gu Y, et al. GRP78 and integrins play different roles in host cell invasion during mucormycosis. mBio. 2020:11. doi:10.1128/mBio.01087-20
43. Leiva E, Mujica V, Sepúlveda P, et al. High levels of iron status and oxidative stress in patients with metabolic syndrome. Biol Trace Elem Res. 2013;151(1):1–8. doi:10.1007/s12011-012-9525-3
44. Bozzini C, Girelli D, Olivieri O, et al. Prevalence of body iron excess in the metabolic syndrome. Diabetes Care. 2005;28(8):2061–2063. doi:10.2337/diacare.28.8.2061
45. Zhang C, Rawal S. Dietary iron intake, iron status, and gestational diabetes. Am J Clin Nutr. 2017;106:1672s–80s. doi:10.3945/ajcn.117.156034
46. Fang C, Wu W, Gu X, et al. Association of serum copper, zinc and selenium levels with risk of metabolic syndrome: a nested case-control study of middle-aged and older Chinese adults. J Trace Elem Med Biol. 2019;52:209–215. doi:10.1016/j.jtemb.2018.12.017
47. Dongiovanni P, Fracanzani AL, Fargion S, Valenti L. Iron in fatty liver and in the metabolic syndrome: a promising therapeutic target. J Hepatol. 2011;55(4):920–932. doi:10.1016/j.jhep.2011.05.008
48. Burke W, Imperatore G, Reyes M. Iron deficiency and iron overload: effects of diet and genes. Proc Nutr Soc. 2001;60(1):73–80. doi:10.1079/pns200069
49. Mehdi Y, Hornick JL, Istasse L, Dufrasne I. Selenium in the environment, metabolism and involvement in body functions. Molecules. 2013;18(3):3292–3311. doi:10.3390/molecules18033292
50. Jeong J, Jung Y, Na S, et al. Novel oxidative modifications in redox-active cysteine residues. Mol Cell Proteom. 2011;10(3):
51. Anavi S, Madar Z, Tirosh O. Non-alcoholic fatty liver disease, to struggle with the strangle: oxygen availability in fatty livers. Redox Biol. 2017;13:386–392. doi:10.1016/j.redox.2017.06.008
52. Nagumo K, Tanaka M, Chuang VT, et al. Cys34-cysteinylated human serum albumin is a sensitive plasma marker in oxidative stress-related chronic diseases. PLoS One. 2014;9(1):e85216. doi:10.1371/journal.pone.0085216
53. Grimmelmann I, Momma M, Zimmer L, et al. Lipase elevation and type 1 diabetes mellitus related to immune checkpoint inhibitor therapy - A multicentre study of 90 patients from the German Dermatooncology Group. Eur J Cancer. 2021;149:1–10. doi:10.1016/j.ejca.2021.02.017
54. Lindegaard ML, Damm P, Mathiesen ER, Nielsen LB. Placental triglyceride accumulation in maternal type 1 diabetes is associated with increased lipase gene expression. J Lipid Res. 2006;47(11):2581–2588. doi:10.1194/jlr.M600236-JLR200
55. Dozio N, Indirli R, Giamporcaro GM, et al. Impaired exocrine pancreatic function in different stages of type 1 diabetes. BMJ Open Diabetes Res Care. 2021;9. doi:10.1136/bmjdrc-2019-001158
56. Chandra D, Bsavaraju M, Mr R, Av A. Serum amylase and lipase estimation in diabetic ketoacidosis. J Assoc Physicians India. 2022;70(4):11–12.
57. Quiros JA, Marcin JP, Kuppermann N, et al. Elevated serum amylase and lipase in pediatric diabetic ketoacidosis. Pediatr Crit Care Med. 2008;9(4):418–422. doi:10.1097/PCC.0b013e318172e99b
58. Haddad NG, Croffie JM, Eugster EA. Pancreatic enzyme elevations in children with diabetic ketoacidosis. J Pediatr. 2004;145(1):122–124. doi:10.1016/j.jpeds.2004.03.050
59. Yadav D, Nair S, Norkus EP, Pitchumoni CS. Nonspecific hyperamylasemia and hyperlipasemia in diabetic ketoacidosis: incidence and correlation with biochemical abnormalities. Am J Gastroenterol. 2000;95(11):3123–3128. doi:10.1111/j.1572-0241.2000.03279.x
60. Jiatong Chai ZS, Xing D, Zhou Q, Jiancheng X. The indirect method in the establishment of reference intervals for complement 3 and complement 4: a retrospective study. J Taibah Univ Sci. 2021. doi:10.1016/j.jtumed.2021.10.011
 © 2023 The Author(s). This work is published and licensed by Dove Medical Press Limited. The
full terms of this license are available at https://www.dovepress.com/terms
and incorporate the Creative Commons Attribution
- Non Commercial (unported, 3.0) License.
By accessing the work you hereby accept the Terms. Non-commercial uses of the work are permitted
without any further permission from Dove Medical Press Limited, provided the work is properly
attributed. For permission for commercial use of this work, please see paragraphs 4.2 and 5 of our Terms.
© 2023 The Author(s). This work is published and licensed by Dove Medical Press Limited. The
full terms of this license are available at https://www.dovepress.com/terms
and incorporate the Creative Commons Attribution
- Non Commercial (unported, 3.0) License.
By accessing the work you hereby accept the Terms. Non-commercial uses of the work are permitted
without any further permission from Dove Medical Press Limited, provided the work is properly
attributed. For permission for commercial use of this work, please see paragraphs 4.2 and 5 of our Terms.