
Back to Journals » Pragmatic and Observational Research » Volume 16

Evaluating the Potential of Prevalent New User Design as an Alternative When New User Design is Impractical

Received 14 January 2025
Accepted for publication 12 July 2025
Published 31 July 2025 Volume 2025:16 Pages 155—168
DOI https://doi.org/10.2147/POR.S517514
Checked for plagiarism Yes
Review by Single anonymous peer review
Peer reviewer comments 2
Editor who approved publication: Dr Kris Bennett
Takuma Koinuma,1,2,* Manabu Akazawa1,*
1Department of Public Health and Epidemiology, Meiji Pharmaceutical University, Kiyose, Tokyo, Japan; 2Center for Experiential Pharmacy Practice, Faculty of Pharmacy, Tokyo University of Pharmacy and Life Sciences, Hachioji, Tokyo, Japan
*These authors contributed equally to this work
Correspondence: Manabu Akazawa, Email [email protected]
Purpose: The New User Design can be applied if the target drug has not been administered for a specified period. Therefore, comparisons between drugs administered alone are easier to undertake than comparisons of drugs used in combination. Thus, assessing concomitant medications may be associated with several challenges, including limitations to the New User Design. One such limitation is performing analyses that consider the history of administration of drugs of the same class. In the present study, we considered the limitations of the New User Design and proposed solutions based on the potential of the Prevalent New User Design.
Patients and Methods: Using the Japan Medical Data Center database (JMDC), patients diagnosed with diabetes mellitus who received sulfonylureas (SUs) between December 2009 and December 2010 with subsequent addition or switch to dipeptidyl peptidase-4 inhibitors (DPP4Is) were categorized into the SU+DPP4I group. The odds ratio (OR) was estimated using conditional logistic regression analysis. Using the “elapsed time” and “number of prescriptions” axes of the Prevalent New User Design, records from 1,426 and 1,342 individuals, respectively, were analyzed.
Results: The hypoglycemia risk ORs were 1.50 (95% confidence interval [CI] 0.25– 9.00) for the “elapsed time” axis and 1.67 (95% CI 0.40– 7.00) for the “number of prescriptions” axis. These findings are consistent with the results of a meta-analysis of previous randomized controlled trials.
Conclusion: Our findings suggest that the Prevalent New User Design can be effectively applied for real-world risk assessment scenarios; this design constitutes a potential alternative design to the New User Design. We adopted a Prevalent New User Design considering the patients’ treatment history. However, there was a limitation in that we could not obtain information regarding the patients’ perceptions of treatment prior to initiating therapy.
Plain Language Summary: In the present study, we explored a method called the “Prevalent New User Design” to address challenges in comparing the safety of medications, particularly for patients already using certain drugs. We analyzed data from Japanese patients with diabetes who switched from sulfonylureas to dipeptidyl peptidase-4 inhibitors to assess their risk of hypoglycemia (low blood sugar). While considering factors such as treatment duration and prescription history, we found a slightly higher risk of hypoglycemia in this patient population, consistent with previous clinical trial findings. This approach helps researchers study real-world medication risks more effectively, offering an alternative to traditional methods.
Keywords: propensity scores, claims data, observational study, pharmacoepidemiology
Introduction
Randomized controlled trials (RCTs) are conducted under special circumstances, as exemplified by the “Five Toos”1 and their results are limited in terms of generalizability. RCTs that focus on drug risk assessment are more difficult to conduct from an ethical perspective compared with observational studies.2 However, several observational studies are pseudo-randomized and mimic RCTs; hence, improper analysis and interpretation of the results may cause bias.3
For a two-drug comparison in an observational study, the starting point of observation is often the point at which one drug is first administered. Therefore, it is important to distinguish between the “new user” (ie, a patient who has never received the same therapeutic class of drug) and the “prevalent user” (ie, a patient who has previously received such a drug). Current observational studies on the association between hormone replacement therapy (HRT) and coronary artery disease report that HRT reduces the risk of coronary artery disease,4,5 whereas RCTs show no effect.6,7 Therefore, Ray proposed a New User Design in which only new users were considered, as many patients in observational studies were former users for whom HRT had begun prior to commencing the observation period.8 This New User Design has become the gold standard in observational studies.
We considered the following three aspects as limitations of the New User Design. First, many patients are excluded from the New User extraction process.9,10 Particularly in the case of patients with chronic diseases, the number of patients already under treatment exceeds that of those newly diagnosed and starting treatment.11,12 Second, if only the target drug is administered, the patient is considered a new user,13–16 regardless of their potentially differing treatment before the initiation of the target drug and the background of each patient. Third, selecting a comparison group in which the target drug is not administered or a different drug is selected despite being from the same therapeutic class17,18 can lead to bias.
A prevalent user is a patient who switches from a previously administered drug to another medication within the same therapeutic context, typically for the management of the same disease. However, depending on the effect to be estimated, the switch is not necessarily limited to drugs with the same therapeutic purpose. The period between the start of the previously administered drug and the switch to the new drug is termed “immortal time” which may lead to immortal time bias (ITB).19 However, ITB can be resolved using the Prevalent New User Design proposed by Suissa et al.20
The distinction between the Prevalent New User Design and the New User Design, regarded as the gold standard in observational research, lies in their target populations. The New User Design focuses solely on new users, who are further categorized according to their treatment history as treatment-naive or non-naive. Thus, there is a concern about population heterogeneity even within the same group of new users. In addition, in chronic diseases, only a small proportion of patients are newly diagnosed and initiate pharmacological treatment, leading to sample size reduction issues in the New User Design. On the other hand, the Prevalent New User Design proposed by Suissa et al includes prevalent users as its target population and utilizes the time scales of elapsed time and the number of prescriptions.20 This design allows for the alignment of patients’ treatment backgrounds, resulting in a study population that reflects real clinical practice.
To manage the immortal time, it is necessary to select a control group that shares the same point of drug use using elapsed time and the number of prescriptions as the time scale. In addition, the Prevalent New User Design is expected to maintain the sample size when the prevalent user becomes the target patient. The same drug, ie, the drug administered before the target drug, is selected and matched so that the “immortal time” remains the same along with the drug class and administration period. Furthermore, as with the preceding drug, the same drug is selected as a control for comparisons with the prevalent user, ensuring background similarity between the prevalent user and the corresponding control patient. Therefore, this approach has the potential to address the limitations of a New User Design, such as “sample size reduction” “treatment of the prior active drug” and “drug selection” for the control group.
In case of events such as new drug launches or safety concerns, changes in first-line drug selection21,22 and prescription trends23 are reported individually. In this study, we addressed challenges related to epidemiological events and aspects that are considered limitations of a New User Design by utilizing the Prevalent New User Design. In particular, we focused on events arising from previous events related to the introduction of dipeptidyl peptidase-4 inhibitors (DPP4Is) and safety advisory issues regarding the appropriate use of sulfonylureas (SUs) and incretin-related drugs.24,25 These events include changes in first-line drug preferences and the temporal effects of hypoglycemia risk as the measured outcome. Finally, we examined the utility of the Prevalent New User Design by assessing the detectability of the target risk, while considering the limitations of a New User Design and the impact of multiple epidemiological events.
Material and Methods
Database
We used the Japan Medical Data Center (JMDC; JMDC Inc.) database, which contains data from April 2005 to March 2015 sourced from multiple health insurance associations, including monthly dispensing and medical prescription records. Previous studies conducted in Japan have similarly utilized the JMDC database.26,27
Patient data included sex, year of birth, date at which JMDC data collection began, receipt ID (a unique code assigned by the JMDC to each receipt), subscriber ID (a unique code assigned by the JMDC to each patient), and receipt type (hospitalization, Diagnosis Procedure Combination, outpatient, and dispensing). Facility information included facility ID (a unique 9-digit code assigned by the JMDC), number of beds, medical department, and physician information including physician ID (a distinctive code assigned by the JMDC to each physician) linked to the respective medical facility.
The medical diagnosis information derived from medical receipts included the International Statistical Classification of Diseases 10th revision (ICD-10) codes, standard disease names, and standard disease codes. The pharmaceutical information included drug names, Anatomical Therapeutic Chemical Classification (ATC) codes, and other related information. Medical procedure information acted as a medical procedure master, containing the classification of medical procedures, standardized procedure names, standardized procedure IDs, and other relevant information based on the healthcare reimbursement information service.
The collected claims data included unique patient and prescription IDs assigned to each member of the health insurance association and prescription, respectively. These IDs were assigned by the JMDC and linked together. The privacy and anonymity of individuals were ensured by preventing a direct linkage of these IDs with other personal information.28
Identifying Eligible Patients with Diabetes Mellitus
We extracted patient information from the JMDC database with a confirmed diagnosis of diabetes mellitus (DM) indicated by one of the following ICD-10 disease classification codes: E11 (Type 2 diabetes), E12 (diabetes related to malnutrition), or E14 (Unspecified diabetes). In addition, at least one prescription of antidiabetic drugs had to be indicated by ATC classification codes “A10H” “A10J” “A10N” “A10C” “A10S” “A10K” “A10L” “A10M” or “A10P” within 1 year before the month of the confirmed diagnosis. Subsequently, we identified patients who received SU prescriptions, including those for glyclopyramide, acetohexamide, chlorpropamide, gliclazide, glibenclamide, or glimepiride, denoted by the ATC classification code “A10H” between December 2009 and December 2010. These patients were classified as SU-treated patients. Additionally, we identified patients who, while receiving SU treatment, had an additional prescription or switched to a medication indicated by the ATC classification code “A10N” (ie, sitagliptin, vildagliptin, saxagliptin, alogliptin, linagliptin, trelagliptin, teneligliptin, and anagliptin). These patients were categorized as DPP4I-treated patients. Patients with DM treated with SUs and DPP4Is were considered the target population. The analysis period for extracting target patient information from the DM population was from December 2009 to December 2010. Based on the reports by Sato et al and Kohro et al,22,29 the analysis period was limited to control for temporal effects and to isolate and investigate a time when DPP4I medications were newly introduced and the risk of hypoglycemia was high.
Terminology
Patients exposed to medications were categorized as patients with DM. Among the patients who used SUs during the extraction period, those who switched to or also started taking DPP4Is were classified as SU+DPP4I users, while the remaining were classified as SU-only users. An outcome was defined as the incidence of hypoglycemia; specifically, the presence of hypoglycemia and the administration of glucagon, glucose, or a dextrose injection of ≥ 20%, as indicated by a medical claim within the same month during the 12-month observation period.30 Hypoglycemia was diagnosed using the ICD-10 disease classification code and a standardized disease name. The administration of glucagon, glucose, or a dextrose injection of ≥ 20% was identified using the ATC classification code (Table S1). The definition of censoring was based on the completion of the 12-month observation period, the occurrence of the outcome, or the expiration of data acquisition – whichever condition was met first.
Selection of the Control Group Using the Prevalent New User Design
Two time frames were used to sample the population for analysis using the Prevalent New User Design method described by Suissa et al.20 This method requires a time-conditional propensity score (PS), which serves as a temporal measure that identifies a particular point in time. The predominant users in this study were SU+DPP4I users who switched from SUs to DPP4Is or started combination therapy. SU+DPP4I users were registered as patients when they received their first SU administration between December 2009 and December 2010. Conversely, SU-only users were registered based on their first SU administration during the same period and categorized as comparator users.
The time elapsed between the first SU administration and DPP4I administration for SU+DPP4I users (prevalent users) was shown using two time-axes of SU: “elapsed time” and “number of prescriptions.” The corresponding dataset was generated for each axis. Since the period from SU initiation to DPP4I addition constitutes an immortal time — during which the outcome cannot occur — we carefully identified and controlled for this period to avoid immortal time bias and enable an appropriate comparison between the groups. Specifically, this method controls for immortal time bias by ensuring that the control group has the same length of immortal time — defined as the period from SU initiation to DPP4I initiation — as the prevalent user group. Furthermore, it allows matching between patients with a history of SU use, enabling a more balanced and appropriate comparison between groups. In each dataset, PS was calculated using variables indicating treatment status, such as age, sex, medical history, and other medications, as covariates; time-conditional PS matching was performed at identical time points in each time axis to allow for ITB control (Figure 1).
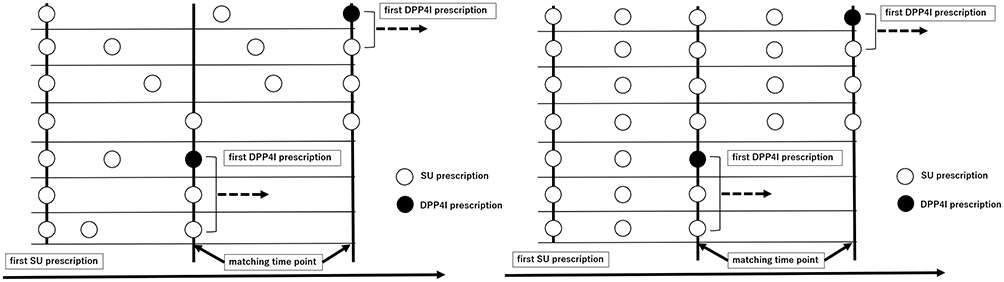 |
Figure 1 Datasets corresponding to each time point on the time axis were constructed by performing propensity score matching between patients receiving SU monotherapy and those receiving SU plus DPP4I combination therapy, ensuring that the duration from the first SU prescription to the matching time point was equivalent between the groups. The left panel illustrates the process of matching patients based on an identical elapsed time from the first SU prescription to the matching point. The right panel illustrates the process of matching patients based on an identical cumulative number of SU prescriptions up to the matching point. Abbreviations: SU, sulfonylurea; DPP4I, dipeptidyl peptidase-4 inhibitor. |
Selection of Confounding Factors and Covariates for Calculating PS
The use of other antidiabetic drugs was defined as the administration of antidiabetic drugs within the month before the matching point, using the ATC classification codes (Table S2). Comorbidities were defined as specific disease names with confirmed diagnoses according to ICD-10 disease classification codes within the 3 months before the matching point, including diabetes-related complications, cancer, and mental and behavioral disorders31 (Table S1). The combination of human insulin preparations and insulin analogs was defined as “concomitant use” if there were ≥ 2 prescriptions given during the observation period since the start of drug exposure. To calculate the PS, the following variables were included as covariates at the matching point: age, sex, concomitant use of human insulin preparations and insulin analogs, use of biguanide preparations, use of other diabetes medications (excluding human insulin preparations, insulin analogs, and biguanide preparations), history of diabetes-related complications, history of cancer, and history of mental and behavioral disorders.
Background Characteristics Between Patients Extracted Using the New User Design for SUs and DPP4Is
To evaluate sample size reduction and patient background differences related to other diabetes medications as limitations of the New User Design, patients who received SUs and DPP4Is between December 2009 and December 2010 were selected using the New User Design. PS matching was performed in the month of the first administration of each drug, and the covariates used for PS calculation were identical to those in the Prevalent New User Design. The aim of this time frame selection was to minimize temporal effects.
Evaluation of the Effects of Prescription Duration Limitations Following the Launch of a New Medication
In Japan, newly released medications are subject to prescription duration limits for the first year after introduction.32 Under this restriction, the frequency of visits increases but it is unclear how the use of the “elapsed time” and “number of prescriptions” axes in the Prevalent New User Design is affected by this restriction. We considered the possibility that the populations formed by the two time-axes would differ in the number of visits after matching. Therefore, we considered the number of examinations as the number of visits, recognizing the possibility of bias in some cases. We then assessed the impact of the prescription day limit on each time axis by examining the frequency of tests for SU-only and SU+DPP4I users after PS matching. The frequency of examinations was determined by counting the number of cases in which either hemoglobin A1c (HbA1c) or glucose levels were measured using standardized methods (Table S3).
Statistical Analysis
Statistical analyses were performed using SAS 9.4. PSs were calculated using logistic regression analysis, and 1:1 matching of SU-only and SU+DPP4I users was performed according to the Prevalent New User Design. Matching was performed using a 1:1 nearest-neighbor approach, with a caliper of 0.2. Conditional logistic regression analysis was performed for each method to estimate the odds ratio (OR) of hypoglycemic risk in SU+DPP4I users compared to that in SU-only users. The data were stratified by the presence or absence of concomitant use of human insulin and similar analogs and matched using an appropriate ID. In addition, the balance of each variable after matching was assessed using standardized mean differences, and a value < 0.1 was considered to indicate a small imbalance.33 The Wilcoxon rank-sum test was used to assess the differences in continuous variables, while a paired t-test was used to assess the differences in paired variables. A two-sided significance level of 5% was considered statistically significant.
Ethical Considerations
This was an observational study in which the JMDC data were anonymized and de-identified to ensure the privacy and confidentiality of the patients’ personal information. The analyzed data were securely stored and processed on a specifically encrypted computer system to protect sensitive information. This study obtained the approval and ongoing supervision of the Meiji Pharmaceutical University Research Ethics Committee (Approval number: 202004).
Results
Patient Background
As shown in Figure 2, of the 185,328 individuals with DM diagnosed in the claims data from April 2005 to March 2015, 183,769 had a confirmed diagnosis, of whom 69,306 had received at least one prescription of antidiabetic medication in the year preceding the month of confirmed DM diagnosis. Among these patients, 12,385 received SU prescriptions between December 2009 and December 2010 and were considered patients with DM, of which 1,588 individuals were identified as SU+DPP4I users because they also started taking, or switched to, DPP4Is during SU treatment. The remaining 10,797 patients constituted the SU-only user group. The study population in the Prevalent New User Design comprised 1,426 individuals for the “elapsed time” axis and 1,342 individuals for the “number of prescriptions” axis. Matching on both time axes significantly reduced differences in patient backgrounds (Table 1).
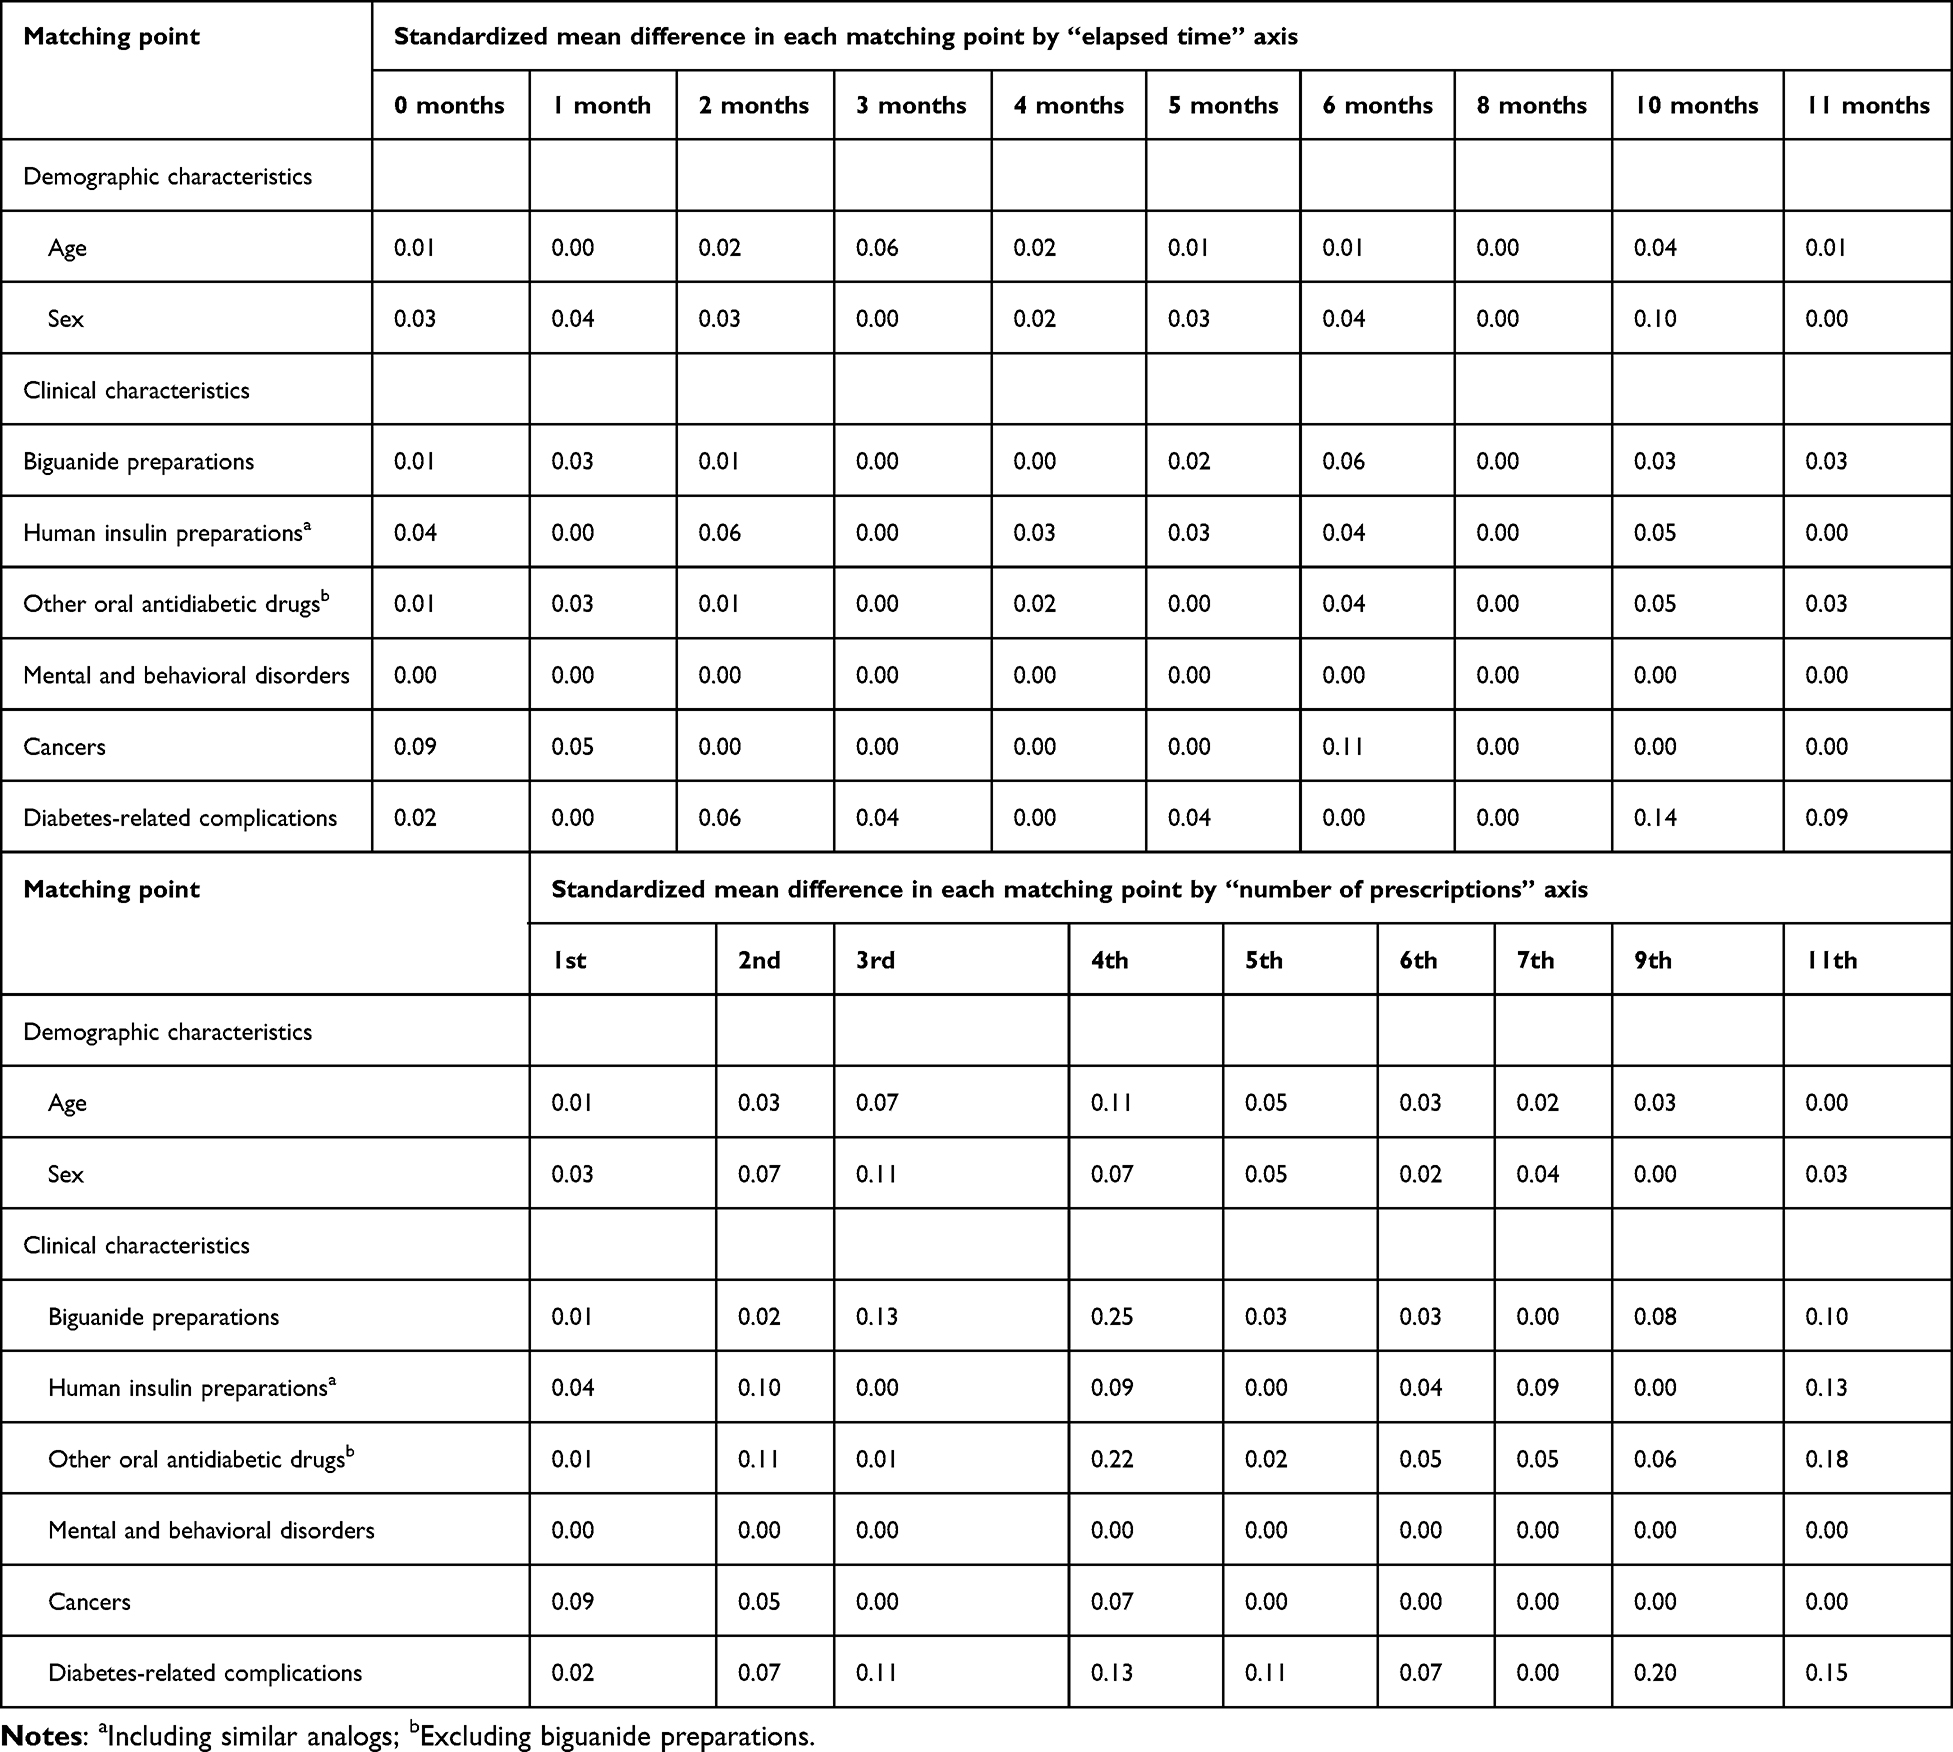 |
Table 1 Standardization of Background Variability Following PS Matching |
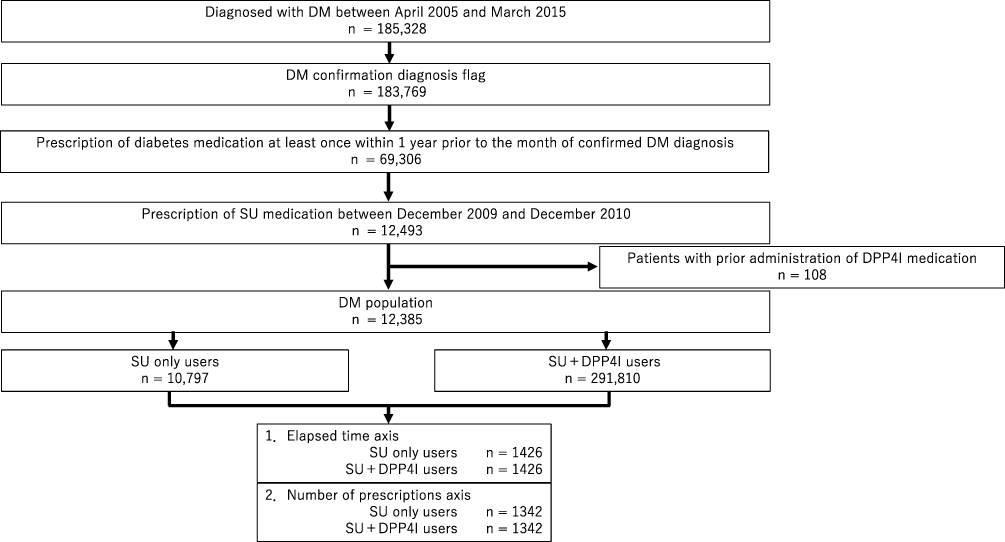 |
Figure 2 Selection of patients with DM and the final population analyzed in this study. Abbreviations: SU, sulfonylurea; DM, diabetes mellitus; DPP4I, dipeptidyl peptidase-4 inhibitor. |
Occurrence of Hypoglycemia
The incidence rates of hypoglycemia in SU-only and SU+DPP4I users were 0.21% and 0.42%, respectively, on the “elapsed time” axis. Similarly, on the “number of prescriptions” axis, the incidence rates were 0.30% for SU-only and 0.60% for SU+DPP4I users. The OR for the risk of hypoglycemia in SU+DPP4I users compared with that for SU-only users was 1.50 (95% CI 0.25–9.00) on the “elapsed time” axis and 1.67 (95% CI 0.40–7.00) on the “number of prescriptions” axis (Table 2). Figure 3 shows the patient selection process, construction of datasets through PS matching, and proportions and estimated OR of hypoglycemia in each dataset.
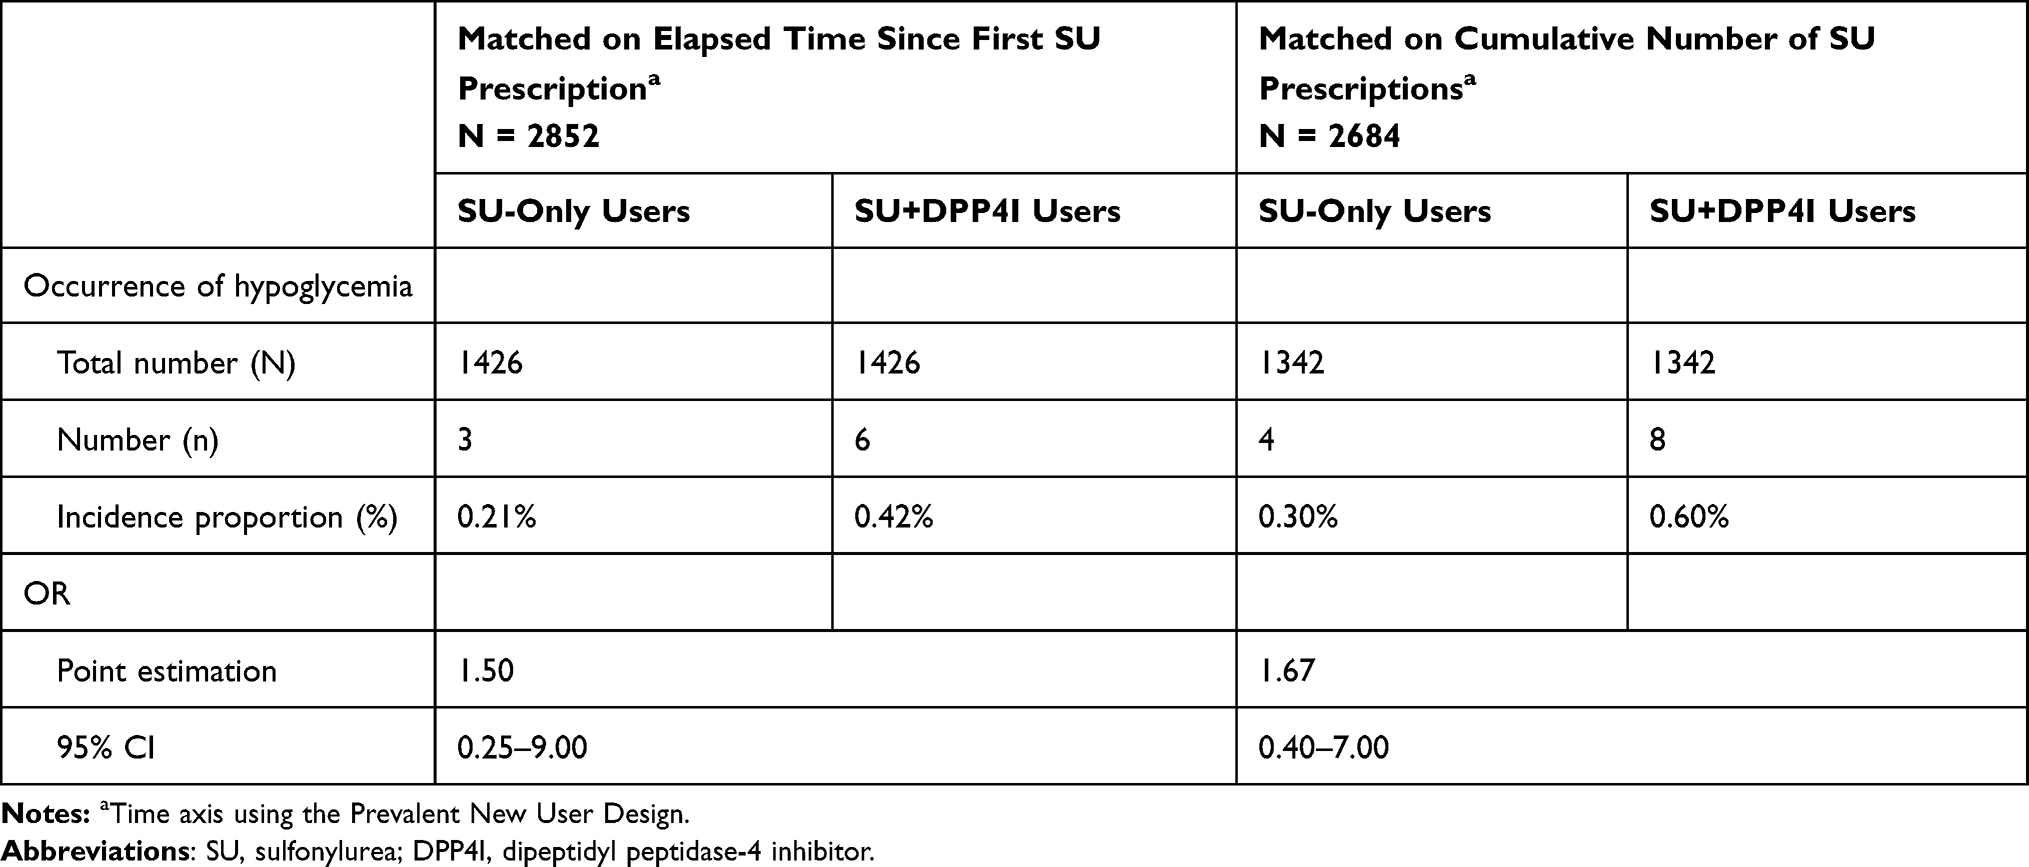 |
Table 2 Incidence Number, Incidence Proportion, Odds Ratio, and 95% Confidence Interval of Hypoglycemia for SU-Only Users and SU+DPP4I Users Using Each Timeframe |
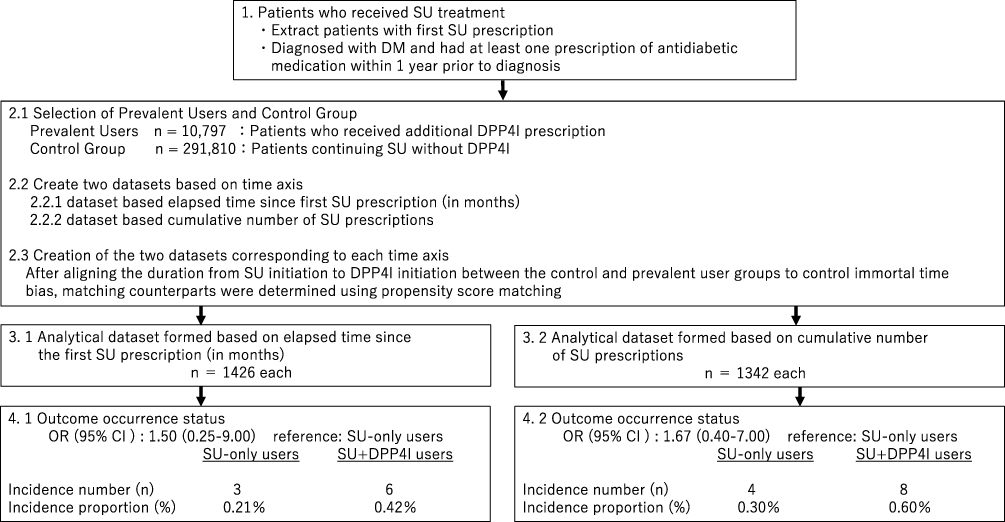 |
Figure 3 Patient selection process, dataset creation through propensity score matching, and estimated incidence of hypoglycemia and odds ratio derived from each dataset. Abbreviations: SU, sulfonylurea; DM, diabetes mellitus; DPP4I, dipeptidyl peptidase-4 inhibitor; OR, odds ratio; CI, confidence interval. |
Comparison of Background Characteristics Between SU- and DPP4I-Using Patients Extracted by the New User Design
With the New User Design, 5,788 new users were extracted from 10,797 patients receiving SUs, indicating a significant reduction in the number of new users identified. PS matching assigned 1,588 new users to each group. However, the status of diabetes medications other than SUs or DPP4Is before the month of the first administration differed significantly for each patient (Table 3).
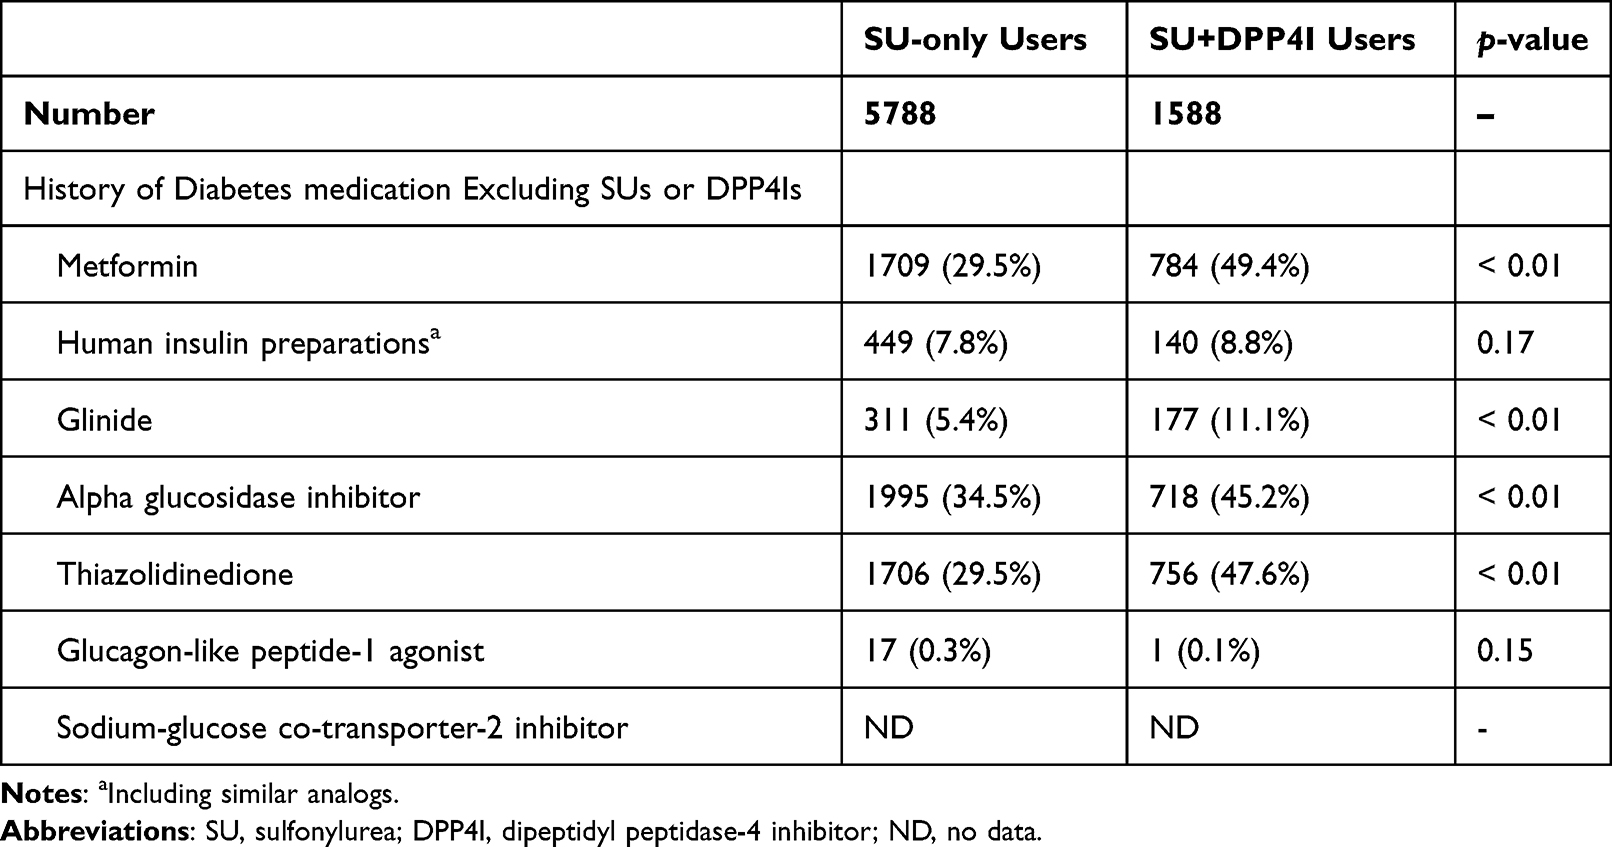 |
Table 3 Background of Patients Extracted by the New User Design |
Frequency of Examinations Following PS Matching
The average frequency of examinations after PS matching for SU-only and SU+DPP4I users was 0.54 ± 0.30 and 0.65 ± 0.30 visits, respectively, on the “elapsed time” axis, and 0.52 ± 0.28 and 0.64 ± 0.29, respectively, on the “number of prescriptions.” On both time axes, the frequency of examinations was significantly higher among the SU+DPP4I than the SU-only users (Table 4).
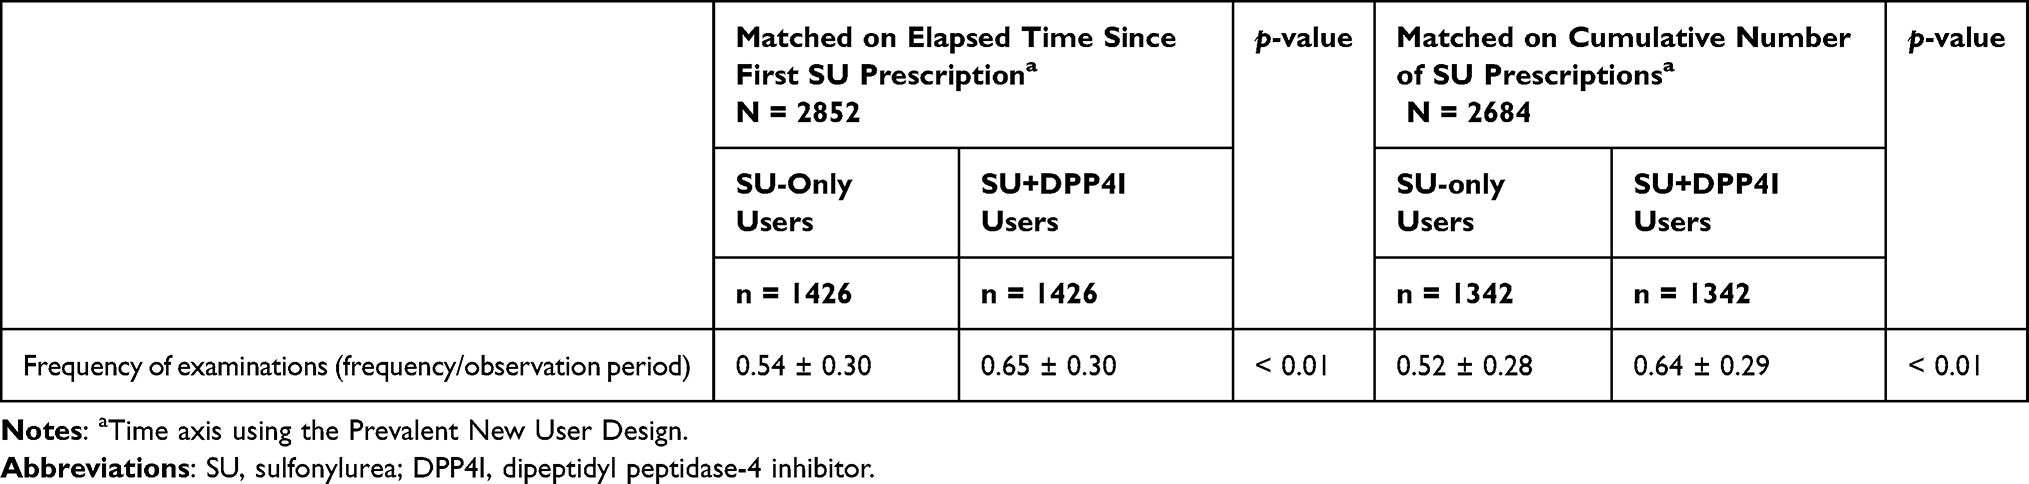 |
Table 4 Frequency of Examinations During the Observation Period in Each Analytical Population |
Discussion
We conducted a risk assessment using the Prevalent New User Design, focusing on the change in the first-line drug selection because of the introduction of new drugs and the temporal change in hypoglycemia risk following the related safety advisory. The results showed a non-significant increase in hypoglycemia risk associated with the addition of, or switch to, DPP4Is in patients receiving SUs. The results of a meta-analysis of previous RCTs showed a significant increase in the risk of hypoglycemia when adding, or switching to, DPP4Is;34 Additionally, the estimates of increased risk were consistent. Therefore, our results highlight the usefulness of the Prevalent New User Design. In addition, the “number of prescriptions axis” method could have a greater impact on the limitation of the number of prescription days for newly introduced medications.
This study used data obtained between December 2005 and March 2015, which may be considered relatively old. However, this was a conscious decision as there was a specific need to include data from the period between December 2009 to December 2010 in the study. The reasons for this and what was considered feasible were as follows. First, the introduction of DPP4Is led to changes in first-line treatment options, potentially resulting in differences in the patient population that were using SUs immediately after DPP4Is’ release (December 2009) as compared to more recent times.21 Second, a higher risk of severe hypoglycemia associated with the concomitant use of SUs was observed, particularly in the first year after the release of DPP4Is (from December 2009 to December 2010).22 Therefore, it was considered feasible to conduct this study using retrospective prescription data from April 2005 to March 2015, including the period from December 2009 to December 2010.
The incidence of the outcome in this study was rare, at 0.4–0.6%. Accordingly, a post hoc power calculation was performed, which indicated that approximately 20,000 patients per group would be necessary to detect an OR of 1.5 with 80% power at a two-sided alpha level of 0.05. As the actual sample size was smaller than this, the potential for insufficient statistical power should be acknowledged when interpreting the findings. However, notably, power calculations are not typically required for observational studies.35 This study was conducted in accordance with this principle, while also taking into account prior reports and performing analyses with appropriate methodological considerations.
The introduction of a new type of drug, DPP4Is, in December 2009 suggested a shift in first-line treatment of type 2 DM (T2DM) in Japan, transitioning from SUs to DPP4Is.21,22 Furthermore, the impact of safety advisories on prescription trends has been reported.23 In April 2010, the Japan Diabetes Society issued a safety advisory for the appropriate use of SUs and incretin-related drugs, which led to changes in the package insert in the same month.24,25 Consequently, a significant decrease in SU dosage both before and after the recommendation occurred.21,22 In addition, Kohro et al21 and Sato et al29 reported adverse events of hypoglycemia that peaked between December 2009 and November 2010 and then stabilized with a decrease in frequency of occurrence. Therefore, to address events that occurred between the administration of SUs and DPP4Is and compare their hypoglycemia risk using the new user design, the following two aspects that might have affected hypoglycemia risk over time after publication of the safety alert were considered: First, the population of new users could differ before and after DPP4I introduction due to changes in first-line drug treatment, which could lead to selection bias. Second, when selecting patients treated with DPP4Is, those with previous SU use who may have switched to DPP4Is might not have been accounted for, leading to ITB.19 To overcome the selection bias, we limited the timing of administration to after the launch of a new drug; ITB can be resolved using the Prevalent New User Design proposed by Suissa et al.20 To account for the temporal changes in the hypoglycemia risk associated with the issuance of the safety advisory, we focused on the period from December 2009 to December 2010, when the risk of hypoglycemia was estimated to be the highest, and used it as the target period for patient sampling. By limiting the patient sampling period, we aimed to suppress temporal changes in determining the risk of hypoglycemia. Furthermore, selection bias for new users in the same period could be controlled by limiting the patient selection period from December 2009 to December 2010. The New User Design excludes many patients from the extraction process.9,10
Previous studies reported that most patients were prevalent users with a history of drug administration from the same therapeutic class for the treatment of chronic diseases, while treatment-naïve patients were few.11,12 Therefore, the authors considered the reduction of sample size as one of the limitations of the New User Design and conducted a comparison with the Prevalent New User Design. Using the New User Design, 5,788 new users were extracted from a population of 10,797 patients receiving SUs, indicating a significant reduction in the number of new users identified. PS matching resulted in 1,588 new users for each group. The sample reduction during the extraction of new users of SUs was as expected; however, the final sample size was larger with the New User Design for patient extraction. This may be because the Prevalent New User Design performs PS matching at multiple points in time, resulting in fewer candidates at each time point. Conversely, the New User Design matched at a single time point: during first administration, when the candidate pool was the largest. This increases the number of suitable patients. However, the New User Design is not suitable for assessing the risk of taking both medications at the same time. In this study, the use of the Prevalent New User Design enabled the inclusion of prevalent users with a history of SU administration, who would have been excluded by the New User Design. We also considered the variability of drugs administered to the exposed and comparison groups as a limitation of the New User Design. The pre-index medication status of DM drugs for the SU or DPP4I treatment groups extracted using the New User Design was significantly different. Furthermore, because the new users of SUs in the present study had received SUs after the launch of DPP4Is, we cannot rule out the possibility of a population unable to receive first-line DPP4I treatment. In contrast, the prevalent users in this study started DPP4Is after SUs; therefore, the treatment history up to the initiation of DPP4Is reflects patients previously treated with SUs. The handling of drugs belonging to the same therapeutic class is not an issue with the Prevalent New User Design.13–16 Furthermore, since only patients treated with SU were included in the comparison group, other antidiabetic medications not involving SU were not included. Therefore, differences in patient characteristics because of drug choice from SU initiation to the matching point (for example, comparing metformin users with SU+DPP4I users) were not introduced in the Prevalent New User Design.17,18 Although the sample size was not per the authors’ expectations, the Prevalent New User Design was considered to address the limitations of the New User Design in terms of adjusting for patient background, which is important for comparative validity. Although the New User Design remains the gold standard for observational studies, we suggest the Prevalent New User Design as an alternative. In addition, the use of the Prevalent New User Design allowed for risk estimation that considered ITB, a factor that may impact the outcome36 and lead to inconsistencies between interventional and observational study results.37
In this study, the Prevalent New User Design was used as an effective method to control for ITB. However, in studies where exposure status changes over time or treatment switching occurs during follow-up, alternative methods such as the clone censoring weights approach have been proposed.38 In this method, artificial clones of each patient are created at baseline and censored when they deviate from their assigned exposure regimen, with appropriate weighting to account for informative censoring. This method can simultaneously address ITB, time-varying confounding, and selection bias due to censoring. On the other hand, in this study, the exposure status was fixed at the index date, and no subsequent treatment changes were considered. Therefore, we judged that the Prevalent New User Design alone was sufficient to appropriately control for ITB and evaluate the study outcomes. For studies involving changes in exposure or treatment switching, considering the clone censoring weights approach may allow for more comprehensive bias adjustment.
In Japan, there is a restriction on the number of prescription days imposed for the first year after the launch of a new drug.32 Given that the frequency of post-PS matching visits was different for each time axis under this prescription day restriction, the potential for measurement bias remained as SU+DPP4I users were scheduled for a visit every 14 days, making it easier to detect hypoglycemic events. The same measurement bias was also considered for the “elapsed time” axis. However, the possibility of selection bias was considered until PS matching. The frequency of DPP4I prescriptions, which require visits every 14 days, is generally low for patients with stable symptoms who visit the clinic every few months. Therefore, this study may have introduced a selection bias since patients who are stable on SUs are less likely to be selected as SU+DPP4I users. When PS matching is performed on the “number of prescriptions” axis, SU+DPP4I users are matched to patients with short-term prescriptions, while SU-only users are matched to patients with long-term prescriptions. Therefore, the “number of prescriptions” axis may be more sensitive to the limitation of the number of days of prescriptions for new drugs, which is a problem unique to Japan. The reason why hypoglycemia risk ORs were 1.50 (95% CI 0.25–9.00) on the “elapsed time” axis and 1.67 (95% CI 0.40–7.00) on the “number of prescriptions” axis can be explained by the effect of the prescription day restriction. Therefore, when using the Prevalent New User Design under prescription day limitations, it is important to select the time axis according to the actual prescription status of each drug.
In the present study, we evaluated the risk using a Prevalent New User Design for the epidemiological events between two drugs in the treatment of DM in the past and proposed its potential to detect the risk to be measured. In addition, the Prevalent New User Design can provide a potential solution to the abovementioned epidemiological problems and can be easily applied to situations such as the introduction of drug combinations for chronic diseases. In other words, the Prevalent New User Design can be effectively used for risk assessment in situations that commonly occur in clinical practice. Our results also suggest that the two time axes used in the Prevalent New User Design are affected by selection and measurement bias under the prescription-day limitation of new drugs unique to Japan. However, time-varying confounding factors should be addressed when using a Prevalent New User Design. We intend to conduct further research adopting a developmental perspective that considers measures to deal with measurement and selection biases, as well as measures to manage time-varying confounders.
This study has certain limitations. First, we did not consider the immortal time before November 2009. Second, the number of outcome occurrences for each method using the Prevalent New User Design was extremely small compared to previous studies,39–48 which could be due to the limitations of each method and variations in outcome definitions. In a large-scale survey of 9,956 Japanese patients with T2DM, the average patient age (mean ± standard deviation) was 65 ± 12 years, the proportion of female patients was 37.8%, and the prevalence of complications such as diabetic nephropathy, retinopathy, or peripheral neuropathy was 54.3%. In addition, 18.6% of the patients reportedly received human insulin or insulin analogs.49 Third, given the possible differences in patient characteristics, caution is warranted in generalizing our results. Fourth, regarding medication prescription patterns after PS matching, among SU+DPP4I users, switching from SUs to DPP4Is or the simultaneous use of SUs and DPP4Is was feasible. Therefore, it is important to consider the epidemiological background following the initiation of drug exposure, even among the same group of prevalent users.50 However, the limited number of outcome events made it difficult to conduct analyses that accounted for the change or simultaneous continuation of predominant consumer types. In addition, an intention-to-treat approach was used in the analysis: SU users who switched to DPP4Is or initiated concomitant use during the observation period were included. Fifth, using the time axis in the Prevalent New User Design under prescription duration limits specific to new medications was susceptible to selection and detection biases. Selection bias refers to the likelihood that individuals who were stable on SU medications were less likely to be chosen for DPP4I administration, whereas detection bias arose because of the different examination frequencies between SU-only and SU+DPP4I users after PS matching. Finally, in the Prevalent New User Design, which assumes the presence of treatment at multiple time points, it was necessary to take time-varying confounding factors into account; failure to do so might have introduced bias to the estimation of treatment effects. However, because time-varying confounders lie as intermediate factors between the treatment and outcome variables, adjusting for them might have also introduced bias in estimating treatment effects. Additionally, we adopted a Prevalent New User Design considering the patients’ previous treatment history. However, there was a limitation in that we could not obtain information regarding the patients’ perceptions of treatment before initiating therapy.
In a previous study by Hernán et al, cluster of differentiation 4 test data was a time-varying confounding factor.51 In the present study, time-varying confounders included laboratory test data such as HbA1c and blood glucose levels. The Marginal Structural Model, which models the distribution of counterfactual variables, has been proposed as a causal approach to estimating the effects of repeated treatments in the presence of time-varying confounders.52 One way to address time-varying confounders is to implement the inverse probability of a treatment-weighted method.51,53–55 The Prevalent New User Design is used to avoid ITB; subsequently, MSM can be applied to adjust for time-varying confounders and treatment switching during follow-up. The sequential application of these two methods is believed to yield more accurate estimates that are closer to the true effect.
Conclusion
Our study suggests that the Prevalent New User Design, as opposed to an RCT-like setting, can be an effective application for risk assessment in real-world situations and may offer an alternative to New User Design when there is a change or novel development in the treatment of chronic diseases. In addition, given the limitation of the number of days of prescription for new drugs, our results suggest that it is important to select a timeline according to the actual prescription scenario.
Abbreviations
ATC, Anatomical Therapeutic Chemical Classification; DPP4I, dipeptidyl peptidase-4 inhibitors; HbA1c, hemoglobin A1c; HRT, hormone replacement therapy; ICD-10, International Statistical Classification of Diseases 10th revision; ITB, immortal time bias; JMDC, Japan Medical Data Center database; OR, odds ratio; PS, propensity score; RCT, randomized controlled trial; SU, sulfonylureas; T2DM, type 2 diabetes mellitus.
Data Sharing Statement
The data that support the findings of the study are available from the corresponding author upon reasonable request.
Institutional Review Board Statement
This study was conducted with the approval and ongoing supervision of the Meiji Pharmaceutical University Research Ethics Committee (Approval number: 202004).
Acknowledgments
This study utilized a database constructed by the JMDC, and permission was obtained to use the data.
Author Contributions
All authors made a significant contribution to the work reported, whether in the conception, study design, execution, acquisition of data, analysis and interpretation, or all these areas; took part in drafting, revising or critically reviewing the article; gave final approval of the version to be published; have agreed on the journal to which the article has been submitted; and agree to be accountable for all aspects of the work. All authors have read and agreed to the published version of the manuscript.
Funding
This research received no external funding.
Disclosure
In relation to the publication of this paper, Takuma Koinuma has no conflicts of interest. Manabu Akazawa has business outsourcing and advisory contracts with Astellas Pharma Inc., Janssen Pharmaceutical K.K., Shionogi & Co., Ltd., GlaxoSmithKline plc., and Mitsubishi Tanabe Pharma Corporation, from which he receives compensation.
References
1. Rogers AS. Adverse drug events: identification and attribution. Drug Intell Clin Pharm. 1987;21(11):915–920. doi:10.1177/106002808702101114
2. Lao KS, Chui CS, Man KK, Lau WC, Chan EW, Wong IC. Medication safety research by observational study design. Int J Clin Pharm. 2016;38(3):676–684. doi:10.1007/s11096-016-0285-6
3. Suissa S. Immortal time bias in pharmaco-epidemiology. Am J Epidemiol. 2008;167(4):492–499. doi:10.1093/aje/kwm324
4. Grodstein F, Manson JE, Colditz GA, Willett WC, Speizer FE, Stampfer MJ. A prospective, observational study of postmenopausal hormone therapy and primary prevention of cardiovascular disease. Ann Intern Med. 2000;133(12):933–941. doi:10.7326/0003-4819-133-12-200012190-00008
5. Grundy SM, Balady GJ, Criqui MH, et al. Guide to primary prevention of cardiovascular diseases. A statement for healthcare professionals from the Task Force on Risk Reduction. American Heart Association Science Advisory and Coordinating Committee. Circulation. 1997;95(9):2329–2331. doi:10.1161/01.cir.95.9.2329
6. Hulley S, Hulley S, Grady D, et al. Randomized trial of estrogen plus progestin for secondary prevention of coronary heart disease in postmenopausal women. Heart and Estrogen/progestin Replacement Study (HERS) Research Group. JAMA. 1998;280(7):605–613. doi:10.1001/jama.280.7.605
7. Manson JE, Hsia J, Johnson KC, et al. Estrogen plus progestin and the risk of coronary heart disease. N Engl J Med. 2003;349(6):523–534. doi:10.1056/NEJMoa030808
8. Ray WA. Evaluating medication effects outside of clinical trials: new-user designs. Am J Epidemiol. 2003;158(9):915–920. doi:10.1093/aje/kwg231
9. Baksh S, Wen J, Mansour O, et al. Dipeptidyl peptidase-4 inhibitor cardiovascular safety in patients with type 2 diabetes, with cardiovascular and renal disease: a retrospective cohort study. Sci Rep. 2021;11(1):16637. doi:10.1038/s41598-021-95687-z
10. Kim YG, Yoon D, Park S, et al. Dipeptidyl peptidase-4 inhibitors and risk of heart failure in patients with type 2 diabetes mellitus: a population-based cohort study. Circ Heart Fail. 2017;10(9):e003957. doi:10.1161/CIRCHEARTFAILURE.117.003957
11. Gokhale M, Buse JB, Gray CL, Pate V, Marquis MA, Stürmer T. Dipeptidyl-peptidase-4 inhibitors and pancreatic cancer: a cohort study. Diabetes Obes Metab. 2014;16(12):1247–1256. doi:10.1111/dom.12379
12. Sørensen R, Gislason G, Torp-Pedersen C, et al. Dabigatran use in Danish atrial fibrillation patients in 2011: a nationwide study. BMJ Open. 2013;3(5):e002758. doi:10.1136/bmjopen-2013-002758
13. Dawwas GK, Hennessy S, Brensinger CM, et al. Comparative safety of dipeptidyl peptidase-4 inhibitors and sudden cardiac arrest and ventricular arrhythmia: population-based cohort studies. Clin Pharmacol Ther. 2022;111(1):227–242. doi:10.1002/cpt.2381
14. Ito Y, Van Schyndle J, Nishimura T, Sugitani T, Kimura T. Real-world effectiveness of sodium glucose co-transporter-2 inhibitors in Japanese patients with diabetes mellitus. Diabetes Ther. 2019;10(6):2219–2231. doi:10.1007/s13300-019-00708-w
15. Kashiwagi A, Shoji S, Kosakai Y, Koga T, Asakawa K, Rokuda M. Cardiometabolic risk reductions in patients with type 2 diabetes mellitus newly treated with a sodium-glucose cotransporter 2 inhibitor versus a dipeptidyl peptidase-4 inhibitor: a real-world administrative database study in Japan. J Diabetes Investig. 2023;14(3):404–416. doi:10.1111/jdi.13952
16. Toh S, Toh S, Hampp C, et al. Risk for hospitalized heart failure among new users of saxagliptin, sitagliptin, and other antihyperglycemic drugs: a retrospective cohort study. Ann Intern Med. 2016;164(11):705–714. doi:10.7326/M15-2568
17. Kubota S, Haraguchi T, Kuwata H, et al. Association of dipeptidyl peptidase-4 inhibitor use and risk of pancreatic cancer in individuals with diabetes in Japan. J Diabetes Investig. 2023;14(1):67–74. doi:10.1111/jdi.13921
18. Udell JA, Yuan Z, Rush T, Sicignano NM, Galitz M, Rosenthal N. Cardiovascular outcomes and risks after initiation of a sodium glucose cotransporter 2 inhibitor: results from the easel population-based cohort study (evidence for cardiovascular outcomes with sodium glucose cotransporter 2 inhibitors in the real world). Circulation. 2018;137(14):1450–1459. doi:10.1161/CIRCULATIONAHA.117.031227
19. Lévesque LE, Hanley JA, Kezouh A, Suissa S. Problem of immortal time bias in cohort studies: example using statins for preventing progression of diabetes. BMJ. 2010;340:b5087. doi:10.1136/bmj.b5087
20. Suissa S, Moodie EE, Dell’Aniello S. Prevalent new-user cohort designs for comparative drug effect studies by time-conditional propensity scores. Pharmacoepidemiol Drug Saf. 2017;26(4):459–468. doi:10.1002/pds.4107
21. Kohro T, Yamazaki T, Sato H, et al. Trends in antidiabetic prescription patterns in Japan from 2005 to 2011. Int Heart J. 2013;54(2):93–97. doi:10.1536/ihj.54.93
22. Sato D, Sato Y, Masuda S, Kimura H. Effects of a sitagliptin safety alert on prescription behaviour for oral antihyperglycaemic drugs: a propensity score-matched cohort study of prescription receipt data in Japan. Drug Saf. 2013;36(8):605–615. doi:10.1007/s40264-013-0068-0
23. Leal I, Romio SA, Schuemie M, Oteri A, Sturkenboom M, Trifirò G. Prescribing pattern of glucose lowering drugs in the United Kingdom in the last decade: a focus on the effects of safety warnings about rosiglitazone. Br J Clin Pharmacol. 2013;75(3):861–868. doi:10.1111/j.1365-2125.2012.04401.x
24. Nittokya. The Proper Use of Incretin and SU Drugs. Japan: japan Diabetes Society (a public interest incorporated foundation). 2010. Available from: https://www.nittokyo.or.jp/uploads/files/recommendation_incretin.pdf.
25. PMDA. Safety Division Notification No. 427001. Japan: Pharmaceutical and Food Safety Bureau, MHLW. 2010. Available from: http://www.info.pmda.go.jp/kaitei/kaitei20100427.html.
26. Wake M, Oh A, Onishi Y, Guelfucci F, Shimasaki Y, Teramoto T. Adherence and persistence to hyperlipidemia medications in patients with atherosclerotic cardiovascular disease and those with diabetes mellitus based on administrative claims data in Japan. Atherosclerosis. 2019;282:19–28. doi:10.1016/j.atherosclerosis.2018.12.026
27. Yokoyama S, Tanaka Y, Nakagita K, Hosomi K, Takada M. Bleeding risk of warfarin and direct oral anticoagulants in younger population: a historical cohort study using a Japanese claims database. Int J Med Sci. 2018;15(14):1686–1693. doi:10.7150/ijms.28877
28. Nagai K, Tanaka T, Kodaira N, Kimura S, Takahashi Y, Nakayama T. Data resource profile: JMDC claims database sourced from health insurance societies. J Gen Fam Med. 2021;22(3):118–127. doi:10.1002/jgf2.422
29. Sato D, Sato Y, Masuda S, Kimura H. Impact of the sitagliptin alert on prescription of oral antihyperglycemic drugs in Japan. Int J Clin Pharm. 2012;34(6):917–924. doi:10.1007/s11096-012-9694-3
30. Yokote K, Suzuki R, Gouda M, Iijima H, Yamazaki A, Inagaki M. Association between glycemic control and cardiovascular events in older Japanese adults with diabetes mellitus: an analysis of the Japanese medical administrative database. J Diabetes Investig. 2021;12(11):2036–2045. doi:10.1111/jdi.13575
31. Ikeda Y, Kubo T, Oda E, Abe M, Tokita S. Incidence rate and patient characteristics of severe hypoglycemia in treated type 2 diabetes mellitus patients in Japan: retrospective Diagnosis Procedure Combination database analysis. J Diabetes Investig. 2018;9(4):925–936. doi:10.1111/jdi.12778
32. Ministry of Health, Labour and Welfare Notification. Regulations on insurance medical institutions and insurance medical care, Ministry of Health, Labour and Welfare Notification No. 97 of March 19, 2008. Tokyo: Ministry of Health, Labour and Welfare; 2008.
33. Austin PC. An introduction to propensity score methods for reducing the effects of confounding in observational studies. Multivariate Behav Res. 2011;46(3):399–424. doi:10.1080/00273171.2011.568786
34. Salvo F, Moore N, Arnaud M, et al. Addition of dipeptidyl peptidase-4 inhibitors to sulphonylureas and risk of hypoglycaemia: systematic review and meta-analysis. BMJ. 2016;353:i2231. doi:10.1136/bmj.i2231
35. Hernán MA. Causal analyses of existing databases: no power calculations required. J Clin Epidemiol. 2022;144:203–205. doi:10.1016/j.jclinepi.2021.08.028
36. Suissa S, Azoulay L. Metformin and the risk of cancer: time-related biases in observational studies. Diabetes Care. 2012;35(12):2665–2673. doi:10.2337/dc12-0788
37. Dahabreh IJ, Sheldrick RC, Paulus JK, et al. Do observational studies using propensity score methods agree with randomized trials? A systematic comparison of studies on acute coronary syndromes. Eur Heart J. 2012;33(15):1893–1901. doi:10.1093/eurheartj/ehs114
38. Hernán MA. How to estimate the effect of treatment duration on survival outcomes using observational data. BMJ. 2018;360:k182. doi:10.1136/bmj.k182
39. Barnett AH, Huisman H, Jones R, von Eynatten M, Patel S, Woerle HJ. Linagliptin for patients aged 70 years or older with type 2 diabetes inadequately controlled with common antidiabetes treatments: a randomised, double-blind, placebo-controlled trial. Lancet. 2013;382(9902):1413–1423. doi:10.1016/S0140-6736(13)61500-7
40. Chacra AR, Tan GH, Apanovitch A, et al. Saxagliptin added to a submaximal dose of sulphonylurea improves glycaemic control compared with uptitration of sulphonylurea in patients with type 2 diabetes: a randomised controlled trial. Int J Clin Pract. 2009;63(9):1395–1406. doi:10.1111/j.1742-1241.2009.02143.x
41. Garber AJ, Foley JE, Banerji MA, et al. Effects of vildagliptin on glucose control in patients with type 2 diabetes inadequately controlled with a sulphonylurea. Diabetes Obes Metab. 2008;10(11):1047–1056. doi:10.1111/j.1463-1326.2008.00859.x
42. Hermansen K, Kipnes M, Luo E, et al. Efficacy and safety of the dipeptidyl peptidase-4 inhibitor, sitagliptin, in patients with type 2 diabetes mellitus inadequately controlled on glimepiride alone or on glimepiride and metformin. Diabetes Obes Metab. 2007;9(5):733–745. doi:10.1111/j.1463-1326.2007.00744.x
43. Kikuchi M, Haneda M, Koya D, et al. Efficacy and tolerability of vildagliptin as an add-on to glimepiride in Japanese patients with Type 2 diabetes mellitus. Diabet Res Clin Pract. 2010;89(3):216–223. doi:10.1016/j.diabres.2010.04.017
44. Lewin AJ, Arvay L, Liu D, Patel S, von Eynatten M, Woerle HJ. Efficacy and tolerability of linagliptin added to a sulfonylurea regimen in patients with inadequately controlled type 2 diabetes mellitus: an 18-week, multicenter, randomized, double-blind, placebo-controlled trial. Clin Ther. 2012;34(9):1909–1915. doi:10.1016/j.clinthera.2012.07.008
45. Owens DR, Swallow R, Dugi KA, Woerle HJ. Efficacy and safety of linagliptin in persons with type 2 diabetes inadequately controlled by a combination of metformin and sulphonylurea: a 24-week randomized study. Diabetes Med. 2011;28(11):1352–1361. doi:10.1111/j.1464-5491.2011.03387.x
46. Pratley RE, Kipnes MS, Fleck PR, Wilson C, Mekki Q, Alogliptin Study 007 Group. Efficacy and safety of the dipeptidyl peptidase-4 inhibitor alogliptin in patients with type 2 diabetes inadequately controlled by glyburide monotherapy. Diabetes Obes Metab. 2009;11(2):167–176. doi:10.1111/j.1463-1326.2008.01016.x
47. Seino Y, Hiroi S, Hirayama M, Kaku K. Efficacy and safety of alogliptin added to sulfonylurea in Japanese patients with type 2 diabetes: a randomized, double-blind, placebo-controlled trial with an open-label, long-term extension study. J Diabetes Investig. 2012;3(6):517–525. doi:10.1111/j.2040-1124.2012.00226.x
48. White WB, Cannon CP, Heller SR, et al. Alogliptin after acute coronary syndrome in patients with type 2 diabetes. N Engl J Med. 2013;369(14):1327–1335. doi:10.1056/NEJMoa1305889
49. Yokoyama H, Oishi M, Takamura H, et al. Large-scale survey of rates of achieving targets for blood glucose, blood pressure, and lipids and prevalence of complications in type 2 diabetes (JDDM 40). BMJ Open Diabetes Res Care. 2016;4(1):e000294. doi:10.1136/bmjdrc-2016-000294
50. Fisher A, Fralick M, Filion KB, et al. Sodium-glucose co-transporter-2 inhibitors and the risk of urosepsis: a multi-site, prevalent new-user cohort study. Diabetes Obes Metab. 2020;22(9):1648–1658. doi:10.1111/dom.14082
51. Hernán MA, Brumback B, Robins JM. Marginal structural models to estimate the causal effect of zidovudine on the survival of HIV-positive men. Epidemiology. 2000;11(5):561–570. doi:10.1097/00001648-200009000-00012
52. Robins J. Correcting for non-compliance in randomized trials using structural nested mean models. Commun Stat-Theor M. 1994;23(8):2379–2412. doi:10.1080/03610929408831393
53. Robins JM, Hernán MA, Brumback B. Marginal structural models and causal inference in epidemiology. Epidemiology. 2000;11(5):550–560. doi:10.1097/00001648-200009000-00011
54. Cole SR, Hernán MA. Constructing inverse probability weights for marginal structural models. Am J Epidemiol. 2008;168(6):656–664. doi:10.1093/aje/kwn164
55. Grafféo N, Latouche A, Geskus RB, Chevret S. Modeling time-varying exposure using inverse probability of treatment weights. Biom J. 2018;60(2):323–332. doi:10.1002/bimj.201600223
 © 2025 The Author(s). This work is published and licensed by Dove Medical Press Limited. The
full terms of this license are available at https://www.dovepress.com/terms
and incorporate the Creative Commons Attribution
- Non Commercial (unported, 4.0) License.
By accessing the work you hereby accept the Terms. Non-commercial uses of the work are permitted
without any further permission from Dove Medical Press Limited, provided the work is properly
attributed. For permission for commercial use of this work, please see paragraphs 4.2 and 5 of our Terms.
© 2025 The Author(s). This work is published and licensed by Dove Medical Press Limited. The
full terms of this license are available at https://www.dovepress.com/terms
and incorporate the Creative Commons Attribution
- Non Commercial (unported, 4.0) License.
By accessing the work you hereby accept the Terms. Non-commercial uses of the work are permitted
without any further permission from Dove Medical Press Limited, provided the work is properly
attributed. For permission for commercial use of this work, please see paragraphs 4.2 and 5 of our Terms.
Recommended articles

Utilization of Drugs with Pharmacogenetic Dosing Recommendations in Switzerland: A Descriptive Study Using the Helsana Database
Wittwer NL, Meier CR, Huber CA, Meyer zu Schwabedissen HE, Allemann S, Schneider C
Pharmacogenomics and Personalized Medicine 2022, 15:967-976
Published Date: 23 November 2022
Validity of the Updated Rx-Risk Index as a Disease Identification and Risk-Adjustment Tool for Use in Observational Health Studies
Widagdo I, Kerr M, Kalisch Ellett L, Schlegel C, Sadeqzadeh E, Wang A, Clarke AL, Pratt N
Clinical Interventions in Aging 2025, 20:309-323
Published Date: 19 March 2025