Back to Journals » International Journal of Nanomedicine » Volume 17
Estrone-Conjugated PEGylated Liposome Co-Loaded Paclitaxel and Carboplatin Improve Anti-Tumor Efficacy in Ovarian Cancer and Reduce Acute Toxicity of Chemo-Drugs
Authors Tang H, Xie Y, Zhu M, Jia J, Liu R, Shen Y, Zheng Y, Guo X, Miao D, Pei J ![]()
Received 17 February 2022
Accepted for publication 27 June 2022
Published 7 July 2022 Volume 2022:17 Pages 3013—3041
DOI https://doi.org/10.2147/IJN.S362263
Checked for plagiarism Yes
Review by Single anonymous peer review
Peer reviewer comments 2
Editor who approved publication: Dr Mian Wang
Huan Tang, Yizhuo Xie, Ming Zhu, Juan Jia, Rui Liu, Yujia Shen, Yucui Zheng, Xin Guo, Dongfanghui Miao, Jin Pei
Department of Biopharmacy, School of Pharmaceutical Sciences, Jilin University, Changchun, People’s Republic of China
Correspondence: Jin Pei, Department of Biopharmacy, School of Pharmaceutical Sciences, Jilin University, 1163 Xinmin Street, Changchun, 130021, People’s Republic of China, Tel +86 431 85619725, Email [email protected]
Purpose: Ovarian cancer is the most lethal gynecologic malignancy. The combination of paclitaxel (PTX) and carboplatin (CBP) is the first-line remedy for clinical ovarian cancer. However, due to the limitations of adverse reaction and lacking of targeting ability, the chemotherapy of ovarian cancer is still poorly effective. Here, a novel estrone (ES)-conjugated PEGylated liposome co-loaded PTX and CBP (ES-PEG-Lip-PTX/CBP) was designed for overcoming the above disadvantages.
Methods: ES-PEG-Lip-PTX/CBP was prepared by film hydration method and could recognize estrogen receptor (ER) over-expressing on the surface of SKOV-3 cells. The characterizations, stability and in vitro release of ES-PEG-Lip-PTX/CBP were studied. In vitro cellular uptake and its mechanism were observed by fluorescence microscope. In vivo targeting effect in tumor-bearing mice was determined. Pharmacokinetics and biodistribution were studied in ICR mice. In vitro cytotoxicity and in vivo anti-tumor efficacy were evaluated on SKOV-3 cells and tumor-bearing mice, respectively. Finally, the acute toxicity in ICR mice was explored for assessing the preliminary safety of ES-PEG-Lip-PTX/CBP.
Results: Our results showed that ES-PEG-Lip-PTX/CBP was spherical shape without aggregation. ES-PEG-Lip-PTX/CBP exhibited the optimum targeting effect on uptake in vitro and in vivo. The pharmacokinetics demonstrated ES-PEG-Lip-PTX/CBP had improved the pharmacokinetic behavior. In vitro cytotoxicity showed that ES-PEG-Lip-PTX/CBP maximally inhibited SKOV-3 cell proliferation and its IC50 values was 1.6 times lower than that of non-ES conjugated liposomes at 72 h. The in vivo anti-tumor efficacy study demonstrated that ES-PEG-Lip-PTX/CBP could lead strong SKOV-3 tumor growth suppression with a tumor volume inhibitory rate of 81.8%. Meanwhile, acute toxicity studies confirmed that ES-PEG-Lip-PTX/CBP significantly reduced the toxicity of the chemo drugs.
Conclusion: ES-PEG-Lip-PTX/CBP was successfully prepared with an optimal physicochemical and ER targeting property. The data of pharmacokinetics, anti-tumor efficacy and safety study indicated that ES-PEG-Lip-PTX/CBP could become a promising therapeutic formulation for human ovarian cancer in the future clinic.
Keywords: ovarian cancer, combination therapy, drug delivery system, liposome, estrogen receptor
Graphical Abstract:

Introduction
Ovarian cancer is the fifth leading cause of cancer-related mortality in women worldwide with the ratio of 15–20 per 100,000.1,2 It is the most lethal malignancy in all the gynecological tumors.3 Less than one-half of patients survive for more than five years after diagnosis.4 Current treatment for ovarian cancer remains surgery followed by combined chemotherapy.5,6 The therapeutic regimen appears to be initially effective in a high number of patients, but nearly 70% of the people suffer a relapse within a few months after initial treatment.7,8
Combination chemotherapy for the treatment of cancer has been widely applied to clinic, which could increase therapeutic efficacy and reduce the drug resistance over single-drug chemotherapy.9–12 Paclitaxel (PTX) and carboplatin (CBP) combined chemotherapy is first-line cancer chemotherapy regimen for ovarian cancer.13,14 PTX induces cell cycle arrest at the G2/M phase by suppressing dynamic instability of microtubules resulting in cell apoptosis, whereas CBP interferes with DNA transcription by reacting with DNA to form cross-linking DNA, which triggers apoptosis.15 Both drugs play different mechanisms in the inhibition growth of ovarian cancer,16,17 thereby producing a synergistic anti-tumor effect via triggering different apoptosis signaling pathways and the potential to decrease the drug resistance.18 While like all the chemo-therapy, the PTX and CBP combined chemotherapy also has severe side effects and adverse reactions,19 such as bone marrow inhibition, neuropathy and kidney toxicity.20,21 Therefore, a more effective and better-tolerated chemo-therapy is urgently needed in clinical.
Nanoparticle drug delivery system, such as liposomes,22 micelles,23 dendrimers,24 nanocapsules,25 nanotubes26 and artificial cells27 etc, which could passively target the tumor site through the enhanced permeability and retention (EPR) effect,28 has become the hotspot for many years.29 Nanomaterials were extensively studied and applied to specific administration routes. Based on the improvement of nanoparticle safety, biopolymers and natural extracts have been widely accepted. For example, animal and plant-derived polymers (such as natural rubber, chitosan and cellulose) were developed for transdermal drug delivery, which were non-toxic and have good compatibility with human skin surface.30 Some plant-derived extracts have also been applied to the preparation of metal nanoparticles to form a non-toxic green synthesis technology.31 With the development of nanotechnology, nanomaterials were also used as nanosensors for the detection of amino acids, proteins and peptides. Meanwhile, amino acids, peptides and proteins have been studied for targeting drug or gene delivery, with stronger biocompatibility and tumor targeting capabilities, which might help to overcome many shortcomings of traditional delivery systems.32 In addition, RNA-based nanoparticles also showed great potential in improving cancer diagnosis and treatment.33 At present, drug delivery systems for targeting therapy of ovarian cancer included nanoparticles, liposomes, nano-micelles, branched dendrimers, nanocapsules and nanostructured lipid preparations.34
Among the nanocarriers used for drug delivery, liposomes are the most promising one because of the non-toxic, non-immunogenic, high loading capacity for drugs with different physical and chemical properties.35,36 In addition, the various research groups have focused on combination drug delivery. Among various nanomaterials, lipid materials and amphiphilic polymers composed of both hydrophilic and hydrophobic segments were able to achieve the aim.37 For example, Cai et al devised three-layered telodendrimer nanocarrier for the effective co-delivery of PTX and cisplatin.38 Khan et al prepared lipid-polymer hybrid nanoparticles (LPHNP) for co-delivery of curcumin and cisplatin.39 However, the advantage of liposomes also was that they could load two drugs of distinct properties for achieving simultaneous transport. Therefore, the use of liposomes to achieve the delivery of chemo-drug is an efficient way, which can improve the therapeutic effect and reduce systemic toxicities.40 Unsatisfactorily, conventional liposomes are easy to be taken by the cells of mononuclear phagocyte system (MPS) so that they are rapidly removed from blood.41 In order to solve this problem, the surface of conventional liposomes is commonly coated with inert, biocompatible hydrophilic polymers, such as polyethylene glycol (PEG).42 PEG confers steric stabilization to the liposomal surface via formation of a protective layer so as to hinder the adsorption of protein opsonins in plasma and consequently PEGylation could improve the circulation time of the liposomal formulation.43
In addition, in order to promote the targeting ability to the specific tumor tissues, various targeting ligands, including peptides,44 proteins45 and antibodies,46 are introduced into liposomes to further overcome the non-specific distribution of anti-cancer drugs.47 Targeted drug delivery through receptor-mediated endocytosis is considered to be an important way to improve tumor targeting.48 The estrogen receptor (ER), which is distributed on the nucleus and the cell membrane,49 is expressed at high levels as compared to normal cells in many malignancy tumors, including ovarian cancers.50,51 As a kind of estrogen, estrone (ES) can specifically bind to the ER and has a high affinity to the ER.52 The presence of ER on the tumor cell membrane could be utilized for the treatment of ovarian cancer cells as a potential target for nanoparticle delivery of drugs. Therefore, using ES as a targeting ligand molecule in the liposomal delivery system could have the ability to deliver more chemotherapy drugs to the ovarian cancer tissues.
On the basis of the aforementioned understanding, ES-conjugated and PEGylated functionalized liposomes co-delivery PTX and CBP were designed for ovarian cancer therapy, which mainly overcame the disadvantage of conventional liposomes of lack of tumor targeting ability and reduced the side effects of combination chemotherapy. The size and morphology of nanoparticles were characterized. What is more, the stability, in vitro drug release behavior, in vitro cytotoxicity, in vitro cell uptake, uptake mechanism and in vivo targeting were evaluated. The pharmacokinetics, tissue distribution and the acute toxicity of ES-PEG-Lip-PTX/CBP were investigated in ICR mice. Moreover, the anti-tumor effect of the liposomes was studied in athymic NU/NU mice bearing SKOV-3 tumor. The aim of this work was utilizing ES-PEG-Lip as a nano carrier to co-delivery PTX and CBP to improve their combination therapeutic effect against ovarian cancer and the chemo-drugs’ safety profile. This liposomal formulation provides a novel strategy to deliver PTX and CBP for combination chemotherapy.
Materials and Methods
Materials
PTX, egg yolk lecithin and DiR were purchased from Meilun Biotechnology (Dalian, China). CBP was purchased from Shandong Boyuan Pharmaceutical Co., Ltd. (Jinan, China). 1, 2-distearoyl-sn-glycero-3-phosphoethanolamine-N- [amino (polyethylene glycol)-2000] (DSPE-PEG2000-NH2) and 1,2-distearoyl-sn-glycero-3-phosphoethanolamine-N- [methoxy (poly-ethylene glycol) 2000] (DSPE-mPEG2000) were purchased from Changchun Institute of Applied Chemistry, Chinese Academy of Sciences (Changchun, China). Estrone was purchased from TCI Development Co., Ltd. (Shanghai, China). Cholesterol was purchased from Shanghai Macklin Biochemical Co., Ltd. (Shanghai, China). Acetonitrile and methanol were purchased from Fisher Scientific (New York, USA). Chloroform was purchased from Chengdu Chron Chemical Co., Ltd. (Chengdu, China). Sodium chloride, potassium chloride, disodium hydrogen phosphate and potassium dihydrogen phosphate were purchased from Beijing Chemical Factory (Beijing, China). McCoy’ 5A medium was purchased from Biological Industries (Israel). Penicillin-Streptomycin and fetal bovine serum (FBS) were purchased from Shanghai ExCell Biological Products Co., Ltd. (Shanghai, China). CCK-8 was purchased from Invigentech (USA). Hoechst 33342 was purchased from Sigma-Aldrich (St. Louis, MO, USA). Rhodamine B (Rh B) was purchased from Shanghai Yuanye Biotechnology Co., Ltd. (Shanghai, China). All reagents were analytical or chromatographically pure grade unless otherwise stated.
Cell Culture
Human ovarian cancer cell line SKOV-3 was purchased from Procell Life Science (Wuhan, China). Cells were cultured in McCoy’ 5A medium supplemented with 1% penicillin-streptomycin (penicillin 100 U/mL and streptomycin 100 μg/mL) and 10% FBS at 37°C under circumstance of 5% CO2.
Determination of Combination Index (CI)
The optimal synergy ratio of PTX and CBP was analyzed in SKOV-3 cells using CCK-8 method. SKOV-3 cells in the logarithmic growth phase were seeded in a 96-well plate at a density of 5.0×10³ cells/well, and cultured overnight in an incubator at 37°C. PTX and CBP were mixed in different ratios, and the final concentration of PTX ranges were from 0.2 to 50.0 μM. The cells were treated with the solutions prepared above for 48 h. After the incubation, the drug-containing medium was replaced with 100.0 μL of freshly prepared medium containing 10.0 μL CCK-8 solutions, followed by incubation for 2 h, then a microplate reader (DNM-9602, Pu Lang, China) was used to detect the absorbance value at a wavelength of 450 nm. The CI was calculated to determine the best synergy ratio between the PTX and CBP according to the Chou–Talay equation (Equation 1).

In the equation, (D)1 and (D)2 represented the dose of each drug used in combination to achieve an inhibition effect, and (Dm)1 and (Dm)2 represented the dose of each drug used alone to achieve the same inhibition effect.
Preparation of Different Liposomes
Preparation of PTX and CBP Co-Loaded Liposomes
ES-PEG-Lip-PTX/CBP were prepared by thin film hydration method. Briefly, egg yolk lecithin, cholesterol, PTX, DSPE-mPEG2000 were dissolved with 10.0 mL of chloroform at a molar ratio of 15:5:1:1 in a pear-shaped flask. After being fully dissolved, the rotary evaporator slowly vacuumed to remove the chloroform to form a dry lipid film, then 5% glucose solution with a CBP concentration of 2.0 mg/mL was added to hydrate the dry lipid film at 37°C for 1 h, followed by vortex oscillation. The DSPE-PEG2000-ES solution (lipids: DSPE-PEG2000-ES = 200:1 molar ratio) prepared as described previously53 was incubated with the above liposome for 1 h at 37°C in a water bath. The liposomes were sonicated through the probe for 10 min. Finally, the liposomes were sterilized by filtration through 450 nm and 220 nm microporous membranes five times, respectively.
The PEGylated drug-loaded liposomes (PEG-Lip-PTX/CBP) and ES modified drug-loaded liposomes (ES-Lip-PTX/CBP) were prepared as the same procedures as above without DSPE-PEG2000-ES or DSPE-PEG2000, respectively. The unmodified drug-loaded liposomes (Lip-PTX/CBP) were prepared as the same procedures as above but without DSPE-PEG2000 and DSPE-PEG2000-ES.
Preparation of Rh B Liposomes
ES modified and Rh B-loaded PEGylated liposomes (ES-PEG-Lip-Rh B) were prepared by thin film hydration method. Briefly, precision weighing egg yolk lecithin, cholesterol, DSPE-mPEG2000 (molar ratio of 11:9:1) were dissolved in 10.0 mL chloroform. The lipid film was formed by rotary evaporation under 90 rpm 40°C. Rh B (lipids: Rh B = 30:1 molar ratio) was dissolved in 2.4 mL PBS to hydrate lipid film followed by vortex oscillation. The DSPE-PEG2000-ES (lipids: DSPE-PEG2000-ES = 200:1 molar ratio) was added to the liposome solution and incubated at 37°C for 1 h. The following procedures were performed as described in section of preparation of PTX and CBP co-loaded liposomes.
Preparation of DiR Liposomes
ES modified and DiR-loaded PEGylated liposomes (ES-PEG-Lip-DiR) were prepared as follows. Briefly, egg yolk lecithin, cholesterol, DSPE-mPEG2000 (molar ratio of 11:9:1) and 8.8 μL DiR (5.0 mg/mL) were dissolved in chloroform. The organic solvents were removed using a rotary evaporator in a 40°C water bath. The lipid film was hydrated with a PBS solution, followed by vortex oscillation. The DSPE-PEG2000-ES (lipids: DSPE-PEG2000-ES = 200:1 molar ratio) was added to the liposome solution and incubated at 37°C for 1 h. The following procedures were performed as described in section of preparation of PTX and CBP co-loaded liposomes.
Characterization of Liposomes
Particle size, polydispersity index (PDI), and zeta potential of different liposome formulations were evaluated by dynamic light scattering technique (DLS) (Malvern Instruments, the UK). For the morphology of the ES-PEG-Lip-PTX/CBP, transmission electron microscopy (TEM) (Tecnai Spirit Biotwin, Netherlands) was used to observe. One drop of ES-PEG-Lip-PTX/CBP which was diluted 100 times in ultra-pure water was deposited on copper grids and stained with phosphotungstic acid (3%, w/v) for 1 min. The liquid was absorbed with filter paper, then allowed to dry naturally for viewing. The morphology was recorded by TEM at 80 kV operating voltage.
Encapsulation Efficiency and Drug Loading
In order to determine the encapsulation efficiency (EE) and drug loading (DL) of liposomes, free PTX and CBP were removed by low-speed centrifugation and dialysis, respectively. In short, the liposomes which were diluted with 5% glucose solution were centrifuged at 3000 rpm for 10 min to remove free PTX, and the supernatant was added to 2.0 mL methanol with ultrasonic treatment for 10 min to demulsify. For free CBP, a dialysis bag (MWCO 8.0–14.0 kDa) containing 1.0 mL of liposomes was placed in a beaker with 1000.0 mL of 5% glucose solution and continued stirring. The liposomes in the dialysis bag were taken out and mixed with 3.0 mL of 3% TritonX-100 for ultrasonic treatment for 10 min. The drug concentrations of PTX and CBP were detected by HPLC (LC-20AT, Shimadzu, Kyoto, Japan) using a 5 μm ACE C18 column (250 × 4.6 mm), and the chromatographic method was validated according to the requirement of Chinese Pharmacopoeia, including specificity, limit of detection, limit of quantitation, intra- and inter-day precision, recovery rate, and so on. All the R2 values were >0.9990 in the standard curves. For PTX, the mobile phase consisted of 60% acetonitrile and 40% deionized water with a flow rate of 1.0 mL/min. For CBP, the mobile phase consisted of 5% acetonitrile and 95% deionized water with a flow rate of 1.0 mL/min. The formulas for calculating the EE (%) and DL (%) were as follows (Equation 2 and 3):


Stability of Liposomes
Physical Stability of ES-PEG-Lip-PTX/CBP
In order to evaluate the long-term stability of liposomes, the ES-PEG-Lip-PTX/CBP was stored at 4°C for 28 days. The particle size, PDI and zeta potential were measured at given time intervals by DLS.
The stability of ES-PEG-Lip-PTX/CBP was evaluated in three different media including PBS, PBS containing 10% FBS and complete medium (10% FBS + 90% McCoy’ 5A medium) at 37°C with shaking at 100 rpm. The samples were collected at predetermined time points (0, 2, 4, 8, 12, 24, and 48 h). The particle size, PDI and zeta potential values of the corresponding samples were immediately characterized by DLS.
Leakage Rate Study
In order to study the drug leakage of liposomes under different storage conditions, the liposomes were placed in 4°C and 25°C, respectively. At different time points, a part of the liposomes was taken out and the free drugs were removed according to the method in section of encapsulation efficiency and drug loading. The concentrations of PTX and CBP inside the liposomes were recorded as Cn (n = 0, 1, 2, 4, 8, 24 and 48 h). The drug leakage rate was represented by encapsulation efficiency changes which were calculated by the following equation (Equation 4):

In vitro Drug Release
The in vitro release of PTX and CBP from different liposome formulations was determined using dialysis method. A dialysis bag (MWCO 8.0–14.0 kDa) containing 1.0 mL of PTX/CBP, Lip-PTX/CBP, PEG-Lip-PTX/CBP, ES-Lip-PTX/CBP or ES-PEG-Lip-PTX/CBP solution was immersed in 100 mL of PBS (pH 7.4) containing 0.5% Tween 80 or not at 37°C with stirring at 100 rpm for the detection of released PTX or CBP. At the pre-designed time point of 1, 2, 4, 8, 12, 24 and 48 h, 1.0 mL release medium was collected, and replaced with an equal volume of fresh release medium. The released drugs were quantified by HPLC according to the methods described in section of encapsulation efficiency and drug loading.
In addition, the in vitro release of ES-PEG-Lip-PTX/CBP was also investigated under acidic conditions with pH 5.5 of PBS, and the rest of the steps were the same as described above.
In vitro Cytotoxicity
The CCK-8 assay was used to evaluate the cytotoxicity of blank ES-PEG-Lip, free PTX/CBP and various liposome preparations containing PTX and CBP on SKOV-3 cells. The cells were seeded in a 96-well plate at a density of 5.0×10³ per well. The cells were allowed to cover the bottom of the well, then exposed to blank ES-PEG-Lip, PTX/CBP, Lip-PTX/CBP, ES-Lip-PTX/CBP, PEG-Lip-PTX/CBP and ES-PEG-Lip-PTX/CBP at concentrations of 0.0625, 0.125, 0.25, 0.5, 1.0, 2.0, and 4.0 μM at 37°C and 5% CO2, respectively. After SKOV-3 cell incubation for 24, 48 and 72 h, the medicated medium was replaced by a fresh medium containing 10.0 μL of CCK-8, and continued to be incubated at 37°C for 2 h. The optical density (OD) was measured by microplate reader at 450 nm. Untreated cells with 100% cell viability were used as a control. All measurements were performed in triplicate. GraphPad Prism 7.0 software was used to calculate the half-maximal inhibitory concentration (IC50). Cell viability was calculated based on the optical density value using the following formula (Equation 5):

In vitro Cell Uptake
To evaluate the uptake efficiency of different liposomes, Rh B as a fluorescent marker, which could be directly visualized under fluorescence microscope, was encapsulated in the different liposome formulations. 5×10⁴ cells/well of SKOV-3 cells were seeded in a 24-well plate. After overnight incubation, the medium was replaced with a medium containing Rh B, Lip-Rh B, ES-Lip-Rh B, PEG-Lip-Rh B or ES-PEG-Lip-Rh B, and the concentration of Rh B in each well was 6.0 μg/mL. The cells continued to be incubated for 1 h, 2 h, 3 h and 4 h, respectively. After incubation, the cells were washed with cold PBS three times to ensure that no fluorescent dye remained outside the cells, and followed by adding 1.0 mL PBS containing 5.0 μL Hoechst 33342 fluorescent dye (1.0 mg/mL) for 30 min for staining nuclear. The excitation light wavelength of Hoechst 33342 and Rh B was 350 nm and 552 nm, respectively. The fluorescence intensity of the cells was observed and photographed through a fluorescence microscope (Ts2-FL, Nikon); then, Image J software was used for the data analysis.
In vitro Uptake Mechanism
The mechanism for the uptake of ES-PEG-Lip-Rh B by the SKOV-3 cells was investigated using endocytosis inhibitors of sucrose, genistein, amiloride and a competitive inhibitor of ES by a fluorescence microscope. Different chemical inhibitors were employed to block specific pathways of endocytosis. In briefly, 5.0×10⁴ cells/well of SKOV-3 cells were seeded in a 24 well plate and incubated at 37°C for 24 h before experiment. The cells were pretreated for 30 min with McCoy’ 5A containing one of the above inhibitor solutions. The concentration of endocytosis inhibitors in each well was 100.0 μg/mL. After the incubation, the cells were washed with cold PBS for three times, and incubated with the ES-PEG-Lip-Rh B for 2 h. Subsequently, a fluorescence microscope was used to observe the fluorescence intensity and take the pictures. The Image J software was used for the data analysis.
Animals
SPF female ICR mice (body weight 18–20 g) were purchased from the Liaoning Changsheng Biotechnology Co., Ltd. (Changchun, China). SPF female immunodeficient NU/NU mice (5–6 weeks old) were purchased from the Beijing Vital River Laboratory Animal Technology Co., Ltd. (Beijing, China). All animals were kept under clean breeding conditions with free access to food and water at 25°C under 12-hour dark/light cycle. The animals were acclimatized to the environment for one week before the start of the experiment. All animal procedures were performed in compliance with the China National Institute’s Guidelines on the Care and Use of Laboratory and were approved by the Animal Experimental Ethics Committee of Jilin University (Approval No. 20200052).
In vivo Targeting
In vivo targeting studies were performed using fluorescent probe of DiR. Briefly, 1.0×10⁷ SKOV-3 cells/100 µL were inoculated into the right lower abdomen of 5–6 weeks old female NU/NU mice for establishing the tumor model. When the tumor volume reached about 400 mm3, the mice were randomly divided into three groups of DiR, PEG-Lip-DiR or ES-PEG-Lip-DiR, which were intravenously injected at a dose of 0.11 µg DiR/g body weight via the tail vein. After 1, 2, 6, 12 and 24 h of administration, mice were anesthetized with 4.0% chloral hydrate for visualizing by fluorescence optical imaging using an IVIS Spectrum. Then, mice were sacrificed for ex vivo fluorescence distribution of the tumor, heart, liver, spleen, lungs and kidneys using the IVIS Spectrum. Meanwhile, the fluorescence intensity was quantified by the IVIS Spectrum.
Pharmacokinetics and Tissue Distribution
Plasma and Tissue Sample Collection
Pharmacokinetic and tissue distribution studies were conducted in female ICR mice with body weight of 18–20 g. Eighty-four mice were randomly divided into three groups (n = 3) and intravenously administrated with PTX/CBP, Lip-PTX/CBP, and ES-PEG-Lip-PTX/CBP at equal dose of 18.0 mg/kg PTX and 7.8 mg/kg CBP, respectively. After administration, blood samples were collected from the eye socket at predetermined time points of 0.0833, 0.25, 0.5, 1, 2, 4, 8, 12 h for PTX/CBP, 0.0833, 0.25, 0.5, 1, 2, 4, 8, 12, 24 h for Lip-PTX/CBP and 0.0833, 0.25, 0.5, 1, 2, 4, 8, 12, 24, 36, 48 h for ES-PEG-Lip-PTX/CBP. Blood was centrifuged at 3000 g for 10 min to obtain the plasma, and the plasma was stored at −20°C until HPLC analysis. After taking blood, main organs of heart, liver, spleen, lungs and kidneys were collected and stored at −20°C until HPLC analysis.
HPLC Method for Quantitative PTX and CBP
PTX and CBP in plasma and organs were analyzed by HPLC method, and the method was validated according to the requirement of Technical Guidelines for Non-clinical Pharmacokinetic Research of Drugs by Center for Drug Evaluation of NMPA (National Medical Products Administration) in China, including specificity, limit of detection, limit of quantitation, intra- and inter-day precision, recovery rate, stability, and so on. All the R2 values were >0.9990 in the standard curves for the drug detection of plasma, heart, liver, spleen, lungs and kidneys. The main organs were homogenized with normal saline (tissue weight:normal saline = 1:3 g/mL) to obtain tissue homogenate. For the detection of PTX, 100.0 μL of plasma or tissue homogenate sample was mixed with 5.0 μL of 0.1 mg/mL internal standard of norethindrone solution and vortexed for 1 min. Then, 1.0 mL methyl tert-butyl ether was added to precipitate protein under vigorous vortex for 2 min. The samples were centrifuged at 3000 rpm for 5 min. The supernatant was blown dry by nitrogen and re-dissolved by adding 100.0 μL of mobile phase of acetonitrile: deionized water at 60:40 for HPLC detection. For detection of CBP, 200.0 μL of plasma or tissue homogenate was transferred to a new centrifuge tube, and 10.0 μL of uridine as internal standard was added and vortexed. 50.0 μL of 28% zinc sulfate and 1.25 mL chloroform were used to precipitate the protein with vortex for 1 min. Then, the sample was centrifuged at 4000 rpm for 8 min. The supernatant was taken for HPLC detection. The mobile phase was 100% deionized water. The data were analyzed by PK Solver.54
Anti-Tumor in vivo
To evaluate the anti-tumor effect in vivo, ovarian cancer xenograft model was established by injecting 1.0×10⁷ SKOV-3 cells/mouse subcutaneously at the right abdomen of NU/NU mice. When the tumor reached about 50–100 mm3, the mice were randomly assigned to five groups (n = 5) of normal saline (control), PTX/CBP, Lip-PTX/CBP, PEG-Lip-PTX/CBP and ES-PEG-Lip-PTX/CBP. The mice received different formulations at a dose of 8.0 mg/kg PTX and 3.5 mg/kg CBP via the tail vein every other day for a total of five administrations. The tumor volume (V) was measured with a vernier caliper twice a week and the body weight was recorded. The tumor volume was calculated according to the following formula (Equation 6):

where A represents the longest dimension of the tumor, and B represents the shortest dimension of the tumor.
At 28 days after the first injection, blood samples were collected for blood routine test and blood biochemical analysis using a blood analyzer (HF-3800, Hai Li Fu, China) and automatic biochemical analyzer (HF-240, Hai Li Fu, China), respectively. Then, the tumors were stripped and photographed, followed by weighing to calculate the tumor inhibition rate (TIR) according to the following formula (Equation 7). The major organs of heart, liver, spleen, lungs, and kidneys were taken out and weighed to calculate the organ coefficient (OC) according to the following formula (Equation 8). Finally, all the tumor and main organs were fixed in 4.0% paraformaldehyde solutions. The samples were then embedded in paraffin and sectioned, and stained with hematoxylin and eosin (H&E) in accordance with standard protocols.

where Wdrug and Wcontrol are the tumor weights in drug treated group and control group, respectively.

Acute Toxicity in vivo
One hundred and sixty ICR mice were randomly divided into 4 groups, including normal saline group (control group), PTX/CBP, Lip-PTX/CBP, ES-PEG-Lip-PTX/CBP. The dose of PTX/CBP group was set at 20.0, 23.0, 26.0, 29.0, 32.0 mg/kg; the dose of Lip-PTX/CBP group was set at 46.0, 52.0, 58.0, 64.0, 70.0 mg/kg; and the dose of ES-PEG-Lip-PTX/CBP group was set at 49.0, 55.0, 61.0, 67.0, 73.0 mg/kg. The above doses were calculated based on the PTX content. The CBP dose was converted based on the molar ratio. Mice were given different concentrations of the above preparations via tail vein injection (n = 10). The mortality and weight changes were recorded for 14 days to determine median lethal concentration (LD50). LD50 was calculated to evaluate acute toxicity by SPSS software. On the 14th day after the administration, blood was taken into a 1.5 mL heparinized centrifuge tube from the eye socket of the surviving mice in the lowest dose groups administered with PTX/CBP, Lip-PTX/CBP and ES-PEG-Lip-PTX/CBP. Blood analyzer (BC2900, Mindray, China) was used to measure the content of red blood cell (RBC), white blood cell (WBC), platelet (PLT) and hemoglobin (HGB). Part of the blood was collected into the EP tube and the blood samples were centrifuged at 3000 rpm for 10 min to separate the serum after 30 min of standing. An automatic biochemical analyzer (BS850, Mindray, China) was used to determine the levels of alanine aminotransferase (ALT), aspartate aminotransferase (AST), urea nitrogen (BUN) and creatinine (Cre) in serum. Finally, the mice were sacrificed for collection of heart, liver, spleen, lungs and kidneys, then the organs were weighted to calculate OC according to Equation 8.
Statistical Analysis
Data were expressed as mean ± SD and were evaluated using Student’s t-test or one-way ANOVA followed by Tukey’s multiple comparison post-hoc test (GraphPad Prism version 7.0; GraphPad Software, La Jolla, CA, USA) to determine statistically significant differences. *p < 0.05 was represented statistically significant.
Results and Discussion
Determination of Combination Index (CI)
In order to investigate the optimal combination ratio of PTX and CBP, the molar ratios of 1:4, 1:2, 1:1, 2:1, 4:1 were used for cytotoxicity study. The cell survival rate of single PTX, CBP and the combination of the two drugs is shown in Figure 1A. Compared with the single drug, the cell survival rate of the combination group was lower at the ratios of 1:2 and 1:1, indicating that the combination of the PTX and CBP could enhance the cytotoxic effect on tumor cells. According to the results of cell survival rate, the IC50 value and CI of the drug were further calculated. The results were shown in Table S1 and Figure 1B. The IC50 values of a single PTX and CBP were 3.89 μM and 19.2 μM, respectively, and the IC50 of combination PTX and CBP at molar ratios of 1:1, 2:1, and 1:2 was significantly lower than that of a single drug with the values of 0.20, 1.04, 0.36 μM for PTX and 0.20, 0.52, 0.72 μM for CBP, respectively. As reported, the CI could provide a quantitative measure of how the two drugs interact. The CI value of minors, equal or above one indicates synergism, additive effects, and antagonism, respectively.55 All the combination ratios of PTX and CBP, the CI values were significantly less than 1, which proved that the PTX and CBP combination had a high synergistic effect. Among them, when the combination ratio was 1:1, the CI value of 0.06 was the lowest, indicating that the PTX and CBP could produce the best synergistic effect under this ratio. Therefore, PTX and CBP at 1:1 molar ratio was chosen as the optimized ratio for subsequent studies of liposome preparations.
 |
Figure 1 Combination index of PTX and CBP in SKOV-3 cells and characterization of liposomes. (A) Cell viability and (B) combination index treated with various ratios of PTX/CBP against SKOV-3 cells for 48 h. The data were presented as the mean ± SD (n = 3). ***p < 0.001, ****p < 0.0001. Size distribution graph of different liposome formulations, including (C) Lip-PTX/CBP, (D) ES-Lip-PTX/CBP, (E) PEG-Lip-PTX/CBP, and (F) ES-PEG-Lip-PTX/CBP. (G) Transmission electron microscopy image of ES-PEG-Lip-PTX/CBP. Scale bar: 200 nm. |
Characterization of Liposomes
The particle size, PDI, and zeta potential of the Lip-PTX/CBP, ES-Lip-PTX/CBP, PEG-Lip-PTX/CBP, and ES-PEG-Lip-PTX/CBP were measured. The results are shown in Table 1. The particle size is an important parameter for evaluating nano-formulations. The particle size of PTX/CBP co-loaded liposomes was between 100 nm and 120 nm. The average particle size of PEG-Lip-PTX/CBP and ES-PEG-Lip-PTX/CBP was 103.3 ± 0.5 nm and 105.4 ± 0.2 nm, respectively, which were lower than that of Lip-PTX/CBP and ES-Lip-PTX/CBP with the size of 112.3 ± 0.8 nm and 114.5 ± 1.2 nm, respectively. This could be explained by steric hindrance of strongly hydrated PEG.56 On the whole, nano-formulations having a particle size of 100–200 nm appeared to be more suitable for intravenous application, which could reduce the absorption of phagocytic cells and enhance drug exposure by prolonging blood circulation time. The PDI of Lip-PTX/CBP, ES-Lip-PTX/CBP, PEG-Lip-PTX/CBP, and ES-PEG-Lip-PTX/CBP were all less than 0.3 and had a narrow particle size distribution (Figure 1C–F), indicating that the prepared liposomes had a uniform particle size without aggregation.
 |
Table 1 Average Size, PDI and Zeta Potentials of Different Liposome Formulations |
The surface charge of nano-formulations is another important indicator characterized by nanoparticles, as the surface of nanoparticles is directly interacting with the biological environment. Nano-formulations with negative charge could decrease the interaction with plasma proteins, thereby reducing the possibility of monocyte and macrophages activating immune responses in blood.57 The surface potential of Lip-PTX/CBP, ES-Lip-PTX/CBP, PEG-Lip-PTX/CBP, and ES-PEG-Lip-PTX/CBP showed negative potential, which could provide a higher stability in vivo. It was noteworthy that PEG-Lip-PTX/CBP (−29.6 ± 0.2 mV) and ES-PEG-Lip-PTX/CBP (−29.6 ± 0.5 mV) had the less negative zeta potential, which might be explained by the modification of PEG molecule. PEG-coated liposomes showed low electrophoretic mobility is due to the hydrodynamic resistance given by this polymer.58 Besides that, without the hydrophilic polymer on the surface, the predominant negative charge presents in the structural lipids are exposed, leading to the reduction of the zeta potential for Lip-PTX/CBP (−32.9 ± 0.7 mV) and ES-Lip-PTX/CBP (−33.3 ± 0.4 mV).59
The morphology of ES-PEG-Lip-PTX/CBP was observed by TEM (Figure 1G). ES-PEG-Lip-PTX/CBP presented a spherical shape with uniform size and good dispersion. Particle size observed by TEM was basically consistent with that was measured by DLS.
Encapsulation Efficiency and Drug Loading
EE and DL were one of the most important parameters for evaluating liposome preparations. The key to determining the drug EE in liposomes was to separate the unencapsulated free drug. According to the different properties of the drug, free PTX was removed by low-speed centrifugation, and free CBP was removed by dialysis. The EE and DL results of PTX and CBP in Lip-PTX/CBP, ES-Lip-PTX/CBP, PEG-Lip-PTX/CBP, and ES-PEG-Lip-PTX/CBP are shown in Table 2. The EE of PTX and CBP were 78.5% and 47.6% in PEG-Lip-PTX/CBP, respectively. The EE of PTX and CBP were 79.6% and 48.9% in ES-PEG-Lip-PTX/CBP, respectively. Without adding of long-acting fragments, the EE of PTX and CBP could both decreased 3.0–4.0% which was because the liposomes were shielded by the steric effect of DSPE-mPEG2000 so that the stability of the lipid layer increased.58 Furthermore, Tunsirikongkon et al proved that the EE of all formulations was noticeably increased following the addition of DSPE-PEG.58 Our results were in accordance with this report. As a high lipophilicity drug, PTX was able to be delivered by a variety of nanoparticles, and the EE of PTX could reach about 60–80%, such as liposome,60 PLGA,61 bovine serum albumin nanoparticle,62 hydroxypropyl-β-cyclodextrin nanoparticles63 and so on. The encapsulation of hydrophilic drugs in nanoparticles was always an arduous task.64 Previous reports have shown the EE of CBP in some nanoparticles was about 20–50%, such as liposome,15 injectable hydrogel,64 polycaprolactone (PCL),65 amino-functionalized polyphosphazene66 and so on.
 |
Table 2 Encapsulation Efficiency and Drug Loading of Different Liposome Formulations |
The DL of PTX in Lip-PTX/CBP, ES-Lip-PTX/CBP, PEG-Lip-PTX/CBP and ES-PEG-Lip-PTX/CBP had a similar rate of 3.40%, 3.47%, 3.54%, and 3.60%, respectively. The DL values of CBP in different formulations were around 1.0%. The DL of the PEGylated liposomes also exhibited slightly higher than that of conventional liposomes. However, the addition of the DSPE-PEG2000-ES fragment had no influence on the EE and DL, which was mainly because the amount of DSPE-PEG2000-ES added was very little which was only 0.5% of the whole lipid components.
Stability of Liposomes
Physical Stability of ES-PEG-Lip-PTX/CBP
ES-PEG-Lip-PTX/CBP was stored at 4°C by detecting its particle size, PDI and zeta potential to determine the storage stability of ES-PEG-Lip-PTX/CBP. As shown in Figure 2A, the particle size of liposome was still less than 120 nm and PDI was below 0.2 without obvious change. There also was no obvious change in zeta potential (Figure 2B), which illustrated ES-PEG-Lip-PTX/CBP could be stably stored at 4°C for at least 28 days.
 |
Figure 2 Stability study of different liposome formulations. (A) The particle size, PDI and (B) zeta potential variation of ES-PEG-Lip-PTX/CBP at 4°C for 28 days. The variations of (C) PDI, zeta potential and (D) particle size of ES-PEG-Lip-PTX/CBP in PBS, PBS + 10% serum and medium + 10% serum. |
Particle size, PDI and zeta potential were determined to evaluate the stability of ES-PEG-Lip-PTX/CBP in three different media. As shown in Figure 2C and D, liposomes were relatively stable in PBS solution within 48 h, followed by small changes in particle size, PDI value and zeta potential, which met the requirements for intravenous injection. In PBS + 10% serum and medium + 10% serum group, the particle size, PDI value and zeta potential of liposomes increased with time going, and the changes became more obvious after 24 h. This might be due to the aggregation of various proteins in the serum, which had an effect on the particle size and PDI of the liposomes. According to the results of stability, the in vitro release behavior of PTX and CBP was studied using PBS as the release medium.
Leakage Rate Study
As shown in Figure 3A–D, the four liposome formulations of Lip-PTX/CBP, ES-Lip-PTX/CBP, PEG-Lip-PTX/CBP, and ES-PEG-Lip-PTX/CBP had a good stability under storage conditions at 4°C and 25°C. At 25°C, the leakage rates of PTX and CBP in the four liposomes were all less than 25% and the leakage rates of PTX and CBP in the four liposomes were all less than 20% at 4°C. This showed that liposomes were more suitable for storage at 4°C. In addition, compared with the non-long-acting liposomes, including Lip-PTX/CBP and ES-Lip-PTX/CBP, the leakage rate of the long-acting liposome of PEG-Lip-PTX/CBP and ES-PEG-Lip-PTX/CBP was lower at 4°C and 25°C, which might be due to the action of the long-acting fragment of DSPE-mPEG2000. The long-acting fragments were entangled on the surface of liposomes, making the liposome membrane structure more stable so as to reduce the leakage of the drugs.
 |
Figure 3 Leakage rate study. At 4°C, encapsulation efficiency changes of (A) PTX and (B) CBP in different liposome formulations. At 25°C, encapsulation efficiency changes of (C) PTX and (D) CBP in different liposome formulations. The data were presented as the mean ± SD (n = 3). |
In vitro Drug Release
PBS was used as the release medium to investigate the in vitro release rates of the PTX and CBP in co-loaded liposomes at 37°C and different pH values of 7.4 and 5.5. The results at pH 7.4 are shown in Figure 4A and B. The cumulative drug release rate was more than 90% at 8 h in PTX/CBP group, presented a fast and burst release. This release behavior was not conducive to the accumulation of drugs in tumor tissues. However, compared with the rapid release of PTX/CBP, all other groups of liposomes exhibited a sustained drug release behavior within 48 h. The release rate of PTX and CBP in the Lip-PTX/CBP and ES-Lip-PTX/CBP only reached 75% and 43%, respectively, within 48 h at pH 7.4, indicating liposomal delivery system could significantly reduce the release rate of drugs. Besides, compared with the Lip-PTX/CBP and ES-Lip-PTX/CBP group, the cumulative release rate of PTX and CBP in PEG-Lip-PTX/CBP and ES-PEG-Lip-PTX/CBP were approximately 58% and 33%, respectively, which exhibited a much lower release rate. This was considered that the sterically hindered DSPE-mPEG2000 had the shielding and protection effects on the liposome membrane structure, which made the release of the loaded drug relatively slow and was consistent with the result of the aforementioned leakage rate in section of leakage rate study. It was reported that most of the nanoparticles as delivery carriers can reduce the drug release rate. In recent decades, long-acting formulations with stable drug release profile were gaining much attention. PEG has been applied in plenty of delivery systems such as micelles, vesicles, nanoparticles and hydrogels.67 For example, Chen et al devised biodegradable PEG-poly(ω-pentadecalactone-co-p-dioxanone) nanoparticles which achieved the slow release of hydrophobic therapeutic agents.68 Yusuf Haggag et al prepared nanoparticles consisting of PLGA-PEG polymers to exhibit insulin sustainable release behaviors.69 By reducing drug release during systemic circulation, sustained and controlled drug release may be beneficial to anti-cancer treatment and deliver the majority of encapsulated drugs to a target site.70
 |
Figure 4 Cumulative release of (A) PTX and (B) CBP from different liposome formulations at pH 7.4. Cumulative release of (C) PTX and (D) CBP from ES-PEG-Lip-PTX/CBP at pH 5.5. The data were presented as the mean ± SD (n = 3). *p < 0.05, **p < 0.01, ***p < 0.001, ****p < 0.0001. |
What is more, compared with cumulative release at pH of 7.4, ES-PEG-Lip-PTX/CBP had a higher cumulative release at pH of 5.5 (Figure 4C and D). At pH 5.5 and 37°C, 86.5% of PTX and 66.6% of CBP were released from ES-PEG-Lip-PTX/CBP during the initial 48 h, and the release of PTX and CBP increased approximately 30% compared with that under the neutral condition, respectively. At all the time points, the release of PTX and CBP had been increased, indicating that ES-PEG-Lip-PTX/CBP exhibited a faster release behavior in an acidic environment. This was due to the presence of ester bonds in egg yolk lecithin leading to an acid-induced drug release because of the hydrolysis of ester bonds under acidic conditions, so that the stability of liposomes was influenced. The results were consistent with the data of Novohradsky et al.71 As we all know, the internal environment of endosomes/lysosomes is acidic (pH 5.5), therefore the release characteristics of ES-PEG-Lip-PTX/CBP were conducive to release of more drugs after intracellular uptake via the endocytosis.
In vitro Cytotoxicity
The cytotoxicity potential of blank liposome, free drugs and drug-loaded liposomes against SKOV-3 (ER-positive) cells72 was assessed by CCK-8 assay. As expected, over 90% of the cells survived with blank liposome during the incubation period, indicating that the blank liposomes had no cytotoxicity against SKOV-3 cells (Figure S1). It could be seen from the Figure 5A–C that all free drugs and drug-loaded liposomes showed dose-dependent and time-dependent inhibition of SKOV-3 cell proliferation. After incubation 24 h, PTX/CBP displayed a stronger lethality than Lip-PTX/CBP and PEG-Lip-PTX/CBP, with an IC50 of 0.905 µM compared to 1.054 µM for Lip-PTX/CBP and 1.314 µM for PEG-Lip-PTX/CBP (Table S2, Figure 5D–F), respectively. This could be attributed to lack of release process and quickly entering into tumor cells by a passive diffusion of free drug. On the contrary, liposomal formulations need time to release the drugs. For further observation, we found that ES modified liposomes, including ES-Lip-PTX/CBP (IC50: 0.717 µM) and ES-PEG-Lip-PTX/CBP (IC50: 0.854 µM), showed a higher toxicity than PTX/CBP, indicated that the addition of DSPE-PEG2000-ES significantly strengthened the cytotoxicity. However, with the extension of incubation time, in contrast to PTX/CBP, the toxicity of all the liposomal formulations to SKOV-3 cells was significantly enhanced at 48 h and 72 h, of which ES-PEG-Lip-PTX/CBP and ES-Lip-PTX/CBP were the most effective with an IC50 of 0.248 µM and 0.285 µM at 48 h and IC50 of 0.128 µM and 0.146 µM at 72 h, respectively. Furthermore, ES-Lip-PTX/CBP and ES-PEG-Lip-PTX/CBP showed stronger cytotoxicity than that of Lip-PTX/CBP and PEG-Lip-PTX/CBP at 24, 48 and 72 h. As mentioned above, after sufficient incubation time, liposomes had a stronger anti-proliferative effect on SKOV-3 cells. The introduction of ES targeted fragments could further strengthen the cell toxicity. This could be the result of overexpression of ER, which was the target of the DSPE-PEG2000-ES, on the surface of SKOV-3 cells. Therefore, the ER played a key role in successful internalization of PTX and CBP so as to increase the cytotoxicity by ES modified liposome.
 |
Figure 5 The in vitro cytotoxicity of different liposome formulations on SKOV-3 cells. Cell viability and IC50 values of SKOV-3 cells after treatment with various liposome formulations at (A and D) 24 h, (B and E) 48 h and (C and F) 72 h. The data were presented as the mean ± SD (n = 3). *p < 0.05, **p < 0.01, ***p < 0.001, ****p < 0.0001. |
In vitro Cell Uptake
To determine the effect of ES on the targeting of liposome formulations, the intracellular uptake of the formulations in SKOV-3 cells was investigated. Rh B was used as a visual fluorescent dye to label liposomes so that the liposomes exhibited red fluorescence for quantifying the cellular intake. Figure 6A–D represented the qualitative results of SKOV-3 cell uptake of each formulation observed by fluorescence microscope. With the extension of the incubation time (1–4 h), a significant increase in liposome uptake was observed, suggesting that the cellular intake was time-dependent. At each observation time point, compared with Rh B (as a control), the cells treated with liposomes showed a stronger red fluorescence, indicating that the SKOV-3 cells had more cellular uptake of liposomes. Obviously, cells treated with ES-PEG-Lip-Rh B were observed the stronger red fluorescent than that of PEG-Lip-Rh B and Lip-Rh B at 1, 2, 3 and 4 h, which showed that the introduction of DSPE-PEG2000-ES could significantly increase cell uptake and allow more fluorescent dyes to enter cells through specific identification of ER. However, SKOV-3 cells unexpectedly achieved to be observed the strongest intensity of red fluorescence after incubation with ES-Lip-Rh B. As well, this phenomenon was observed in the PEG-Lip-Rh B group whose fluorescence intensity was weaker than the Lip-Rh B group. These results indicated the insertion of the DSPE-mPEG2000 did not increase the fluorescence intensity, but was slightly lower than that of the non-PEGylated liposome group. This might be due to antifouling effect of the PEG brush,73 which made it difficult to be internalized as readily as non-PEGylated liposome. Besides, liposomes can be absorbed via attachment to cell membrane. PEGylated liposomes which were containing 5% DSPE-mPEG2000, did not enhance cellular uptake because of electrostatic repulsive interaction between PEG and cell membrane.74,75 Of note, the fluorescence intensity of the ES-PEG-Lip-Rh B group dramatically increased compared with that of PEG-Lip-Rh B group. This has clearly demonstrated that ES modification could eventually enhance internalization of liposomes in the SKOV-3 cells.
 |
Figure 6 Cellular uptake of Rh B-loaded liposome formulations or free Rh B on SKOV-3 cells after (A) 1 h, (B) 2 h, (C) 3 h and (D) 4 h of incubation, measured by fluorescence microscope. Scale bar: 50 μm. |
Fluorescence microscope pictures were quantified using Image J (Figure S2). The quantitative results also showed that the fluorescence intensity of ES modified liposomes was significantly higher than that of the unmodified group. Especially at 4 h, the fluorescence intensity of ES-PEG-Lip-Rh B was 1.67 times higher than that of PEG-Lip-Rh B and the fluorescence intensity of ES-Lip-Rh B was 2.20 times higher than that of Lip-Rh B.
In vitro Uptake Mechanism
To explore the mechanism of endocytosis, several common endocytic pathways were blocked by pretreating the cells with the known endocytosis inhibitors, including amiloride (micropinocytosis pathway), genistein (caveolin-mediated endocytosis) and sucrose (clathrin-dependent endocytosis), and ES pre-blocked ER receptor (receptor-mediated endocytosis) in SKOV-3 cells. Cells not treated with endocytosis inhibitors were used as controls, and the results (Figure 7A) showed that the control group presented a strong red fluorescence intensity. After treatment with the three endocytosis inhibitors and ES, the fluorescence intensity decreased to varying degrees. After pretreatment with ES, the fluorescence intensity decreased most significantly, and the uptake of ES-PEG-Lip-Rh B was suppressed by 72.3% (Figure 7B), since ER receptor was blocked by free ES which indicated the particular role of the ER receptor in cellular uptake of the ES-PEG-Lip-Rh B. The result proved that receptor-mediated endocytosis was the major mechanism of ES-PEG-Lip-Rh B internalization into cells. Meanwhile, the result also demonstrated that ES modified liposomes could indeed achieve targeting effect through specific identification with ER. In addition, macropinocytosis and caveolin-mediated endocytosis had equal contributions to cell endocytosis, corresponding to about 63.9% and 55.2% uptake inhibition, respectively. It was worth noting that the internalization of ES-PEG-Lip-Rh B was less dependent on clathrin-dependent endocytosis, which reduced the uptake by 7.8%, and there were no statistical differences with untreated group cells. In general, receptor-mediated endocytosis, macropinocytosis and caveolin-mediated endocytosis were the important endocytic pathways of ES-PEG-Lip-Rh B, but clathrin-dependent endocytosis was not the important pathway.
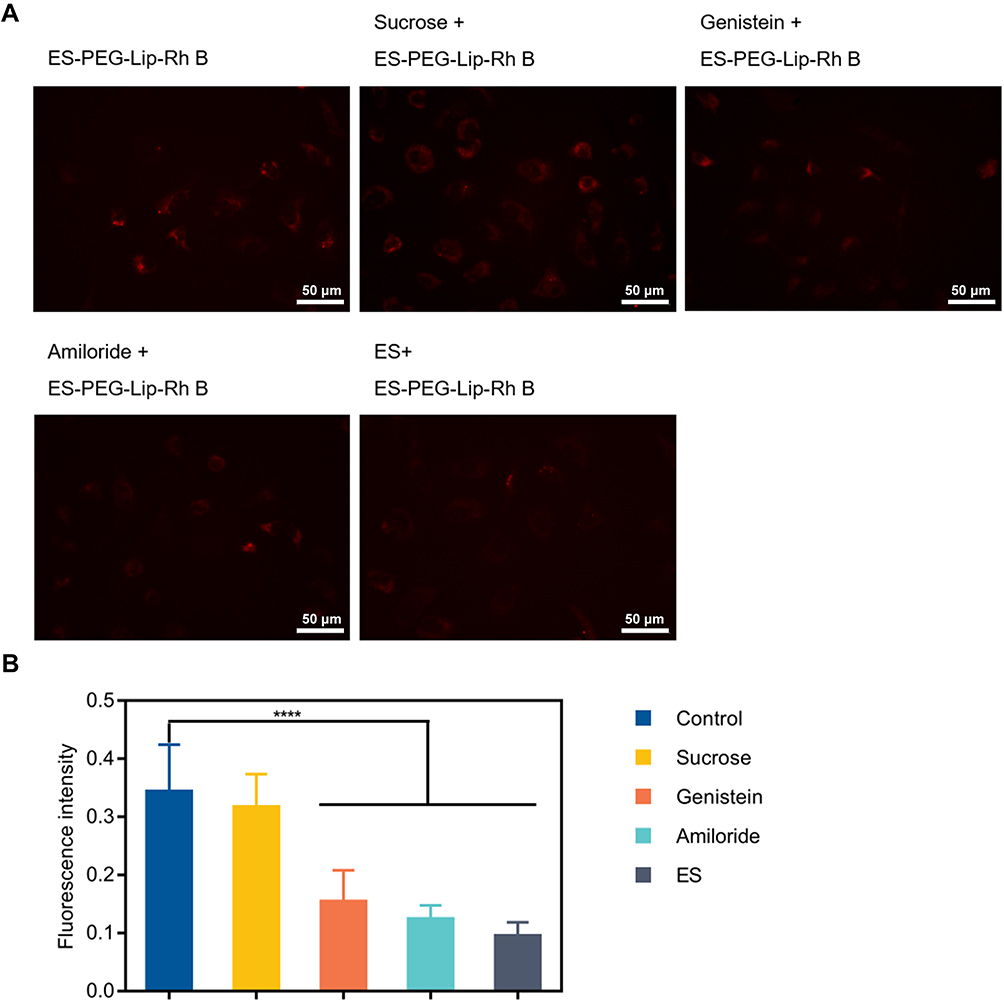 |
Figure 7 In vitro uptake mechanism. (A) Cellular uptake of ES-PEG-Lip-Rh B in SKOV-3 cells after pre-treated with ES, amiloride, genistein and sucrose. Scale bar: 50 μm. (B) Mean fluorescence intensity quantified by Image J. ****p < 0.0001. |
In vivo Targeting
The effective distribution of ES-PEG-Lip on target tissue is an important factor in playing its drug effects. In order to verify whether ES modified liposomes also had excellent tumor targeting in vivo or not, DiR as a near-infrared fluorescent probe was loaded to PEG-Lip and ES-PEG-Lip and injected into tumor-bearing nude mice. As shown in Figure 8A, free DiR was not enriched in the tumor site, only distributed in the liver and spleen. However, in the PEG-Lip-DiR group, the fluorescence signals remained at steady levels for up to 6 h post-injection, and then slowly decreased from 12 to 24 h. In comparison, the fluorescence intensity of ES-PEG-Lip-DiR in tumor tissues was observed to intensify gradually from 1 h to 6 h after injection, and then it was slightly reduced at 12 and 24 h. At the same time, the fluorescence intensity of ES-PEG-Lip-DiR group in the tumor site was significantly higher than that of PEG-Lip-DiR and free DiR at any time points post-injection. The quantification results (Figure 8B) also showed that there was a statistical difference between ES-PEG-Lip-DiR and PEG-Lip-DiR at all the time points. When compared to DiR and PEG-Lip-DiR at 6 h, the fluorescence intensity of ES-PEG-Lip-DiR was 9.10 and 1.69 folds higher, respectively. This result indicated that the ES ligand allowed more liposomes to continue to penetrate into the deep area of the tumor to maintain an effective residence time so as to achieve an enhanced targeting and enrichment of drugs at tumor sites in vivo.
 |
Figure 8 In vivo targeting study. (A) Distribution of DiR-loaded liposome formulations monitored via the IVIS spectrum at different time points. (B) The quantification of DiR fluorescence intensity at tumor sites in vivo. (C) Ex vivo images of the heart, liver, spleen, lungs, kidneys, and tumor. (D) Relative fluorescence intensity of the excised tumors (n = 3). N.S. p > 0.05, *p < 0.05, **p < 0.01, ***p < 0.001, ****p < 0.0001. |
Figure 8C shows the results of the ex vivo fluorescence distribution, which more intuitively determined the distribution of each formulation. The distribution of the DiR in the tumor site was indeed very small, basically not observed, except for the liver and spleen. The accumulation of PEG-Lip-DiR in tumors and various organs increased significantly, especially the liver and spleen due to the uptake of the reticuloendothelial system (RES). It was worth noting that ES-PEG-Lip-DiR still presented the highest fluorescence intensity in tumors, which was consistent with the in vivo results. Quantitative results (Figure 8D) confirmed the superior efficiency of ES-PEG-Lip-DiR to accumulate in tumors of mice compared to that of PEG-Lip-DiR. The increased fluorescence intensity indicated that ES-modified liposomes showed the strongest efficacy in tumor targeting, implying a better therapeutic effect to be achieved.
Pharmacokinetics and Tissue Distribution
The drug without eliminated quickly and reaching a higher concentration in the body is an important factor for maximizing the therapeutic effect. The effects of conventional liposomes are relatively limited, but the PEGylated liposomes, which have been extensively studied, make up for this defect.76 A pharmacokinetic study of ES-PEG-Lip-PTX/CBP in mice was therefore performed to verify the metabolic changes of drugs’ concentration. The plasma concentration-time curve (Figure 9A and B) clearly indicated that the liposome groups displayed higher PTX and CBP concentrations in plasma as compared with the quick clearance of PTX/CBP which were both undetectable after 12 h. What is more, ES-PEG-Lip-PTX/CBP modifying with long-acting fragments exhibited much higher drug concentrations and longer circulation time than that of Lip-PTX/CBP within 48 h. The corresponding pharmacokinetic parameters are listed in Tables 3 and 4. The half-life (t1/2β) and clearance (CL) for liposomes, especially ES-PEG-Lip-PTX/CBP, significantly increased. In PTX/CBP and Lip-PTX/CBP groups, mean retention time (MRT) was significantly lower than that of the ES-PEG-Lip-PTX/CBP. The area under curve (AUC(0–t)) of ES-PEG-Lip-PTX/CBP presented the bioavailability of 7.59 and 7.59-fold higher than that of PTX/CBP for PTX and CBP, respectively, of 3.86-fold and 3.47-fold higher than that of Lip-PTX/CBP for PTX and CBP, respectively. The results proved that ES-PEG-Lip-PTX/CBP significantly prolonged blood circulation time and increased plasma concentration, which provided more opportunities for PTX and CBP to reach the targeting tumor site.
 |
Table 3 Pharmacokinetic Parameters of PTX in Mice After Intravenous Administration at a Dose of 18.0 mg/kg |
 |
Table 4 Pharmacokinetic Parameters of CBP in Mice After Intravenous Administration at Dose of 7.8 mg/kg |
 |
Figure 9 Plasma concentration–time curve of (A) PTX and (B) CBP in ICR mice after intravenous administration of PTX/CBP, Lip-PTX/CBP and ES-PEG-Lip-PTX/CBP at a dose of PTX of 18.0 mg/kg and CBP of 7.8 mg/kg. The data were presented as the mean ± SD (n = 3). |
In order to further investigate the tissue distribution of ES-PEG-Lip-PTX/CBP, the concentrations of PTX and CBP in the heart, liver, spleen, lungs and kidneys were determined followed by the pharmacokinetics study. As can be seen from the Figure 10A–F and Figure 11A–F, after injection of PTX/CBP, PTX and CBP presented a quick metabolic speed without accumulating into the liver, spleen or lungs. However, liposomal formulations, including Lip-PTX/CBP and ES-PEG-Lip-PTX/CBP, were mainly distributed in liver, spleen and lungs, in which PTX and CBP showed a higher concentration than that in other organs. This could be due to the liposome formulations unavoidable uptake by the RES of the body.77,78 Excitingly, we found that the distribution of ES-PEG-Lip-PTX/CBP in the kidneys was less than that of PTX/CBP and Lip-PTX/CBP. Especially for CBP, AUC (0-t) of the ES-PEG-Lip-PTX/CBP in the kidneys was lower than that of PTX/CBP and Lip-PTX/CBP, which had statistical differences with the PTX/CBP. Therefore, we speculated that ES-PEG-Lip-PTX/CBP could reduce toxicity of PTX and CBP to kidneys.
 |
Figure 10 Tissue distribution of PTX in ICR mice, including (A) heart, (B) liver, (C) spleen, (D) lungs and (E) kidneys, after intravenous administration of PTX/CBP, Lip-PTX/CBP, and ES-PEG-Lip-PTX/CBP at a dose of PTX of 18.0 mg/kg and CBP of 7.8 mg/kg. (F) Area under the curve of PTX in different organs in ICR mice. The data were presented as the mean ± SD (n = 3). *p < 0.05, **p < 0.01, ***p < 0.001, ****p < 0.0001. |
 |
Figure 11 Tissue distribution of CBP in ICR mice, including (A) heart, (B) liver, (C) spleen, (D) lungs, and (E) kidneys, after intravenous administration of PTX/CBP, Lip-PTX/CBP, and ES-PEG-Lip-PTX/CBP at a dose of PTX of 18.0 mg/kg and CBP of 7.8 mg/kg. (F) Area under the curve of CBP in different organs in ICR mice. The data were presented as the mean ± SD (n = 3). *p < 0.05, **p < 0.01, ***p < 0.001, ****p < 0.0001. |
Anti-Tumor in vivo
In further determination of anti-tumor efficacy in vivo, SKOV-3 tumor-bearing athymic mice were randomly divided into five groups (n = 5), each group was administered with various formulations of normal saline, PTX/CBP, Lip-PTX/CBP, PEG-Lip-PTX/CBP or ES-PEG-Lip-PTX/CBP, respectively, via the tail vein for continuously monitoring of twenty-eight days (Figure 12A). As the obtained results showed in Figure 12B and C, the tumors showed a trend of rapid growth starting from the 14th day and the tumor volume reached 1500 mm3 after 28 days in the normal saline group. The PTX/CBP treatment group showed a certain degree of inhibition in tumor growth, which was not powerful enough. Compared with PTX/CBP group, PEG-Lip-PTX/CBP and ES-PEG-Lip-PTX/CBP obviously inhibited tumor growth, and ES-PEG-Lip-PTX/CBP had minimum tumor weight (Figure 12D). As shown in Figure 12E, the TIR was only 32.6% in PTX/CBP group. As expected, the most effective inhibition was achieved in ES-PEG-Lip-PTX/CBP group, in which the TIR reached about 81.8% which was 1.63 and 1.21 times higher than that of Lip-PTX/CBP and PEG-Lip-PTX/CBP with the inhibition rate of 50.2% and 67.5%, respectively.
 |
Figure 12 Anti-tumor efficacy study in vivo. (A) SKOV-3 cell inoculation and treatment schedule. (B) Tumor growth curves of different formulations. (C) Photographs of tumors in NU/NU mice treated for twenty-eight days. (D) Tumor weight and (E) tumor inhibition rate at the endpoint of experiment. (F) H&E staining of tumors tissues on the twenty-eight days’ treatment. Scale bar: 100 μm. The data were presented as the mean ± SD (n = 5). *p < 0.05, **p < 0.01, ***p < 0.001, **** p < 0.0001. |
For further investigation, the paraffin sections of tumors and major organs of heart, liver, spleen, lungs, and kidneys were analyzed using H&E staining. The results in Figure 12F shows that the SKOV-3 tumor cells in the normal saline group were tightly arranged and the cell morphology was normal. On the contrary, all the other tumor tissues treated with PTX/CBP, Lip-PTX/CBP, and PEG-Lip-PTX/CBP showed a certain degree of reduction in tumor cell quantity. Among them, ES-PEG-Lip-PTX/CBP treatment caused larger degrees of reduction of tumor cells, and the tumor tissue structure was significantly destroyed in comparison to other groups.
Consistent with the above results, ES-PEG-Lip-PTX/CBP displayed the strongest therapeutic efficacy which was significantly superior to that of other formulations in SKOV-3 tumor-bearing mice models. This was due to its ability to extend the circulation time in vivo by DSPE-mPEG2000 and improve tumor-specific targeting by DSPE-PEG2000-ES.
Meanwhile, the changes in body weight of mice were monitored during the experimental period. As the results showed in Figure 13A, no significant weight loss was observed in each treatment group, indicating that the ES-PEG-Lip-PTX/CBP had good biocompatibility and safety. At the end of the experiment, the heart, liver, spleen, lungs and kidneys of the mice were taken out and weighed to assess whether the organs had significant toxic changes. The OCs were comparable with those of the normal saline-treated healthy nude mice. The results in Figure 13B shows not much changes of the OCs, indicating the favorable safety of the ES-PEG-Lip-PTX/CBP therapy.
 |
Figure 13 Anti-tumor efficacy study in vivo. (A) Body weight change curves post-injection of different formulations. (B) The organ coefficients of NU/NU mice at the end of the experiment. (C) H&E staining results of main organs after the treatment. Scale bar: 100 μm. Blood routine analysis results of (D) WBC, (E) RBC, (F) PLT and (G) HGB. Biochemical analysis results of (H) BUN, (I) Cre, (J) ALT, and (K) AST. The data were presented as the mean ± SD (n = 5). |
At the same time, there was no obvious organ damage observed in each treatment group by H&E staining (Figure 13C). This result inferred that the ES-PEG-Lip-PTX/CBP formulations had excellent biocompatibility and safety. Furthermore, there was no significant difference between ES-PEG-Lip-PTX/CBP group and normal saline group in comparing their levels of WBC, RBC, PLT, HGB, BUN, Cre, ALT, and AST (Figure 13D–K). These results indicated that ES-PEG-Lip-PTX/CBP as a novel formulation could be safe in the process of treatment without generating severe systemic toxicity because of the reducing unspecific normal cellular uptake of ES-PEG-Lip-PTX/CBP.
Acute Toxicity in vivo
The safety is also one of the most important elements for a new nano-delivery systems. The acute toxicity of ES-PEG-Lip-PTX/CBP in ICR mice given a single dose intravenously was investigated to determine whether ES-PEG-Lip-PTX/CBP could decrease the toxicity of PTX and CBP. As shown in Table 5, LD50 of PTX/CBP, Lip-PTX/CBP and ES-PEG-Lip-PTX/CBP was 27.3/11.9 mg/kg, 57.7/25.1 mg/kg and 61.3/26.6 mg/kg, respectively. The LD50 value of Lip-PTX/CBP and ES-PEG-Lip-PTX/CBP was 2.12-fold and 2.24-fold that of the free PTX/CBP group, demonstrating that liposomal formulations significantly increased the safety of the PTX/CBP. Furthermore, ES-PEG-Lip-PTX/CBP presented the lowest value of LD50 implying its best safety profile. From the results in Figure 14A–C we noted that half of mice deaths in the Lip-PTX/CBP group at dose of 70.0/30.4 and ES-PEG-Lip-PTX/CBP group at the highest dose of 73.0/31.7 mg/kg occurred on the 7th day after the injection. However, the half of mice death in the PTX/CBP group at a dose of 32.0/13.9 mg/kg occurred only on the third day after the injection. Meanwhile, the body weights of mice in Figure 14D–F were also monitored for 14 days. The body weight of mice in PTX/CBP group dropped by 5.8% on the third day at a dose of 32.0/13.9 mg/kg, then all the mice were dead on the 4th day. However, the body weight of mice in Lip-PTX/CBP group at a dose of 46.0/20.0 mg/kg and in ES-PEG-Lip-PTX/CBP group at a dose of 49.0/21.3 increased by 21.4% and 24.4% on the third day, respectively. These results demonstrated ES-PEG-Lip-PTX/CBP could significantly decrease the mice mortality and lower the body weight loss compared with that of PTX/CBP group and Lip-PTX/CBP group. This effect was attributed to the ES-PEG-Lip-PTX/CBP which could control the release of PTX and CBP from the formulation into the blood circulation so as to reduce the concentration of the free chemo-drugs in blood.
 |
Table 5 LD50 of PTX/CBP, Lip-PTX/CBP, and ES-PEG-Lip-PTX/CBP in ICR Mice After Intravenous Administration of Different Formulations (n = 10) |
 |
Figure 14 Acute toxicity study in vivo. Survival curve and body weight of ICR mice after intravenous administration at different doses of (A and D) PTX/CBP, (B and E) Lip-PTX/CBP and (C and F) ES-PEG-Lip-PTX/CBP (n = 10). |
To further explore the toxicity in mice, after 14 days of observation, the main organs and blood of the surviving mice in the lowest dosage groups were collected. The results in Table 6 shows that the OCs of experimental groups were not significantly different from those of the healthy mice. In addition, the results of whole blood tests in Figure 15A–D showed that PTX/CBP could cause a decrease in the level of WBC and PLT because of the bone marrow suppression. On the contrary, the Lip-PTX/CBP, particularly ES-PEG-Lip-PTX/CBP, could maintain WBC and PLT at normal levels. There were no significant changes of RBC and HGB. This result indicated that ES-PEG-Lip-PTX/CBP could effectively reduce the bone marrow suppression of PTX and CBP and improve the safety of the chemo-drugs. On the other hand, the results of serum biochemical assays in Figure 15E–H revealed that no significant raise of ALT and AST after intravenous administration. It was worth noting that the levels of BUN and Cre after injection of PTX/CBP were higher than that of the healthy mice which reflected the kidneys of mice damaged. However, BUN and Cre remained in normal level in mice administered with ES-PEG-Lip-PTX/CBP. These results showed that ES-PEG-Lip-PTX/CBP provided the likelihood of reducing the kidney toxicity of PTX/CBP and had better biocompatibility as a safe formulation than Lip-PTX/CBP.
 |
Table 6 Organ Coefficient of Surviving Mice in Low-Dose Group on the 14th Day |
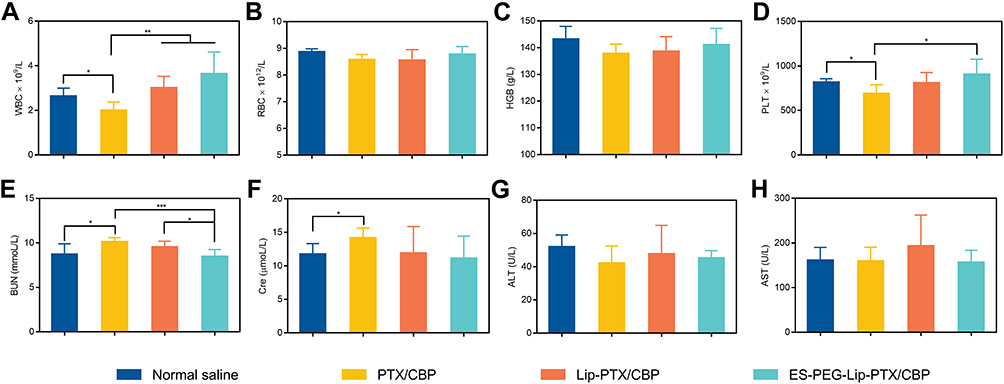 |
Figure 15 Acute toxicity study in vivo. Blood routine analysis results of (A) WBC, (B) RBC, (C) HGB, and (D) PLT. Biochemical analysis results of (E) BUN, (F) Cre, (G) ALT, and (H) AST. The data were presented as the mean ± SD (n = 10). *p < 0.05, **p < 0.01, ***p < 0.001. |
Conclusion
In this study, co-loaded PTX and CBP PEGylated liposome conjugated with estrone (ES-PEG-Lip-PTX/CBP) was prepared for the first time to achieve the specific targeting therapy for ovarian cancer which was highly expressed ER. The characterizations, release behaviors, cytotoxicity, in vitro SKOV-3 cellular uptake and mechanisms, in vivo targeting study, pharmacokinetics and biodistribution, anti-tumor efficacy and acute toxicity of ES-PEG-Lip-PTX/CBP were evaluated. The prepared liposomes displayed a high encapsulation efficacy, small particle size and a negative charge which presented a good stability. ES-PEG-Lip-PTX/CBP could achieve a slow and sustained release in the physiological condition. In vitro and in vivo targeting studies demonstrated that ES-PEG-Lip-PTX/CBP could specifically recognize the ER. When SKOV-3 cells were pre-treated with ES to block the binding of ES modified liposomes with ER, the decreased fluorescence intensity had further validated the involvement of ER in the process of ES-PEG-Lip-PTX/CBP targeting. In vitro cytotoxicity indicated ES-PEG-Lip-PTX/CBP had the highest inhibition rate on SKOV-3 tumor cell growth. The results of pharmacokinetics showed that ES-PEG-Lip-PTX/CBP could improve the pharmacokinetic behavior, confirming addition of PEG could enhance drugs’ circulation time in the body. Furthermore, in the in vivo antitumor study, ES-PEG-Lip-PTX/CBP was demonstrated to have the strongest antitumor efficacy in athymic NU/NU mice bearing SKOV-3 tumor xenografts. Meanwhile, ES-PEG-Lip-PTX/CBP was proved to be a formulation with a reduced toxicity profile. Thus, combination therapy combined with the modification with ES and PEG was a favorable strategy to achieve a better therapeutic efficacy on ovarian cancer. Overall, ES-PEG-Lip-PTX/CBP could be a novel and promising nano-targeting formulation for ovarian cancer therapy in the future clinic.
Acknowledgments
The work was funded by Science and Technology Development Project from Jilin Science and Technology Department (20180311072YY) and Jilin Province Development and Reform Commission (2014N149). We thank the Key Laboratory of Pathological Biology of Ministry of Education in Jilin University for technical support. We wish to thank Guoxing Xu, Xin Liu, Qin Meng and Dengli Cong, Department of Biopharmacy, School of Pharmaceutical Sciences, Jilin University, for help providing resources. We also thank Zhe Lv, Han Bao, Yan Zhang and Hongyu Chen, Department of Biopharmacy, School of Pharmaceutical Sciences, Jilin University, for help writing.
Disclosure
The authors report no conflicts of interest in this work.
References
1. Webb PM, Jordan SJ. Epidemiology of epithelial ovarian cancer. Best Pract Res Clin Obstet Gynaecol. 2017;41:3–14. doi:10.1016/j.bpobgyn.2016.08.006
2. Ottevanger PB. Ovarian cancer stem cells more questions than answers. Semin Cancer Biol. 2017;44:67–71. doi:10.1016/j.semcancer.2017.04.009
3. Moufarrij S, Dandapani M, Arthofer E, et al. Epigenetic therapy for ovarian cancer: promise and progress. Clin Epigenetics. 2019;11(1):7. doi:10.1186/s13148-018-0602-0
4. Torre LA, Trabert B, DeSantis CE, et al. Ovarian cancer statistics, 2018. CA Cancer J Clin. 2018;68(4):284–296. doi:10.3322/caac.21456
5. Yang C, Xia BR, Zhang ZC, Zhang YJ, Lou G, Jin WL. Immunotherapy for ovarian cancer: adjuvant, combination, and neoadjuvant. Front Immunol. 2020;11:577869. doi:10.3389/fimmu.2020.577869
6. Vallius T, Hynninen J, Kemppainen J, et al. (18)F-FDG-PET/CTbased total metabolic tumor volume change during neoadjuvant chemotherapy predicts outcome in advanced epithelial ovarian cancer. Eur J Nucl Med Mol Imaging. 2018;45(7):1224–1232. doi:10.1007/s00259-018-3961-z
7. Cortez AJ, Tudrej P, Kujawa KA, Lisowska KM. Advances in ovarian cancer therapy. Cancer Chemother Pharmacol. 2018;81(1):17–38. doi:10.1007/s00280-017-3501-8
8. Davis A, Tinker AV, Friedlander M. “Platinum resistant” ovarian cancer: what is it, who to treat and how to measure benefit? Gynecol Oncol. 2014;133(3):624–631. doi:10.1016/j.ygyno.2014.02.038
9. He C, Lu K, Liu D, Lin W. Nanoscale metal-organic frameworks for the co-delivery of cisplatin and pooled siRNAs to enhance therapeutic efficacy in drug-resistant ovarian cancer cells. J Am Chem Soc. 2014;136(14):5181–5184. doi:10.1021/ja4098862
10. Yan T, Li D, Li J, et al. Effective co-delivery of doxorubicin and curcumin using a glycyrrhetinic acid-modified chitosan-cystamine-poly(epsilon-caprolactone) copolymer micelle for combination cancer chemotherapy. Colloids Surf B Biointerfaces. 2016;145:526–538. doi:10.1016/j.colsurfb.2016.05.070
11. Zhang F, Li M, Wang J, Liang X, Su Y, Wang W. Finding new tricks for old drugs: tumoricidal activity of non-traditional antitumor drugs. AAPS PharmSciTech. 2016;17(3):539–552. doi:10.1208/s12249-016-0518-y
12. Huang P, Wang G, Wang Z, et al. Floxuridine-chlorambucil conjugate nanodrugs for ovarian cancer combination chemotherapy. Colloids Surf B Biointerfaces. 2020;194:111164. doi:10.1016/j.colsurfb.2020.111164
13. Dong L, Zhang X, Cai L, et al. Targeted MRI and chemotherapy of ovarian cancer with clinic available nano-drug based nanoprobe. Biomed Pharmacother. 2020;130:110585. doi:10.1016/j.biopha.2020.110585
14. Raja FA, Chopra N, Ledermann JA. Optimal first-line treatment in ovarian cancer. Ann Oncol. 2012;23(Suppl 10):x118–27. doi:10.1093/annonc/mds315
15. Zhang X, Liu Y, Kim YJ, Mac J, Zhuang R, Wang P. Co-delivery of carboplatin and paclitaxel via cross-linked multilamellar liposomes for ovarian cancer treatment. RSC Adv. 2017;7(32):19685–19693. doi:10.1039/c7ra01100h
16. Thibault B, Genre L, Le Naour A, et al. DEBIO 1143, an IAP inhibitor, reverses carboplatin resistance in ovarian cancer cells and triggers apoptotic or necroptotic cell death. Sci Rep. 2018;8(1):17862. doi:10.1038/s41598-018-35860-z
17. Wanderley CW, Colón DF, Luiz JPM, et al. Paclitaxel reduces tumor growth by reprogramming tumor-associated macrophages to an M1 profile in a TLR4-dependent manner. Cancer Res. 2018;78(20):5891–5900. doi:10.1158/0008-5472.CAN-17-3480
18. Tourell MC, Shokoohmand A, Landgraf M, et al. The distribution of the apparent diffusion coefficient as an indicator of the response to chemotherapeutics in ovarian tumour xenografts. Sci Rep. 2017;7(1):42905. doi:10.1038/srep42905
19. Satpathy M, Wang L, Zielinski RJ, et al. Targeted drug delivery and image-guided therapy of heterogeneous ovarian cancer using HER2-targeted theranostic nanoparticles. Theranostics. 2019;9(3):778–795. doi:10.7150/thno.29964
20. Boyd LR, Muggia FM. Carboplatin/Paclitaxel induction in ovarian cancer: the finer points. Oncology. 2018;32(8):
21. Bisch SP, Sugimoto A, Prefontaine M, et al. Treatment tolerance and side effects of intraperitoneal carboplatin and dose-dense intravenous paclitaxel in ovarian cancer. J Obstet Gynaecol Can. 2018;40(10):1283–1287 e1. doi:10.1016/j.jogc.2018.01.028
22. Huang M, Liang C, Tan C, et al. Liposome co-encapsulation as a strategy for the delivery of curcumin and resveratrol. Food Funct. 2019;10(10):6447–6458. doi:10.1039/c9fo01338e
23. Lu L, Zhao X, Fu T, et al. An iRGD-conjugated prodrug micelle with blood-brain-barrier penetrability for anti-glioma therapy. Biomaterials. 2020;230:119666. doi:10.1016/j.biomaterials.2019.119666
24. Zhu Y, Liu C, Pang Z. Dendrimer-based drug delivery systems for brain targeting. Biomolecules. 2019;9(12):790. doi:10.3390/biom9120790
25. Li H, Somiya M, Tatematsu K, Kuroda S. Construction of a macrophage-targeting bio-nanocapsule-based nanocarrier. Methods Mol Biol. 2020;2059:299–313. doi:10.1007/978-1-4939-9798-5_16
26. Wan H, Cao Y, Lo LW, Zhao J, Sepúlveda N, Wang C. Flexible carbon nanotube synaptic transistor for neurological electronic skin applications. ACS Nano. 2020;14(8):10402–10412. doi:10.1021/acsnano.0c04259
27. Rhodes KR, Green JJ. Nanoscale artificial antigen presenting cells for cancer immunotherapy. Mol Immunol. 2018;98:13–18. doi:10.1016/j.molimm.2018.02.016
28. Laine AL, Gravier J, Henry M, et al. Conventional versus stealth lipid nanoparticles: formulation and in vivo fate prediction through FRET monitoring. J Control Release. 2014;188:1–8. doi:10.1016/j.jconrel.2014.05.042
29. de Sousa Cunha F, Dos Santos Pereira LN, de Costa ESTP, de Sousa Luz RA, Nogueira Mendes A. Development of nanoparticulate systems with action in breast and ovarian cancer: nanotheragnostics. J Drug Target. 2019;27(7):732–741. doi:10.1080/1061186X.2018.1523418
30. Sivasankarapillai VS, Das SS, Sabir F, et al. Progress in natural polymer engineered biomaterials for transdermal drug delivery systems. Mater Today Chem. 2021;19:100382. doi:10.1016/j.mtchem.2020.100382
31. Mohammadzadeh V, Barani M, Amiri MS, et al. Applications of plant-based nanoparticles in nanomedicine: a review. Sustain Chem Pharm. 2022;25:100606. doi:10.1016/j.scp.2022.100606
32. Er S, Laraib U, Arshad R, et al. Amino acids, peptides, and proteins: implications for nanotechnological applications in biosensing and drug/gene delivery. Nanomaterials. 2021;(11):11. doi:10.3390/nano11113002
33. Arshad R, Fatima I, Sargazi S, et al. Novel perspectives towards RNA-based nano-theranostic approaches for cancer management. Nanomaterials. 2021;11(12):3330. doi:10.3390/nano11123330
34. Barani M, Bilal M, Sabir F, Rahdar A, Kyzas GZ. Nanotechnology in ovarian cancer: diagnosis and treatment. Life Sci. 2021;266:118914. doi:10.1016/j.lfs.2020.118914
35. Luo X, Li B, Zhang X, et al. Dual-functional lipid-like nanoparticles for delivery of mRNA and MRI contrast agents. Nanoscale. 2017;9(4):1575–1579. doi:10.1039/c6nr08496f
36. Song J, Zhang N, Zhang L, et al. IR780-loaded folate-targeted nanoparticles for near-infrared fluorescence image-guided surgery and photothermal therapy in ovarian cancer. Int J Nanomedicine. 2019;14:2757–2772. doi:10.2147/IJN.S203108
37. Huo M, Wang H, Zhang Y, et al. Co-delivery of silybin and paclitaxel by dextran-based nanoparticles for effective anti-tumor treatment through chemotherapy sensitization and microenvironment modulation. J Control Release. 2020;321:198–210. doi:10.1016/j.jconrel.2020.02.017
38. Cai L, Xu G, Shi C, Guo D, Wang X, Luo J. Telodendrimer nanocarrier for co-delivery of paclitaxel and cisplatin: a synergistic combination nanotherapy for ovarian cancer treatment. Biomaterials. 2015;37:456–468. doi:10.1016/j.biomaterials.2014.10.044
39. Khan MM, Madni A, Tahir N, et al. Co-delivery of curcumin and cisplatin to enhance cytotoxicity of cisplatin using lipid-chitosan hybrid nanoparticles. Int J Nanomedicine. 2020;15:2207–2217. doi:10.2147/IJN.S247893
40. Zhang Z, Ma L, Luo J. Chondroitin sulfate-modified liposomes for targeted co-delivery of doxorubicin and retinoic acid to suppress breast cancer lung metastasis. Pharmaceutics. 2021;13(3):Mar. doi:10.3390/pharmaceutics13030406
41. Zahednezhad F, Saadat M, Valizadeh H, Zakeri-Milani P, Baradaran B. Liposome and immune system interplay: challenges and potentials. J Control Release. 2019;305:194–209. doi:10.1016/j.jconrel.2019.05.030
42. Mohamed M, Abu Lila AS, Shimizu T, et al. PEGylated liposomes: immunological responses. Sci Technol Adv Mater. 2019;20(1):710–724. doi:10.1080/14686996.2019.1627174
43. Abu Lila AS, Ishida T. Liposomal delivery systems: design optimization and current applications. Biol Pharm Bull. 2017;40(1):1–10. doi:10.1248/bpb.b16-00624
44. Roh YG, Shin SW, Kim SY, et al. Protein nanoparticle fabrication for optimized reticuloendothelial system evasion and tumor accumulation. Langmuir. 2019;35(11):3992–3998. doi:10.1021/acs.langmuir.8b03776
45. Chen Z, Moon JJ, Cheng W. Quantitation and stability of protein conjugation on liposomes for controlled density of surface epitopes. Bioconjug Chem. 2018;29(4):1251–1260. doi:10.1021/acs.bioconjchem.8b00033
46. Eroğlu İ, Ibrahim M. Liposome-ligand conjugates: a review on the current state of art. J Drug Target. 2020;28(3):225–244. doi:10.1080/1061186X.2019.1648479
47. Kou L, Sun R, Jiang X, et al. Tumor microenvironment-responsive, multistaged liposome induces apoptosis and ferroptosis by amplifying oxidative stress for enhanced cancer therapy. ACS Appl Mater Interfaces. 2020;12(27):30031–30043. doi:10.1021/acsami.0c03564
48. Wang D, Chen W, Li H, et al. Folate-receptor mediated pH/reduction-responsive biomimetic nanoparticles for dually activated multi-stage anticancer drug delivery. Int J Pharm. 2020;585:119456. doi:10.1016/j.ijpharm.2020.119456
49. Wehbe Z, Nasser SA, El-Yazbi A, Nasreddine S, Eid AH. Estrogen and bisphenol A in hypertension. Curr Hypertens Rep. 2020;22(3):23. doi:10.1007/s11906-020-1022-z
50. Bogush TA, Basharina AA, Bogush EA, Ryabinina OM, Tjulandina AS, Tjulandin SA. Estrogen receptors alpha and beta in ovarian cancer: expression level and prognosis. Dokl Biochem Biophys. 2018;482(1):249–251. doi:10.1134/S1607672918050058
51. Ajani MA, Salami A, Awolude OA, Oluwasola AO. Hormone-receptor expression status of epithelial ovarian cancer in Ibadan, South-western Nigeria. Pan Afr Med J. 2017;27:259. doi:10.11604/pamj.2017.27.259.11883
52. Raveendran R, Chen F, Kent B, Stenzel MH. Estrone-decorated polyion complex micelles for targeted melittin delivery to hormone-responsive breast cancer cells. Biomacromolecules. 2020;21(3):1222–1233. doi:10.1021/acs.biomac.9b01681
53. Hao Q, Xu G, Yang Y, et al. Oestrone-targeted liposomes for mitoxantrone delivery via oestrogen receptor - synthesis, physicochemical characterization and in-vitro evaluation. J Pharm Pharmacol. 2017;69(8):991–1001. doi:10.1111/jphp.12736
54. Patel O, Muller CJF, Joubert E, et al. Pharmacokinetic interaction of green rooibos extract with atorvastatin and metformin in rats. Front Pharmacol. 2019;10:1243. doi:10.3389/fphar.2019.01243
55. Yang Y, Lu X, Liu Q, et al. Palmitoyl ascorbate and doxorubicin co-encapsulated liposome for synergistic anticancer therapy. Eur J Pharm Sci. 2017;105:219–229. doi:10.1016/j.ejps.2017.05.038
56. Chen T, Gong T, Zhao T, Fu Y, Zhang Z, Gong T. A comparison study between lycobetaine-loaded nanoemulsion and liposome using nRGD as therapeutic adjuvant for lung cancer therapy. Eur J Pharm Sci. 2018;111:293–302. doi:10.1016/j.ejps.2017.09.041
57. Penaloza JP, Marquez-Miranda V, Cabana-Brunod M, et al. Intracellular trafficking and cellular uptake mechanism of PHBV nanoparticles for targeted delivery in epithelial cell lines. J Nanobiotechnology. 2017;15(1). doi:10.1186/s12951-016-0241-6
58. Tunsirikongkon A, Pyo YC, Kim DH, Lee SE, Park JS. Optimization of polyarginine-conjugated PEG lipid grafted proliposome formulation for enhanced cellular association of a protein drug. Pharmaceutics. 2019;11(6):Jun. doi:10.3390/pharmaceutics11060272
59. Nunes SS, Fernandes RS, Cavalcante CH, et al. Influence of PEG coating on the biodistribution and tumor accumulation of pH-sensitive liposomes. Drug Deliv Transl Res. 2019;9(1):123–130. doi:10.1007/s13346-018-0583-8
60. Franco MS, Roque MC, de Barros ALB, de Oliveira Silva J, Cassali GD, Oliveira MC. Investigation of the antitumor activity and toxicity of long-circulating and fusogenic liposomes co-encapsulating paclitaxel and doxorubicin in a murine breast cancer animal model. Biomed Pharmacother. 2019;109:1728–1739. doi:10.1016/j.biopha.2018.11.011
61. Caban-Toktas S, Sahin A, Lule S, et al. Combination of Paclitaxel and R-flurbiprofen loaded PLGA nanoparticles suppresses glioblastoma growth on systemic administration. Int J Pharm. 2020;578:119076. doi:10.1016/j.ijpharm.2020.119076
62. Liu Y, Qiao Z, Gao J, et al. Hydroxyapatite-bovine serum albumin-paclitaxel nanoparticles for locoregional treatment of osteosarcoma. Adv Healthc Mater. 2021;10(2):e2000573. doi:10.1002/adhm.202000573
63. Yan C, Liang N, Li Q, Yan P, Sun S. Biotin and arginine modified hydroxypropyl-beta-cyclodextrin nanoparticles as novel drug delivery systems for paclitaxel. Carbohydr Polym. 2019;216:129–139. doi:10.1016/j.carbpol.2019.04.024
64. Thakur S, Singh H, Singh A, et al. Thermosensitive injectable hydrogel containing carboplatin loaded nanoparticles: a dual approach for sustained and localized delivery with improved safety and therapeutic efficacy. J Drug Deliv Sci Technol. 2020;58:101817. doi:10.1016/j.jddst.2020.101817
65. Alex AT, Joseph A, Shavi G, Rao JV, Udupa N. Development and evaluation of carboplatin-loaded PCL nanoparticles for intranasal delivery. Drug Deliv. 2016;23(7):2144–2153. doi:10.3109/10717544.2014.948643
66. Zhu X, Peng Y, Qiu L. Amino-functionalized nano-vesicles for enhanced anticancer efficacy and reduced myelotoxicity of carboplatin. Colloids Surf B Biointerfaces. 2017;157:56–64. doi:10.1016/j.colsurfb.2017.05.041
67. Fu Y, Ding Y, Zhang L, Zhang Y, Liu J, Yu P. Poly ethylene glycol (PEG)-Related controllable and sustainable antidiabetic drug delivery systems. Eur J Med Chem. 2021;217:113372. doi:10.1016/j.ejmech.2021.113372
68. Chen EM, Quijano AR, Seo YE, et al. Biodegradable PEG-poly(omega-pentadecalactone-co-p-dioxanone) nanoparticles for enhanced and sustained drug delivery to treat brain tumors. Biomaterials. 2018;178:193–203. doi:10.1016/j.biomaterials.2018.06.024
69. Haggag Y, Abdel-Wahab Y, Ojo O, et al. Preparation and in vivo evaluation of insulin-loaded biodegradable nanoparticles prepared from diblock copolymers of PLGA and PEG. Int J Pharm. 2016;499(1–2):236–246. doi:10.1016/j.ijpharm.2015.12.063
70. Mo L, Song JG, Lee H, et al. PEGylated hyaluronic acid-coated liposome for enhanced in vivo efficacy of sorafenib via active tumor cell targeting and prolonged systemic exposure. Nanomedicine. 2018;14(2):557–567. doi:10.1016/j.nano.2017.12.003
71. Novohradsky V, Zajac J, Vrana O, Kasparkova J, Brabec V. Simultaneous delivery of olaparib and carboplatin in PEGylated liposomes imparts this drug combination hypersensitivity and selectivity for breast tumor cells. Oncotarget. 2018;9(47):28456–28473. doi:10.18632/oncotarget.25466
72. Antunes IF, Hospers GAP, Sijbesma JWA, et al. Monitoring the crosstalk between the estrogen receptor and human epidermal growth factor receptor 2 with PET. Mol Imaging Biol. 2020;22(5):1218–1225. doi:10.1007/s11307-020-01496-7
73. Choi JH, Lee JS, Park KM, Bae JW, Lee Y, Park KD. Multi-layered nanogels with MMP-sheddable PEG masks: preparation and promotion of tumor cell uptake by controlling surface characteristics. Colloids Surf B Biointerfaces. 2017;156:71–78. doi:10.1016/j.colsurfb.2017.05.007
74. Yazdi JR, Tafaghodi M, Sadri K, et al. Folate targeted PEGylated liposomes for the oral delivery of insulin: in vitro and in vivo studies. Colloids Surf B Biointerfaces. 2020;194:111203. doi:10.1016/j.colsurfb.2020.111203
75. Doucette MM, Stevens VL. Folate receptor function is regulated in response to different cellular growth rates in cultured mammalian cells. J Nutr. 2001;131(11):2819–2825. doi:10.1093/jn/131.11.2819
76. Wang X, Wang Q, Liu Z, Zheng X. Preparation, pharmacokinetics and tumour-suppressive activity of berberine liposomes. J Pharm Pharmacol. 2017;69(6):625–632. doi:10.1111/jphp.12692
77. Du Y, Wang Z, Wang T, et al. Improved antitumor activity of novel redox-responsive paclitaxel-encapsulated liposomes based on disulfide phosphatidylcholine. Mol Pharm. 2020;17(1):262–273. doi:10.1021/acs.molpharmaceut.9b00988
78. Cabrera M, Lecot N, Fernandez M, Gambini JP, Porcal W, Cabral P. (99m)Tc Stearyl 6-(benzylidenehydrazinyl) nicotinamide liposomes as tumor permeability evaluation tracer. AAPS PharmSciTech. 2021;22(3):115. doi:10.1208/s12249-021-01984-1
 © 2022 The Author(s). This work is published and licensed by Dove Medical Press Limited. The
full terms of this license are available at https://www.dovepress.com/terms
and incorporate the Creative Commons Attribution
- Non Commercial (unported, 3.0) License.
By accessing the work you hereby accept the Terms. Non-commercial uses of the work are permitted
without any further permission from Dove Medical Press Limited, provided the work is properly
attributed. For permission for commercial use of this work, please see paragraphs 4.2 and 5 of our Terms.
© 2022 The Author(s). This work is published and licensed by Dove Medical Press Limited. The
full terms of this license are available at https://www.dovepress.com/terms
and incorporate the Creative Commons Attribution
- Non Commercial (unported, 3.0) License.
By accessing the work you hereby accept the Terms. Non-commercial uses of the work are permitted
without any further permission from Dove Medical Press Limited, provided the work is properly
attributed. For permission for commercial use of this work, please see paragraphs 4.2 and 5 of our Terms.
Recommended articles
Nanoparticle-Based Combination Therapy for Ovarian Cancer
Wu Y, Yang Y, Lv X, Gao M, Gong X, Yao Q, Liu Y
International Journal of Nanomedicine 2023, 18:1965-1987
Published Date: 12 April 2023
Lipid Nanocarrier-Based Drug Delivery Systems: Therapeutic Advances in the Treatment of Lung Cancer
Kim SJ, Puranik N, Yadav D, Jin JO, Lee PC
International Journal of Nanomedicine 2023, 18:2659-2676
Published Date: 18 May 2023
Emerging Antimicrobial Strategies Against Heterogeneous and Vancomycin-Intermediate Staphylococcus aureus

Wang Y, Sun Y, Chen G, Cheng X
International Journal of General Medicine 2025, 18:5329-5344
Published Date: 11 September 2025