Back to Journals » Psychology Research and Behavior Management » Volume 16
Establishment and Validation of a Predictive Model for Post-Treatment Anxiety Based on Patient Attributes and Pre-Treatment Anxiety Scores
Authors Sun W, Shen J, Sun R, Zhou D, Li H
Received 8 June 2023
Accepted for publication 8 September 2023
Published 19 September 2023 Volume 2023:16 Pages 3883—3894
DOI https://doi.org/10.2147/PRBM.S425055
Checked for plagiarism Yes
Review by Single anonymous peer review
Peer reviewer comments 2
Editor who approved publication: Dr Igor Elman
Wenwen Sun,1,* Jun Shen,1,* Ru Sun,1 Dan Zhou,1 Haihong Li2
1Department of Breast Surgery, the First People’s Hospital of Lianyungang, the Affiliated Hospital of XuZhou Medical University, LianYunGang, Jiangsu, 222002, People’s Republic of China; 2Department of Nursing, the First People’s Hospital of Lianyungang, The Affiliated Hospital of XuZhou Medical University, LianYunGang, Jiangsu, 222002, People’s Republic of China
*These authors contributed equally to this work
Correspondence: Haihong Li, Department of Nursing, the First People’s Hospital of Lianyungang, the affiliated hospital of XuZhou medical university, No. 6 Zhenhua East Road, High-Tech Square, LianYunGang, Jiangsu Province, 222002, People’s Republic of China, Tel +86 18961322059, Email [email protected]
Objective: In this study, we aim to establish and evaluate a predictive model for post-treatment anxiety state based on basic patient attributes and pre-treatment SAS scores, with the expectation that this model will guide clinical precision intervention.
Methods: Data were collected from 606 patients with breast cancer who underwent surgery at our hospital between January 1, 2015 and December 30, 2018 and 144 newly diagnosed patients with breast cancer who were admitted between June 1, 2019 and December 30, 2019, for a total of 750 patients with breast cancer. The relationship between SAS_A scores and prognosis was verified by analyzing patient baseline characteristics, follow-up data, pre-treatment self-rating anxiety scale (SAS) scores, and SAS_A scores in follow-up period after the end of treatment. A risk prediction model was developed in view of the SAS_A scores, which was then screened, validated, and simplified by scoring, with a nomogram plotted.
Results: The SAS_A score can be utilized to differentiate prognosis. In K-M analysis, the high SAS_A score group had a significantly poorer progression-free survival rate than the low score group, p-value < 0.0001. Through model feature selection and clinical analysis, all variables were finally incorporated to establish a predictive model with a ROC AUC of 0.721 (0.637– 0.805) for the validation set and external data, and an AUC of 0.810 (0.719– 0.902) for external data, demonstrating good predictive performance. Calibration curves and probability distribution maps were constructed. DCA and CIC analyses demonstrated that model intervention could boost clinical benefits more effectively than intervention for all patients.
Conclusion: Using a predictive model to guide clinical management for anxiety in breast cancer patients is feasible, but additional research is required.
Keywords: breast cancer, negative emotions, nomogram, predictive model
Introduction
Breast cancer is the most prevalent cancer in women and one of the primary causes of female cancer-related mortality.1,2 During diagnosis and treatment, patients with tumor may suffer negative emotions to varied degrees,3 particularly patients with breast cancer, of whom 15% to 54% experience negative emotions,4 such as anxiety and depression.5,6 A recent meta-analysis showed that the prevalence of anxiety amongst breast cancer patients could reach 41.9%7 Anxiety significantly influences a patient’s physiological and psychological functioning, treatment compliance and quality of life, and are significantly associated with cancer recurrence and all-cause mortality,8,9 as an independent prognostic factor.8 With the growth of the biopsychosocial medical model, the influence of unfavorable emotional aspects on the diagnosis, treatment, and prognosis of patients with cancer, particularly patients with breast cancer, has become a medical priority.10,11 Diverse intervention strategies can assist patients with breast cancer in adjusting their mental state in order to adhere to therapy more effectively.12,13 Despite this, it is challenging to perform psychological intervention for all the patients with breast cancer because it requires a substantial amount of people and financial resources. Therefore, it is essential to effectively and precisely screen patients requiring therapies, a topic worthy of clinical investigation.
Materials and Methods
Research Objects
Data were obtained from 606 patients with breast cancer who underwent surgery in our hospital between January 1, 2015 and December 30, 2018, and from 144 newly diagnosed patients with breast cancer between June 1, 2019 and December 31, 2019, with 750 newly diagnosed patients with breast cancer in two data queues included in the study. Inclusion criteria: ①Surgical patients diagnosed pathologically with breast cancer;②Patients who did not receive other treatments before surgery (Did not receive any treatment related to breast cancer before surgery, including but not limited to neoadjuvant therapy, traditional Chinese medicine treatment, etc which means that the pathological results of surgical treatment are the basis for diagnosis); ③Patients over 18 years old; ④Patients with a Karnofsky Performance Status score >70 points; ⑤Patients with intact cognitive ability and understanding; ⑥Patients expressing informed consent to this study; ⑦Patients with complete medical records and follow-up data. Exclusion criteria: ①Patients with metastases in other parts or organs or with an expected survival period of less than 6 months; ②Patients with other tumors or a history of other tumors; ③Patients complicated with serious heart, liver, or kidney diseases; ④Breastfeeding or pregnant women, ⑤patients receiving neo-adjuvant therapy.
Observational Indicators
Patient baseline characteristics and follow-up data were retrieved from the medical record data system of the hospital. Data were collected including patient admission number (ID), age (years), income, surgical method, TNM staging, marital status, family support, educational level, religious views, prognostic markers, and follow-up duration. Income was divided into high (≥4000 Ұ/month) and low (<4000 Ұ/month).The surgical methods were categorized as modified radical mastectomy and breast-conserving therapy. TNM staging was classified based on the NCCN 2014 guidelines. Marital status consisted of married people and single people (including divorced and widowed). Family support included good and general support (self-reported by patients). Religious beliefs comprised of yes and no responses. The Self-Rating Anxiety Scale (SAS) was used to measure the SAS score at admission and the SAS_A score in the post-treatment follow-up phase. The prognostic factors were statistics of disease progression events including visceral metastasis, local recurrence, and regional lymph node metastasis. Patients were contacted by telephone for follow-up and their hospitalization and outpatient visit records were reviewed, with a median follow-up period of 24 months[12–36].
Statistical Methods
R 4.0.2 software was utilized for both statistical analysis and visualization. The Student’s t-test or Wilcoxon rank-sum test of continuous variables was employed to compare clinical features between groups. A chi-squared test or Fisher’s exact test (as appropriate) was used to for categorical variables to plot the Kaplan-Meier survival curve and ROC curve. Logistic regression was used in univariate and multivariate regression analyses, to confirm the association between SAS_A and prognostic outcome. AIC information criterion, BIC information criterion, cross-validated Lasso regression, elastic net, random forest, and so on were chosen for screening the model variables. The model was evaluated using the consistency index (C-index), the area under the receiver operating characteristic curve (AUC), and ROC and calibration curves plotted. The difference between several models was evaluated by Net Reclassification Index (NRI).The clinical advantage of the nomogram was determined by using decision curve analysis (DCA) and clinical impact curve, (CIC). P < 0.05 indicates statistical significance.
Results
Data Queue
A total of 750 patients were included in this study, who were separated into two data queues, A and B. Data queue A consisted of 606 patients who underwent surgery at our hospital between January 1, 2015 and December 30, 2018, and were randomly divided into training and validation groups in a ratio of 3:2. Data queue B comprised the 144 newly diagnosed patients with breast cancer who underwent surgery at our hospital between June 1, 2019 and December 30, 2019, which served as external data. The two datasets were collected by independent teams with a six-month time interval (Supplementary Table 1). The indicators were classified based on whether disease progression occurred, and an intergroup analysis of the indicators in different datasets revealed that the overall data characteristics were comparable between different datasets (see Table 1).
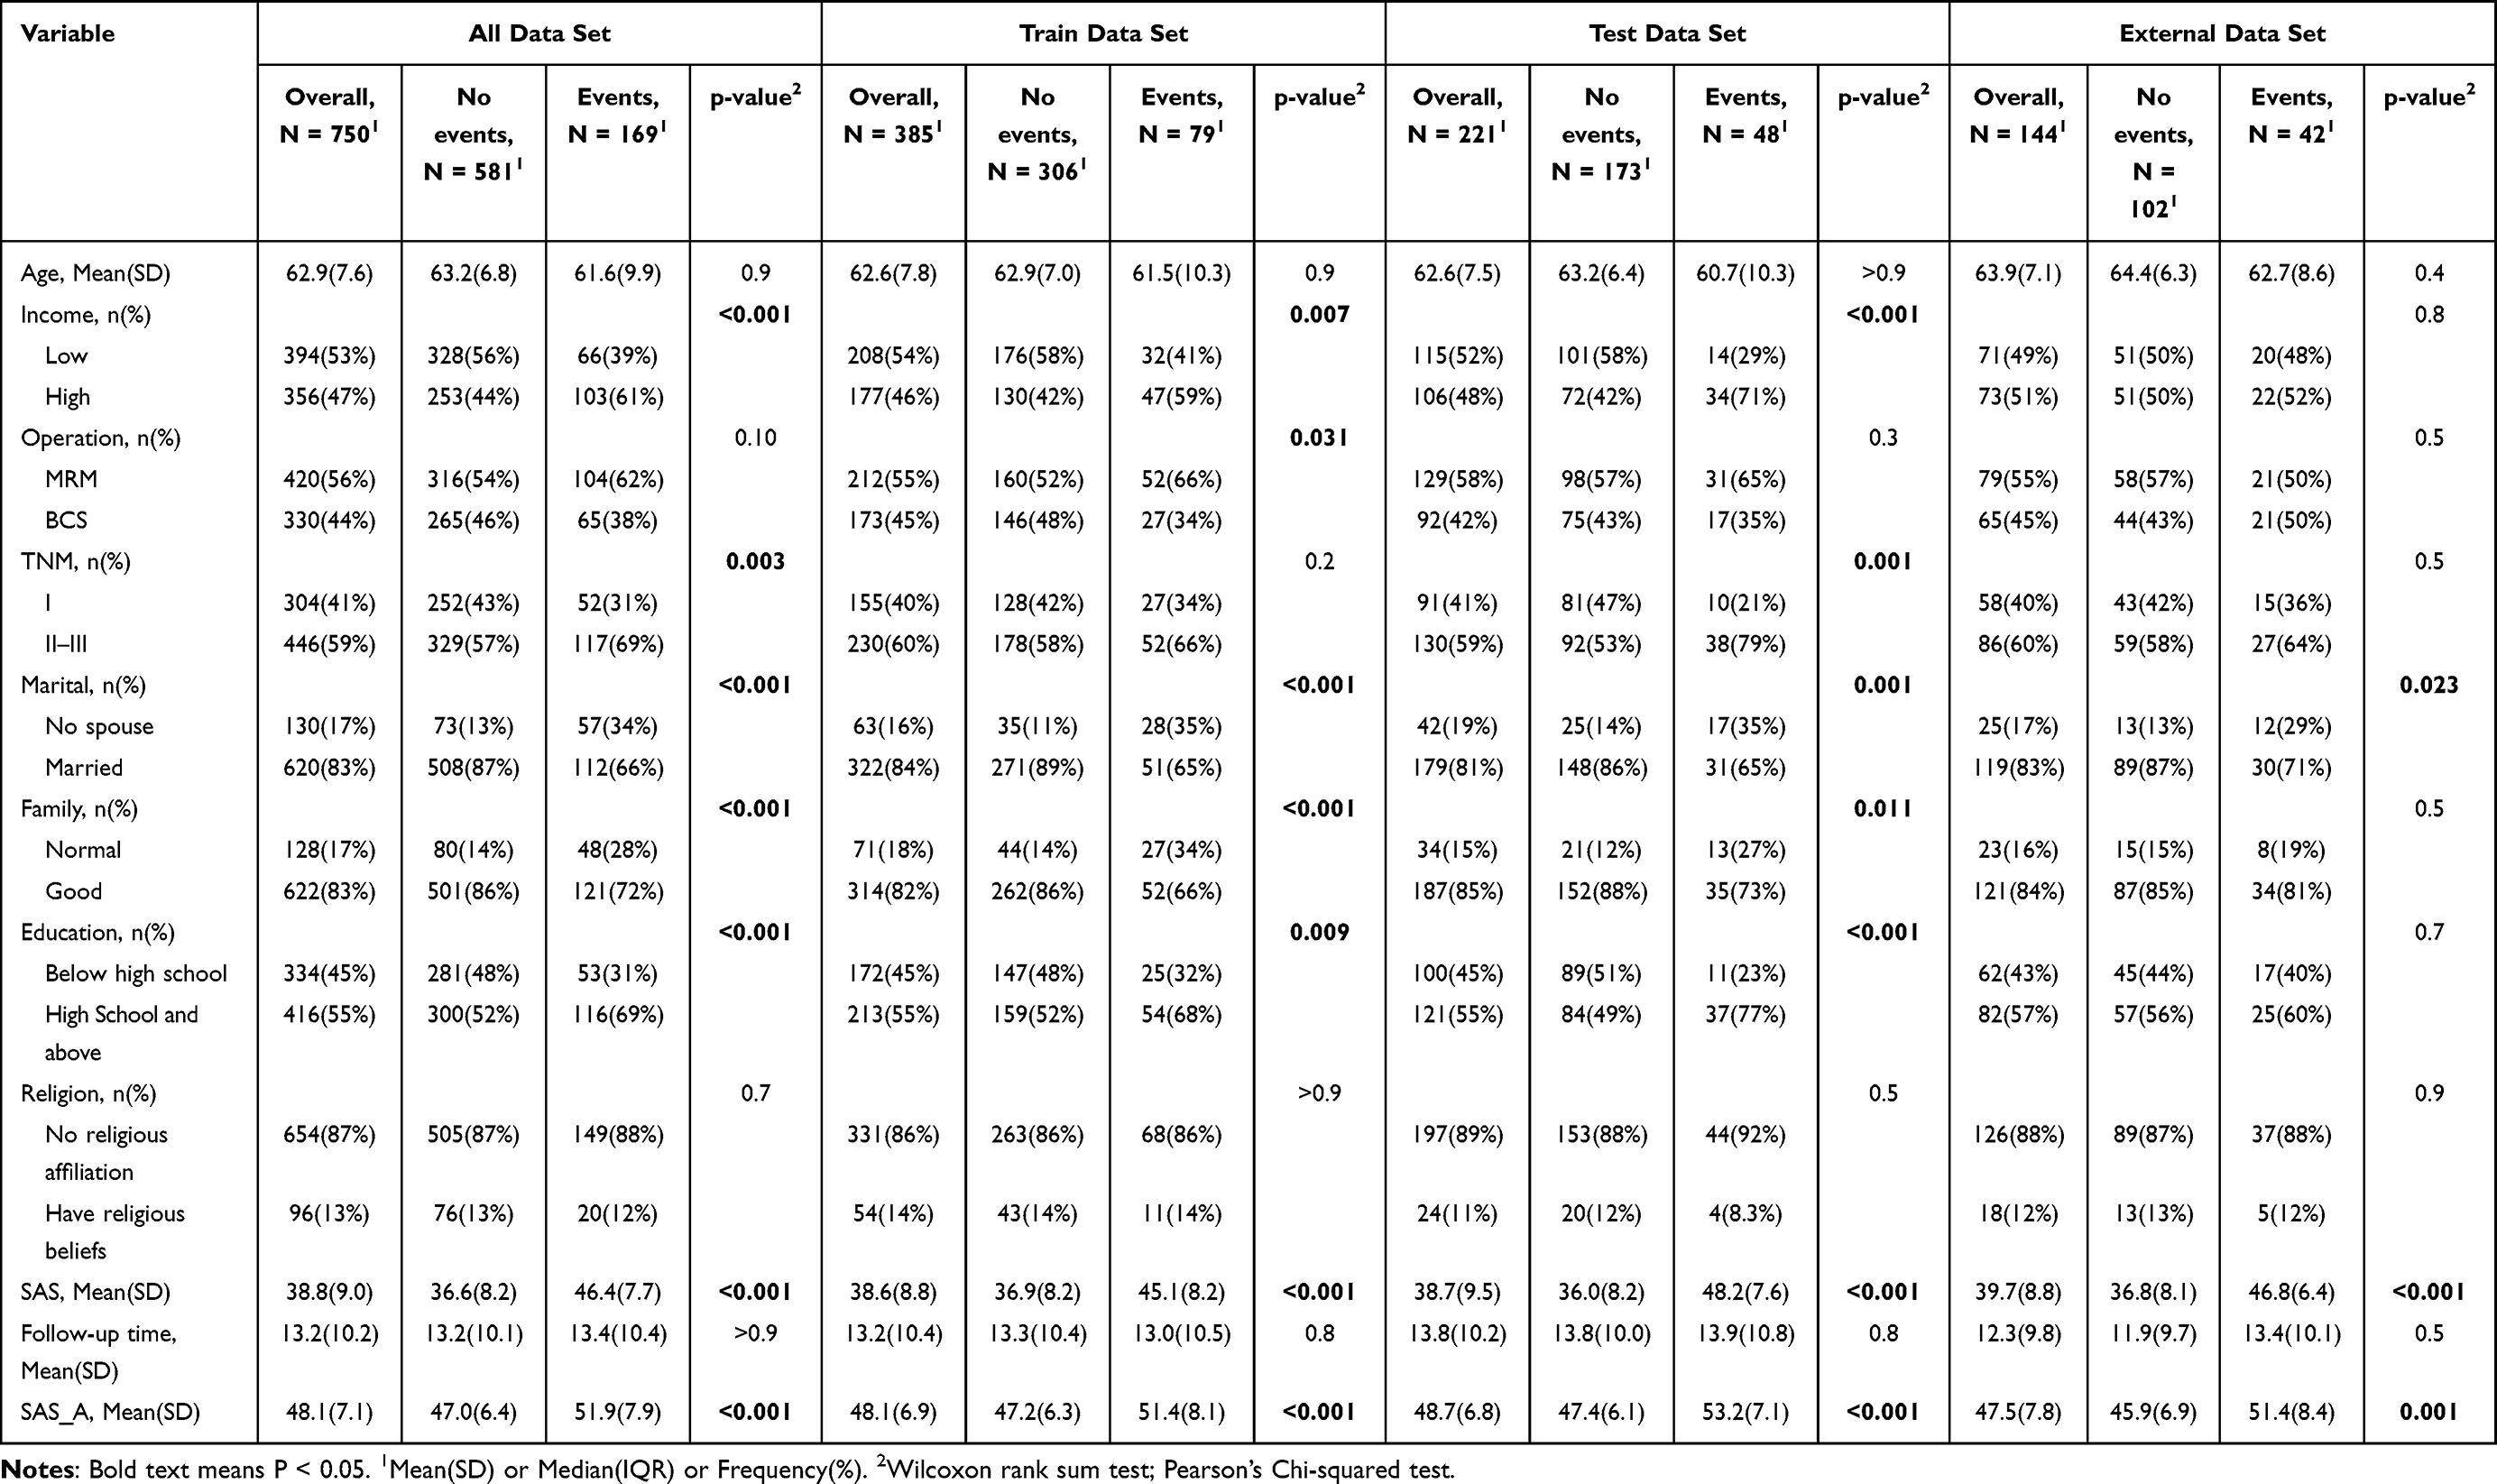 |
Table 1 Full Data Set, Training Set, Validation Set and External Data List |
SAS, SAS_A, and Disease Progression Events During Follow-Up
In relevant studies, patients with breast cancer and negative emotions have a poorer prognosis, and more than half of the patients with breast cancer with recurrence and metastases feel negative emotions. In this investigation, there was a statistically significant difference between the SAS and SAS_A scores of the two groups with or without disease progression (p < 0.0001). The ROC curve showed that SAS_A could be used to effectively distinguish disease progression events, with a ROC AUC of 0.684 (95% CI: 0.627–0.742, p-value < 0.0001) and a cutoff value of 53 in this study. K-M analysis based on the SAS A cutoff value found a difference between the high and low SAS A groups, with a p-value < 0.00001 and a median PFS in the Log rank test. The low score group versus high score group was 50 months vs 17 months, with an HR (low vs high score group) of 0.25 (0.16–0.40), indicating a 75% relative risk reduction. SAS_A was separated into high and low score groups based on the cutoff value, and the number of patients with disease progression in different score group revealed a clustering pattern. In the trend analysis of changes between SAS and SAS_A, it was determined that not all patients exhibited a corresponding upward trend, but various trends were observed (see Figure 1). Based on the above analysis, screening patients with high SAS_A scores cannot be rated just by SAS; rather, multiple factors should be considered when intervening with patients with high SAS_A scores. By reducing the SAS_A scores of these patients, it is feasible to improve their prognosis.
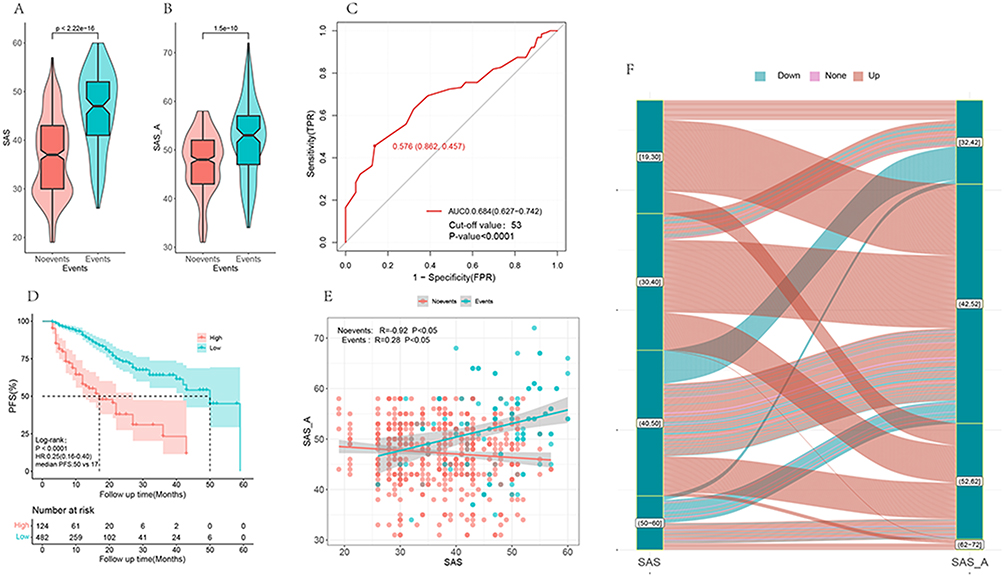 |
Figure 1 SAS and SAS_A scores demonstrated statistically significant differences between the two groups with and without disease progression (p < 0.0001) (A and B). ROC curve indicated that SAS_A could be used to differentiate disease progression events, with AUC = 0.684, 95% CI:0.627–0.742, p-value < 0.0001, cutoff value 53 (C). K-Ms survival study revealed a difference between the high and low SAS_A groups, with Log rank test p-value < 0.0001, median PFS: 50 months versus 17 months for the low and high score groups, HR (low versus high score groups):0.25 (0.16–0.60), relative risk reduction 75% (D). In the two groups with or without disease progression, there was a link between treatment SAS and SAS_A, but the correlation law was different (E), and the variation trend was inconsistent between SAS and SAS_A of patients (F). |
Establishment of SAS_A Grouping Prediction Model
SAS A refers to the SAS score assessed during follow-up period after treatment and concerns disease progression. Previous studies have demonstrated that multidisciplinary continuous care can reduce negative emotions and lower SAS_A scores in patients. By decreasing SAS_A scores following intervention, it is possible to improve disease progression events. To accurately select patients requiring intervention, reduce their negative emotions, and enhance their prognosis, while avoiding unnecessary large-scale interventions that may impose an additional burden on patients and waste medical resources, an effective predictive model should be established. From the training set, multiple approaches were selected for model training. Using univariate analysis of the included variables, income, marital status, family, surgical method, and preoperative SAS score were revealed as independent predictive factors. These independent predictive factors were included in the multivariate analysis, which revealed that SAS and family remained statistically significant after correlation of several other factors. Model 1 was established by including SAS and family status. Random forest analysis revealed that both SAS and income had significant weights, with imp values of 31.274 and 21.59, respectively. Model 2 was created by including SAS and income. The variables were screened by stepwise regression (backward method) to determine SAS and family status. Using Lasso regression analysis,10-fold cross-repeated sampling was conducted to estimate SAS and family status. Through analysis, using the optimal subset approach, the two components—SAS and family status—were identified. Through analysis, it was determined that various strategies emphasized SAS, income, and family status. To further compare the differences between them, we established model 3 including SAS, family, and income, while model 4 includes all factors (Figure 2).
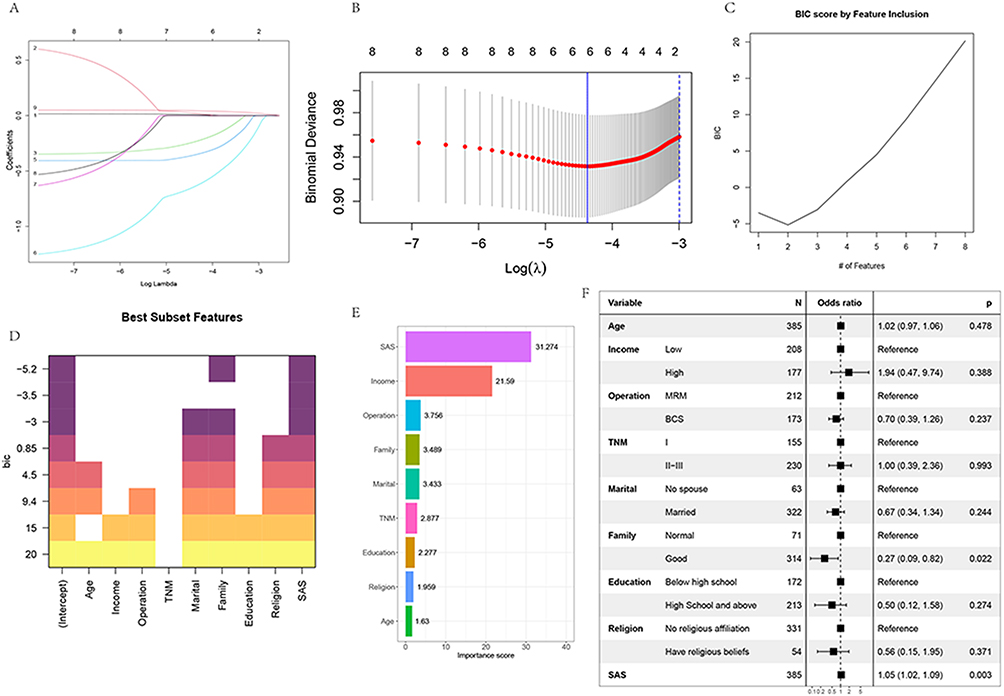 |
Figure 2 LASSO regression analysis and cross-validated Lasso regression analysis including all variables. When lambda was 1se and 2 variables (A and B) were included, variables were screened using the stepwise regression method and optimal subset (C and D), the relevance of each variable was screened using random forest (E), and a forest diagram of all variables was plotted (F). Different methodologies concentrated on the three aspects of SAS, income and family. To further compare the differences, we created model 3 with SAS, family, and income, and model 4 with all components. |
Model Validation and Comparison
ROC curves were produced in the training and validation sets in order to observe the AUC values of the four models in different datasets. In the training set, the AUC was 0.665 (0.592–0.738) for model 1, 0.645 (0.567–0.723) for model 2, 0.668 (0.592–0.743) for model 3, and 0.696 (0.624–0.767) for model 4. In the validation set, the AUC was 0.654 (0.559–0.748) for model 1, 0.667 (0.584–0.770) for model 2, 0.673 (0.580–0.767) for model 3, and 0.712 (0.624–0.800) for model 4. Regardless of the validation set or the training set, the AUC gradually increased from model 1 to model 2. As the model complexity increased and more variables were included, the stability of the models in predicting performance was further compared, with calibration curves plotted. After comparing the C-index, Dxy index, Brier index, and R2, models 1 and 2 with lower efficiency were excluded (Figure 3). Model 3 and model 4 were placed in the training set, validation set, and external dataset respectively to compare NRI. In the training set, the NRI between model 3 and model 4 was 0.0892 (−0.0351–0.2134), p = 0.15947. In the validation set, the NRI between model 3 and model 4 was 0.1529 (−0.0301–0.3359), p=0.10142. In the external dataset, the NRI between model 3 and model 4 was 0.1529 (−0.0301–0.3359), p = 0.10142. In the external dataset, the NRI between model 3 and model 4 was 0.5368 (0.2899–0.7837), p < 0.001. Calibration curve verification was performed for model 3 and model 4, and ROC curves were plotted in the external dataset (Figure 4).
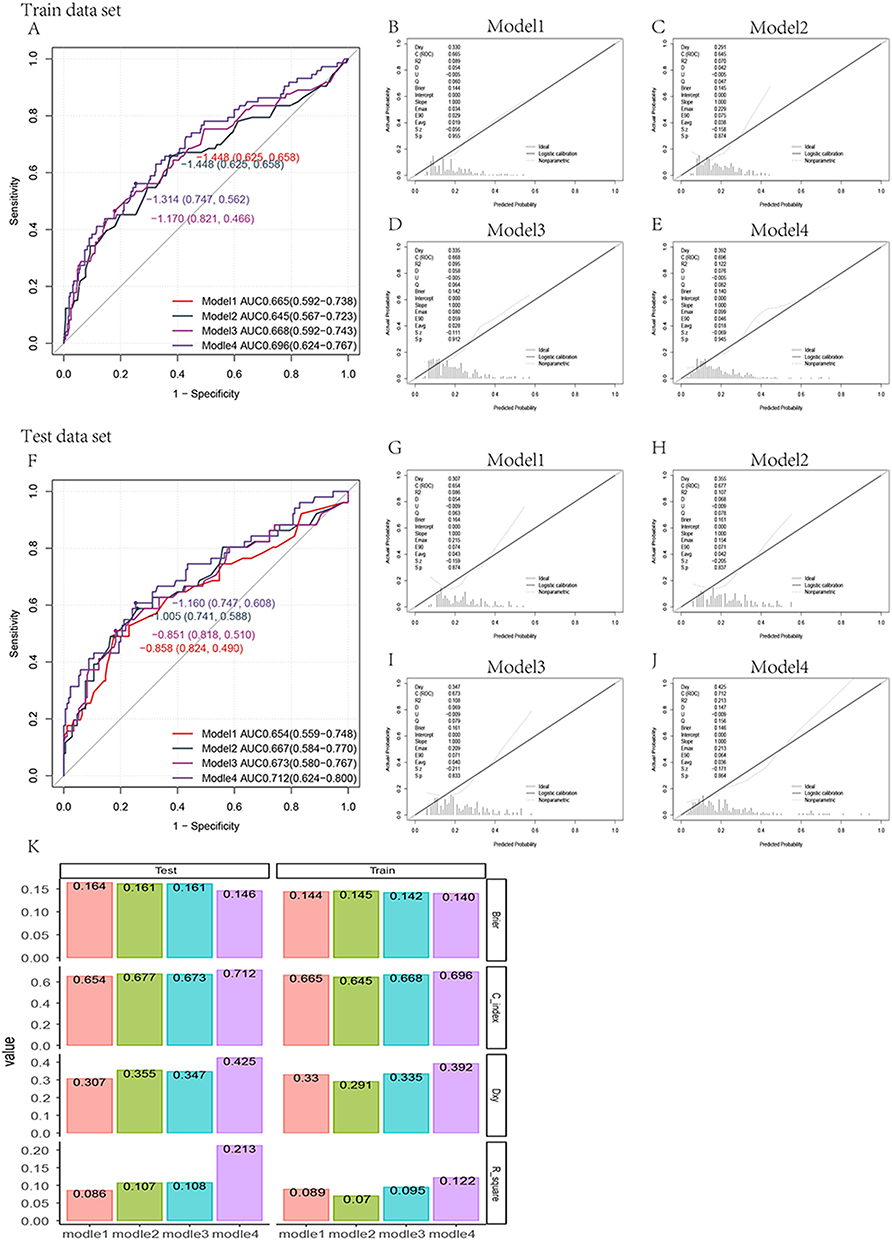 |
Figure 3 In the training set, the area under ROCA curve (AUC) was 0.665 (0.592–0.738) for model 1, 0.645 (0.567–0.723) for model 2, 0.668 (0.592–0.743) for model 3, and 0.696 (0.624–0.767) for model 4. In the verification set, the area under ROCA curve (AUC) was 0.654 (0.559–0.748) for model 1, 0.667 (0.584–0.770) for model 2, 0.673 (0.580–0.767) for model 3, and 0.712 (0.624–0.800) (A and F) for model 4. The calibration curve (B-J) was plotted to compare C index, Dxy index, Brier index, R2 (K) of different models in the training set and test set. |
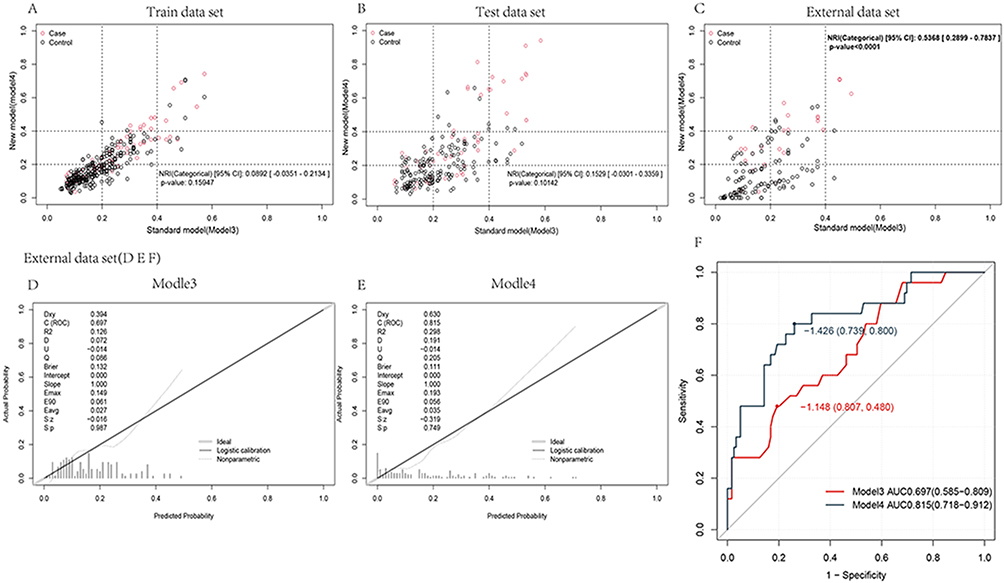 |
Figure 4 NRI of model 3 and model 4 was compared in the training set, test set and external dataset respectively. In the training set, the NRI between model 3 and model 4 was 0.0892 (−0.0351–0.2134), p = 0.15947. In the verification set, the NRI between model 3 and model 4 was 0.1529 (−0.0301–0.3359), p = 0.10142. In the external dataset, the NRI between model 3 and model 4 was 0.1529 (−0.0301–0.3359), p = 0.10142. In the external dataset, the NRI between model 3 and model 4 was 0.5368 (0.2899–0.7837), p < 0.001 (A-C). Calibration curve verification was performed for model 3 and model 4 in external datasets (D and E). The ROC curve (F) was plotted in the external dataset. |
Model Simplification and Visualization
After comparative analysis, model 4, which included all variables, was ultimately chosen. Model 4 possessed a high level of prediction accuracy and stability but was complex and comprised of numerous variables. To further simplify the model for clinical use, we tried to transform it into a score table In to the analysis of the relationship between variables and outcomes in the data (Supplementary Figure 1), stage values were divided according to the curve smoothness, with SAS score divided into [19,23], [23,32], [32,37], [37,42], [42,49], [49,58]; age divided into [35,49], [49,57], [57,67], [67,75], and other factors were categorical variables. The factors were incorporated into the regression model for analysis, and ROC curves were plotted (see Appendix Figure ATT). The scores for various steps were obtained by score conversion (see Table 2), a new model was developed by summarizing the scores, and ROC curves were plotted in the training set, validation set, and external dataset. The results showed that the AUC was 0.689 (0.618–0.760) in the training set, 0.721 (0.637–0.805) in the validation set, and 0.810 (0.719–0.902) in the external dataset, indicating good predictive efficiency. Calibration curves were plotted, and distribution diagrams were finally plotted to verify the model. The calibration curve indicated that the model was predictively effective, and the distribution diagram demonstrated that the probability of high SAS_A scores rose with increasing scores. A nomogram was plotted to visualize the model (Figure 5).
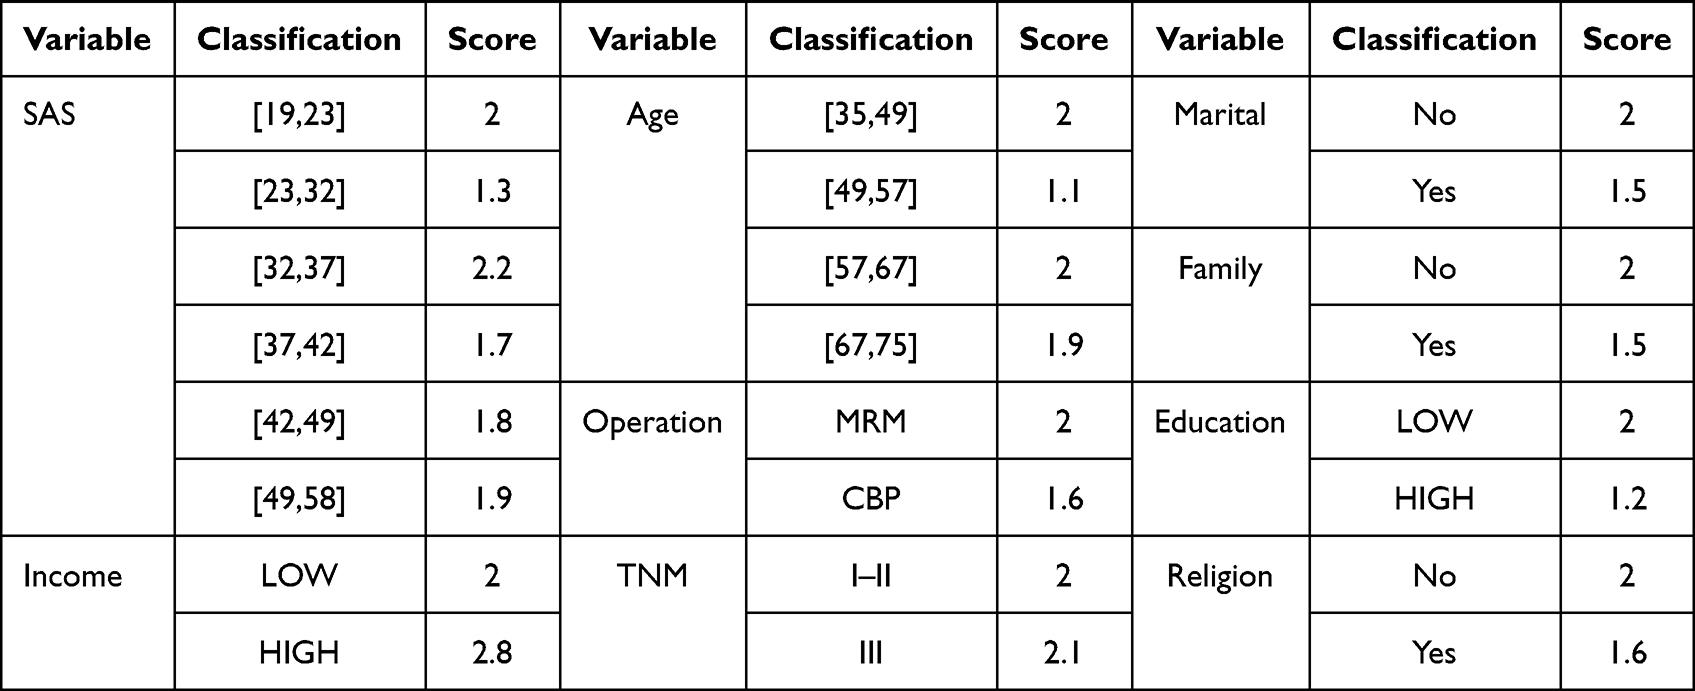 |
Table 2 A Score Table for Different Variables |
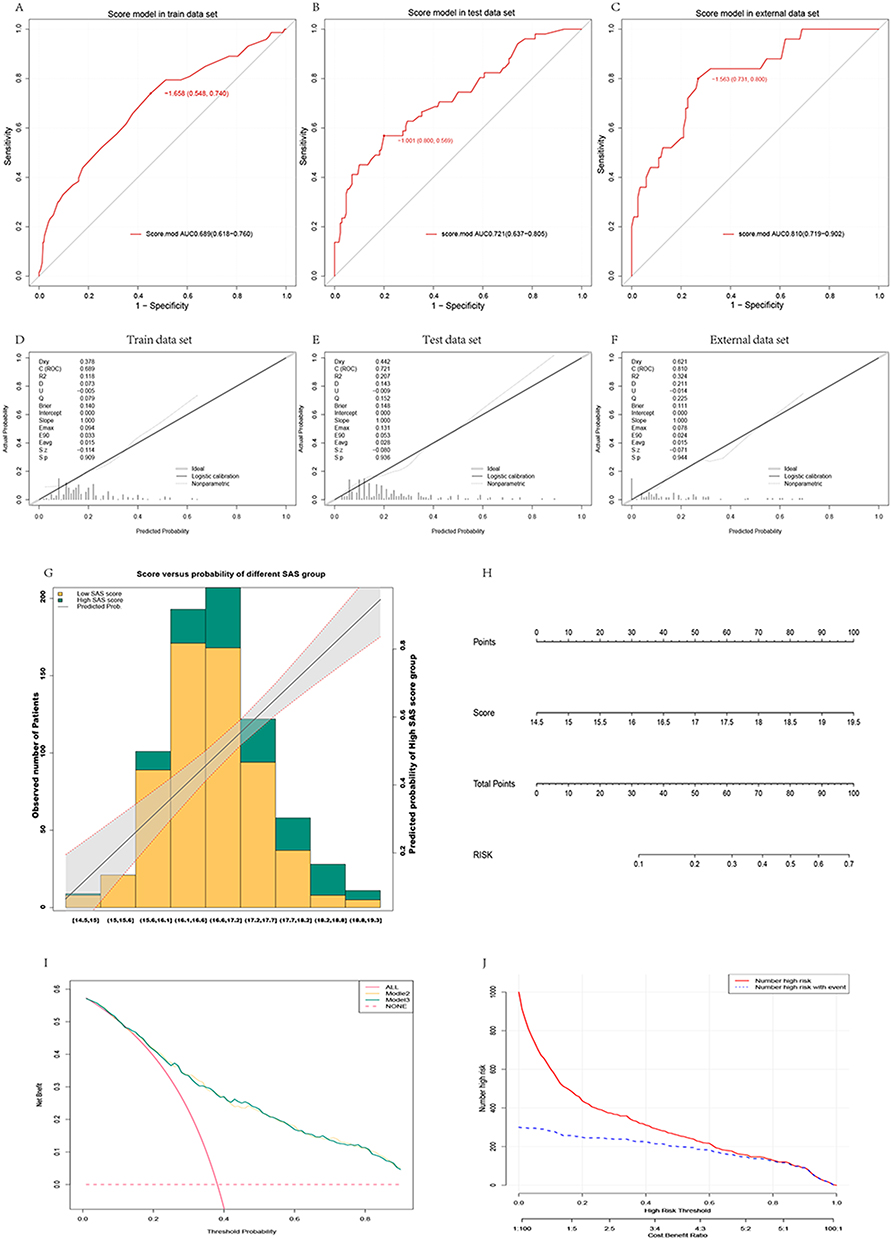 |
Figure 5 ROC was performed in training set, verification set and external data through score model after variable score conversion, and the results showed AUC 0.689 (0.618–0.760) in training set, AUC 0.721 (0.637–0.805) in verification set and AUC 0.810 (0.719–0.902) (A-C) in external data. Calibration curves (D-F) were plotted for the training set, test set and external data, respectively, and the distribution map was finally plotted for verification (G). The model was visualized by plotting nomogram (H). DCA curve found that model 3 and model 4 curves were both above the benefit curve with everyone intervened, which indicated that intervention of patients who are at high-risk by using the model could yield good clinical benefits. The two curves of model 3 and model 4 intertwined with each other and almost coincided, both of which yielded good clinical benefits (I). The CIC curve showed that as the predicted risk increased, the two curves gradually intersected, with predicted risks increasing and more anxiety state appearing (J). |
Decision Curve Analysis (DCA) and Clinical Impact Curve (CIC)
The decision curve analysis (DCA) curve was plotted, finding that model 3 and mode l4 curves were both above the benefit curve when everyone was intervened, indicating that intervention of patients with high-risk using the model could result in good clinical benefits. The two curves of model 3 and model 4 were intertwined and nearly coincident, and both had positive clinical outcomes. We further investigated the clinical impact curve (CIC) transformed into model 4 scores to evaluate clinical benefits, and the curve revealed that as projected risk increased, the two curves gradually intersected. As the anticipated risk rises, anxiety grows. By setting a suitable cutoff value, it is possible to prevent the waste of medical resources caused by excessive medical treatment (Figure 5).
Discussion
Breast cancer is both one of the most prevalent types of cancer and the top cause of mortality among women. From the 2018 WHO statistics, breast cancer has a 11.6% incidence among all cancer types and accounts for 6.5% of global mortality.1 Previous meta-analysis results indicated that the prevalence of depression and anxiety in patients with breast cancer was as high as 32.2% and 41.9%, respectively, and that the mortality risk of patients with breast cancer complicated when depression increased by 18–30%.7,8,14,15 Depression is an independent predictor of poor breast cancer prognosis, although the results of investigations on patients with breast cancer suffering from anxiety are inconsistent.16 Shim et al suggested that anxiety was a predictor of all-cause death from breast cancer, and hypothesized that depression and anxiety disorders were connected with increased mortality [hazard ratio (HR)1.26, 95% CI 1.18–1.36; HR 1.14, 95% CI 1.08–1.22, respectively] and their co-occurrence further increased risk (HR = 1.38, 95% CI 1.24–1.54).17 Groenvold et al observed that anxiety was correlated with relapse-free survival, but not with overall survival, implying that an absence of anxiety is associated with a longer relapse-free survival.18 This study also discovered that patients with lower anxiety levels had a longer progression-free event, with a median of 50 versus 17 months, HR (low versus high):0.25 (0.16–0.40), and a 75% reduction in relative risk compared to patients with higher anxiety scores. Several studies have demonstrated that this anxious status can be relieved through active intervention, thereby improving the prognosis of patients.5,11,19,20 However, the SAS score at admission and the SAS_A score throughout the post-treatment follow-up period are not identical. In the study, we discovered that the SAS score of some patients increased following treatment, while the SAS score of others declined. We hypothesized that, based solely on the SAS score at admission, it is impossible to predict whether patients will continue to experience anxiety after therapy. We attempted to develop a prediction model to determine if patients will continue to experience anxiety following treatment, and to provide direction for precise action, resulting in improved clinical outcomes.
There may be a link between anxiety and the immune system, and patients with breast cancer are especially susceptible to such a situation.21 However, further research indicates that positive psychological intervention might help alleviate anxiety, such as the development of a multidisciplinary continuous care model. A significant effect of the psycho-education intervention was found to reduce anxiety and depressive symptoms in women with breast cancer. Which is included in the multidisciplinary continuous care mode.20 Because there are such effective intervention means, how to maximize its role, while avoiding the waste of human and material resources, is very important. In this study, we sought to improve incorporating clinically accessible markers into the pre-treatment SAS score, thereby improving the ability to predict the anxiety state of patients after the conclusion of treatment. Variables such as age, income, marital status, family, surgical method, religion, and education were included, which were screened using various procedures. A range of statistical techniques centered on the two variables of income and family, which may have something to do with China’s healthcare model. The pressure of cost, desire and anxiety about family support were analyzed using the ROC curve; the prediction efficiency ranged from 0.665 (0.592–0.738) when SAS and income were included, 0.645 (0.567–0.723) when family and SAS were included, 0.668 (0.592–0.743) when SAS, income, and family were included, and 0.696 (0.624–0.767) when all variables were included. The same pattern was found in the verification set. Although the addition of all variables increased the model’s complexity, it might also improve the prediction efficiency. We further compared the differences between the models by using NRI, which is a very effective measurement for evaluating the improvement in prediction performance achieved by adding markers to a set of baseline predictors.22 In our subsequent model comparison, we compared the differences between each model individually. Although the NRI in the training set and the test set indicated that the fully inclusive model produced a higher NRI than the model that only included income and family, no statistically significant difference was discovered. In the external data verification, the fully included model was superior to other models, with an NRI of 0.5368 (0.2899–0.7837), p-value < 0.0001. Considering that the fully included model can increase the model prediction efficiency and forecast the outcome more precisely with little data, we opted for the fully included model. Although this choice is inconsistent with the standard practice for models produced by statistical approaches, our team believes this option is better suitable for clinical application.
After confirming the model, we investigated ways to further simplify it for clinical use without affecting its predicted accuracy or stability. We separated continuous variables into intervals according to the variance zones of distinct variables and assigned values to each interval using regression analysis. The final total score was verified in the training set, verification set, and external data. We found that the result was AUC 0.689 (0.618–0.760) in the training set, AUC 0.721 (0.637–0.805) in the verification set and AUC 0.810 (0.719–0.902) in the external data, demonstrating good predictive efficiency. Each patient was then scored after converting the values into scores. Based on the overall score, the chance of an anxious state after treatment can be estimated to guide clinical practice. Although we have reached some conclusions during the establishment and validation of the model, the overall prediction efficiency is not very high. This may be because patient prognosis is not determined by a single factor, but by a combination of factors, and that negative emotions include not only anxiety, but also depression, fear, and so on. Moreover, unknown interactions may exist between them.23 However, there are few studies on the prediction of anxiety, therefore we intend to establish a foundation for future studies. The predictive model jointly produced by multiple indicators has been widely implemented in clinical practice, and nomograms are regarded as simpler and more accurate for clinical evaluation, allowing us to broaden our perspective and make better clinical decisions.24,25 We plotted a nomogram to show the research results and drew the DCA and CIC curves to further evaluate the clinical relevance of the model. By combining DCA and CIC studies, we could more accurately predict the cutoff value of the predicted risk, which could be used to guide the follow-up clinical study and provide relevant intervention to patients, thereby maximizing the overall clinical benefit to patients and minimizing the waste of medical resources. The actual clinical efficacy of this model requires further investigation.
Conclusion
Based on the retrospective study data, we further explored the correlation between negative emotions and disease progression and confirmed that negative emotions affected patient prognosis. In addition, a regression model was developed, and a nomogram was created to facilitate clinical decision-making. It is hopeful that further discussions can be made through large-scale clinical observation.
Data Sharing Statement
All data generated or analysed during this study are included in this article. Further enquiries can be directed to the corresponding author.
Ethics Approval and Consent to Participate
I confirm that I have read the Editorial Policy pages. This study was conducted with approval from the Ethics Committee of The First People’s Hospital of LianYunGang, The affiliated hospital of XuZhou medical university. This study was conducted in accordance with the declaration of Helsinki. Written informed consent was obtained from all participants.
Acknowledgments
We would like to acknowledge the hard and dedicated work of all the staff that implemented the intervention and evaluation components of the study.
Disclosure
The authors declare that they have no competing interests.
References
1. Bray F, Ferlay J, Soerjomataram I, Siegel RL, Torre LA, Jemal A. Global cancer statistics 2018: GLOBOCAN estimates of incidence and mortality worldwide for 36 cancers in 185 countries. CA Cancer J Clin. 2018;68(6):394–424. doi:10.3322/caac.21492
2. Sung H, Ferlay J, Siegel RL, et al. Global Cancer Statistics 2020: GLOBOCAN Estimates of Incidence and Mortality Worldwide for 36 Cancers in 185 Countries. CA Cancer J Clin. 2021;71(3):209–249. doi:10.3322/caac.21660
3. Zabora J, BrintzenhofeSzoc K, Curbow B, Hooker C, Piantadosi S. The prevalence of psychological distress by cancer site. Psychooncology. 2001;10(1):19–28. doi:10.1002/1099-1611(200101/02)10:1<19::aid-pon501>3.0.co;2-6
4. An Y, Fu G, Yuan G. Quality of Life in Patients With Breast Cancer: the Influence of Family Caregiver’s Burden and the Mediation of Patient’s Anxiety and Depression. J Nerv Ment Dis. 2019;207(11):921–926. doi:10.1097/NMD.0000000000001040
5. Grusdat NP, Stäuber A, Tolkmitt M, et al. Routine cancer treatments and their impact on physical function, symptoms of cancer-related fatigue, anxiety, and depression. Support Care Cancer. 2022;30(5):3733–3744. doi:10.1007/s00520-021-06787-5
6. Härtl K, Engel J, Herschbach P, Reinecker H, Sommer H, Friese K. Personality traits and psychosocial stress: quality of life over 2 years following breast cancer diagnosis and psychological impact factors. Psychooncology. 2010;19(2):160–169. doi:10.1002/pon.1536
7. Hashemi SM, Rafiemanesh H, Aghamohammadi T, et al. Prevalence of anxiety among breast cancer patients: a systematic review and meta-analysis. Breast Cancer. 2020;27(2):166–178. doi:10.1007/s12282-019-01031-9
8. Wang X, Wang N, Zhong L, et al. Prognostic value of depression and anxiety on breast cancer recurrence and mortality: a systematic review and meta-analysis of 282,203 patients. Mol Psychiatry. 2020;25(12):3186–3197. doi:10.1038/s41380-020-00865-6
9. Gold M, Dunn LB, Phoenix B, et al. Co-occurrence of anxiety and depressive symptoms following breast cancer surgery and its impact on quality of life. Eur J Oncol Nurs. 2016;20:97–105. doi:10.1016/j.ejon.2015.06.003
10. Xie X, Li H, Wang C, et al. Effect of modified radical mastectomy combined with neo-adjuvant chemotherapy on postoperative recurrence rate, negative emotion, and life quality of patients with breast cancer. Am J Transl Res. 2022;14(1):460–467.
11. He X, Ng MSN, Choi KC, So WKW. Effects of a 16-week dance intervention on the symptom cluster of fatigue-sleep disturbance-depression and quality of life among patients with breast cancer undergoing adjuvant chemotherapy: a randomized controlled trial. Int J Nurs Stud. 2022;133:104317. doi:10.1016/j.ijnurstu.2022.104317
12. Kim YH, Choi KS, Han K, Kim HW. A psychological intervention programme for patients with breast cancer under chemotherapy and at a high risk of depression: a randomised clinical trial. J Clin Nurs. 2018;27(3–4):572–581. doi:10.1111/jocn.13910
13. Izci F, Ilgün AS, Fındıklı E, Özmen V. Psychiatric Symptoms and Psychosocial Problems in Patients with Breast Cancer. J Breast Health. 2016;12(3):94–101. doi:10.5152/tjbh.2016.3041
14. Pilevarzadeh M, Amirshahi M, Afsargharehbagh R, Rafiemanesh H, Hashemi SM, Balouchi A. Global prevalence of depression among breast cancer patients: a systematic review and meta-analysis. Breast Cancer Res Treat. 2019;176(3):519–533. doi:10.1007/s10549-019-05271-3
15. Pinquart M, Duberstein PR. Depression and cancer mortality: a meta-analysis. Psychol Med. 2010;40(11):1797–1810. doi:10.1017/S0033291709992285
16. Satin JR, Linden W, Phillips MJ. Depression as a predictor of disease progression and mortality in cancer patients: a meta-analysis. Cancer. 2009;115(22):5349–5361. doi:10.1002/cncr.24561
17. Shim EJ, Lee JW, Cho J, et al. Association of depression and anxiety disorder with the risk of mortality in breast cancer: a National Health Insurance Service study in Korea. Breast Cancer Res Treat. 2020;179(2):491–498. doi:10.1007/s10549-019-05479-3
18. Groenvold M, Petersen MA, Idler E, Bjorner JB, Fayers PM, Mouridsen HT. Psychological distress and fatigue predicted recurrence and survival in primary breast cancer patients. Breast Cancer Res Treat. 2007;105(2):209–219. doi:10.1007/s10549-006-9447-x
19. Salam A, Woodman A, Chu A, et al. Effect of post-diagnosis exercise on depression symptoms, physical functioning and mortality in breast cancer survivors: a systematic review and meta-analysis of randomized control trials. Cancer Epidemiol. 2022;77:102111. doi:10.1016/j.canep.2022.102111
20. Al-Alawi KS, Al-Azri M, Al-Fahdi A, Chan MF. Effect of Psycho-Educational Intervention to Reduce Anxiety and Depression at Postintervention and Follow-Up in Women with Breast Cancer: a Systematic Review and Meta-Analysis. Semin Oncol Nurs. 2022;38(6):151315. doi:10.1016/j.soncn.2022.151315
21. Yu S, Li W, Tang L, et al. Depression in breast cancer patients: immunopathogenesis and immunotherapy. Cancer Lett. 2022;536:215648. doi:10.1016/j.canlet.2022.215648
22. Pepe MS, Fan J, Feng Z, Gerds T, Hilden J. The Net Reclassification Index (NRI): a Misleading Measure of Prediction Improvement Even with Independent Test Data Sets. Stat Biosci. 2015;7(2):282–295. doi:10.1007/s12561-014-9118-0
23. Soqia J, Al-Shafie M, Agha LY, et al. Depression, anxiety and related factors among Syrian breast cancer patients: a cross-sectional study. BMC Psychiatry. 2022;22(1):796. doi:10.1186/s12888-022-04469-y
24. Dihge L, Bendahl PO, Rydén L. Nomograms for preoperative prediction of axillary nodal status in breast cancer. Br J Surg. 2017;104(11):1494–1505. doi:10.1002/bjs.10583
25. Park SY. Nomogram: an analogue tool to deliver digital knowledge. J Thorac Cardiovasc Surg. 2018;155(4):1793. doi:10.1016/j.jtcvs.2017.12.107
 © 2023 The Author(s). This work is published and licensed by Dove Medical Press Limited. The
full terms of this license are available at https://www.dovepress.com/terms
and incorporate the Creative Commons Attribution
- Non Commercial (unported, 3.0) License.
By accessing the work you hereby accept the Terms. Non-commercial uses of the work are permitted
without any further permission from Dove Medical Press Limited, provided the work is properly
attributed. For permission for commercial use of this work, please see paragraphs 4.2 and 5 of our Terms.
© 2023 The Author(s). This work is published and licensed by Dove Medical Press Limited. The
full terms of this license are available at https://www.dovepress.com/terms
and incorporate the Creative Commons Attribution
- Non Commercial (unported, 3.0) License.
By accessing the work you hereby accept the Terms. Non-commercial uses of the work are permitted
without any further permission from Dove Medical Press Limited, provided the work is properly
attributed. For permission for commercial use of this work, please see paragraphs 4.2 and 5 of our Terms.
Recommended articles
Development and Validation of a Predictive Nomogram with Age and Laboratory Findings for Severe COVID-19 in Hunan Province, China
Jiang J, Zhong W, Huang W, Gao Y, He Y, Li X, Liu Z, Zhou H, Fu Y, Liu R, Zhang W
Therapeutics and Clinical Risk Management 2022, 18:579-591
Published Date: 17 May 2022
Establishment and Validation of a Model for Disease-Free Survival Rate Prediction Using the Combination of microRNA-381 and Clinical Indicators in Patients with Breast Cancer
Shen J, Wang M, Li F, Yan H, Wang R, Zhou J
Breast Cancer: Targets and Therapy 2022, 14:375-389
Published Date: 30 November 2022
A Visualized Mortality Prediction Score Model in Hematological Malignancies Patients with Carbapenem-Resistant Organisms Bloodstream Infection
Qian C, Wu Q, Ruan Z, Liu F, Li W, Shi W, Ma L, Peng D, Yin H, Yao L, Li Z, Hong M, Xia L
Infection and Drug Resistance 2023, 16:201-215
Published Date: 7 January 2023
Predictive Model of Functional Exercise Compliance of Patients with Breast Cancer Based on Decision Tree
Luo Z, Luo B, Wang P, Wu J, Chen C, Guo Z, Wang Y
International Journal of Women's Health 2023, 15:397-410
Published Date: 21 March 2023
Predictive Models of Psychological Distress, Quality of Life, and Adherence to Medication in Breast Cancer Patients: A Scoping Review
Pezzolato M, Spada GE, Fragale E, Cutica I, Masiero M, Marzorati C, Pravettoni G
Patient Preference and Adherence 2023, 17:3461-3473
Published Date: 19 December 2023