Back to Journals » International Journal of Women's Health » Volume 18
Epidemiological Trends of Air Pollution-Induced Lower Respiratory Infections among Women of Childbearing Age: A Global Burden Analysis, 1990–2051
Received 18 March 2026
Accepted for publication 25 May 2026
Published 3 June 2026 Volume 2026:18 610117
DOI https://doi.org/10.2147/IJWH.S610117
Checked for plagiarism Yes
Review by Single anonymous peer review
Peer reviewer comments 2
Editor who approved publication: Dr Matteo Frigerio
Xiaohan Huang,1 Shengcai Zheng2– 5
1Department of Infection, the First Affiliated Hospital of Guangzhou Medical University, Guangzhou Medical University, Guangdong, People’s Republic of China; 2Guangzhou Institute of Respiratory Health, The First Affiliated Hospital of Guangzhou Medical University, Guangzhou Medical University, Guangdong, People’s Republic of China; 3Guangdong Key Laboratory of Vascular Diseases, Guangzhou Medical University, Guangdong, People’s Republic of China; 4National Clinical Research Center for Respiratory Diseases, Guangzhou Medical University, Guangdong, People’s Republic of China; 5State Key Laboratory of Respiratory Diseases, Guangzhou Medical University, Guangdong, People’s Republic of China
Correspondence: Shengcai Zheng, Guangzhou Institute of Respiratory Health, The First Affiliated Hospital of Guangzhou Medical University, Guangzhou Medical University, Guangdong, People’s Republic of China, Email [email protected]
Background: Women of childbearing age (WCBA, aged 15– 49 years) represent a uniquely vulnerable population to air pollution-induced lower respiratory infections (LRIs), owing to physiological susceptibility, socioeconomic disparities, and disproportionate exposure to household air pollution. Accordingly, this study aims to characterize the epidemiological trends of air pollution-related LRIs among WCBA and elucidate the demographic and socioeconomic drivers underlying their unique vulnerability to these infections.
Methods: Using Global Burden of Disease (GBD) 2021, we applied decomposition analysis, Extreme Gradient Boosting-SHapley Additive exPlanations (XGBoost-SHAP), age-period-cohort (APC), and health inequality analysis to quantify burden determinants and disparities, with Bayesian APC projections to 2051.
Results: Population growth primarily drove age-standardized mortality rates (ASMR) and disability-adjusted life year (DALY) rates globally, while epidemiological shifts dominated in high socio-demographic index (SDI) regions. APC analysis revealed death risk peaked at ages 45– 49 (relative risk [RR]=2.24 for ambient pollution; RR=1.40 for household) and declined in post-1975 cohorts. Air pollution dominated LRIs mortality in WCBA, while location governed their DALYs. Lower SDI strengthened pollution impacts, with higher age correlating with greater risk. Health inequalities widened, with concentration indices increasing 43.8%. Projections forecast a 61.5% ASMR decline for ambient pollution-associated LRIs by 2051.
Conclusion: Both ambient and household air pollution-related LRIs impose substantial, inequitable burdens on WCBA driven by demographic and socioeconomic factors. Ambient pollution dominates mortality, while location and SDI govern DALYs disparities. Health inequalities have widened significantly over three decades. Although projections indicate a 61.5% decline in ambient pollution-related ASMR by 2051, household pollution-related burdens are expected to decline more slowly. Urgent targeted interventions—particularly clean energy access in low-SDI regions and precision prevention in high-SDI areas—remain critical to address persistent health inequalities and meet global burden reduction targets. These findings provide critical evidence for shaping global health policies and achieving health equity for WCBA worldwide.
Keywords: global burden of disease, air pollution, lower respiratory infections, women of childbearing age
Background
Global Burden of Lower Respiratory Infections
Lower respiratory tract infections (LRIs)—including tracheitis, bronchitis, and pneumonia—remain a leading cause of global morbidity and mortality.1 In 2019 alone, approximately 257 million LRI episodes were recorded in men and 232 million in women, with the highest burdens concentrated in low- and middle-income countries.2 A systematic analysis of the Global Burden of Disease (GBD) 2021 data further highlighted that LRIs account for substantial disability-adjusted life years (DALYs) across all age groups, with particular severity in vulnerable populations.3
Air Pollution as a Risk Factor for LRIs
Among modifiable risk factors, air pollution stands out as a critical driver. Ambient particulate matter (PM) and household solid fuel combustion collectively expose nearly 99% of the global population to air quality exceeding World Health Organization guideline limits.4 Household air pollution alone contributes to over a quarter of LRI deaths in children.5 Emerging evidence underscores its persistent threat to adults, especially women engaged in domestic cooking and heating.6,7 Recent global burden assessments further demonstrate that LRIs attributable to PM2.5 show dynamic trends from 1990 to 2021, with projections indicating continued challenges in specific regions.8
Unique Vulnerability of Women of Childbearing Age
Women of childbearing age (WCBA, defined as 15–49 years) face a uniquely elevated susceptibility to air pollution–induced LRIs. This heightened vulnerability arises from multiple intersecting factors: hormonal fluctuations that modulate pulmonary immune responses,9 pregnancy-related physiological changes (eg, decreased lung capacity and altered mucociliary clearance),10 and disproportionate exposure to indoor air pollution from traditional cooking practices in low-resource settings.11
Socioeconomic and Regional Disparities in Air Pollution-Related LRIs
Socioeconomic disparities further compound this burden. In low Socio-demographic Index (SDI) regions, persistent reliance on solid fuels, poor ventilation, and limited healthcare access drive persistently high LRI incidence.12,13 Conversely, middle-high and high SDI regions confront industrialization-driven ambient pollution, with widening inequalities linked to urbanization and uneven policy implementation.14,15 Further evidence indicates that the concentration index for air pollution–related respiratory diseases has increased significantly over the past three decades, with the most rapid rises observed in middle-SDI countries undergoing rapid economic transition.16
Current Knowledge, Gaps in Existing Research, Study Objective and Significance
Despite the clear biological and social rationale for focusing on WCBA, several critical knowledge gaps remain. First, no study to date has exclusively examined air pollution–related LRIs in this demographic group, as most existing research either aggregates all adults or focuses on children or the elderly. Second, studies rarely separate ambient PM pollution from household solid fuel pollution when assessing LRI risks in WCBA, obscuring distinct exposure pathways and policy entry points. Third, comprehensive assessments integrating health inequality metrics (eg, concentration index, slope index of inequality), frontier analysis for national benchmarking, and long-term burden projections specifically for WCBA are lacking. Fourth, although socioeconomic drivers are known to underlie disparities, they have not been systematically explored using advanced machine learning interpretability methods such as SHAP. Fifth, most studies focus primarily on mortality, neglecting DALYs and the divergence between fatal and non-fatal outcomes—a gap particularly relevant for WCBA, where morbidity may have substantial reproductive and economic implications.
To address these gaps, this study has six corresponding aims: (1) to characterize epidemiological trends of air pollution–induced LRIs among WCBA from 1990 to 2021 using GBD 2021 data; (2) to separate ambient PM-related from household air pollution-related LRIs for distinct policy recommendations; (3) to quantify demographic and epidemiological drivers via decomposition analysis; (4) to apply XGBoost-SHAP combined with age-period-cohort modeling to disentangle complex, non-linear driver mechanisms; (5) to assess SDI-stratified health inequalities through frontier analysis and inequality metrics (SII and CI); and (6) to project burden trajectories to 2051 using Bayesian APC modeling. Our findings offer actionable evidence for targeted global health policy aimed at reducing the disproportionate LRI burden among women of childbearing age and advancing health equity.
Methods
Study Design and Data Source
This secondary analysis utilized the 2021 Global Burden of Disease (GBD) dataset, which integrates 100,983 data sources to estimate incidence, prevalence, mortality, and disability-adjusted life years (DALYs) for 371 diseases and injuries across 204 countries and territories.17 The GBD framework provides standardized metrics including absolute counts, age-standardized rates (ASRs), and crude rates per 100,000 individuals. This study complied with the Guidelines for Accurate and Transparent Health Estimates Reporting (GATHER) standards.18 As the analysis utilized publicly available, anonymized aggregate data without personal identifiers, institutional review board approval and informed consent were not required.
WCBA were defined as women aged 15–49 years, consistent with standard demographic definitions used by the World Health Organization and the GBD study. Within the GBD 2021 framework, air pollution-related LRIs were analyzed as two distinct exposure categories: (1) LRIs attributable to ambient particulate matter pollution, encompassing outdoor fine particulate matter (PM2.5) and ozone exposure from industrial emissions, vehicular exhaust, and transboundary pollution; and (2) LRIs attributable to household air pollution from solid fuels, resulting from the combustion of coal, wood, charcoal, dung, and agricultural residues for cooking, heating, and lighting in residential settings. These two risk factors were analyzed separately throughout all analyses to capture their distinct exposure patterns, health impacts, and policy implications across different SDI strata. The GBD framework estimates attributable burden by comparing observed exposure distributions with theoretical minimum risk exposure levels, integrating exposure estimates with relative risk functions derived from systematic reviews of epidemiological studies.
The ASR was calculated using the formula:
where ai denotes the age-specific rate for the ith age group, wi represents the weight of the corresponding age group in the reference population, and A is the total number of age groups. This approach adjusts for age distribution differences to enable cross-population comparisons.19
Decomposition Methodology
To explore the factors driving changes in ASMR and ASDR of LRIs from 1990 to 2021, decomposition analyses were conducted across SDI regions and by population dynamics (size, age structure, and epidemiological shifts). First, LRIs burdens were stratified into SDI-based subgroups. Additionally, a decomposition model was applied to quantify the contributions of population growth, aging, and epidemiological changes (defined as population-and age-standardized rate variations) to three-decade trends.20–22
Age-Period-Cohort (APC) Model Analysis
An APC model was employed to analyze GBD trends, aligning 5-year age groups (15–49 years, 7 categories) with 5-year time intervals (1990–2021, 7 periods).23,24 Using the 2021 GBD database, the model evaluated age, period, and cohort effects on LRI-related outcomes. The reference group for period effects was set to 2005–2010, representing a midpoint in the study timeframe, while the reference cohort was set to 1975, corresponding to the central birth cohort. Age effects were reflected in cohort-specific rates, and period or cohort effects were presented as relative risks (RR) relative to these reference groups. Trends were tested via the Wald χ2-test. The Wald test evaluates whether the estimated effects deviate significantly from the null hypothesis of no effect, providing statistical evidence for the presence of age, period, or cohort patterns. All analyses were stratified by SDI level (low, low-middle, middle, high-middle, high) and pollution type (ambient particulate matter versus household solid fuel) to ensure consistent handling of potential effect modifiers. Reference selection was based on midpoint positioning to minimize boundary effects and enhance interpretive stability.
eXtreme Gradient Boosting (XGBoost) Analysis
Using air pollution-associated LRIs data from the 1990–2021 GBD 2021 dataset, we constructed an XGBoost model to predict LRIs mortality and DALY rates. Five predictor variables were selected based on their epidemiological relevance and theoretical importance: (1) age group midpoint (eg, 17 for 15–19 years, 47 for 45–49 years), capturing biological vulnerability across the reproductive lifespan; (2) calendar year, reflecting temporal trends in exposure, healthcare access, and policy interventions; (3) risk factor type (coded as low=household/indoor, high=ambient/outdoor), enabling separate assessment of pollution sources; (4) geographic region (204 countries/territories), accounting for spatial heterogeneity in socioeconomic development and environmental conditions; and (5) logarithm of population size, serving as an adjustment factor to stabilize estimates across varying population bases and avoid bias from demographic fluctuations. Outputs were log-transformed LRIs mortality and DALY rates [log(mortality/DALY rate + 1)]—a transformation applied to address data skewness and handle zero values appropriately. The selection of these predictors was grounded in established epidemiological frameworks: age represents biological susceptibility; calendar year captures period effects including policy changes and healthcare advancements; risk factor type distinguishes the two major pollution pathways; region accounts for geographic and developmental heterogeneity; and population size ensures robust estimation across diverse demographic contexts. Model specifications were:
log(Outcome Ratey,c,a + 1) ~ a + y + r + (log(pnurm))y,c,a
log(Outcome Ratey,c,a + 1) ~ a + y + (r+c)y,a + (log(pnurm))y,c,a
Where y = calendar year; c = country/region; r = risk factor; r+c = risk factor-region interaction; a = age group midpoint (eg, 17 for 15–19 years, 47 for 45–49 years). Outcome Ratey,c,a denotes year-, region-, and age-specific mortality/DALY rates. (log(pnurm))y,c,a-population size logarithm for corresponding year, region, and age group-served as an adjustment factor, accounting for population variations to avoid bias. Log-transforming population size stabilized its effects, enabling robust capture of underlying trends independent of demographic fluctuations.
SHAP Analysis
SHAP values were employed to dissect the incremental contribution of each predictor in the XGBoost model, enabling quantitative assessment of the relative importance of risk factors, year, and age in regulating LRIs burden. Mean absolute SHAP values were calculated to measure the overall predictive significance of individual features, while the direction (positive/negative) and magnitude of case-specific SHAP values further clarified how these factors subtly influenced the model’s output for each observation. Epidemiologically, a positive SHAP value indicates that a feature increases the predicted LRI burden above the baseline expectation for that observation, while a negative value indicates a protective or burden-reducing effect. For example, positive SHAP values for age in older WCBA groups reflect cumulative exposure effects and perimenopausal immune changes that elevate LRI risk, while negative SHAP values for calendar year in recent periods capture the beneficial impacts of clean air policies and healthcare improvements. The SHAP dependence plots reveal nonlinear relationships and interaction effects between features, such as how the air pollution-SDI interaction modulates risk across developmental strata. This interpretive framework not only improved the transparency and credibility of the XGBoost model by unraveling its black-box mechanisms but also generated detailed insights into the key determinants driving variations in LRIs-specific mortality and DALY rates, with direct relevance for stratified prevention strategies.
Cross-Country Health Inequality Analysis
The Slope Index of Inequality (SII) and Concentration Index (CI) were used to measure absolute and relative health disparities across 204 countries or territories (1990–2021).25 SII was estimated via robust regression of ASRs on SDI to minimize outlier influence, while CI was derived from Lorenz curve integration to assess socioeconomic inequalities, enhancing result reliability.
Frontier Analysis
Unlike traditional regression, frontier analysis modeled the nonlinear relationship between SDI and LRI burden, defining a theoretical minimum burden for each country as a performance benchmark. Using local polynomial regression (LOESS) with 1000 bootstrap resamples, the analysis quantified improvement potential as the gap between observed 2021 ASRs and the frontier estimate.26
BAPC Model Projection
The Bayesian Age-Period-Cohort (BAPC) model was utilized to forecast future burdens, leveraging its capability to handle high-dimensional GBD 2021 data.27 Integrating generalized linear models (GLM) with Bayesian inference, the model smooths age-period-cohort effects via second-order random walks. Using Integrated Nested Laplace Approximation (INLA) for posterior inference (overcoming Markov Chain Monte Carlo (MCMC) limitations), the “BAPC” R package was applied with GBD data and IHME demographics to project global LRIs trends.
Statistical Analysis
LRIs burden was evaluated using mortality and DALYs rates (per 100,000). Statistical significance was set at P < 0.05, using appropriate models. All GBD estimates incorporate uncertainty intervals (UIs) derived from 1000 draw-level simulations that account for multiple sources of uncertainty, including sampling error, model specification, and parameter estimation. These uncertainty intervals were propagated through all analyses: decomposition analyses used UI-adjusted rate estimates; APC models incorporated uncertainty via Monte Carlo simulation; XGBoost-SHAP models were trained on mean estimates with sensitivity analyses conducted across UI bounds; and BAPC projections generated probabilistic forecast intervals reflecting both parameter uncertainty and model stochasticity. Health inequality metrics (SII and CI) were calculated with 95% confidence intervals derived from bootstrap resampling (n=1000). All analyses and visualizations were performed via the WHO Health Equity Assessment Toolkit and R Software (v4.3.3), with XGBoost implemented through the “xgboost” package and SHAP analysis via the “shap” package. Model diagnostics for XGBoost included cross-validated R2, root mean squared error (RMSE), and learning curve analysis to assess model fit and guard against overfitting.
Results
Decomposition Analysis on the Epidemiology of LRIs Attributable to Air Pollution Among WCBA
Figure 1 illustrates the decomposition of epidemiological drivers for air pollution-associated LRIs among WCBA across SDI regions from 1990 to 2021. For ambient particulate matter pollution-related LRIs, population growth emerged as the predominant driver of increasing ASMR and ASDR globally, contributing 5107.12 deaths and 292,463.05 DALYs, respectively (Figure 1A and B and Table A.1, A.3). In contrast, high-SDI regions demonstrated a primary dependence on epidemiological changes (contributing −1311.43 deaths and −73,963.52 DALYs), reflecting the success of clean air policies and healthcare optimization. For household solid fuel pollution-related LRIs, both population shifts and epidemiological transitions drove changes at the global level and in low-to-middle SDI regions. Notably, low-SDI regions showed the largest epidemiological improvement (−15,529.75 deaths) despite substantial population growth (17,932.85), indicating some progress in clean energy access (Figure 1C and D, Table A.2, A.4). Middle and high-middle SDI regions were primarily influenced by epidemiological changes, associated with clean fuel promotion programs and public health system improvements.
 |
Figure 1 Decomposition of Epidemiological Drivers for air pollution associated LRIs Among WCBA by SDI, 1990–2021. Black dots represent the cumulative effect of all decomposed components. For each determinant: positive values indicate contributions to increased ASMR (A and C) and ASDR (B and D), whereas negative values denote contributions to rate reductions. Abbreviations: LRIs, lower respiratory infections; WCBA, women of childbearing age; SDI, socio-demographic index; ASMR, age-standardized mortality rate; ASDR, age-standardized DALYs rate. |
APC-Integrated Analysis of the Epidemiology of Air Pollution-Linked LRIs in WCBA
Supplementary Figure S1 presents the APC analysis results for air pollution-related LRIs among WCBA. For ambient particulate matter-related LRIs, after adjusting for period and cohort effects, the death RR exhibited a clear age gradient, increasing gradually from 0.84 (95% CI: 0.11, 6.72) in the 15–19 age group to a peak of 2.24 (95% CI: 0.41, 12.09) in the 45–49 age group (Figure S1.A and Table B.1).The DALYs RR followed a similar pattern, rising from 1.05 to 1.67 (95% CI: 1.33, 2.11) in the oldest age group (Figure S1.G and Table B.7). For household solid fuel pollution, the death RR also peaked at 1.40 (95% CI: 0.46, 4.31) in the 45–49 age group (Figure S1.D and Table B.2), while the DALYs RR showed a different pattern, reaching a nadir of 0.98 (95% CI: 0.85, 1.13) in the 35–39 age group (Figure S1.J and Table B.8), indicating that the non-fatal burden from household pollution is lowest in the mid-reproductive age range.
Regarding period effects, the death RR for ambient pollution declined steadily from 1.16 in 1990–1995 to 0.74 in 2020–2025 (Figure S1.B and Table B.3), while household pollution showed a more dramatic decline from 1.43 to 0.51 over the same period (Figure S1.E and Table B.4), reflecting the impact of clean cooking initiatives. Parallel DALYs trends were observed, with the ambient period RR declining from 1.16 to 0.75 (Figure S1.H and Table B.9) and the household period RR falling from 1.43 to 0.51 (Figure S1.K and Table B.10).
Cohort analysis revealed that earlier birth cohorts faced substantially higher risks, with the 1945 cohort showing death RRs of 2.06 for ambient pollution and 5.01 for household pollution compared to the 1975 reference cohort (Figure S1.C and Table B.5; Figure S1.F and Table B.6), demonstrating generational improvements in exposure profiles and healthcare access. Similar cohort patterns were evident for DALYs, with the 1945 cohort showing RRs of 2.04 for ambient pollution and 5.00 for household pollution compared to the reference (Figure S1.I and Table B.11; Figure S1.L and Table B.12), reinforcing the robustness of generational health gains across both mortality and disability outcomes.
XGBOOST-SHAP-Based Analysis of the Epidemiology of Air Pollution-Associated LRIs Among WCBA
Figure 2 and Supplementary Figures S2-S6 present the XGBoost-SHAP analysis results. This analysis investigated the impacts of age, region, population logarithm, air pollution type (coded as low=indoor/household, high=ambient/outdoor), and year on LRIs mortality and DALYs among WCBA. For mortality, air pollution type emerged as the most important predictor (mean |SHAP| = 0.545), followed by population logarithm (0.483), region (0.465), age (0.121), and year (0.045) (Figure S2). For DALYs, the ranking differed: region (36.288) > air pollution type (27.790) > population logarithm (10.990) > year (4.255) > age (2.956) (Figure S3), indicating that geographic disparities are the dominant driver of non-fatal burden. The dependence plots revealed that indoor air pollution (household solid fuel use) had positive SHAP values for both mortality and DALYs predictions, while outdoor air pollution showed negative values, suggesting differential risk profiles between pollution sources. As population logarithm increased, SHAP values decreased, indicating that more populous areas may have better healthcare access. When stratified by SDI level, air pollution showed the strongest impact on mortality (2.123) and DALYs (115.224) in low-SDI regions, with the effect diminishing as SDI increased (Figure S4-S5). The interaction between air pollution type and SDI was identified as the core factor influencing LRIs burden, with importance coefficients of 0.761 for mortality and 41.37 for DALYs (Figures 2 and S6). As this interaction feature value increased (representing progression from low-SDI/household pollution to high-SDI/ambient pollution), the SHAP value for mortality decreased from 3.5 to −0.5, and for DALYs from 175 to −25, reflecting the transition from high-mortality household pollution in low-SDI settings to lower-mortality ambient pollution in high-SDI regions. Meanwhile, age showed positive SHAP associations with both outcomes, while population logarithm and year exhibited downward trends, consistent with improving prevention and healthcare over time (Figures 2 and S6).
 |
Figure 2 XGBoost Model Interpretation via SHAP for LRIs Mortality Among WCBA Across Five SDI. SHAP summary plots depict the effects of four features-age, year, risk factor-location interaction, and population logarithm-on LRIs mortality. (A) Summary plot. (B–E) Dependence plots illustrating the contribution of age (B), year (C), log(population) (D), and risk factor-location interaction (E). Each dot represents an individual observation in the dataset; color intensity indicates the original feature value (pink = high value, yellow = low value). The x-axis denotes SHAP values, which reflect the magnitude and direction of the feature’s impact on the XGBoost model output; the y-axis lists the respective features. Abbreviations: LRIs, lower respiratory infections; WCBA, women of childbearing age; SHAP, Shapley additive explanations. |
Health Disparities in Epidemiological Trends of LRIs Associated with Air Pollution Among WCBA
Figure 3 and Table C.1-C.5 present the health inequality analysis results. For ambient particulate matter pollution-related LRI deaths, the SII showed a marginally narrowing gap between high and low SDI regions, changing from −0.36 (95% CI: −0.48 to −0.24) in 1990 to −0.36 (95% CI: −0.45 to −0.28) in 2021. However, the concentration index revealed a 43.8% increase in inequality, rising from 0.16 (95% CI: 0.06 to 0.26) to 0.23 (95% CI: 0.13 to 0.33), indicating that while absolute disparities slightly narrowed, relative inequality worsened as LRIs deaths became more concentrated among disadvantaged populations (Figure 3A–D and Table C.1-C.3). For household solid fuel pollution-related deaths, the SII documented a more substantial reduction in disparities, dropping from −5.46 (95% CI: −5.96 to −4.96) in 1990 to −2.84 (95% CI: −3.18 to −2.50) in 2021, while the concentration index increased from 0.59 (95% CI: 0.41 to 0.77) to 0.72 (95% CI: 0.54 to 0.90), reflecting persistent intra-group inequality within SDI strata (Figure 3C and D). In DALYs analysis for ambient pollution, the SII shifted from −1.45 (95% CI: −2.58 to −0.32) to −3.26 (95% CI: −4.35 to −2.18), with the concentration index rising from 0.12 to 0.22 (Figure 3E and F and Table C.4). For household pollution-related DALYs, the SII decreased from −325.20 (95% CI: −354.61 to −295.80) to −167.44 (95% CI: −186.93 to −147.95), while the concentration index increased from 0.60 to 0.72 (Figure 3G and H and Table C.5), highlighting that substantial absolute improvements coexist with worsening relative inequality.
 |
Figure 3 Health Inequality Metrics for LRIs Among WCBA, 1990–2021. (A, C, E and G) SII plots showing the association between SDI and crude death rates from ambient particulate matter-related LRIs (A) or household solid fuel-related LRIs (C), and crude DALYs rates from ambient particulate matter-related LRIs (E) or household solid fuel-related LRIs (G). Point size is proportional to population. (B, D, F and H) Concentration curves illustrating relative inequalities, calculated as the area between the Lorenz curve and the line of equality. Blue and red represent data from 1990 and 2021, respectively. Abbreviations: SII, Slope Index of Inequality; LRIs, lower respiratory infections; WCBA, women of childbearing age; SDI, socio-demographic index; DALYs, disability-adjusted life years. |
Holistic Frontier Analysis on the Epidemiology of Air Pollution-Linked LRIs in WCBA
Supplementary Figure S7 and Table D.1–4 present the frontier analysis results across 204 countries and territories in 2021. For ambient particulate matter-related LRIs, substantial improvement potential was identified: ASMR ranged from 0.001 to 2.765 per 100,000 and ASDR from 0.037 to 146.847 per 100,000, with the largest gaps observed in South Africa (ASMR gap: 2.765), Eswatini (2.326), and Botswana (1.852). Notably, several low-SDI regions achieved effective control despite resource constraints: Bangladesh (ASMR: 0.083), Somalia (0.435), and Mozambique (0.242) performed close to the frontier, suggesting successful community-based interventions. Conversely, certain high-SDI nations including Turkey (ASMR gap: 0.280), Singapore (0.178), and Lithuania (0.136) still demonstrated improvement potential, indicating that economic development alone does not guarantee optimal LRI control (Figure S7A-B and Table D.1, D.3). For household solid fuel-related LRIs, ASMR ranged from 0.000 to 7.573 and ASDR from 0.000 to 404.420, with Lesotho (7.573), Zimbabwe (7.473), and Madagascar (7.044) showing the largest gaps. Some low-SDI areas including Niger, Somalia, and Bhutan managed burdens effectively, while high-SDI countries such as Latvia, Poland, and Russia required further enhancement (Figure S7C-D, Table D.2, D.4), highlighting that household air pollution remains a challenge even in developed economies with legacy solid fuel use.
Projected Epidemiological Trajectories of Air Pollution-Associated LRIs Among WCBA (2022–2051)
Figure 4 presents the BAPC model projections for air pollution-related LRIs among WCBA from 2022 to 2051. Globally, both ASMR and ASDR are projected to decline gradually over the next three decades, with particularly steep reductions expected for ambient particulate matter-related LRIs. Specifically, the ASMR for ambient pollution-related LRIs is forecast to decrease from approximately 0.17 per 100,000 in 2021 to around 0.12 per 100,000 by 2051, representing a 29.4% reduction (Figure 4A). The corresponding ASDR is predicted to fall from roughly 9.0 to 7.0 per 100,000 over the same period (a 22.2% decline) (Figure 4B). More notably, the ASMR for household solid fuel pollution-related LRIs is anticipated to decline from approximately 0.31 to 0.15 per 100,000 between 2021 and 2051, representing a 51.6% reduction (Figure 4C). The associated ASDR for household pollution is expected to decrease from about 18 to 10 per 100,000 (a 44.4% decline) (Figure 4D). These projections suggest that while both pollution types show declining trends, household pollution-related burdens are expected to decrease at a faster rate than ambient pollution-related burdens in absolute terms, though ambient pollution will remain the dominant contributor in high-SDI regions. The slower decline in household pollution-related ASMR relative to its ASDR suggests ongoing challenges in reducing mortality from solid fuel use in low-SDI settings where clean cooking transitions lag behind ambient air quality improvements.
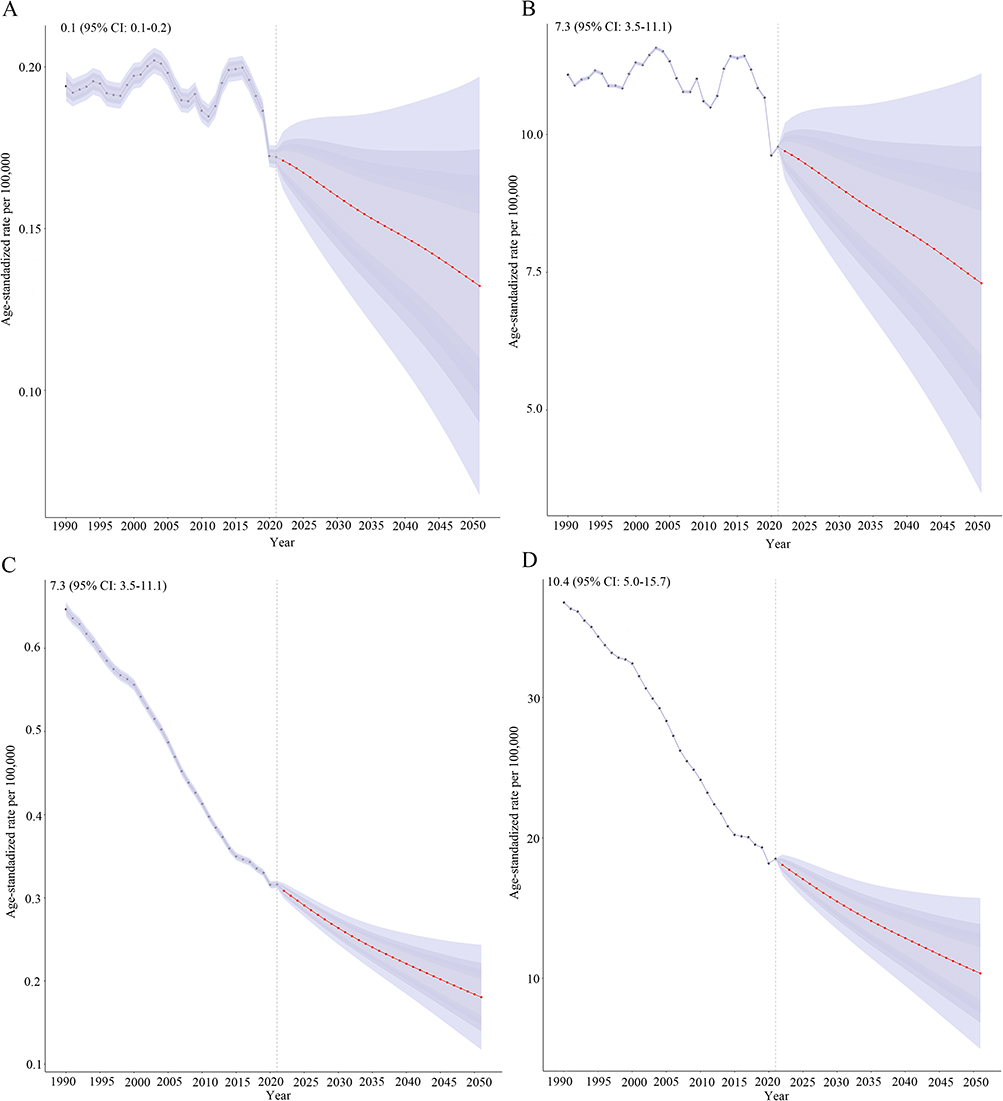 |
Figure 4 Observed and Projected Trends in ASR of LRI Among WCBA, 1990–2051. Solid lines represent observed ASMR and ASDR. Dashed lines denote projections from the BAPC model for 2022–2051. Specifically, (A and B) correspond to ambient particulate matter pollution, while (C and D) correspond to household air pollution from solid fuels. Abbreviations: LRIs, lower respiratory infections; WCBA, women of childbearing age; DALYs, disability-adjusted life years; ASMR, age-standardized mortality rate; ASDR, age-standardized death rate; BAPC, Bayesian age-period-cohort. |
Discussion
Main Findings
This study presents a comprehensive analysis of air pollution-induced lower respiratory infections among women of childbearing age across 204 countries and territories from 1990 to 2021, with projections through 2051. Our findings demonstrate that demographic and epidemiological shifts differentially drive ambient particulate matter pollution- and household solid fuel pollution-linked LRIs in WCBA across SDI strata. Key results indicate that inequality persists and has widened over three decades, deaths and DALYs patterns diverge across pollution types and SDI levels, significant gaps remain in middle-SDI nations, and both ASMR and ASDR are projected to decline steadily through 2051, though household pollution-related burdens are expected to decrease more slowly. These findings provide critical evidence for targeted, equity-focused interventions and global health policy formulation.
Demographic and Epidemiological Drivers of Air Pollution-Related LRIs
Decomposition analysis reveals demographic changes as the primary driver of environmental particulate matter pollution-related LRIs across most SDI regions, consistent with increased pollution exposure amid population growth in low-SDI areas.28 High-SDI regions rely on epidemiological transitions, likely attributed to clean air policies (eg, EU Air Quality Directives) and optimized healthcare resources.29 Household solid fuel pollution-related LRIs in low-SDI regions show dual influences of demographic and epidemiological factors, reflecting lagging energy structure transitions30 and insufficient healthcare resources. Middle-to-high-SDI regions are dominated by epidemiological changes, associated with clean fuel promotion (eg, India’s Ujjwala Scheme)31 and public health system improvements.
Age, Period, and Cohort Effects in Women of Childbearing Age
APC analysis shows the highest LRIs risk among 45–49-year-old WCBA, possibly linked to perimenopausal immune fluctuations32 and cumulative long-term exposure. Post-2005 RR declines correlate with global PM2.5 regulations (eg, Paris Agreement)33 and household clean energy initiatives (eg, WHO Clean Cooking Alliance).34 Decreasing birth cohort risks indicate generational exposure disparities, with the 2005 cohort potentially benefiting from childhood pollution control policies.
Socioeconomic Inequality and SDI-Related Disparities
The interaction between air pollution and SDI is the primary factor influencing LRIs mortality and DALYs among women of childbearing age. Its SHAP values shift from positive to negative around a feature value of 2.5: low-SDI regions improve the situation by promoting clean fuels and enhancing medical facilities, while high-SDI regions intervene through strengthened outdoor pollution control, optimized monitoring, and screening/vaccination. For women aged 15–49, increasing SHAP values of “age” reflect higher risks of adverse LRIs outcomes with age, due to factors like childbirth and accumulated chronic diseases. The declining SHAP values of the logarithm of population and “year” stem from efficient prevention in densely populated areas and advancements in healthcare or policies, respectively, providing a basis for stratified prevention strategies.
Divergence Between Mortality and DALY Patterns
Environmental particulate matter pollution-related LRIs deaths show a marginally narrowed SII gap but worsened concentration index, suggesting global emission reduction policies have shrunk absolute regional burdens while urbanization-driven low-income clustering in pollution hotspots intensifies group-level inequality.35,36 Household solid fuel pollution-related metrics reveal narrowed inter-SDI gaps but rising intra-group inequality, tied to persistent energy poverty in sub-Saharan Africa.37 DALYs analysis shows steeper SII declines than concentration index changes, highlighting the need for policies targeting vulnerable groups.
Future Burden Projections and Public Health Implications
Frontier analysis identifies control gaps in countries like South Africa, attributed to insufficient policy frameworks and weak enforcement-eg, lack of solid fuel use regulation, driving 41% of global households to rely on coal or biomass, worsening household air pollution (HAP).38,39 Nations like Bangladesh have achieved breakthroughs via community health programs.40 Public health funding prioritizes acute diseases over chronic HAP threats, while flawed international cooperation hinders low or middle-income countries from accessing technology and funding for HAP control.41,42 Projections show rapid declines in environmental particulate matter pollution-related LRIs aligned with global targets, but slower reductions for household solid fuel pollution-related LRIs necessitate accelerated clean stove adoption.43 Evidence-based HAP policies, clean-tech research and development, national monitoring, WHO-led climate finance, and multimedia education must integrate to catalyse effective air-quality governance.
Methodological Strengths
This study has several methodological strengths. It focuses exclusively on women of childbearing age, filling a gap in global burden research. Ambient and household air pollution-related LRIs are assessed separately to inform distinct policies. Both mortality and DALYs are evaluated to capture the full burden spectrum. The analysis innovatively integrates XGBoost-SHAP machine learning with age-period-cohort and decomposition methods, revealing complex non-linear epidemiological patterns. Health inequality metrics (SII, CI), frontier analysis for national benchmarking, and 30-year Bayesian APC projections are included, forming a complete evidence chain from burden assessment to future planning. The global dataset covers 204 SDI-stratified countries/territories, ensuring representativeness across diverse development contexts. Finally, SDI-stratified interpretation offers direct policy relevance for high-burden settings, while quantified demographic and epidemiological drivers and pinpointed high-burden regions provide actionable evidence for optimized prevention and resource allocation.
Limitations
This ecological analysis precludes individual causal inference. Air pollution exposure estimates—particularly in low-SDI regions with sparse monitoring, weak vital registration, and underreported mortality—carry substantial uncertainty. Unmeasured reproductive modifiers, coding heterogeneity, and unobserved subnational variation may bias findings. BAPC projections assume stable future trends, vulnerable to unforeseen policy or economic shocks. Residual confounding by SDI-related social and healthcare factors persists, and we were constrained by available GBD 2021 stratifications. Future research should prioritize individual cohort studies, pregnancy-specific data, and high-resolution exposure assessments to address these gaps.
Conclusion
This global analysis shows that air pollution-related LRIs in WCBA remain a persistent and inequitable public health challenge. Burdens are driven by demographic, environmental, and socioeconomic factors. Key contributions include the first exclusive focus on WCBA, integration of XGBoost-SHAP with demographic methods, a 43.8% increase in health inequality (concentration index), identification of air pollution-SDI interaction as the primary driver of disparities, and projections of a 61.5% decline in ambient pollution-related ASMR by 2051 versus slower declines for household pollution. Regional heterogeneity, generational risk declines, and widening inequalities disproportionately affect low-SDI regions. Operational priorities include accelerated clean energy access in low-SDI regions, precision prevention in high-SDI areas, enforceable air quality standards, WHO-led climate finance, and community-based education for WCBA. Covering 204 countries, this study provides robust evidence for targeted interventions and global health equity.
Abbreviations
WCBA, women of childbearing age; LRIs, lower respiratory infections; GBD, Global Burden of Disease; SDI, socio-demographic index; ASMR, age-standardized mortality rate; ASDR, age-standardized disability-adjusted life year rate; DALYs, disability-adjusted life years; APC, age-period-cohort; BAPC, Bayesian age-period-cohort; SII, slope index of inequality; CI, concentration index; SHAP, SHapley Additive exPlanations; RR, relative risk; UI, uncertainty interval.
Data Sharing Statement
This study was based on secondary analysis of publicly available databases, and no original data or new code was generated. The original data for this study were obtained from the GBD 2021 database and GATHER standards (http://ghdx.healthdata.org/gbd-results-tool).
Ethical Approval
This study is a secondary analysis of de-identified, publicly available data from the GBD 2021 study. According to Article 32 (items 1 and 2) of the Measures for Ethical Review of Life Science and Medical Research Involving Human Subjects (China, 2023), research using lawfully obtained, publicly accessible data that do not involve direct contact with human participants or re-identification is exempt from institutional ethics review.
Acknowledgments
We acknowledge the Institute for Health Metrics and Evaluation (University of Washington), the GBD Collaborators, and all staff who provided the data necessary for this study.
Author Contributions
All authors made a significant contribution to the work reported, whether that is in the conception, study design, execution, acquisition of data, analysis and interpretation, or in all these areas; took part in drafting, revising or critically reviewing the article; gave final approval of the version to be published; have agreed on the journal to which the article has been submitted; and agree to be accountable for all aspects of the work.
Funding
There is no funding to report.
Disclosure
The authors report no conflicts of interest in this work.
References
1. Traber KE, Mizgerd JP. The integrated pulmonary immune response to pneumonia. Annu Rev Immunol. 2025;43(1):545–15. doi:10.1146/annurev-immunol-082323-031642
2. Collaborators GL. Age-sex differences in the global burden of lower respiratory infections and risk factors, 1990-2019: results from the global burden of disease study 2019. Lancet Infect Dis. 2022;22(11):1626–1647. doi:10.1016/s1473-3099(22)00510-2
3. GLRIaAR C. Global, regional, and national incidence and mortality burden of non-COVID-19 lower respiratory infections and aetiologies, 1990-2021: a systematic analysis from the global burden of disease study 2021. Lancet Infect Dis. 2024;24(9):974–1002. doi:10.1016/s1473-3099(24)00176-2
4. Bougault V, Carlsten C, Adami PE, et al. Air quality, respiratory health and performance in athletes: a summary of the IOC consensus subgroup narrative review on ‘Acute Respiratory Illness in Athletes’. Br J Sports Med. 2025;59(7):480–490. doi:10.1136/bjsports-2024-109145
5. Puthumana JS, Ngaage LM, Borrelli MR, Rada EM, Caffrey J, Rasko Y. Risk factors for cooking-related burn injuries in children, WHO global burn registry. Bull World Health Organ. 2021;99(6):439.
6. Naz S, Page A, Agho KE. Attributable risk and potential impact of interventions to reduce household air pollution associated with under-five mortality in South Asia. Glob Health Res Policy. 2018;3:4. doi:10.1186/s41256-018-0059-x
7. Wylie BJ, Singh MP, Coull BA, et al. Association between wood cooking fuel and maternal hypertension at delivery in central East India. Hypertens Pregnancy. 2015;34(3):355–368. doi:10.3109/10641955.2015.1046604
8. Wang E, Li S, Wu Y, Liu H, Li Y, Zhou T. Global burden of lower respiratory infections attributable to PM(2.5) across global, regional, national level and China from 1990 to 2021 and predictions to 2035: a cross-sectional study. Ecotoxicol Environ Saf. 2025;303:118913. doi:10.1016/j.ecoenv.2025.118913
9. Harding AT, Heaton NS. The impact of estrogens and their receptors on immunity and inflammation during infection. Cancers. 2022;14(4). doi:10.3390/cancers14040909
10. Li Z, Dunlop AL, Sarnat JA, et al. Unraveling the molecular links between fine particulate matter exposure and early birth risks in African American mothers: a metabolomics study in the Atlanta African American maternal-child cohort. Environ Sci Technol. 2025. doi:10.1021/acs.est.5c02071
11. Halder M, Kasemi N, Roy D, Majumder M. Impact of indoor air pollution from cooking fuel usage and practices on self-reported health among older adults in India: evidence from LASI. SSM Popul Health. 2024;25:101653. doi:10.1016/j.ssmph.2024.101653
12. Kang L, Jing W, Liu J, Liu M. Trends of global and regional aetiologies, risk factors and mortality of lower respiratory infections from 1990 to 2019: An analysis for the global burden of disease study 2019. Respirology. 2023;28(2):166–175. doi:10.1111/resp.14389
13. Lei Z, Sun Z, Li H, Luo J, Zhang L, Zhang Y. Spatiotemporal analysis of the burden of lower respiratory infections in the older adult population due to air pollution: trends from 1990 to 2021 and predictions for the next 30 years. Front Public Health. 2025;13:1554694. doi:10.3389/fpubh.2025.1554694
14. Lu J, Zhao X, Gan S. Global, regional and national burden of tracheal, bronchus, and lung cancer attributable to ambient particulate matter pollution from 1990 to 2021: an analysis of the global burden of disease study. BMC Public Health. 2025;25(1):108. doi:10.1186/s12889-024-21226-w
15. Zhao X, Zhou W, Hong M, Neophytou AM. Urbanization exacerbates disparities in exposure to air pollution in China. Environ Res. 2025;267:120661. doi:10.1016/j.envres.2024.120661
16. Isaifan RJ. Air pollution burden of disease over highly populated states in the Middle East. Front Public Health. 2022;10:1002707. doi:10.3389/fpubh.2022.1002707
17. Ferrari AJ, Santomauro DF, Aali A, et al. Global incidence, prevalence, years lived with disability (YLDs), disability-adjusted life-years (DALYs), and healthy life expectancy (HALE) for 371 diseases and injuries in 204 countries and territories and 811 subnational locations, 1990-2021: a systematic analysis for the Global Burden of Disease Study 2021. Lancet. 2024;403(10440):2133–2161. doi:10.1016/s0140-6736(24)00757-8
18. Stevens GA, Alkema L, Black RE, et al. Guidelines for accurate and transparent health estimates reporting: the GATHER statement. Lancet. 2016;388(10062):e19–e23. doi:10.1016/s0140-6736(16)30388-9
19. Yang K, Yang X, Jin C, et al. Global burden of type 1 diabetes in adults aged 65 years and older, 1990-2019: population based study. BMJ. 2024;385:e078432. doi:10.1136/bmj-2023-078432
20. Das Gupta P. Standardization and decomposition of rates from cross-classified data. Genus. 1994;50(3–4):171–196.
21. Chevan A, Sutherland M. Revisiting Das Gupta: refinement and extension of standardization and decomposition. Demography. 2009;46(3):429–449. doi:10.1353/dem.0.0060
22. Gupta PD. Standardization and Decomposition of Rates: A User’s Manual. Bureau: US Department of Commerce, Economics and Statistics Administration; 1993.
23. Fosse E, Winship C. Bounding analyses of age-period-cohort effects. Demography. 2019;56(5):1975–2004. doi:10.1007/s13524-019-00801-6
24. Bell A. Age period cohort analysis: a review of what we should and shouldn’t do. Ann Hum Biol. 2020;47(2):208–217. doi:10.1080/03014460.2019.1707872
25. Organization WH. Handbook on Health Inequality Monitoring: With a Special Focus on Low-and Middle-Income Countries. World Health Organization; 2013.
26. Xie Y, Bowe B, Mokdad AH, et al. Analysis of the global burden of disease study highlights the global, regional, and national trends of chronic kidney disease epidemiology from 1990 to 2016. Kidney Int. 2018;94(3):567–581. doi:10.1016/j.kint.2018.04.011
27. Knoll M, Furkel J, Debus J, Abdollahi A, Karch A, Stock C. An R package for an integrated evaluation of statistical approaches to cancer incidence projection. BMC Med Res Methodol. 2020;20(1):257. doi:10.1186/s12874-020-01133-5
28. Wolf MJ, Esty DC, Kim H, et al. New insights for tracking global and local trends in exposure to air pollutants. Environ Sci Technol. 2022;56(7):3984–3996.
29. Kuklinska K, Wolska L, Namiesnik J. Air quality policy in the U.S. and the EU – a review. Atmos Pollut Res. 2015;6(1):129–137. doi:10.5094/APR.2015.015
30. Jia W, Li L, Lei Y, Wu S. Synergistic effect of CO2 and PM2.5 emissions from coal consumption and the impacts on health effects. J Environ Manage. 2023;325(Pt A):116535. doi:10.1016/j.jenvman.2022.116535
31. Mani S, Jain A, Tripathi S, Gould CF. The drivers of sustained use of liquified petroleum gas in India. Nat Energy. 2020;5(6):450–457. doi:10.1038/s41560-020-0596-7
32. Bame A. Perimenopause and autoimmunity: hormones, gut health, and immune disruption. 2025.;
33. Romanello M, Walawender M, Hsu SC, et al. The 2024 report of the lancet countdown on health and climate change: facing record-breaking threats from delayed action. Lancet. 2024;404(10465):1847–1896. doi:10.1016/s0140-6736(24)01822-1
34. A IEA. Vision for Clean Cooking Access for all. IEA, Paris. 2023.;
35. Nair AA, Lin S, Luo G, et al. Environmental exposure disparities in ultrafine particles and PM2.5 by urbanicity and socio-demographics in New York state, 2013-2020. Environ Res. 2023;239(Pt 2):117246. doi:10.1016/j.envres.2023.117246
36. Yan D, Ren X, Zhang W, Li Y, Miao Y. Exploring the real contribution of socioeconomic variation to urban PM2.5 pollution: new evidence from spatial heteroscedasticity. Sci Total Environ. 2022;806(Pt 4):150929. doi:10.1016/j.scitotenv.2021.150929
37. Koçak E, Çelik B. The nexus between access to energy, poverty reduction and PM2.5 in Sub-Saharan Africa: new evidence from the generalized method of moments estimators. Sci Total Environ. 2022;827:154377. doi:10.1016/j.scitotenv.2022.154377
38. Ahmed F, Hossain S, Hossain S, et al. Impact of household air pollution on human health: source identification and systematic management approach. SN Appl Sci. 2019;1:1–19.
39. Kumar P, Singh AB, Arora T, Singh S, Singh R. Critical review on emerging health effects associated with the indoor air quality and its sustainable management. Sci Total Environ. 2023;872:162163. doi:10.1016/j.scitotenv.2023.162163
40. El Arifeen S, Christou A, Reichenbach L, et al. Community-based approaches and partnerships: innovations in health-service delivery in Bangladesh. Lancet. 2013;382(9909):2012–2026. doi:10.1016/s0140-6736(13)62149-2
41. Allen RW, Adar SD, Avol E, et al. Modeling the residential infiltration of outdoor PM2.5 in the multi-ethnic study of atherosclerosis and air pollution (Mesa Air). Environ Health Perspect. 2012;120(6):824–830. doi:10.1289/ehp.1104447
42. Meier R, Schindler C, Eeftens M, et al. Modeling indoor air pollution of outdoor origin in homes of SAPALDIA subjects in Switzerland. Environ Int. 2015;82:85–91. doi:10.1016/j.envint.2015.05.013
43. Dherani M, Pope D, Mascarenhas M, Smith KR, Weber M, Bruce N. Indoor air pollution from unprocessed solid fuel use and pneumonia risk in children aged under five years: a systematic review and meta-analysis. Bull World Health Organ. 2008;86(5):390–398c. doi:10.2471/blt.07.044529
 © 2026 The Author(s). This work is published and licensed by Dove Medical Press Limited. The
full terms of this license are available at https://www.dovepress.com/terms
and incorporate the Creative Commons Attribution
- Non Commercial (unported, 4.0) License.
By accessing the work you hereby accept the Terms. Non-commercial uses of the work are permitted
without any further permission from Dove Medical Press Limited, provided the work is properly
attributed. For permission for commercial use of this work, please see paragraphs 4.2 and 5 of our Terms.
© 2026 The Author(s). This work is published and licensed by Dove Medical Press Limited. The
full terms of this license are available at https://www.dovepress.com/terms
and incorporate the Creative Commons Attribution
- Non Commercial (unported, 4.0) License.
By accessing the work you hereby accept the Terms. Non-commercial uses of the work are permitted
without any further permission from Dove Medical Press Limited, provided the work is properly
attributed. For permission for commercial use of this work, please see paragraphs 4.2 and 5 of our Terms.
Recommended articles
Epidemiological Trends and Projections of PM2.5-Attributable COPD Burden in China Over 1990–2035
Li M, Wang L, Amhare AF, Song Y, Wan P, Shi S, Qiao L, Guo Y
International Journal of Chronic Obstructive Pulmonary Disease 2026, 21:565060
Published Date: 16 March 2026
Global, Regional, and National Burden and Trends of Hypertensive Heart Disease Among Women of Childbearing Age from 1992 to 2021
Huang J, Jiang W, Zhai J, Zhang K, Yao G
International Journal of Women's Health 2026, 18:588257
Published Date: 30 March 2026
Global Patterns and Temporal Trends in Modifiable Risk Factors Among Women of Childbearing Age, 1990–2021: A Systematic Analysis from the Global Burden of Disease Study
Xu Q, Zhang H, Chen B, Xie Z, Lin Q, Zhao Y, She G, Zhong F, Li J
International Journal of Women's Health 2026, 18:599831
Published Date: 17 May 2026
Divergent Burden Profiles of HIV/AIDS and Other Sexually Transmitted Infections Among Women of Child-Bearing Age, 1990–2021
Li Z, Li S, Lin G, Zou Y, You C
International Journal of Women's Health 2026, 18:608337
Published Date: 26 May 2026