Back to Journals » International Journal of Nanomedicine » Volume 18
Enzyme and Reactive Oxygen Species–Responsive Dual-Drug Delivery Nanocomplex for Tumor Chemo-Photodynamic Therapy
Authors Xie Q ![]() , Gao S, Tian R, Wang G, Qin Z, Chen M, Zhang W, Wen Q, Ma Q, Zhu L
, Gao S, Tian R, Wang G, Qin Z, Chen M, Zhang W, Wen Q, Ma Q, Zhu L ![]()
Received 18 October 2022
Accepted for publication 20 December 2022
Published 4 January 2023 Volume 2023:18 Pages 1—16
DOI https://doi.org/10.2147/IJN.S393862
Checked for plagiarism Yes
Review by Single anonymous peer review
Peer reviewer comments 2
Editor who approved publication: Prof. Dr. Anderson Oliveira Lobo
Qian Xie,1,* Shi Gao,1,* Rui Tian,2 Guohao Wang,3,4 Zainen Qin,5 Minglong Chen,1 Wenhui Zhang,1 Qiang Wen,1 Qingjie Ma,1 Lei Zhu1
1Department of Nuclear Medicine, China-Japan Union Hospital of Jilin University, NHC Key Laboratory of Radiobiology, School of Public Health of Jilin University, Changchun, 130033, People’s Republic of China; 2Department of Ophthalmology Second Hospital, Jilin University, Changchun, 130033, People’s Republic of China; 3Cancer Centre, Faculty of Health Sciences, University of Macau, Macau, SAR, 999078, People’s Republic of China; 4Institute of Translational Medicine, Faculty of Health Sciences, University of Macau, Macau, SAR, 999078, People’s Republic of China; 5Department of Oral Radiology, Guangxi Medical University College of Stomatology, Nanning, 530021, People’s Republic of China
*These authors contributed equally to this work
Correspondence: Qingjie Ma; Lei Zhu, Email [email protected]; [email protected]
Introduction: Combination therapy is a promising approach to promote the efficacy and reduce the systemic toxicity of cancer therapy. Herein, we examined the potency of a combined chemo-phototherapy approach by constructing a hyaluronidase- and reactive oxygen species-responsive hyaluronic acid nanoparticle carrying a chemotherapy drug and a photosensitizer in a tumor-bearing mouse model. We hypothesized that following decomposition, the drugs inside the nanocomplex will be released in the tumors to provide effective tumor treatment. We aimed to design a smart drug delivery system that can improve traditional chemotherapy drug delivery and enhance the therapeutic efficacy in combination with photodynamic therapy.
Methods: Hydrophilic hyaluronic acid (HA) was covalently modified with a hydrophobic 5β-cholanic acid (CA) via an ROS-cleavable thioketal (tk) linker for a targeted co-deliver of 10-Hydroxy camptothecin (HCPT) and Chlorin e6 (Ce6) into tumors to improve the efficiency of combined chemo-photodynamic therapy.
Results: The obtained HA-tk-CA nanoparticle carrying HCPT and Ce6, named HTCC, accumulated in the tumor through the enhanced permeable response (EPR) effect and HA-mediated CD44 targeting after intravenous administration. Upon laser irradiation and hyaluronidase degradation, HTCC was disrupted to release HCPT and Ce6 into the tumors. Compared to the monotherapy approach, HTCC demonstrated enhanced tumor growth inhibition and minimized systemic toxicity in a tumor-bearing mouse model.
Conclusion: Our results suggested that controlled dual-drug release not only improved tumor drug delivery efficacy, but also reduced systemic side effects. In addition to HCPT and Ce6 delivery, the HA-tk-CA nanocomplex can be used to deliver other drugs in synergistic cancer therapy. Since most current combined therapy uses free drugs with distinct spatiotemporal distributions, the simultaneous co-delivery of dual drugs with a remote on-demand drug delivery nanosystem provides an alternative strategy for drug delivery design.
Keywords: chemotherapy, photodynamic therapy, hyaluronic acid, responsive nanoparticle, drug delivery
Introduction
Currently, chemotherapy remains one of the most common cancer treatment strategies in the clinic.1,2 However, chemotherapy efficacy is still unsatisfactory due to the heterogenicity of tumor cells and inherent/acquired drug resistance.3 Although increasing the chemotherapy drug dose can enhance the treatment response, it also induces cumulative toxicity side effects, which require the termination of treatment before any observable positive tumor inhibition.4 Therefore, effective chemotherapy strategies with high tumor treatment efficacy and low adverse effects are still needed.
Because combined therapy can target distinct biomarkers, counter biological compensation, and lower the dosage of each compound,5–8 a combination of two or more chemotherapy medications, or the application of chemotherapy together with other treatment modalities, is an alternative way to promote therapy efficacy, decrease the development of resistant cells, and reduce systemic toxicity.9 In the clinic, Irinotecan (CPT-11) and oxaliplatin in combination with 5-FU and folinic acid (FA) have yielded promising results in colorectal cancer treatment.10,11 Currently, many chemotherapy strategies combined with immunotherapy, radiotherapy, and phototherapy are under clinical trials.12 Unfortunately, higher toxicities are still noticed in the clinic because most component drugs are delivered as free molecules, which demonstrated undesirably distinct spatiotemporal distributions due to their inherent differences in physicochemical and pharmacokinetic properties.13,14 As a result, to maximize the cancer treatment responses and minimize the side effects during combined therapy, it is critical to deliver different drugs to the desired disease areas simultaneously.
Until recently, a series of nanoplatforms, such as liposomes, dendrimers, polymeric nanoparticles (NPs), and hybrid NPs, have demonstrated the ability to target deliver chemotherapeutic drugs into tumors for combined therapy.15–20 Specifically, stimulus-responsive nanocomplexes, or smart nanocomplexes capable of releasing drugs under certain conditions into cancer cells, have attracted great interest in the field of drug delivery.21–24 Compared to traditional drug delivery nanosystems, stimulus-responsive nanocomplexes are both site-specific and time-release controlled, thus allowing for high tumor-specific drug accumulation with reduced normal tissue toxic concerns. Such on-demand drug release relies on exogenous and endogenous stimuli, including variations in temperature changes, magnetic fields, ultrasonic waves, light, electric fields, pH, redox potential, and enzyme activity.25 Increasingly, the literature reports that responsive nanoparticles can co-deliver and release chemotherapy and photothermal agents under stimulation for tumor ablation.26–28 To accomplish this, some researchers have chemically modified chemotherapy drugs or photosensitizers with cleavable linkers to construct responsive nanoparticles for drug delivery.29,30 For instance, the conjugation of a small cytotoxic molecule, SN38, with a hydrophilic oligomer of ethylene oxide (oligo (ethylene glycol), OEG) chain via an ester linker can form a nanocapsule that is responsive to tumor redox heterogeneity.31 Similarly, the photosensitizer Ce6 was reported to be chemically conjugated with a hyaluronic acid chain to form a NIR-responsive nanoparticle.32 These nanocomplexes can be disrupted to release cargos upon laser irradiation for combined tumor treatment. Although the reported research showed enhanced tumor therapy response, the nanoparticle preparation steps with targeting ligands are labor-intensive. Additionally, conjugating a drug with hydrophilic polymers through a cleavable linker is only possible for drugs that can be chemically modified, which narrows the drug’s application and limits the drug administration dose due to the low substitution rate. Thus, further research is required in the field of smart nanoparticle development.
Combination PDT with chemotherapy in one nanoplatform is a promising strategy to enhance therapeutic efficacy, overcome multi-drug resistance, and reduce side effects. PDT utilizes lasers to activate photosensitizers and convert oxygen molecules into singlet oxygen (1O2) species to inhibit tumor cells’ proliferation locoregionally through the oxidization of crucial biomolecules such as proteins, enzymes, and DNA. As a noninvasive therapeutic strategy, PDT has been approved by the Food and Drug Administration (FDA) for the clinical treatment of various diseases such as actinic keratosis, esophagus cancer, and skin cancer. It has distinct advantages over other clinical treatments owing to its noninvasiveness, repeatability without cumulative toxicity, minimal systemic toxicity, and excellent cosmetic results.
In this study, we constructed an enzyme and ROS-responsive dual drug delivery nanoplatform through the chemical conjugation of hydrophobic 5β-cholanic acid (CA) to the hydrophilic hyaluronic acid (HA) backbone via a reactive oxygen species (ROS)-cleavable thioketal linker (tk, Scheme 1). The formed HA-tk-CA complex can be assembled into HA-based nanoparticles (HANP) with hydrophilic surfaces and hydrophobic inside caves to encapsulate water-insoluble drugs (Scheme 1). Biologically, such HANPs will be able to actively target cluster determinant 44 (CD44), which is overexpressed in both tumor cells and tumor stroma, and also passively accumulates in tumors through the enhanced permeability and retention (EPR) effect to achieve enhanced tumor targeted drug delivery.33 The EPR effect is the phenomena of macromolecule accumulation above a certain size (> 40 kDa) in the tumor area through deficient or malfunctional leaky blood vessels.34 Once HANP enters tumor cells via CD44 binding on tumor cells,35 it will be degraded by intracellular hyaluronidase-I (Hyase-I) and start releasing its cargo.36 Hyaluronidase-1 is a type of HA-degrading endoglycosidase, and it is the primary tumor-derived hyaluronidase.37 Furthermore, the tk linker in this nanosystem can be cleaved by ROS to further improve the drug release rate so that drugs can accumulate in the tumor cells at effective doses and the normal organ nonspecific uptake is reduced (Scheme 1). To substantiate our design, a chemotherapy drug, 10-Hydroxy camptothecin (HCPT), and a photosensitizer, Ce6, were physically encapsulated into HA-tk-CA. Upon near-infrared (NIR) laser irradiation, Ce6 in the HA-tk-CA carrying HCPT/Ce6 complex (HA-tk-CA/HCPT/Ce6, HTCC) was able to generate substantial ROS and break the tk linker to disassemble the HTCC into HA fragments together with Hyase-I to fully release HCPT for the inhibition of tumor cell growth in combination with Ce6-mediated PDT (Scheme 1).
 |
Scheme 1 A schematic illustration of the preparation and application of HTCC in vitro and in vivo. |
Materials and Methods
Synthesis of ROS-Cleavable Thioketal Linker (tk)
First, a mixture of anhydrous 3-mercaptopropionic acid (5.2 g, 49.1 mmol) and anhydrous acetone (5.8 g, 98.2 mmol) was saturated with dry hydrogen chloride and stirred at room temperature for 6 h. After the reaction, the flask was stoppered and chilled in an ice-salt mixture until crystallization was complete. Then, the crystals were filtered, washed with hexane and cold water, and dried in a vacuum desiccator to obtain the final product.
Synthesis of 5β-Cholanic Acid- Thioketal Linker (CA-tk) Conjugate
Briefly, 5β-cholanic acid was first converted to aminoethyl 5b-cholanoamide, as reported previously using ethylenediamine (EAD),29 which can react with the carboxylic acids in tk. Subsequently, a mixture of aminoethyl 5b-cholanoamide (205.9 mg, 0.1 mmol) and tk (252.1 mg, 1.0 mmol) in anhydrous DMF (2 mL) was stirred at room temperature for 10 min. Then, EDC (57.3 mg, 0.3 mmol) and NHS (34.5 mg, 0.3 mmol) dissolved in anhydrous DMF (1 mL) was added to the above solution under a nitrogen atmosphere. The reaction was performed under a nitrogen atmosphere for 24 h at room temperature. Next, the reaction mixture was extensively dialyzed with a low-binding MicroFloat-A-Lyzer ready-to-use dialysis bag (molecular weight cutoff = 100–500 Da INTERCHIM, USA) against deionized water to remove EDC, NHS, and DMF. The CA-tk conjugate was obtained as a white powder after lyophilization. Then, the crude product was re-dissolved in DMF (1 mL) and dropped into 100 mL of cold diethyl ether under stirring to precipitate the CA-tk conjugate. This procedure was repeated once, and then a vacuum was applied to dry the precipitate and obtain the final product.
Synthesis of HA-tk-CA
HA-tk-CA conjugates were synthesized by chemical conjugation of CA-tk to the hydrophilic HA backbone through amide formation. First, the carboxyl groups in CA-tk were activated by EDC/NHS and mixed with a ten-fold excess of EAD to obtain aminoethyl tk-5β-cholanoamide (NH2-tk-CA). After dialysis against water (molecular weight cutoff = 100–500 Da) and lyophilization, 0.3 mmol of NH2-tk-CA was added to the HA solution (containing 1 mmol of -COOH) in the presence of EDC (1.2 mmol) and NHS (1.2 mmol) for an overnight reaction. HT-tk-CA was finally obtained by freeze drying. The degree of substitution (DS, defined as the number of NH2-tk-CA molecules per 100 sugar residues of HA) was controlled in the range of 10.38
Synthesis of HA-tk-CA Carrying HCPT and Ce6 (HTCC)
HTCC was prepared by High-Pressure Homogenizer (PhD Technology International LLC, MN, USA). Briefly, HA-tk-CA loaded with HCPT and Ce6 (HTCC) was prepared by mixing equal amounts of HCPT and Ce6 dissolved in trichloromethane with HA-tk-CA in ultrapure water, and the mixture was then homogenized for 15–20 min (20,000–25,000 psi). The resulting mixture was dialyzed for 12 h against an excess amount of distilled water to remove unloaded drugs and organic solvent, followed by lyophilization. The loading capacities (LCs) for HCPT and Ce6 were determined via high-performance liquid chromatography (HPLC) with a reverse-phase C18 column (5 μm, 4.6×250 mm) using 5% to 65% acetonitrile containing 0.1% TFA versus distilled water containing 0.1% TFA over 30 min at a flow rate of 1 mL/min. The detection wavelengths were set as 395 and 665 nm with a UV-vis-NIR detector. The drug content was measured according to the predetermined standard curve. The LCs were calculated as followed: LC% = Amount of drug in HTCC / Total HTCC weight × 100%.
Characterization of HTCC
The particle size and size distribution of HTCC were measured by dynamic light scattering DLS (Varian, Palo Alto, USA). Zeta potential measurements were performed at 25°C on a Malvern Zeta sizer-Nano Z instrument. The nanostructure and size of HTCC were observed by transmission electron microscopy (TEM, Bruker, Germany). UV-vis-NIR absorbance spectra of HTCC, Ce6, HCPT, and HA-tk-CA were observed by Multiskan Go microplate reader (Thermo Fisher Scientific, Massachusetts, USA). The fluorescent signals of HTCC and free Ce6 were measured using a fluorescence spectrophotometer (Varian, Palo Alto, USA). The loading contents for HCPT and Ce6 were determined using a UV-vis-NIR spectrometer at 395 and 665 nm, respectively.
Critical Micelle Concentration (CMC) Measurement
The critical micelle concentrations of the two copolymers were determined using a pyrene-based fluorescent probe.39,40 Briefly, 1 mL of 6 µM pyrene solution in acetone was added to volumetric flasks, and then the acetone was evaporated. Meanwhile, the HA-tk-CA amphiphilic copolymers were diluted with ultrapure water to a final concentration ranging from 1 to 3×10⁻⁵ mg/mL, and then were added to the volumetric flasks. After a short sonication, the samples were placed at room temperature in the dark overnight. The next day, the pyrene fluorescence signals were detected, and the ratio between the emission intensity at 337 nm and 334 nm were plotted against the base 10 logarithm of the concentration of each tested sample to determine the CMC of HA-tk-CA.
Stability
Free HCPT, free Ce6, and HTCC (1.0 mL) were dispersed into serum, cell culture medium, water, and PBS at pH 7.4 at 25°C. The absorbance spectra of HTCC were measured after 0, 2, 6, 12, 24, and 48 h. Photographs of tubes in diverse groups were taken after standing for one week at room temperature.
HTCC is Responsive to ROS
HTCC (with tk linker) was stored in the centrifuge tube and irradiated with a laser at 670 nm (0.1 W/cm2) for 10 min, and then centrifuged at 2000 rpm for 6 min. The TEM images were taken before and after the irradiation of HTCC.
In vitro Drug Release
Release of HCPT and Ce6 from the HTCC nanoparticles was studied in a release medium (acetate buffer, pH 4.2) using dialysis membrane tubing (molecular weight cutoff of 3500 Da, Spectrum Laboratories, Rancho Dominguez, CA, USA). HTCC was dispersed in the release medium and incubated in the dialysis membrane tubing. The dialysis system was then immersed in the release buffer with or without laser irradiation (670 nm, 0.1 W/cm2) in the presence or absence of hyaluronidase I at different concentrations (50, 1000, or 2000 units/mg, Millipore Sigma, MA, USA).41 HTCC incubation with Hyase at physiological pH (pH 7.45) was used as a control. Finally, in vitro release was performed in an air Contrast Temperature Oscillator shaker at 37°C. The release medium was collected at predetermined intervals, and the tubing was replaced in an equal volume of fresh medium. High-performance liquid chromatography (HPLC) was then used to measure the concentration of HCPT and Ce6 in the release medium via the standard curve method.
Cell Culture and Cell Internalization of HTCC
The murine squamous cell carcinoma cell line (SCC7) and murine fibroblast cell line (NIH-3T3) were purchased from the Chinese Academy of Sciences Cell Bank/Stem Cell Bank and cultured in an 8-well chamber in Dulbecco’s Modified Eagle Medium (DMEM)/high glucose medium supplemented with 10% FBS and 1% antibiotic solution at 37°C and 5% CO2. The next day, both cells were washed with PBS and incubated with HTCC (100 µL, 0.1 mg/mL of HTCC in H2O) or Ce6 at 37°C for 6 h with a 5% CO2 atmosphere. For the blocking test, free HA (ten-fold excess of HTCC, 0.1 mg in 100 µL H2O) was added to cells 30 min before HTCC was applied. After incubation, all cells were washed by PBS three times. The cells were finally fixed in cold ethanol for 15 min at −20°C, and cells were mounted with a mounting medium containing DAPI for 10 min in the dark. Cell targetability of HTCC was observed by a confocal microscope (Olympus FV1200, Tokyo, Japan,), and the excitation and emission wavelengths were set at 400 nm and 650 nm for Ce6, respectively.
Confirmation of Intracellular ROS Generation
The intracellular ROS levels were assessed with a commercialized cell-permeable probe (DCFDA), an indicator that ROS can rapidly oxidize it to emit green fluorescence. The human squamous cell carcinoma cell line was maintained following the American Type Tissue Culture Collection protocols. Briefly, SCC7 cells (8 × 10³ cells/well in 18 mm glass-bottom dishes.) were seeded and incubated 24 h prior to DCFDA staining. The next day, cells were washed by PBS and incubated with HTCC (50 µg) at 37°C for 6 h and irradiated with a 670-nm (0.1 W/cm2) laser for 10 min. Then, 2 µL DCFDA working solution was added to the medium. SCC7 cells were incubated for 20 min at 37°C and washed with PBS. Cells in the control group were pretreated with N-acetylcysteine (NAC) as an ROS scavenger and then treated with HTCC (50 µg) and NIR laser radiation (670 nm, 10 min). Cellular nuclei were counter-stained by DAPI. Green fluorescence from the stained cells was visualized by an inverted fluorescence microscope (Olympus IX70, Olympus America, Melville, NY) using a FITC filter, and analyzed and quantified using Image-J.
Cytotoxicity Analysis of HTCC
3-(4,5-Dimethylthiazol-2-yl)-2,5-diphenyltetrazolium bromide (MTT) assays were used to assess the metabolic activity of SCC7 cancer cells. The cells were seeded in 96-well plates (Costar, IL, USA) at an intensity of 4×10⁴ cells/well. After a 24 h incubation, the medium was replaced with the diverse nanoparticles at different concentrations (1, 10, 50, 100, and 200 µg/mL) and incubated at 37°C. Following incubation for 4 h, cells were washed twice with PBS and then exposed to laser irradiation for 15 min at a power density of 0.1 W/cm2. The cells were further incubated for 24 h and then washed twice with 1× PBS. 100 μL of freshly prepared MTT (0.5 mg/mL) solution in serum-free media was added into each well. The MTT medium solution was carefully removed after a 3 h incubation in the incubator at 37°C. DMSO (100 μL) was then added into each well, and the plate was gently shaken to dissolve all the precipitates formed. The absorbance of MTT at 570 nm was monitored by the microplate reader (Genios Tecan, MN, USA). Cell viability was expressed by the absorbance ratio of the cells incubated with nanoparticles to those incubated with culture medium only.
The cytotoxic effects were also visualized by 3’6’-Di (Oacetyl) −4’5’-bis [N, N-bis (carboxymethyl) aminomethyl] fluorescein, tetraacetoxymethyl ester (calcein AM)/Propidium Iodide (PI) staining (Sangon Biotech, Shanghai, China). The SCC7 cells were seeded in a 6-well plate with a density of 1×10⁵ cells and grown to 80–90% confluence. The SCC7 cells were then incubated with same concentrations of HANP, HANP/HCPT, HANP/Ce6, and HTCC for 12 h. After several washes with PBS and immersion in fresh culture medium (1 mL), the experimental groups were irradiated with the laser (670 nm, 0.1 W/cm2) for 10 min at 37°C and 5% CO2. Control groups in the dark were incubated in a fresh DMEM medium. After removing the fresh DMEM medium, calcein AM (4 μmol/L) and PI solutions (4 μmol/L) in PBS were added to SCC7 cells and incubated for 30 min at 37°C in 5% CO2. Finally, PBS was used to wash the cells three times. Fluorescence images of the cells were obtained by fluorescence microscope.
Fluorescence Imaging in Tumor-Bearing Nude Mice
Animal experiments were conducted under protocols approved by the Animal Care and Use Committee (CC/ACUCC) of Jilin University. Subcutaneous sites of athymic nude mice (seven weeks old, female, 20–24 g) were injected with a suspension of 4×10⁶ SCC7 cells in PBS (80 µL). When the tumor volume reached an average size of ~120 mm3, mice were randomly allocated into two groups. First, 100 µL of HTCC or free Ce6 solution was i.v. injected into SCC7 tumor-bearing nude mice at an equivalent dose of Ce6 at 4.0 mg/kg. Whole-body fluorescence images were collected at 1, 2, 4, 8, 12, and 24 h post injection (p.i.) using IVIS Lumina II (Caliper Life Sciences, MA, USA; Excitation Filter: 400 nm, Emission Filter: 650 nm). For ex vivo study, the mice were sacrificed 8 h post-administration. All major organs (heart, liver, spleen, kidney, and lung), muscles, and tumors were collected and examined for fluorescent imaging ex vivo.
Antitumor Effect and Biosafety Assay in vivo
For antitumor studies in vivo, nude mice were implanted with a SCC7 tumor subcutaneously. The mice were randomly grouped (n = 5) when the tumor volume reached ~100 mm3: (1) HTCC without laser, (2) HTCC with laser, (3) HCC (HANP without tk linker carrying HCPT and Ce6) without laser, (4) HCC with laser, (5) HANP/Ce6 without laser, (6) HANP/Ce6 with laser, (7) HANP/HCPT without laser, (8) HANP/HCPT with laser, and (9) HANP with laser. An equivalent dose of Ce6 at 4.13 mg/kg or an equivalent dose of HCPT at 5 mg/kg was given intravenously (i.p.) twice per week five times. At 8 h p.i., the tumors were irradiated for 10 min (670 nm, 300 mW/cm2). The mice without laser illuminations were used as controls. Bodyweight and tumor volume were monitored every two days for 14 days. The tumor volume was calculated by the formula V = (L × W × W)/2 (L, the longest dimension; W, the shortest dimension) and expressed as the relative tumor growth rate by normalizing it with the initial tumor volume. To compare treatment effects, a part of the tumors in different groups were collected for hematoxylin-eosin (H&E) and Ki67 staining 2 days after the last treatment injection. To evaluate the systemic toxicity of HTCC, the major organs (heart, liver, spleen, lung, and kidney) were collected and examined by H&E staining after 14 days of treatment.
Statistical Analysis
Results are given as mean ± SD. The statistical significance of the treatment groups was evaluated using Student’s t-test. *p values < 0.05 and **p values < 0.005 were considered statistically significant in all analyses.
Results and Discussion
Preparation and Characterization of HA-tk-CA Carrying Ce6 and HCPT (HA-tk-CA/Ce6/HCPT, HTCC) Complexes
Hyaluronic acid (HA) is a polysaccharide composed of repeating disaccharide units of glucuronate and N-acetyl glucosamine.42 It is widely distributed in the extracellular matrix of connective tissues in animals and humans. Because HA actively targets CD44, which is overexpressed by tumor cells, hydrophilic HA is an ideal biomaterial for cancer therapy as a targeted drug delivery system. To minimize drug leakage at off-target sites and trigger sufficient drug release in tumor tissue, we designed an HA nanocomplex that is responsive to two stimuli. To achieve this, a ROS-cleavable thioketal linker (tk) was first synthesized and conjugated with a hydrophobic 5β-cholanic acid (CA) via an ethylenediamine (Figure S1). The tk-modified CA was then conjugated with HA, as we reported before, to generate HA-tk-CA that will be disrupted under both Hyase and ROS (Scheme 1, Figures S1 and S2). Under high-pressure homogenesis, the amphophilic HA-tk-CA will form a nanoparticle with a hydrophilic surface and hydrophobic inside cave for drug delivery (Scheme 1). The CMC values of the HA-tk-CA nanoparticles were determined using a pyrene-based fluorescent probe method. As shown in Figure S3, the CMC value of HA-tk-CA nanoparticles was determined as 22.59 mg/L, indicating that HA-tk-CA nanoparticles are stable and have greater resistance to the rapid dilution effect in vivo.
Next, we simultaneously encapsulated a chemotherapy drug (10-Hydroxycamptothecin, HCPT) and a photosensitizer (Ce6) into the HA-tk-CA nanoparticle (HA-tk-CA/HCPT/Ce6, HTCC) for combined tumor therapy. Equal amounts of HCPT and Ce6 were added into HA-tk-CA nanoparticles under a high-pressure homogenizer and collected for further characterization. A slightly lower loading efficiency into HA-tk-CA was observed for Ce6 compared to HCPT when an equal amount of Ce6 and HCPT was added, because Ce6 (30 mg/mL in DMSO) is a little more hydrophilic than HCPT (8 mg/mL in DMSO). As a result, 8.27% of HCPT and 6.84% of Ce6 were encapsulated in the HA-tk-CA nanocomplex calculated according to the standard curves determined by using HPLC, as shown in Figure S4. The UV-vis-NIR absorbance and zeta potential changes of HTCC confirmed the successful encapsulation of HCPT and Ce6 compared to HA-tk-CA nanoparticle, free Ce6, and HCPT (Figure 1). As shown in Figure 1A, unique absorbance peaks at 406 nm and 670 nm were noticed in the HTCC absorbance spectrum, while no obvious absorbance changes of HA-tk-CA were noticed. The absorbance peak at 670 nm is supposed to come from the Q-bands of Ce6, but the absorbance peak at 406 nm could be from the Soret absorption of Ce6, which overlapped with the absorbance of HCPT at 406 nm. A slightly fluorescent self-quenching effect was observed when Ce6 was encapsulated in HTCC compared to free Ce6 (Figure 1B). The diameter of the HA-tk-CA nanoparticle was initially 186 ± 9.58 nm, and it increased to 209 ± 12.33 nm due to the encapsulation of HCPT and Ce6 (Figure 1C). We also measured the zeta potential of HTCC, HA-tk-CA nanoparticles, Ce6, and HCPT in H2O as being −40.2 mV, −31.2 mV, −1.1 mV, and −4.5 mV, respectively, indicating that HTCC was well dispersed (Figure 1D). The stability was also confirmed by monitoring the absorbance of HTCC within 48 h, and no peak changes were observed (Figure 1E). Moreover, no precipitations were noted when HTCC was incubated with H2O, PBS, 10% FBS, and DMEM at room temperature for 7 days (Figure S5A), indicating that HTCC is stable and can be used for in vivo applications. Moreover, no significant diameter changes were noticed as determined by DLS in 7 days (Figure S5B). The prepared HTCC was also found well dispersed, as observed by TEM (Figure 1F, upper left), and released HCPT and Ce6 immediately upon near-infrared (NIR) laser irradiation by breaking the tk linker (Figure 1F). Taken the above data together, HTCC was successfully constructed by encapsulating HCTP and Ce6 into the HA-tk-CA nanoparticle.
 |
Figure 1 In vitro characterization of HTCC. (A) UV/vis/NIR absorption spectra of HTCC, Ce6, HCPT solution, and HA-tk-CA. (B) Fluorescence spectra of HTCC and free Ce6. (C) Dynamic light scattering analysis for the particle size distribution of HTCC with a diameter of 209 ± 12.33 nm and HA-tk-CA nanoparticle with a diameter of 186 ± 9.58 nm. (D) Zeta potential of HTCC (−40.2 mV), Ce6 (−1.1 mV), HCPT (−4.5 mV), and HA-tk-CA (−31.2 mV) solution by dynamic light scattering. (E) Stability of HTCC in UV/vis/NIR spectra in H2O at room temperature for 0-, 2-, 6-, 12-, 24-, and 48-h incubation. No absorbance changes were noticed. (F) Images of ROS-responsive HTCC under 670-nm laser irradiation. Top left: TEM image of HTCC without NIR laser irradiation. Lower left: TEM image of disrupted HTCC under NIR laser irradiation. Top right: Image of HTCC in water without precipitation. Lower right: Image of HTCC under NIR laser irradiation. HTCC was centrifuged, and a precipitant was noticed. Scale bar = 250 nm. |
In vitro ROS/Enzyme-Triggered Drug Release of HTCC
We next determined the release profile of HCPT from HTCC by measuring HCPT absorbance in vitro. Two types of hyaluronidases have long been considered the primary HA degradative enzymes. Hyaluronidase II exists extracellularly on the cell membrane and only hydrolyzes high molecular HAs that are > 1000 KDa into 20 kDa HA fragments. Hyaluronidase I is located intracellularly and degrades low and intermediate sizes of HAs (20–250 kDa) that are internalized into cells mediated by the binding of HAs with CD44 on the cell membrane.43–45 Both hyaluronidase I and hyaluronidase II have acidic pH optima.45,46 In the presence of hyaluronidase I (2000 units/mg) at a pH 4.2 and NIR laser-induced ROS, the cumulative release of HCPT from the HTCC complex was calculated as 79.46% ± 3.92%, which is approximately 3.8 times higher than that with hyaluronidase at pH 7.45 (20.9% ± 5.43%) in the first 8 h (Figure 2). As time progressed, 89.20% ± 3.34% of HCPT was found to be released from HTCC in the presence of hyaluronidase and ROS after a 24 h incubation, while only 45.56% ± 11.06% of HCPT was detected with hyaluronidase at pH 7.45. In comparison, 76.33% ± 3.31% of HCPT was found released in 24 h when hyaluronidase was added alone, while 69.96% ± 2.51% of HCPT was released in the presence of ROS. Reducing the amount of hyaluronidase slowed the release of HCPT from HTCC to 42.56% ± 7.06% (500 units/mg of hyaluronidase I) and 55.23% ± 6.77% (1000 units/mg of hyaluronidase I) at 24 h, respectively (Figure S6). However, this does not necessarily mean that a low concentration of hyaluronidase reduced the drug’s release from HTCC, but may indicate that prolonging the incubation time with an enzyme leads to a comparable amount of drug release to HTCC incubation with a high amount of hyaluronidase. Moreover, Ce6 presented a similar release profile to that of HCPT from HTCC (Figure S7), with 86.84% ± 8.46% of Ce6 released from HTCC when both hyaluronidase and a laser were applied, which is higher than that stimulated by hyaluronidase (69.84% ± 7.36%) or laser (78.43% ± 11.46%) alone. Only 39.69% ± 9.54% Ce6 was detected after a 24-h incubation under pH7.45 when hyaluronidase was added, which is similar to that without hyaluronidase (32.18% ± 7.45%), as hyaluronidase is not active under such conditions. These data indicate that release of HCPT and Ce6 is both hyaluronidase- and ROS-dependent. Compared to normal cells, hyaluronidase-1 has been reported as being greatly elevated in a variety of cancers, including head and neck cancer,47 colon cancer,48 genitourinary cancer,49 and breast cancers.50 Because native hyaluronidase I is most active in cells under acidic conditions (pH 4.0–4.5)47,51 and because PDT can be locoregionally applied, it is hypothesized that a high level of released HCPT will accumulate in the tumor and a low amount of HCPT will be released in normal organs, which will result in reduced side effects in vivo. Although the drug release from HTCC started to show differences in the presence of hyaluronidase compared to that without hyaluronidase after 2 h incubation, the in vivo drug release profile may be different. This is because there are six known types of hyaluronidase (types 1–4, PH-20, and HYALP1), which are expressed in different organs and target different subtypes of HAs.52 The accurate HA nanoparticles degradation kinetics of hyaluronidase for in vivo tumor drug delivery need further investigation.
 |
Figure 2 In vitro drug release of HTCC with and without hyaluronidase in an acetate buffer (37°C). 89.20% ± 3.34% of HCPT was released from HTCC in the presence of hyaluronidase and ROS after 24-h incubation at pH 4.2, while only 45.56% ± 11.06% of HCPT was detected when HTCC is incubated with hyaluronidase at pH 7.45. 76.33% ± 3.31% of HCPT was released in 24 h as hyaluronidase was added alone at pH 4.2, while 69.96% ± 2.51% of HCPT was released in the presence of only ROS. Student’s t-test: HTCC with hyaluronidase and laser vs HTCC with hyaluronidase or laser alone, or HTCC with hyaluronidase at pH 7.45, *p <0.05. |
Cell Internalization of HTCC
CD44 is a cell-surface adhesion receptor for HA, and it is frequently overexpressed on the surface of tumor cells to regulate tumor cell metastasis. The HTCC tumor cell targetability was next evaluated on CD44 positive and negative cell lines using fluorescent staining.53 As shown in Figure 3, a strong fluorescence signal was detected in the CD44 positive SCC7 cells, while a small fluorescent signal could be seen in CD44 negative NIH3T3 cells. To investigate the binding specificity of HTCC, we also performed a competitive binding study. CD44 receptors on SCC7 cells were first blocked by an excess amount of free HA and treated with HTCC. After incubation, a much less fluorescent signal was observed in this study than in SCC7 cells without CD44 blocking. Although weak fluorescent signals were found in SCC7 cells incubated with free Ce6, this could be attributed to the nonspecific uptake of the cells of hydrophobic molecules as we observe similar signals in the CD44 negative NIH3T3 cells with free Ce6 treatment. No fluorescent signals could be seen when incubating HTCC with NIH3T3 cells, indicating that HTCC has a specific and strong binding ability with CD44 receptors and can therefore target the tumor area through both receptor-mediated targeting and the EPR effect. Such a dual-targeting property makes HTCC a good candidate as an anticancer drug carrier.
 |
Figure 3 Cell uptake of HTCC in CD44 high-expressing SCC7 and CD44 low-expressing NIH3T cell lines. (A) SCC7 and NIH3T3 cells were incubated with HTCC at an equivalent Ce6 concentration of 40 µg/mL for 6 h and then were imaged by confocal laser scanning microscopy (CLSM) For the blocking group, 10 times the excess amount of free HA was added before HTCC was applied. Strong fluorescent signals from HTCC were observed in SCC7 cells, but few signals could be seen in NIH3T3 cells. When cells were pretreated with HA, no signals were seen in both SCC7 and NIH3T3 cells. As a control, weak signals were detected for Ce6 due to the nonspecific accumulation in both SCC7 and NIH3T3 cells. The red color is from Ce6, while the blue color indicates DAPI. The scale bar is 20 μm. (B) Quantification of (a) Student’s t-test: HTCC on SCC7 cells vs Ce6, HTCC vs Blocked, and HTCC on SCC7 cells vs HTCC on NIH3T3 cells, *p < 0.05. |
Cytotoxicity of HTCC
HTCC will be disrupted to release HCPT when it meets the PDT-induced ROS. To confirm the generation of ROS of HTCC after internalization in tumor cells, the intracellular ROS was measured using a commercially available ROS detection probe (DCFDA). DCFDA is currently the preferred choice for ROS detection, which is the major cytotoxic agent used to kill the surrounding tissues and cells. As shown in Figure 4A, a high amount of ROS was generated according to the strong fluorescent signals from the DCFDA in HTCC-treated cells after laser irradiation. On the contrary, ROS-mediated DCFDA oxidization was prevented in the presence of a ROS scavenger, n-acetyl-l-cysteine (NAC). Significantly lower amounts of ROS were detected in the cells without HTCC treatment. These data indicate that HTCC is able to generates high volumes of cytotoxic ROS intracellularly to facilitate HTCC disruption in drug release and prevent cell proliferation.
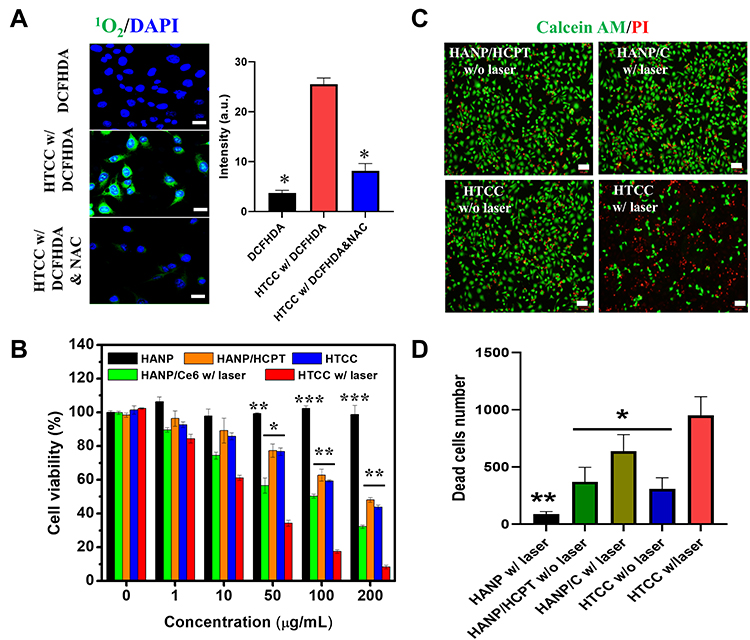 |
Figure 4 ROS generation and cytotoxicity of HTCC. (A) Verification of ROS generation by a commercialized ROS probe (DCFHDA) Higher fluorescent intensities indicate a greater rate of ROS generation. A strong fluorescent signal was detected from DCF when ROS was generated through HTCC and 670 nm NIR laser illumination in cells. The oxidation of DCFHDA can be diminished by adding a ROS scavenger, NAC. The fluorescent signal intensity was quantified on the right. Student’s t-test: HTCC with DCFDA vs DCFDA, p < 0.05. HTCC with DCFDA vs HTCC with DCFDA and NAC, p < 0.05. (B) Cell viability of the SCC7 cells incubated with HANP, HANP/HCPT, HANP/Ce6, and HTCC without or with 670-nm laser irradiation (100 mW/cm2, 10 min) The equivalent concentrations of the HCPT are 1, 10, 50, 100, and 200 μg/mL. Student’s t-test: *p < 0.05, **p < 0.005, *** p < 0.0005. (C) Calcein AM/PI co-staining by fluorescence microscopy. SCC7 cells were incubated with HANP (with a laser), HANP/HCPT (without laser), HANP/Ce6 (with a laser), and HTCC (with and without laser) Red color stains for dead cells, and green color indicates the live cells. The scale bars represent 100 μm. (D) Quantification of dead cells as stained in (c) Student’s t-test: HTCC vs HTCC without laser, HTCC vs HANP/C with laser, HTCC vs HANP/HCPT without laser *p < 0.05, HTCC vs HANP with laser, **p < 0.005. |
To measure and compare the cytotoxicity of chemotherapy and PDT combined therapy with monotherapy, a cell proliferation assay was performed using HTCC, HANP/Ce6, HANP/HCPT, and HANP with or without laser irradiation (Figure 4B). As expected, HTCC efficiently inhibited SCC7 tumor cell proliferation in a dose-dependent manner. 91.7 ± 0.93% cells were killed after incubation with 200 µg/mL of HTCC (containing 20 μg/mL of Ce6 and 19 μg/mL of HCPT) and 670 nm laser irradiation at 0.1 W/cm2 for 10 min. Without laser irradiation, 56.16 ± 1.15% of cells were killed in the HTCC treatment group, which is similar to the effect of HANP/HCPT (51.95 ± 1.43%) on the inhibition of cell proliferation. In the PDT treatment group, 32.27 ± 0.97% of cells survived when treated with HANP/Ce6 with laser irradiation alone. As a carrier, HANP did not show obvious inhibitory effects on cell proliferation at the concentration we applied in this study (Figures 4B and S8). Calcein-AM and PI staining (Figure 4C and D, and Figure S8) also confirmed the cytotoxicity study results that fewer cells were alive in the HTCC treatment group with laser irradiation than in the PDT or chemotherapy treatment groups, verifying that combined chemotherapy and PDT with HTCC is more efficient than HANP/HCPT or HANP/Ce6 alone.
Whole-Body Fluorescent Imaging of Tumor Targeted Accumulation of HTCC Following Systemic Administration
Noninvasive optical imaging is a safe, straightforward, and cost-effective method to evaluate the tumor targeting and monitoring treatment response of molecules with fluorescent signals. In our study, the strong absorbance of Ce6 allowed us to analyze the accumulation of HTCC in tumors by NIR fluorescent imaging. To achieve an efficient tumor combination therapy effect, the PDT and PDT triggered chemotherapy drug-releasing time window was determined when HTCC peaked in the tumor area using a fluorescent imaging technique. The in vivo biodistribution and tumor selectivity of HTCC were investigated in a subcutaneous SCC7 tumor model after intravenous injection. The fluorescent signals from HTCC in the tumor were detected increasing with time (Figure 5A). The signal change folds from tumor and muscle were calculated as 1.09 ± 0.11, 1.52 ± 0.17, 2.75 ±0.34, 3.89 ±0.33, 2.95 ± 0.26, and 2.49 ±0.22 times at different times (Figure 5B). As a control, free Ce6 without HANP delivery was also injected into the tumor-bearing mice, but the fluorescent signals did not change much (T/M ratio: 1.01 ± 0.07, 1.10 ± 0.10, 1.10 ± 0.12, 1.01 ± 0.13, 1.05 ± 0.17, and 1.08 ± 0.13 at different times as indicated) within 24 h in the tumor area. The tumor-bearing mice that received HTCC and free Ce6 were euthanized at 8 h p.i. to verify the observations. The major organs and tumors were then imaged (Figure 5C). It can be seen that the SCC7 tumor with HTCC administration had a very strong fluorescent signal compared to the tumor with free Ce6 (>100 times higher, Figure 5D), consistent with the in vivo study. No obvious fluorescent signals were found in major normal tissue and organs, including muscle, heart, spleen, and lung, in the SCC7 tumor-bearing mice treated with HTCC and Ce6. However, we detected some fluorescent signals from the kidneys, which could be attributed to Ce6 excretion via the kidneys. In addition, a high level of liver uptake of both HTCC and Ce6 was observed due to nonspecific uptake by Kupffer cells in the liver. Considering results obtained from both the in vivo and ex vivo analyses, we have demonstrated that HTCC is an excellent tumor-targeting agent. Identifying a peak accumulation of the nanoparticle in tumors at 8 h after injection provides us with an optimized phototherapy time point to maximize drug release and therapy efficacy.
 |
Figure 5 In vivo NIR fluorescence imaging of HTCC in the SCC7 tumor-bearing mouse model. (A) In vivo, NIR fluorescent imaging of SCC7 tumor-bearing mice was taken at different times after intravenous injection of HTCC and free Ce6. Arrows indicate the tumor locations. (B) Tumor/muscle (T/M) ratio of SCC7 tumor-bearing mouse model. HTCC peaked in the tumor at 8 h post-injection. No obvious Ce6 tumor accumulation was seen. (C) Ex vivo fluorescence images of organs and tumors harvested at 8 h after injection of HTCC and free Ce6 in mice. (D) Quantification of normal organ fluorescent imaging in (c) **p < 0.005. |
Synergistic Antitumor Efficacy of HTCC in vivo
Encouraged by the ideal targetability of tumor cells and inhibition of HTCC, a subcutaneous tumor-bearing model was established to evaluate the tumor inhibition of HTCC in vivo. Mice were intravenously administrated with HTCC (HANP with tk linker with HCPT and Ce6), HCC (HANP without tk linker contains HCPT and Ce6), HANP/Ce6 (PDT alone), HANP/HCPT (chemotherapy alone), HANP (without drug, without tk linker), and no treatment. The tumor areas were irradiated with a 670 nm laser at 300 mW/cm2 for 10 min at 8 h post injection as determined in an in vivo optical imaging study. Pictures of mice receiving HTCC treatment were taken every week (Figure 6A). It can be seen that tumor volume was gradually reduced after HTCC treatment. Accordingly, the tumor sizes in all experimental groups were measured and recorded as shown in Figure 6B, which demonstrated the tumor volume increase compared to tumors on the first day of treatment. The tumors without treatment increased in size 15.49 ± 0.84 times, and tumors receiving HANP grew 13.45 ± 0.77 times larger two weeks after the experiment started, indicating that the HANP carrier is not toxic to tumor cells and does not affect tumor growth at the current dose we applied. In the tumors that received HANP/Ce6, the tumor also grew 13. 54 ± 0.81 times larger when the laser was not applied. On the contrary, the tumors treated with HANP/Ce6 enlarged 10.13 ± 0.63 times when NIR laser treatment was given. Likewise, tumor volume increased 7.11 ± 0.52 and 6.75 ± 0.63 times when HANP/HCPT was given to the tumor-bearing mice without and with NIR laser combination, respectively. The tumors in HANP/HCPT combined with laser irradiation groups were slightly smaller than those of the HANP/HCPT without laser groups, possibly because the laser alone could prevent tumor cell growth to a certain extent. Considering tumor treatment results, PDT or chemotherapy alone may not efficiently inhibit tumor growth at the low chemotherapy drug dose and low laser irradiation power we used in this study. Although increasing the chemotherapy drug amount and laser irradiation power and time could elevate tumor inhibition efficiency, it will also increase side effects and limit the translational potency of such a nanocomplex. We therefore only used low chemotherapy drug dose and laser irradiation power and time in our study. To study the advantages of controlled release in tumor therapy, HCC (HANP carrying HCPT and Ce6 without tk linker) treatments with and without laser irradiation were included in our study. Without laser irradiation, the tumor grew 6.43 ± 0.71 times larger when receiving treatment without laser irradiation, which is similar to the chemotherapy alone results, while tumor sizes only enlarged 3.13 ± 0.51 times when HCC was combined with laser irradiation. However, the tumor was effectively inhibited when the tk linker was involved in HTCC treatment combined with laser irradiation. The high chemotherapy drug and photosensitizer intratumoral release induced by laser and HA enzyme resulted in an excellent tumor therapy response. In addition to PDT-induced ROS production through laser irradiation of the photosensitizer, ROS can also be produced by the cellular components that make up the tumor microenvironment (TME), which may disrupt the HTCC and drug release in the tumor area. However, the drug release induced by endogenous ROS could be very low in normal cells because their oxidative homeostasis is maintained by various antioxidant systems.54 Moreover, it is worth noting that PDT and chemotherapy have been reported to trigger immune response in tumor to prevent tumor growth, recurrence, and metastasis. Therefore, investigation into combined tumor therapy using an immune competent mouse model is necessary in the future.
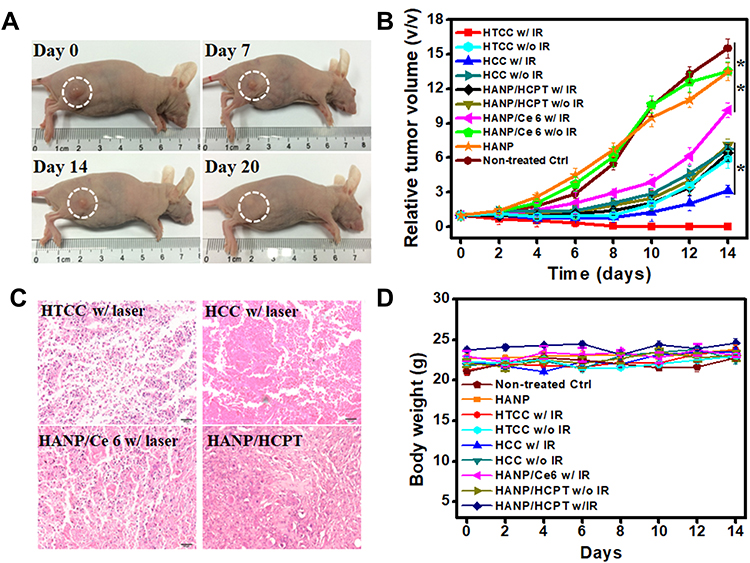 |
Figure 6 Chemotherapy and photodynamic therapy of SCC7 tumors with HTCC. (A) Typical photographs of SCC7 tumor-bearing mice at different days after HTCC treatment. (B) Tumor growth curves of different groups of SCC7 tumor-bearing mice. Error bars represent the standard deviations of five mice per group. Student’s t-test: HTCC w/IR vs HTCC without IR, HTCC with IR vs HCC with IR, HTCC with IR vs HCC without IR, HTCC with IR vs HANP/HCPT with IR, HTCC with IR vs HANP/HCPT without IR, *p < 0.05, HTCC with IR vs non-treated control, HTCC with IR vs HANP, HTCC with IR vs HANP/Ce6 without IR, HTCC with IR vs HANP/Ce6 with IR, **p < 0.005. (C) H&E-stained tumor sections of SCC7 tumor-bearing mice in different groups at three days after the last treatment. (D) Body weights changes in mice received different treatments during the study. |
To verify the treatment response in these groups, tumors that received HTCC, HCC, HANP/Ce6, and HANP/HCPT were analyzed by H&E staining (Figure 6C). Due to the high drug accumulation in tumors, more tumor tissue was damaged and fewer tumor cells were left in the HTCC treatment group than in the HCC, HANP/Ce6, and HANP/HCPT treatments. Proliferating cells in tumors that received the above treatment were also visualized by Ki67 staining. As Figure S9 shows, the least proliferating cells were in tumors that received HTCC with irradiation treatment, while the signal chemotherapy or PDT showed much higher rates of cell proliferation. The involvement of ROS sensitive linker improved the drug release and tumor treatment efficacy. During our study, we did not observe a bodyweight loss for mice in any of the groups (Figure 6D). To further determine the toxicity of HA conjugates to normal organs, major organs in all groups were collected and stained by H&E staining (Figure 7). As expected, we did not find histology changes for the normal organs in any of the treatment groups, indicating that the HANP derivatives are not toxic to normal tissues.
 |
Figure 7 Representative photos of mice after different treatments and histological images of major organs using H&E staining. No noticeable abnormality was found in the heart, liver, spleen, lung, or kidney. |
Conclusion
In summary, we have successfully constructed and characterized an enzyme and ROS-responsive hyaluronic acid (HA) nanoparticle for dual photosensitizer and chemotherapy drug co-delivery to increase the efficacy of cancer combined therapy. Hydrophilic HA was modified with a hydrophobic 5β-cholanic acid (CA) through a ROS-sensitive tk linker to form a HA-tk-CA to encapsulate 10-Hydroxy camptothecin (HCPT) and a photosensitizer, Ce6. The obtained nanocomplex, HAtkCA/HCPT/Ce6 (HTCC), could target tumor cells via HA-mediated CD44 binding and nanoparticle EPR effects with reduced normal organ uptake, as confirmed by fluorescent imaging. In vitro, HTCC demonstrated highly efficient tumor cell growth inhibition through chemotherapy and PDT. Furthermore, HTCC accumulated and peaked in tumors 8 h after systemic delivery for tumor treatment under low-power near-infrared laser-controlled drug release. In addition, an enhanced tumor growth inhibition of HTCC was observed without noticeable toxicity to normal organs and mice body weight. Overall, the proposed ROS and enzyme-sensitive HA drug delivery system demonstrated excellent stability, tumor targetability, intratumoral drug release efficiency, and tumor growth inhibition with minimized side effects. More importantly, such ROS and hyaluronidase responsive drug delivery vehicles can be extended to deliver other chemotherapy drugs and photosensitizers in order to overcome therapy resistance in cancer treatment.
Data Sharing Statement
All data generated or analyzed during this study are included in this published article and its additional files.
Ethics Approval and Consent to Participate
All animal procedures were performed in strict accordance with the Guidelines for the Care and Use of Laboratory Animals. The animal experimental procedures were approved by the Institutional Animal Care and Use Committee of Jilin University.
Author Contributions
All authors made a significant contribution to the work reported, whether that is in the conception, study design, execution, acquisition of data, analysis and interpretation, or in all these areas; took part in drafting, revising or critically reviewing the article; gave final approval of the version to be published; have agreed on the journal to which the article has been submitted; and agree to be accountable for all aspects of the work.
Funding
This work was supported by the National Natural Science Foundation of China (NSFC) projects (Grant Nos. 82102099, 81871384, 82272033, and 82071960), the Research Fund of Science and Technology Department of Jilin Province (Grant No. 20200201414JC). The Hygiene Specific Subjects of Jilin Province (Grant Nos. 2020SCZ12 and 2021SCZ05). The Jilin health technology innovation project (2019J015) We thank LetPub for its linguistic assistance during the preparation of this manuscript.
Disclosure
Dr Lei Zhu’s current affiliation is at the Department of Surgery, Emory University School of Medicine, Atlanta, GA 30322, USA. The authors declare no competing interest in this work.
References
1. DeVita VT
2. Sudhakar A. History of cancer, ancient and modern treatment methods. J Cancer Sci Ther. 2009;1(2):1–4. doi:10.4172/1948-5956.100000e2
3. Lim ZF, Ma PC. Emerging insights of tumor heterogeneity and drug resistance mechanisms in lung cancer targeted therapy. J Hematol Oncol. 2019;12(1):134. doi:10.1186/s13045-019-0818-2
4. Lyman GH. Impact of chemotherapy dose intensity on cancer patient outcomes. J Natl Compr Canc Netw. 2009;7(1):99–108. doi:10.6004/jnccn.2009.0009
5. Lehar J, Krueger AS, Avery W, et al. Synergistic drug combinations tend to improve therapeutically relevant selectivity. Nat Biotechnol. 2009;27(7):659–666. doi:10.1038/nbt.1549
6. Zhang L, Zhang M, Zhou L, et al. Dual drug delivery and sequential release by amphiphilic janus nanoparticles for liver cancer theranostics. Biomaterials. 2018;181:113–125. doi:10.1016/j.biomaterials.2018.07.060
7. Keith CT, Borisy AA, Stockwell BR. Multicomponent therapeutics for networked systems. Nat Rev Drug Discov. 2005;4(1):71–78. doi:10.1038/nrd1609
8. Fu X, Shi Y, Qi T, et al. Precise design strategies of nanomedicine for improving cancer therapeutic efficacy using subcellular targeting. Signal Transduct Target Ther. 2020;5(1):262. doi:10.1038/s41392-020-00342-0
9. Bayat Mokhtari R, Homayouni TS, Baluch N, et al. Combination therapy in combating cancer. Oncotarget. 2017;8(23):38022–38043. doi:10.18632/oncotarget.16723
10. Rougier P, Mitry E. Review of the role of cpt-11 in the treatment of colorectal cancer. Clin Colorectal Cancer. 2001;1(2):87–94. doi:10.3816/CCC.2001.n.008
11. Goetz MP, Erlichman C, Windebank AJ, et al. Phase I and pharmacokinetic study of two different schedules of oxaliplatin, irinotecan, fluorouracil, and leucovorin in patients with solid tumors. J Clin Oncol. 2003;21(20):3761–3769. doi:10.1200/JCO.2003.01.238
12. Alsaab HO, Alghamdi MS, Alotaibi AS, et al. Progress in clinical trials of photodynamic therapy for solid tumors and the role of nanomedicine. Cancers. 2020;12:10. doi:10.3390/cancers12102793
13. Song M, Liu T, Shi C, Zhang X, Chen X. Bioconjugated manganese dioxide nanoparticles enhance chemotherapy response by priming tumor-associated macrophages toward m1-like phenotype and attenuating tumor hypoxia. ACS Nano. 2016;10(1):633–647. doi:10.1021/acsnano.5b06779
14. Li SD, Huang L. Pharmacokinetics and biodistribution of nanoparticles. Mol Pharm. 2008;5(4):496–504. doi:10.1021/mp800049w
15. Wang H, Zhao Y, Wu Y, et al. Enhanced anti-tumor efficacy by co-delivery of doxorubicin and paclitaxel with amphiphilic methoxy peg-plga copolymer nanoparticles. Biomaterials. 2011;32(32):8281–8290. doi:10.1016/j.biomaterials.2011.07.032
16. Khdair A, Chen D, Patil Y, et al. Nanoparticle-mediated combination chemotherapy and photodynamic therapy overcomes tumor drug resistance. J Control Release. 2010;141(2):137–144. doi:10.1016/j.jconrel.2009.09.004
17. Fan L, Li F, Zhang H, et al. Co-delivery of pdtc and doxorubicin by multifunctional micellar nanoparticles to achieve active targeted drug delivery and overcome multidrug resistance. Biomaterials. 2010;31(21):5634–5642. doi:10.1016/j.biomaterials.2010.03.066
18. Wiradharma N, Tong YW, Yang YY. Self-assembled oligopeptide nanostructures for co-delivery of drug and gene with synergistic therapeutic effect. Biomaterials. 2009;30(17):3100–3109. doi:10.1016/j.biomaterials.2009.03.006
19. Wang Y, Gao S, Ye WH, Yoon HS, Yang YY. Co-delivery of drugs and DNA from cationic core-shell nanoparticles self-assembled from a biodegradable copolymer. Nat Mater. 2006;5(10):791–796. doi:10.1038/nmat1737
20. Ma Q, Zhao Y, Guan Q, et al. Amphiphilic block polymer-based self-assembly of high payload nanoparticles for efficient combinatorial chemo-photodynamic therapy. Drug Deliv. 2020;27(1):1656–1666. doi:10.1080/10717544.2020.1850921
21. Li ZL, Cai H, Li ZQ, et al. A tumor cell membrane-coated self-amplified nanosystem as a nanovaccine to boost the therapeutic effect of anti-pd-l1 antibody. Bioact Mater. 2023;21:299–312. doi:10.1016/j.bioactmat.2022.08.028
22. Xiao XY, Cai H, Huang QR, et al. Polymeric dual-modal imaging nanoprobe with two-photon aggregation-induced emission for fluorescence imaging and gadolinium-chelation for magnetic resonance imaging. Bioact Mater. 2023;19:538–549. doi:10.1016/j.bioactmat.2022.04.026
23. Cai H, Tan P, Chen XT, et al. Stimuli-sensitive linear-dendritic block copolymer-drug prodrug as a nanoplatform for tumor combination therapy. Adv Mater. 2022;34(8):2108049. doi:10.1002/adma.202108049
24. Zheng XL, Pan DY, Zhu GN, et al. A dendritic polymer-based nanosystem mediates drug penetration and irreversible endoplasmic reticulum stresses in tumor via neighboring effect. Adv Mater. 2022;34(20):2201200. doi:10.1002/adma.202201200
25. Mura S, Nicolas J, Couvreur P. Stimuli-responsive nanocarriers for drug delivery. Nat Mater. 2013;12(11):991–1003. doi:10.1038/nmat3776
26. Li D, Ma Y, Du J, et al. Tumor acidity/nir controlled interaction of transformable nanoparticle with biological systems for cancer therapy. Nano Lett. 2017;17(5):2871–2878. doi:10.1021/acs.nanolett.6b05396
27. Qiu M, Wang D, Liang W, et al. Novel concept of the smart nir-light-controlled drug release of black phosphorus nanostructure for cancer therapy. Proc Natl Acad Sci USA. 2018;115(3):501–506. doi:10.1073/pnas.1714421115
28. Fan RR, Chen CL, Hou H, et al. Tumor acidity and near-infrared light responsive dual drug delivery polydopamine-based nanoparticles for chemo-photothermal therapy. Adv Funct Mater. 2021;31(18):2009733. doi:10.1002/adfm.202009733
29. Saravanakumar G, Kim J, Kim WJ. Reactive-oxygen-species-responsive drug delivery systems: promises and challenges. Adv Sci. 2017;4(1):1600124. doi:10.1002/advs.201600124
30. van der Meel R, Sulheim E, Shi Y, et al. Smart cancer nanomedicine. Nat Nanotechnol. 2019;14(11):1007–1017. doi:10.1038/s41565-019-0567-y
31. Wang J, Sun X, Mao W, et al. Tumor redox heterogeneity-responsive prodrug nanocapsules for cancer chemotherapy. Adv Mater. 2013;25(27):3670–3676. doi:10.1002/adma.201300929
32. Sun CY, Zhang BB, Zhou JY. Light-activated drug release from a hyaluronic acid targeted nanoconjugate for cancer therapy. J Mater Chem B. 2019;7(31):4843–4853. doi:10.1039/c9tb01115c
33. Zhang L, Gao S, Zhang F, et al. Activatable hyaluronic acid nanoparticle as a theranostic agent for optical/photoacoustic image-guided photothermal therapy. ACS Nano. 2014;8(12):12250–12258. doi:10.1021/nn506130t
34. Wu J. The enhanced permeability and retention (epr) effect: the significance of the concept and methods to enhance its application. J Pers Med. 2021;11:8. doi:10.3390/jpm11080771
35. Park JH, Cho HJ, Yoon HY, et al. Hyaluronic acid derivative-coated nanohybrid liposomes for cancer imaging and drug delivery. J Control Release. 2014;174:98–108. doi:10.1016/j.jconrel.2013.11.016
36. Gao S, Wang G, Qin Z, et al. Oxygen-generating hybrid nanoparticles to enhance fluorescent/photoacoustic/ultrasound imaging guided tumor photodynamic therapy. Biomaterials. 2017;112:324–335. doi:10.1016/j.biomaterials.2016.10.030
37. Tan JX, Wang XY, Li HY, et al. Hyal1 overexpression is correlated with the malignant behavior of human breast cancer. Int J Cancer. 2011;128(6):1303–1315. doi:10.1002/ijc.25460
38. Choi KY, Chung H, Min KH, et al. Self-assembled hyaluronic acid nanoparticles for active tumor targeting. Biomaterials. 2010;31(1):106–114. doi:10.1016/j.biomaterials.2009.09.030
39. Kalyanasundaram K, Thomas JK. Environmental effects on vibronic band intensities in pyrene monomer fluorescence and their application in studies of micellar systems. J Am Chem Soc. 1977;99(7):2039–2044. doi:10.1021/ja00449a004
40. Li J, Huo M, Wang J, et al. Redox-sensitive micelles self-assembled from amphiphilic hyaluronic acid-deoxycholic acid conjugates for targeted intracellular delivery of paclitaxel. Biomaterials. 2012;33(7):2310–2320. doi:10.1016/j.biomaterials.2011.11.022
41. Lokeshwar VB, Cerwinka WH, Isoyama T, Lokeshwar BL. Hyal1 hyaluronidase in prostate cancer: a tumor promoter and suppressor. Cancer Res. 2005;65(17):7782–7789. doi:10.1158/0008-5472.CAN-05-1022
42. Kobayashi T, Chanmee T, Itano N. Hyaluronan: metabolism and function. Biomolecules. 2020;10:11. doi:10.3390/biom10111525
43. Cowman MK, Lee HG, Schwertfeger KL, McCarthy JB, Turley EA. The content and size of hyaluronan in biological fluids and tissues. Front Immunol. 2015;6:261. doi:10.3389/fimmu.2015.00261
44. Tavianatou AG, Caon I, Franchi M, et al. Hyaluronan: molecular size-dependent signaling and biological functions in inflammation and cancer. FEBS J. 2019;286(15):2883–2908. doi:10.1111/febs.14777
45. Zhu L, Zhao Y, Liu T, et al. Inhibition of NADPH oxidase-ros signal using hyaluronic acid nanoparticles for overcoming radioresistance in cancer therapy. ACS Nano. 2022;16(11):18708–18728. doi:10.1021/acsnano.2c07440
46. Stern R, Kogan G, Jedrzejas MJ, Soltes L. The many ways to cleave hyaluronan. Biotechnol Adv. 2007;25(6):537–557. doi:10.1016/j.biotechadv.2007.07.001
47. Franzmann EJ, Schroeder GL, Goodwin WJ, et al. Expression of tumor markers hyaluronic acid and hyaluronidase (hyal1) in head and neck tumors. Int J Cancer. 2003;106(3):438–445. doi:10.1002/ijc.11252
48. Kolliopoulos C, Bounias D, Bouga H, et al. Hyaluronidases and their inhibitors in the serum of colorectal carcinoma patients. J Pharmaceut Biomed. 2013;83:299–304. doi:10.1016/j.jpba.2013.05.037
49. Kramer MW, Escudero DO, Lokeshwar SD, et al. Association of hyaluronic acid family members (has1, has2, and hyal-1) with bladder cancer diagnosis and prognosis. Cancer. 2011;117(6):1197–1209. doi:10.1002/cncr.25565
50. McAtee CO, Barycki JJ, Simpson MA. Emerging roles for hyaluronidase in cancer metastasis and therapy. Adv Cancer Res. 2014;123:1–34. doi:10.1016/B978-0-12-800092-2.00001-0
51. Lokeshwar VB, Rubinowicz D, Schroeder GL, et al. Stromal and epithelial expression of tumor markers hyaluronic acid and hyal1 hyaluronidase in prostate cancer. J Biol Chem. 2001;276(15):11922–11932. doi:10.1074/jbc.M008432200
52. Jung H. Hyaluronidase: an overview of its properties, applications, and side effects. Arch Plast Surg. 2020;47(4):297–300. doi:10.5999/aps.2020.00752
53. Tzircotis G, Thorne RF, Isacke CM. Chemotaxis towards hyaluronan is dependent on cd44 expression and modulated by cell type variation in cd44-hyaluronan binding. J Cell Sci. 2005;118(Pt21):5119–5128. doi:10.1242/jcs.02629
54. Snezhkina AV, Kudryavtseva AV, Kardymon OL, et al. Ros generation and antioxidant defense systems in normal and malignant cells. Oxid Med Cell Longev. 2019;2019:1–17. doi:10.1155/2019/6175804
 © 2023 The Author(s). This work is published and licensed by Dove Medical Press Limited. The
full terms of this license are available at https://www.dovepress.com/terms
and incorporate the Creative Commons Attribution
- Non Commercial (unported, 3.0) License.
By accessing the work you hereby accept the Terms. Non-commercial uses of the work are permitted
without any further permission from Dove Medical Press Limited, provided the work is properly
attributed. For permission for commercial use of this work, please see paragraphs 4.2 and 5 of our Terms.
© 2023 The Author(s). This work is published and licensed by Dove Medical Press Limited. The
full terms of this license are available at https://www.dovepress.com/terms
and incorporate the Creative Commons Attribution
- Non Commercial (unported, 3.0) License.
By accessing the work you hereby accept the Terms. Non-commercial uses of the work are permitted
without any further permission from Dove Medical Press Limited, provided the work is properly
attributed. For permission for commercial use of this work, please see paragraphs 4.2 and 5 of our Terms.