Back to Journals » International Journal of Nanomedicine » Volume 18
Endogenous H2O2 Self-Replenishment and Sustainable Cascades Enhance the Efficacy of Sonodynamic Therapy
Authors Du JR, Teng DK, Wang Y, Wang Q, Lin YQ, Luo Q, Xue JN, Zhu LY, Dong P, Zhang GM, Liu Y, Sun ZX, Wang H ![]() , Sui GQ
, Sui GQ
Received 17 August 2023
Accepted for publication 1 November 2023
Published 13 November 2023 Volume 2023:18 Pages 6667—6687
DOI https://doi.org/10.2147/IJN.S431221
Checked for plagiarism Yes
Review by Single anonymous peer review
Peer reviewer comments 2
Editor who approved publication: Prof. Dr. Anderson Oliveira Lobo
Jia-Rui Du, Deng-Ke Teng, Yang Wang, Qimeihui Wang, Yuan-Qiang Lin, Qiang Luo, Jia-Nan Xue, Ling-Yu Zhu, Peng Dong, Gen-Mao Zhang, Yan Liu, Zhi-Xia Sun, Hui Wang,* Guo-Qing Sui*
Department of Ultrasound, China-Japan Union Hospital of Jilin University, Changchun, Jilin, 130000, People’s Republic of China
*These authors contributed equally to this work
Correspondence: Hui Wang; Guo-Qing Sui, Email [email protected]; [email protected]
Purpose: Sonodynamic therapy (SDT), with its high tissue penetration and noninvasive advantages, represents an emerging approach to eradicating solid tumors. However, the outcomes of SDT are typically hampered by the low oxygen content and immunosuppression in the tumor microenvironment (TME). Accordingly, we constructed a cascade nanoplatform to regulate the TME and improve the anti-tumor efficiency of SDT.
Methods: In this study, we rationally design cascade nanoplatform by incorporating immunostimulant hyaluronic acid (HA) and sonosensitizer chlorin e6 (Ce6) on the polydopamine nanocarrier that is pre-doped with platinum nanozymes (designated Ce6/Pt@PDA-HA, PPCH).
Results: The cascade reactions of PPCH are evidenced by the results that HA exhibits reversing immunosuppressive that converts M2 macrophages into M1 macrophages in situ, while producing H2O2, and then platinum nanozymes further catalyze the H2O2 to produce O2, and O2 produces abundant singlet oxygen (1O2) under the action of Ce6 and low-intensity focused ultrasound (LIFU), resulting in a domino effect and further amplifying the efficacy of SDT. Due to its pH responsiveness and mitochondrial targeting, PPCH effectively accumulates in tumor cells. Under LIFU irradiation, PPCH effectively reverses immunosuppression, alleviates hypoxia in the TME, enhances reactive oxygen species (ROS) generation, and enhances SDT efficacy for eliminating tumor cells in vivo and in vitro. Meanwhile, an in vivo dual-modal imaging including fluorescence and photoacoustic imaging achieves precise tumor diagnosis.
Conclusion: This cascade nanoplatform will provide a promising strategy for enhancing SDT eradication against tumors by modulating immunosuppression and relieving hypoxia.
Keywords: tumor microenvironment, tumor-associated macrophages, cascade reactions, sonodynamic therapy, tumor hypoxia
Graphical Abstract:

Introduction
The tumor microenvironment (TME) supports tumor cell survival and often features hypoxia, weak acidity, and immunosuppression (M2 macrophages). These complex characteristics promote the occurrence and development of tumors1 and inhibit the efficacy of various treatments (such as chemotherapy, radiotherapy, acoustic therapy, and optical therapy).2,3 One such therapy is sonodynamic therapy (SDT), which was developed on the basis of optical therapy and has great potential in the field of tumor therapy due to its advantages of noninvasiveness, negligible side effects, and deep tissue penetration.4–6 In SDT, a combination of ultrasound, sonosensitizer(s) and molecular oxygen (O2), could produce abundant singlet oxygen (1O2), which is a kind of reactive oxygen species (ROS) that can significantly induce cellular toxicity.7,8 Therefore, increasing the O2 content can promote ROS production and improve SDT efficacy.9 However, intrinsic characteristics of the TME severely counteract SDT performance, especially hypoxia and immunosuppression.10–12 In recent years, immunotherapies based on SDT have shown encouraging results in the field of tumor immunotherapy.13,14 However, improving the efficacy of SDT antitumor therapies by reversing immunosuppression and producing oxygen has not been widely explored.
Hypoxia is an intractable physiological barrier for SDT and is closely related to tumor mutagenesis and angiogenesis.15,16 Additionally, the continued consumption of O2 during the SDT process may further aggravate TME hypoxia, which in turn restricts the efficacy of SDT.17–19 To overcome the limitation in the TME, various strategies have been reported to alleviate hypoxia. In addition to the use of specific oxygen carriers to deliver O2 to the tumor site, the production of oxygen in situ by chemical reactions has shown great potential in alleviating tumor hypoxia.20–22 For example, catalytic decomposition of endogenous H2O2 (by enzymes such as catalase [CAT] and nanozymes [Pt, Fe, Mn, etc.])23–26 has been used to achieve in situ oxygen supply and improve tumor hypoxia. However, compared with natural enzymes, nanozymes have the advantages of simple synthesis protocols, adjustable catalytic activity, high catalytic stability, and low cost; thus, nanozymes have been widely used in the medical field. Platinum (Pt), an important transition metal element, has excellent catalytic properties, and Pt-based catalase (CAT-like) has attracted wide attention in the field of tumor therapy.27 However, the supply of H2O2 in the TME is limited and unsustainable and therefore cannot produce sufficient O2 to support effective SDT therapy, and a discontinuous oxygen supply may cause SDT therapy tolerance, preventing the therapy from achieving a good effect.28–30 In addition, it is inevitable that the leakage of exogenously delivered, packaged H2O2 will cause damage to normal tissues, so generating H2O2 in tumor cells in situ is a better choice.
Another critical barrier to SDT therapeutic efficacy is immunosuppression in the TME. In the TME, a mass of immunosuppressive cells creates an immunosuppressive microenvironment that prevents tumor cells from being attacked by the immune system or external therapeutics, thus reducing antitumor effects.31,32 Therefore, it is of great importance to regulate the immunosuppressive microenvironment in order to improve the therapeutic effect of SDT. Previous studies have demonstrated that high densities of M2 macrophages are present in the hypoxic regions of tumors and that macrophages are the main causes of tumor immunosuppression.33 The main strategies used to regulate the immunosuppressive microenvironment involve regulating the physiological characteristics of tumor hypoxia and regulating the polarization of macrophages (promoting the polarization of macrophages toward the M1 type).34,35 Tumor-associated macrophages (TAMs) are important nonneoplastic immune cells in the TME.36,37 There are two main subtypes of macrophages in vivo: classically activated macrophages (M1) and alternatively activated macrophages (M2).38 M1 macrophages release pro-inflammatory cytokines (such as tumor necrosis factor [TNF], interleukin-6 [IL-6], IL-12, and IL-23) and reactive nitrogen and oxygen species (such as NO, H2O2 and superoxide) to produce antitumor effects.39,40 In contrast, M2 macrophages release protumor cytokines (IL-4, IL-10, IL-13, growth factors, and so on) in the TME to promote tumor progression.41 Therefore, remodeling the macrophage phenotype (M2→M1) can continuously provide endogenous H2O2 and reverse immunosuppression. The polysaccharide hyaluronic acid (HA) has been applied extensively in advanced drug and gene delivery systems due to its biocompatibility, biodegradability, tumor-targeting specificity (CD44+ receptor), and non-immunogenicity.42,43 In addition, it has been shown that low-molecular-weight HA (MW <5 kDa) can induce the conversion of TAMs into M1 macrophages,44 thus guaranteeing continuous supplementation of the H2O2 substrate in the hypoxic tumor area. However, the H2O2 cascade triggered by catalase properties has been widely developed for cancer therapy,24 while the H2O2 cascade triggered by remodeling macrophage phenotypes in TME to achieve effective cancer therapy has not been widely explored.
We herein report a cascade nanoplatform that incorporates the immunostimulant HA and the sonosensitizer chlorin e6 (Ce6) on a polydopamine nanocarrier that is predoped with platinum (Pt) nanozymes (designated Ce6/Pt@PDA-HA, PPCH) and can achieve efficient cancer therapy. During the sequential reaction, HA converts M2 macrophages into M1 macrophages in situ, reverses immunosuppression and produces H2O2 at the same time, achieving endogenous H2O2 self-replenishment. Then, Pt nanozymes act as CAT-like catalysts to decompose endogenous H2O2 and generate O2, alleviating TME hypoxia. O2 produces 1O2 under the action of Ce6 and LIFU, and ROS levels are amplified. Simultaneously, pH-responsiveness and mitochondrial targeting orient PPCH into the tumor tissue mitochondria, further ensuring the efficacy of SDT. This nanoplatform not only reverses immunosuppression but also relieves hypoxia and increases ROS production, which fundamentally ensures the efficacy of SDT. Thus, this nanoplatform is expected to serve as an effective strategy for tumor therapy.
Materials and Methods
Materials
Dopamine hydrochloride, 1,3-diphenyl isobenzofuran (DPBF), N-hydroxysuccinimide (NHS), and 1-(3-dimethylaminopropyl)-3-ethylcarbodiimide hydrochloride (EDC) were purchased from Aladdin. Chloroplatinic acid hydrate (H2PtCl6·6H2O) and chlorin e6 (Ce6) were purchased from Sigma‒Aldrich. Sodium hyaluronate (HA, MW = 4.8 kDa) was purchased from Bloomage Freda Biopharm Co., Ltd. 4′,6-Diamidino-2-phenylindole (DAPI), MitoTracker Green and 2.7-dichlorodihydrofluorescein diacetate (DCFH-DA) were purchased from Beyotime Biotechnology. SH-PEG2000-NH2 was purchased from Xi’an Ruixi Biotechnology Co., Ltd. Calcein AM/PI and cell counting kit-8 (CCK-8) were purchased from Dojindo Molecular Technology. Recombinant murine IL-4 was obtained from PeproTech Co., Ltd. Lipopolysaccharide (LPS) was purchased from Solarbio Life Sciences. Mice Anti-CD86/PE and mice Anti-CD206/FITC antibodies were purchased from BioLegend Co., Ltd. The cells used in the experiment were purchased from the Chinese Academy of Sciences Cell Bank. All reagents used in the experiments were analytical grade and used directly without treatment.
Characterization
Transmission electron microscopy (TEM) images were obtained with a JEM-2100F transmission electron microscope, and element mapping analysis was performed on an X-MaxN 80T. X-ray photoelectron spectroscopy (XPS) measurements were performed using a Thermo VG Scientific ESCALAB 250 spectrometer. X-ray diffraction (XRD) was measured on a Rigaku D/MAX-2550 diffractometer. Fourier transform infrared (FTIR) spectroscopy images were recorded using a Bruker VERTEX 80v spectrometer. UV‒Vis absorption spectra were obtained on an ultraviolet‒visible spectrophotometer (Shimadzu, UV2450u). The size of the nanoplatform was measured by a ZS90 Zetasizer. The catalytic efficiency of oxygen production was assessed with an oxygen probe (Multi 3510 IDS portable dissolved oxygen meter). Flow cytometry analysis was performed with a flow cytometry (BD FACSCalibur). Confocal laser scanning microscope (CLSM) was performed by a cell fluorescence analysis (Olympus FV1000).
Synthesis of PDA
Polydopamine (PDA) was synthesized by improving upon a method previously reported.45 Briefly, 3 mL of aqueous ammonia solution (28–30%) was added to a mix of 90 mL of water and 40 mL of ethanol at room temperature under gentle magnetic stirring. Dopamine hydrochloride (500 mg) in water (10 mL) was then added dropwise to the above solution. The reaction was allowed to proceed for 4 h until the color of the solution changed to dark brown. Finally, the products were obtained by centrifugation and washed with deionized water. The concentration of PDA was determined by weighing after lyophilization.
Synthesis of Pt@PDA (PP)
The prepared PDA (10 mg) was resuspended in 10 mL of ethylene glycol. Chloroplatinic acid hydrate (1 mL, 18.59 mM) was added, and the mixture was sonicated for 10 min. Then, the solution was transferred to a Teflon-lined stainless-steel autoclave and incubated at 100 °C for 10 h, and the products were collected by centrifugation and placed in a vacuum drying oven at 60 °C overnight.
Synthesis of HA-PEG-SH
HA (50 mg), EDC (346 mg) and NHS (206 mg) were mixed in deionized water (10 mL) and activated for 2 h. NH2-PEG-SH (50 mg) in water (10 mL) was then added to the above solution in a dropwise manner. After continuous stirring for 24 h, HA-PEG-SH was dialyzed against ultrapure water for 24 h and lyophilized.
Synthesis of Ce6/Pt@PDA-HA (PPCH)
First, polydopamine loaded with the platinum nanozyme (Pt@PDA, PP) was synthesized. Then, Ce6 (2 mL, 2 mg∙mL−1, dissolved in DMSO) was mixed with the PP solution (2 mL, 1 mg∙mL−1) and stirred for 24 h to obtain Ce6/Pt@PDA (PPC). Then, HA-PEG-SH was added to the mixed solution, which was stirred for another 2 h. The resulting mixed solution was washed with deionized water (8000 rpm, 10 min) and lyophilized to obtain the PPCH.
Hemolysis Assay
The hemocompatibility of the PPCH was evaluated with a hemolysis assay. Red blood cells (RBCs) were obtained by washing fresh blood with PBS three times (3500 rpm, 5 min). To purify the RBCs, the supernatant was discarded, and the RBCs were diluted with PBS to obtain a 2% (V/V) suspension. Different concentrations of PPCH were constant volume in 0.8 mL PBS and then adding 0.2 mL 2% RBC solution. PBS and deionized water were used as negative and positive controls, respectively. After incubation at 37 °C for 4 h, each mixture was centrifuged, 100 µL of each supernatant was added to 96-well plates, and the absorbance of each well was measured at 540 nm. Hemolysis rate (%) = (ODtest-ODnegative control)/(ODpositive control-ODnegative control) × 100%.
The Drug Loading and Drug Release of PPCH
To determine the drug loading of PPCH, the PP (2 mg) and SH-PEG-HA (2 mg) were mixed with different concentrations of Ce6 (dissolved in DMSO). After 24 h, the PPCH was washed with deionized water, and the supernatant was collected to measure its absorption at 400 nm. The encapsulation efficiency of Ce6 in the PPCH was calculated as follows: (input quantity of Ce6 – quantity of Ce6 in the supernatant)/input quantity of Ce6 × 100%.
To measure the release of Ce6 from the PPCH at different pH values, PPCH (0.5 mg) was dispersed in PBS at pH 7.4, 6.5, and 5.5 (5 mL) and kept at room temperature for 7 h. Solution samples were collected and centrifuged at different time points, and the absorbance of Ce6 in the supernatant was measured at 400 nm. Then, the supernatant was remixed with the precipitating solution and placed back into the original solution.
Reactive Oxygen Species Production
Singlet oxygen sensor green (SOSG), which is a 1O2 indicator, was used to evaluate SDT efficacy of PPCH. Briefly, 2 mL solutions (PPCH at different concentrations and SOSG [1 μM]) were added into the wells of a 6-well plate and irradiated by LIFU (1.0 W∙cm−2, 3 min) at designated time intervals. The absorption spectra were determined by fluorescence spectrophotometry. The yield of 1O2 produced by PPCH was also quantitatively analyzed with DPBF. The absorption of the DPBF and PPCH mixed solution was measured at 410 nm every 30s. DPBF + H2O2 (1 mM) and DPBF + PPCH were used as controls. Remaining DPBF = (absorption of the initial mixture – absorption value after low-intensity focused ultrasound (LIFU))/absorption of the initial mixture × 100%.
Catalytic Decomposition of H2O2 by PPCH
The oxygen evolution over time by the samples was recorded with a portable dissolved oxygen meter. In detail, PPCH solution (final concentration: 100 μg∙mL−1) was added to 10 mL of PBS at various pH values (5.5, 6.5, and 7.4), followed by the addition of H2O2. O2 generation was monitored at different times during the reaction.
To detect intracellular oxygen production, 4T1 cells were cultured overnight in confocal culture dishes, and a cultural medium containing PDA-HA (PH) or Pt@PDA-HA (PPH) was added for 2 h of incubation. Then, [Ru(dpp)3]Cl2 was used to detect intracellular anoxia. After 30 min, the cells were washed with PBS and observed by confocal laser scanning microscope (CLSM).
Tumor-Associated Macrophage Polarization
RAW264.7 cells were incubated in DMEM containing 1000 ng∙mL−1 LPS for 48 h to generate M1 macrophages, which were then treated with 40 ng∙mL−1 IL-4 for 24 h to obtain M2 macrophages. Then, typical markers of the M1 and M2 phenotypes, CD86/PE (dilution 1:200) and CD206/FITC (dilution 1:100), were used to stain M1 and M2 macrophages. Flow cytometry was performed to assess the M1 and M2 ratio.
To investigate the internalization of PPCH by M2 macrophages, RAW264.7 cells pretreated with IL-4 were incubated with PPCH for 1, 2, and 3 h. After three washes with PBS, the cells were fixed with 4% paraformaldehyde and stained with DAPI (5 μg∙mL−1) for 10 min. CLSM was used to record the results. In addition, to quantitatively determine the internalization of PPCH, after treatment with PPCH for 1, 2, and 3 h, the cells were washed with PBS and collected for flow cytometry detection.
Furthermore, to investigate whether PPCH could polarize M2 macrophages into M1 macrophages, M2 macrophages were incubated with PPC or PPCH for 2 h. Next, the cells were washed with PBS and incubated with dye for both CD86/PE and CD206/FITC for 30 min. Finally, the ratio of M1 and M2 was analyzed by flow cytometry.
Measurement of H2O2 production by M1 macrophages. The amount of H2O2 produced by macrophages was measured using a hydrogen peroxide assay kit. M2 macrophages were incubated with PPC or PPCH for 2 h. Cells were collected and adjusted to the same density and lysed. The supernatant was then added to the detection reagent, and the absorbance was measured with the enzyme label instrument. The H2O2 production in each group was calculated according to the standard curve.
In vitro Cellular Uptake
The cellular internalization by 4T1 cells was evaluated by flow cytometry. Briefly, cells were incubated with PPCH (concentration: 50 μg∙mL−1) at 37 °C for various lengths of time. The final quantitative measurements were conducted by flow cytometry.
In vitro Subcellular Localization
4T1 cells were seeded in confocal dishes and cultured overnight. Medium containing PPCH was added to confocal dishes, and the cells were incubated for 2 h. Next, the cells were washed with PBS three times and stained with DAPI (10 min) and Mito-Tracker Green (30 min). Finally, the cells were observed by CLSM.
In vitro ROS Detection
The ROS levels in cells were detected by DCFH-DA. Briefly, 4T1 cells were seeded in confocal dishes and cultured overnight. Ce6@PDA (PC), PPC, and PPCH were incubated with the cells in the dark for 2 h, and then the cells were cultured with DCFH-DA for 30 min. Afterward, the cells in the LIFU groups were irradiated (1.0 W∙cm−2) for 3 min. After the medium was removed, the cells were washed 3 times with PBS and stained with DAPI (5 μg∙mL−1) for 10 min. Fluorescence imaging of the cells was performed by CLSM, and flow cytometry was also utilized to quantify the production of ROS.
In vitro Cytotoxicity Assay
To investigate the in vitro safety of the PPCH, cells were cultured in 96-well plates and incubated overnight. Thereafter, gradient concentrations of PC, PPC, and PPCH (10, 25, 50, 100, and 200 μg∙mL−1) were added to each well for 2 h of incubation. After 2 h, the medium was replaced with complete medium, and five parallel samples were set up in each group. After incubation for another 24 h, the culture medium was removed, and the CCK-8 assay was applied to measure cell viability.
In vitro Synergistic Therapeutic Effects
Preparation of different conditioned media: RAW264.7 cells were incubated with IL-4 for 24 h, and then the old medium was replaced with fresh medium containing 50 μg∙mL−1 PPCH. After incubation for 2 h, the medium was collected as conditioned medium. Additionally, untreated M1 medium was defined as M1 conditioned medium, and untreated M2 medium was defined as M2 conditioned medium.
4T1 cells were treated with PC, PPC, and PPCH at different concentrations (10, 25, 50, 100, and 200 μg∙mL−1) for 2 h, and then the cells were subjected to LIFU irradiation. Cell survival rates were calculated after continuous culture for 24 h. In addition, the toxicity of PPCH-conditioned medium (PPCH+M2) to 4T1 cells was also evaluated by the CCK-8 method. To determine the pH-responsive therapeutic effect, 4T1 cells were cultured in PPCH condition media (PPCH+M2) at pH 6.5 for 2 h.
To observe the cell killing effect, calcein-AM/PI staining kits were used. Cells were cultured in 6-well plates and incubated overnight. After treatment with PC, PPC, or PPCH for 2 h, the cells were washed with PBS three times and subjected to LIFU (1.0 W∙cm−2, 3 min). The cells were then cultured with calcein-AM and PI in buffer solutions for 15 min at 37 °C. Fluorescence images were obtained using a fluorescence microscope.
In vivo Safety Evaluation
Female BALB/c mice were randomly divided into four groups, and the mice in three of the groups were injected with PPCH (5 mg∙mL−1) via the tail vein once every 3 d. The mice in the other group were injected with the same amount of saline as the control group. Blood was collected after 5, 15, and 30 d before the mice were sacrificed. Blood biochemical analysis was performed, and the major organs (heart, liver, spleen, lungs, and kidneys) were collected for hematoxylin–eosin (HE) staining.
In vivo Fluorescence (FL) and Photoacoustic (PA) Imaging
4T1 cancer cells (1×10⁶) were subcutaneously inoculated into BALB/c mice (female, 4 weeks) to establish a tumor model. PPCH was intravenously injected into the tumor-bearing mice. In vivo fluorescence imaging was performed at different time points (0, 1, 2, 4, 8, and 24 h). After being sacrificed at 24 h point, the organs and tumors were collected.
To further evaluate PPCH accumulation inside tumors, PPCH was intravenously injected into mice. Then, images were acquired at several time points (0, 1, 2, 4, 8, and 24 h). The relative PA signal intensities were analyzed by VEVO LAZR-X PA imaging software.
Reprogramming of the TME
To determine the effect of PPCH on TME reprogramming, tumors were collected at 3 d after various treatments were administered. M1 and M2 macrophages in tumors after various treatments were analyzed by immunofluorescence and flow cytometry according to standard protocols. For flow cytometry analysis, the cells were stained with anti-CD11b-APC, anti-F4/80-FITC, and anti-CD86/CD206-PE. For immunofluorescence analysis, anti-CD86-PE and anti-CD206-FITC were used to determine the distribution of M1 and M2 macrophages in tumor tissues, respectively.
In vivo Synergistic Therapeutic Effect Evaluation
When the tumor volumes reached 100 mm3, 4T1 tumor-bearing mice were randomly divided into six groups, and five parallel samples were set for each group: (I) saline, (II) LIFU, (III) PPCH, (IV) PC + LIFU, (V) PPC + LIFU, and (VI) PPCH + LIFU. For 4 hours, the different probes (5 mg∙mL−1) were intravenously injected into the mice, LIFU (1 W∙cm−2, 5 min) was applied to the appropriate experimental groups. After treatment, the solid tumor from one mouse in each group was dissected for HE and TUNEL staining. The solid tumor was also used for anti-CD31 antibody and hypoxic immunohistochemical staining. Mouse body weight and tumor volume were recorded every 3 days. All animal experiments were approved by the Animal Experimental Ethics Committee of Changchun Wish Detection Technology Service Co., Ltd.
Statistical Analysis
Experimental data are expressed in this manuscript as the mean ± SD. Comparisons between different groups were analyzed by two-tailed Student’s t test. Values of *p < 0.05, **p < 0.01 and ***p < 0.001 were considered to indicate statistical significance.
Results and Discussion
Synthesis and Characterization of PPCH
The preparation process for the PPCH nanocomposite is shown in Scheme 1. First, PDA was formed by the self-polymerization of dopamine hydrochloride. The surface of PDA contains a catecholic structure, reactive double bonds, and abundant π electron clouds. PDA with a uniform particle size was obtained by adjusting the proportion of ammonia water (Figure S1). Since PDA can serve as an anchor for the resultant metal (0), chloroplatinic acid hydrate was subsequently reduced in situ via a polyol-assisted reduction strategy to obtain Pt@PDA (PP).46 Furthermore, the structure of PP was analyzed by X-ray diffraction (XRD), and the XRD results showed that the characteristic diffraction peaks of PP (111), (200), (220), and (311) coincided with the reported peaks of Pt nanozymes (Figure 1C), indicating the successful loading of Pt nanozymes. The sonosensitizer Ce6 was coloaded on the surface of Pt@PDA via π–π stacking and electrostatic interactions. Reportedly, HA is an immunostimulant and has immunotoxicological effects on macrophages. In particular, HA (MW <5 kDa) can activate the polarization of M2 macrophages to M1 macrophages. Herein, to enhance the biocompatibility and stability of Ce6/Pt@PDA (PPC) and their ability to regulate TME immunosuppression, the surface of HA-PEG-SH was modified by metal coordination and a Michael addition reaction to obtain the final cascade nanoplatform (Ce6/Pt@PDA-HA, PPCH). The transmission electron microscopy (TEM) results showed that the PPCH exhibited a well-defined spherical morphology, uniform dispersion, and homogeneous particle size distribution (Figure 1A), and elemental mapping revealed that Pt, C, N, and O were distributed on the surface of the probe (Figure 1B). Dynamic light scattering (DLS) measurements demonstrated that the PP, PPC, and PPCH were well dispersed, with average hydrodynamic diameters of 108.87±9.65 nm, 122.26±12.45 nm, and 159.87±14.45 nm, respectively (Figure 1D). The average zeta potentials were −8.86±0.19 mV, −20.15±0.07 mV, and −14.35±0.78 mV, respectively (Figure S2. Notably, these negative zeta potentials prevented agglomeration and ensured that PPCH created a uniform suspension in solution. In addition, X-ray photoelectron spectroscopy (XPS) analysis confirmed that the feature peaks of the PPCH coincided with those of Pt alone (Figure S3). The result of Pt 4f peak revealed that Pt0 was dominant in PPCH. These results proved that PDA had been successfully loaded with Pt. The Fourier transform infrared (FTIR) spectroscopy results confirmed the successful synthesis of HA-PEG-SH and PPCH through the amide bond, as the spectrum contained a C=O stretching vibration peak at 1718 cm−1 as well as a band from N–H bending at 1521 cm−1, which indicated that an amidation reaction successfully linked the carboxyl group of HA with the amino group of NH2-PEG-SH for loading onto the PPCH (Figure 1E).
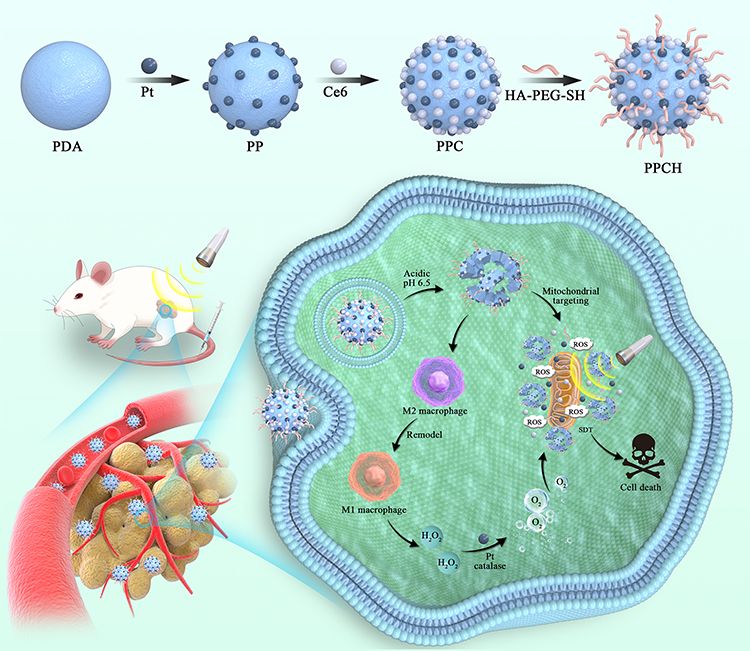 |
Scheme 1 Schematic illustration of PPCH synthesis and tumor therapy. |
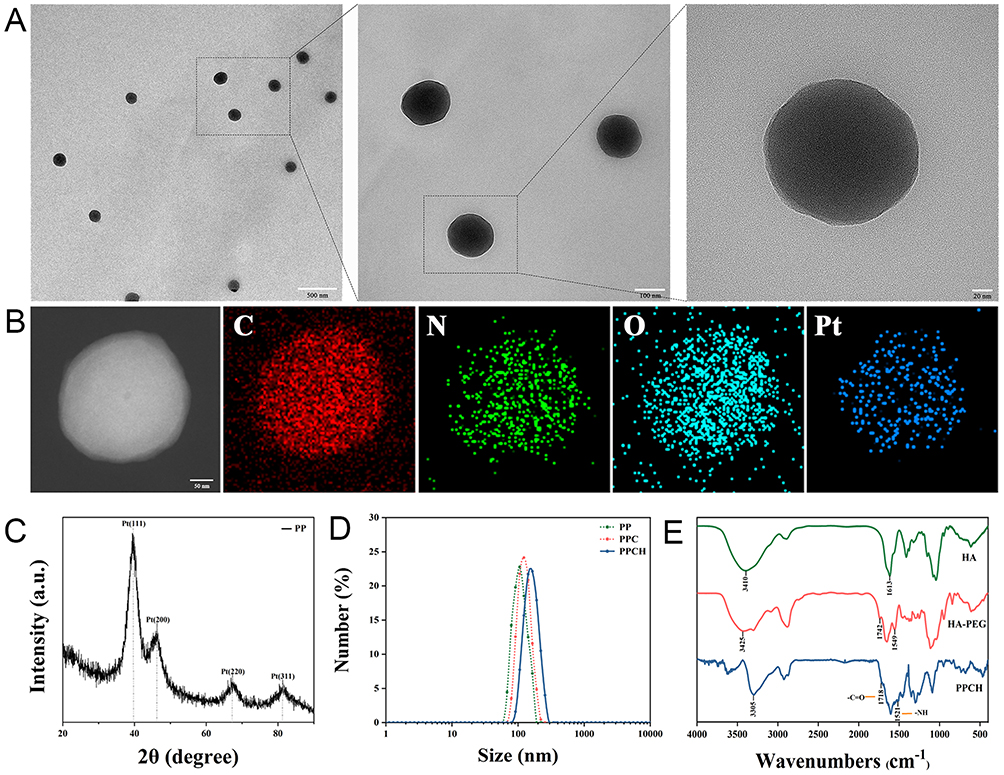 |
Figure 1 (A) Transmission electron microscopy (TEM) and magnification of PPCH. (B) Elemental mapping for PPCH. (C) XRD pattern of PPCH. (D) Size distribution of PP, PPC and PPCH. (E) FTIR spectra of HA, HA-PEG and PPCH. |
Next, to study whether the PPCH displayed pH-responsive decomposition behavior, the probe was dispersed in phosphate buffer (PBS) at pH 7.4, 6.5, and 5.5 for 5 h. As shown by scanning electron microscopy (SEM), the PPCH remained intact at pH 7.4, while varying degrees of degradation were observed under acidic conditions (Figure S4). The disintegration of the PPCH increased with decreasing pH, indicating that the PPCH could achieve pH-responsive degradation in the acidic TME (pH ~6.5).47,48 Regarding the mechanism of biodegradation, previous reports49,50 noted that when the pH value of the solution decreased from 8.5 to 5, the thickness of the deposited polydopamine film gradually decreased, indicating that the π–π stacking and hydrogen bonding interactions between the drug and polydopamine were pH-sensitive. With the decrease in pH, which comes with an increase in the number of hydrogen atoms (protons), the chemical equilibrium shifts toward product degradation. Moreover, the pH-responsive biodegradability of PDA has been observed in previous studies.51–53 Based on their pH-response characteristics, the capability of PPCH to act as a pH-responsive drug carrier was further investigated. As shown in the UV‒Vis absorption spectrum, the specific absorption peaks of Ce6 at 400 and 660 nm were observed in the absorption spectrum of the PPCH (Figure 2A). According to the standard curve of Ce6 (Figure S5), the Ce6 loading content also changed as the drug to carrier feeding ratio changed. At a feed ratio of Ce6 to Pt@PDA of 2:1, the encapsulation rate and drug loading of Ce6 reached the rather high levels of 64.33±0.52% and 42.90±0.36%, respectively (Figure 2B). It was manifested that the probe successfully loaded Ce6 and ensure implementation of SDT.
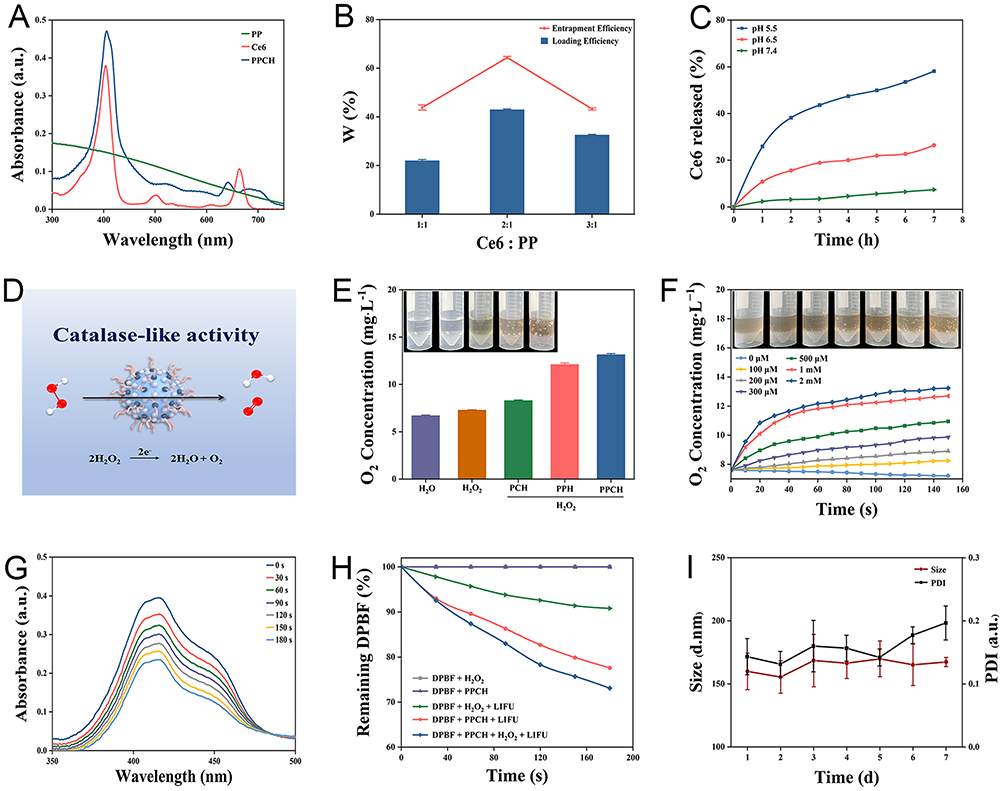 |
Figure 2 (A) Ultraviolet–visible absorption spectra of Ce6, PP and PPCH. (B) Loading efficacy and entrapment efficacy of Ce6. (C) Ce6 controlled release curves of PPCH triggered by different pH values. (D) Schematic presentation of the CAT-like activity of PPCH. (E) Oxygen concentrations in the solutions of different groups. Insert: optical images of oxygen bubbles. (F) Changes in dissolved oxygen concentration after PPCH reacted with different concentrations of H2O2. (G) Ultraviolet–visible absorption spectra of DPBF and PPCH mixed solution with LIFU time. (H) ROS production by PPCH under different conditions. (I) Changes in the hydrated particle size and PDI of PPCH. |
The release behavior of Ce6 from the PPCH was then studied in solutions at different pH values. The Ce6 release rate in acidic solutions increased significantly as the pH decreased compared to that at pH 7.4 (Figure 2C), owing to the pH-responsive decomposition of the PPCH. It was found that more Ce6 could be released in acidic PBS (pH 5.5) (Figure S6). Approximately 58% of the loaded Ce6 was released from the PPCH after incubation at pH 5.5 for 7 h, which was much higher than its release at pH 6.5 and 7.4. Consequently, the pH-responsive PPCH could be used to release drugs in the acidic TME to enhance SDT.
The H2O2 content in tumor tissues is generally high. Moreover, it was previously reported that Pt nanozymes present significant catalase-like activity to induce the decomposition of H2O2 into O2. Therefore, to test whether PPCH possesses catalase-like activity and can decompose H2O2 into H2O and O2 (Figure 2D), a dissolved oxygen meter was used to monitor the generation of O2 in different solutions. The dissolved O2 level was stable in the blank H2O2 solution, while obvious oxygen bubbles were observed in the PPH + H2O2 and PPCH + H2O2 solutions (Figure 2E). In addition, Figure 2F illustrates that PPCH catalyzed the generation of O2 in a H2O2 concentration-dependent manner, and higher dissolved O2 levels were obtained with increasing H2O2 concentration. Moreover, oxygen production by the PPCH at different pH values was also measured. The PPCH displayed the highest catalase-like activity under neutral conditions (Figure S7). Nevertheless, the PPCH also exhibited obvious catalase-like activity in pH 6.5 PBS, indicating that the PPCH could accelerate the decomposition of H2O2 into O2 in the acidic tumor microenvironment and thus overcome tumor hypoxia. The above results confirmed that PPCH could catalyze the decomposition of H2O2. To ensure that the oxygen supply would increase ROS generation, the ability of the PPCH to produce 1O2 after low-intensity focused ultrasound (LIFU) irradiation was further examined with the 1O2 reagent Singlet oxygen sensor green (SOSG) and 1.3-diphenylisobenzofuran (DPBF). In the experiment, the signal intensity of SOSG at 530 nm, which indicated the 1O2 production ability of PPCH, gradually increased with prolonged irradiation duration (Figure S8). At the same irradiation duration, the absorption peak of SOSG increased with increasing PPCH concentration (Figure S9). Similarly, the absorption peak intensity of DPBF at 410 nm decreased with increasing time of LIFU treatment (Figure 2G) and PPCH concentration (Figure S10) because the furan ring in DPBF was destroyed by 1O2 and the DPBF was continuously consumed. Moreover, the changes of DPBF at 410 nm absorption under different treatment conditions showed that, the loss of DPBF absorption in PPCH group mixed with H2O2 after LIFU treatment was significantly higher than those in other control groups (Figure 2H), indicating that PPCH could trigger H2O2 decomposition into O2, and more 1O2 was produced after LIFU, and to enhance the SDT effect. Moreover, 1O2 production by the PPCH at different pH values was also tested. The results showed that with decreasing pH, the consumption of DPBF increased (Figure S11), indicating that the PPCH could effectively produce 1O2 in the acidic tumor microenvironment to ensure the efficiency of SDT. Based on the above experiment, PPCH could be used to alleviate hypoxia in the TME and enhance ROS levels during the SDT process.
The stability and biocompatibility of the PPCH were also evaluated. After soaking in ultrapure water for 1 week, the PPCH remained stable with a good polydispersity index (PDI) and without an apparent change in size (Figure 2I). The results of the hemolysis assay showed that the hemolysis rate was remained lower than 5% as the concentration of the PPCH increased gradually, which meets the material safety requirements54 and is within the acceptable range for intravenous administration, and could therefore be used in subsequent experiments (Figure S12).
In vitro Experiment with PPCH
Low molecular weight HA has immune toxicological effects, which can activate macrophages and remodel M2 macrophages to M1 macrophages.55,56 Therefore, we investigated whether PPCH had a macrophage reprogramming effect. First, to determine whether PPCH could be internalized by M2 macrophages, RAW264.7 cells were pretreated to generate M2 macrophages, and internalization of the PPCH was identified by CLSM and flow cytometry (Figure 3A and B). We observed a time-dependent increase in intracellular fluorescence intensity, indicating that the PPCH was easily endocytosed by M2 macrophages, which benefited the polarization of TAMs from M2 to M1 phenotype. Next, we examined whether PPCH would have an immunological effect on macrophage polarization after entering M2 macrophages and performed further exploration. First, we induced RAW264.7 cells into M2 macrophages with 40 ng∙mL−1 IL-4 for 24 h and incubated these macrophages with PPC and PPCH for 2 h. Then, a CD206/FITC antibody was used to identify M2 macrophages, and a CD86/PE antibody was chosen as a typical marker for M1 macrophages. Quantitative flow cytometry analysis (Figure 3C) revealed that ~75.0% of the macrophages had been successfully induced to the M2 phenotype. Next, M2 macrophages were treated with PPC or PPCH, and we observed that the expression of CD86 was dramatically upregulated to 77.3% in macrophages treated with PPCH, while the expression of CD206 was downregulated to 14.2%, and the PPC displayed only a slight effect on macrophage polarization. In addition, to further confirm the regulatory effect of the PPCH on TAMs subtype, the contents of cytokines relevant to M1 and M2 macrophages were determined using ELISA kits. As shown in Figure 3D and E, after incubation with PPCH for 2 h, the secretion of IL-12, the typical cytokine of M1 macrophages, increased significantly, while the concentration of IL-10, a typical cytokine secreted by M2 macrophages, notably decreased. Meanwhile, studies have shown that M1 macrophages can release reactive nitrogen and oxygen species, such as NO, H2O2 and superoxide. Therefore, the generation of H2O2 in the TME was evaluated by a hydrogen peroxide assay kit, and the data in Figure 3F indicate a significantly increased H2O2 concentration in the M1 and PPCH+M2 groups compared to the M2 and PPC+M2 groups. All of the above results indicate that PPCH can effectively polarize M2 macrophages to the M1 phenotype and produce H2O2, thus achieving endogenous H2O2 self-replenishment.
 |
Figure 3 (A) Confocal microscopy images of M2 macrophages incubated with PPCH. (B) Flow cytometry results of M2 macrophages treated with PPCH. (C) Flow cytometric results of the expression of CD86 (M1 macrophages) and CD206 (M2 macrophages) after treatment with different formulations. (D) Levels of IL-12 released by macrophages before and after regulation of the polarization of M2 macrophages toward M1 macrophages in the different groups. (E) Levels of IL-10 secreted by macrophages in the different treatment groups. (F) Quantitative determination of H2O2 production in the different groups. (G) Intracellular hypoxia imaging using [Ru(dpp)3]Cl2 as an indicator. (H) Flow cytometric and (I) CLSM images of intracellular ROS in 4T1 cells in the different groups. |
To evaluate the tumor cell killing cascade between Pt nanozymes and HA, the ability of PPCH to alleviate intracellular hypoxia was evaluated. Cells were treated with anaerobic bags to simulate the hypoxic environment of solid tumors. [Ru(dpp)3]Cl2, an indicator of intracellular O2 levels, was used to detect intracellular hypoxia, and its red fluorescence was enhanced with decreasing O2 levels. The results showed that there was no significant change in intracellular fluorescence after incubation with Pt-free PH and PH+M2 for 2 h (Figure 3G). Interestingly, compared with the control and Pt-free groups, the intracellular fluorescence decreased significantly in the groups treated with Pt, and the fluorescence intensity in the PPH+M2 group was lower than that in the PPH group. These findings indicated that PPH+M2 successfully induced the H2O2 cascade reaction, achieved endogenous H2O2 self-replenishment, and sustainably produced O2 in the presence of Pt nanozymes, alleviating intracellular hypoxia. Then, the ability of the PPCH to enhance ROS production was examined. Since ROS is required for killing tumor cells, the ROS levels were evaluated to assess the effect of SDT. Intracellular ROS was detected using 2.7-dichlorodihydrofluorescein diacetate (DCFH-DA). DCFH-DA itself is not fluorescent but can be hydrolyzed into DCFH via intracellular esterase. DCFH molecules can then be oxidized to DCF by ROS to emit green fluorescence, and its green fluorescence can be strengthened with the increase of ROS in cell. The results here show that there was almost no green fluorescence in the cells of the PPCH group without LIFU and in the control group with LIFU (Figure 3H), indicating that PPCH and LIFU were nontoxic to cells. As expected, the cells treated with different groups and irradiated with LIFU showed green fluorescence, and the bright green fluorescence in the PPCH+M2 group was significantly stronger than the fluorescence in the other groups (Figure 3I). This was because the sonosensitizer Ce6 can produce ROS under LIFU, and the PPCH+M2 group mimics the TME, with a high density of M2 macrophages. In the PPCH+M2 group containing HA, the M2 macrophages were remodeling into M1 macrophages to produce endogenous H2O2. Then, in the presence of Pt nanozymes, endogenous H2O2 was decomposed into O2. O2 produces 1O2 under the action of Ce6 and LIFU, which amplifies ROS levels. However, these effects were not observed in the HA-free and Pt-free groups. These data revealed that PPCH could effectively enhance the level of ROS generation in cells, which is extremely beneficial for enhancing the effect of SDT.
The cellular internalization and intracellular localization of the PPCH were important factors to ensure anti-tumor therapy of SDT. Studies43 have shown that HA targets CD44, and we therefore studied the internalization of the PPCH targeting 4T1 cells, which highly express CD44. The internalization of PPCH into 4T1 cells was investigated at different time points. The cellular uptake results determined by flow cytometry are shown in Figure S13. The flow cytometry results showed that the cell uptake efficiency in the PPC group was 29.7%, 54.2%, and 58.8% at 1 h, 2 h, and 3 h, respectively, while in the PPCH group, these values were 52.6%, 92.1%, and 95.8% at 1 h, 2 h, and 3 h, respectively. The in vitro targeting effect of the PPCH was proven by their efficient entry into 4T1 cells. Since the cells showed high uptake at 2 h, these data implied that SDT should be implemented at 2 h. Previous studies57,58 have shown that Ce6 targeted mitochondria, so we studied the intracellular localization of PPCH using CLSM. In this experiment, blue fluorescence corresponded to nuclei stained with DAPI, red fluorescence corresponded to Ce6, and green fluorescence corresponded to mitochondria stained with MitoTracker Green. Merged image clearly showed that the red fluorescence of the Ce6-labeled PPCH was highly coincident with the green fluorescence of the Mito-Tracker-labeled mitochondria, and the merged fluorescence tended to appear yellow (Figure 4A); notably, there was no overlap with the blue fluorescence of the DAPI-labeled nuclei. The overlay with the linear scan analysis results was consistent (Figure 4B). The quantitative results showed that the overlap coefficient of PPCH fluorescence was 0.69 ± 0.05. The Pearson’s colocalization coefficient (Rr) was also used to determine the colocalization of these two fluorescence signals, which gave a value of 0.60 ± 0.01 (Figure S14). These results indicated that the concentration of the PPCH was high in the mitochondria of 4T1 cells, suggesting that the PPCH were mainly located in the mitochondria of 4T1 cells. These results suggested that the mitochondria might be one of the main target organs of SDT injury and that they play an important role in SDT antitumor therapy. Therefore, PPCH targeting the mitochondria tended to promote the efficacy of SDT.
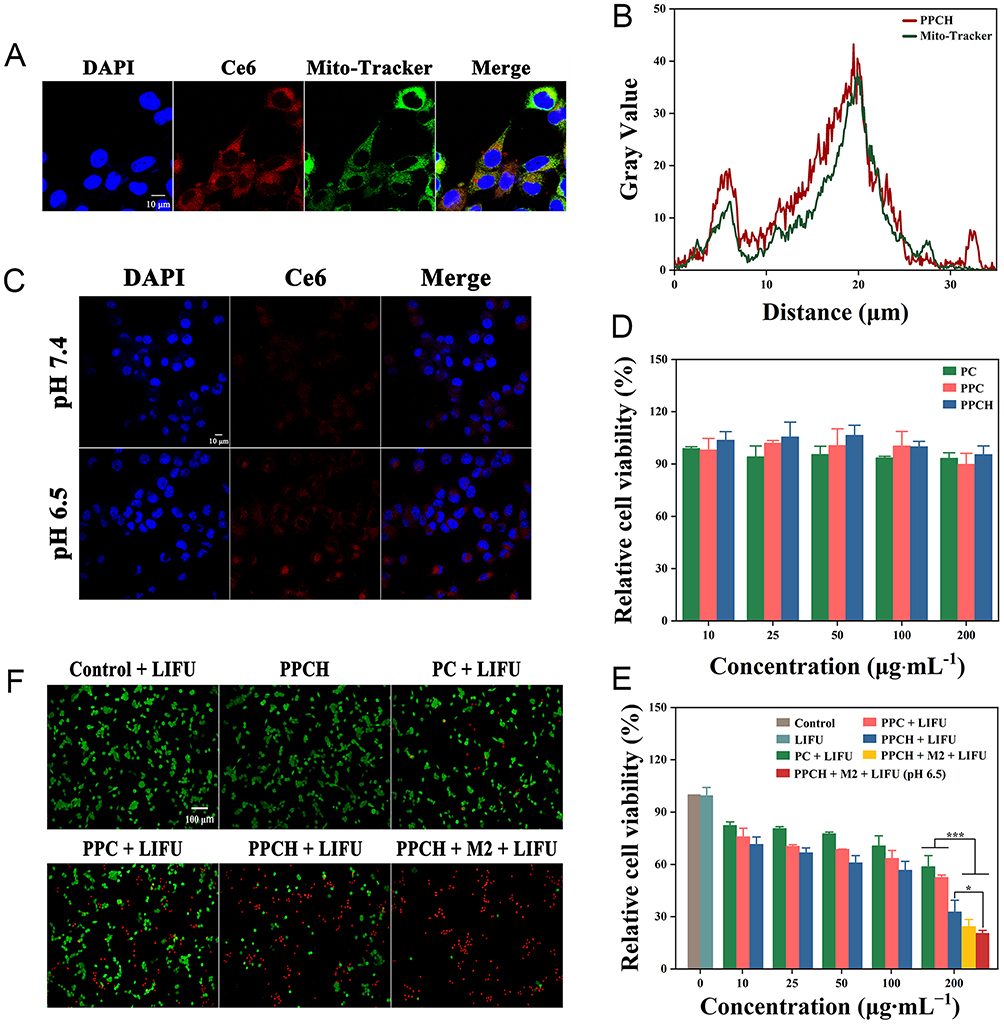 |
Figure 4 (A) CLSM image and (B) fluorescence intensity image of the subcellular localization of PPCH. (C) CLSM image of 4T1 cells after incubation with PPCH at different pH values (7.4 and 6.5) for 2 h. (D) Relative viability of 4T1 cells incubated with PPCH at different concentrations. (E) Relative viability of 4T1 cells treated with various treatments after LIFU. (F) Calcein-AM and PI stained fluorescence imaging of 4T1 cells subjected to various treatments after LIFU. |
As nanoplatform for pH-responsive decomposition, the release behavior of PPCH was also investigated under simulated acidic TME. As observed by CLSM imaging, the intracellular Ce6 red fluorescence after incubation in pH 6.5 medium was notably stronger than that of the fluorescence after incubation in neutral medium (Figure 4C). This was because the degradation of the PPCH in the acidic environment increased the release of Ce6. This confirmed that the PPCH could be used as an acidic TME response nanoplatform. Based on the above observations, the therapeutic efficiency of the PPCH was evaluated. First, the cytotoxicity of the PPCH was evaluated by CCK-8 assay. As displayed in Figure 4D and Figure S15, there was no obvious toxicity of the PPCH to 4T1 and HUVEC cells without LIFU irradiation, even at concentrations up to 200 μg·mL–1 (cell viability >90%). Next, the SDT effects of the PPCH were investigated after LIFU irradiation. The toxicity of each group to tumor cells increased evidently after LIFU irradiation, and the killing effect was positively correlated with the concentration of PPCH. Cell viability slightly decreased after exposure to LIFU alone, and the cell viability in the PPCH plus LIFU irradiation group was lower than that in the other groups, which could be attributed to the improved cellular internalization brought about by HA modification. Besides, to further evaluate the cytotoxic effect of PPCH on tumor cell with macrophages polarization, M2 macrophages were treated with PPCH to collect relevant condition medium, and the cytotoxicity of 4T1 cells was detected. Meanwhile, PPCH + M2 group exhibited the enhanced anti-tumor efficacy with LIFU irradiation. This phenomenon probably occurred because PPCH can induce M2 macrophage polarization into M1 macrophages and regulate the immunosuppressive microenvironment. At the same time, M1 macrophages can secrete the oxygen species H2O2, and Pt nanozymes further decompose H2O2 into O2, overcoming tumor hypoxia. O2 produces 1O2 under the action of Ce6 and LIFU, and ROS levels are amplified, improving the antitumor effect of SDT (Figure 4E). Calcein-AM (AM, green fluorescence) and propidium iodide (PI, red fluorescence) were further used to co-stain living and dead cells, respectively, to observe the effect of H2O2 cascade enhancement of SDT (Figure 4F). It was found that cells treated with LIFU only or PPCH without LIFU exhibited a large area of green fluorescence instead of red fluorescence, displaying their negligible cell killing effect. However, some of the cells in the PPCH + LIFU group exhibited apparently strong red fluorescence, and almost all of the cells in the PPCH + M2 + LIFU group showed stronger red fluorescence after SDT treatment (most of the cells in this group died). This result is consistent with the CCK-8 results. To further study the effect of pH on cell therapy, 4T1 cells were incubated with PPCH at pH 6.5 for 2 h. Compared with the cells treated with PPCH at pH 7.4, cell death after LIFU increased at pH 6.5 (Figure 4E) because the pH-responsive accelerated Ce6 release under slightly acidic conditions. Taken together, the findings indicate that PPCH not only reverses immunosuppression but also relieves hypoxia and increases ROS production, which fundamentally ensures the efficacy of SDT.
In vivo Biocompatibility of PPCH
Biosafety of nanoplatform was one of the necessary conditions for its application in vivo, so the biosafety of the PPCH was evaluated in vivo. Healthy female BALB/c mice were randomly divided into four groups (n = 5). The biosafety of the PPCH was analyzed in vivo assay at days 5, 15, and 30 post-injection of PPCH at a concentration of 5 mg∙mL−1, which was the therapeutic dose. At the end of the experiment, the blood biochemical indexes were determined, and the major organs were observed by HE staining. The results showed that the red blood cell (RBC), white blood cell (WBC), platelet (PLT), and hemoglobin (HGB) counts in the experimental mice were not evidently different from those in the control group of mice in the short term (5 and 15 d) and the long term (30 d) after PPCH injection (Figure 5A a-d), indicating that the PPCH had excellent hemocompatibility. Concomitantly, the damage caused by the PPCH to the liver and kidneys of mice was also evaluated. Alanine aminotransferase (ALT) and aspartate aminotransferase (AST) were used as markers of liver function, and blood urea nitrogen (BUN) and creatinine (CR) were used as indicators of kidney function. Compared with the control group, there were no significant differences in ALT, AST, BUN, or CR (Figure 5A e-h), indicating that the PPCH did not cause damage to the liver or kidneys. The HE staining results also revealed that the structures of the heart, liver, spleen, lungs, and kidneys were not obviously damaged, did not show pathological changes, and were similar to the control group (Figure 5B). To summarize, PPCH had excellent biocompatibility and could be used for in vivo experiments.
 |
Figure 5 (A) The changes of RBC, WBC, PLT, HGB, ALT, AST, BUN and CR and (B) HE staining sections of mice after injection of PPCH for 5, 15 and 30 d. |
In vivo Visual Imaging
Sonosensitizer Ce6 has been widely used in biofluorescence imaging and photoacoustic imaging due to its good near-infrared absorption. Next, the enrichment of PPCH in tumors and their distribution in various organs were further examined. To optimize the treatment time, PPCH was injected into mice through the tail vein, and then their enrichment in the tumor site was monitored by fluorescence imaging. The Ce6 fluorescence signal appeared at the tumor site after 1 h and peaked at 4 h post-injection (Figure 6A and B), indicating efficient tumor uptake of the PPCH. At 24 h post-injection, the ex vivo fluorescence images of the tumors and major organs were analyzed (Figure 6C and D). To further validate the tumor imaging performance of the PPCH, the PA signal intensity in the tumor sites was further assessed to explore the potential of effectively using PPCH as an in vivo PA contrast agent. After full-spectrum scanning, we found that the optimal wavelength of PA imaging of the PPCH was 680 nm (Figure S16). Meanwhile, the PA signals were linearly related to the PPCH concentration, indicating that the PA signals of PPCH have the characteristic of concentration-dependent enhancement (Figure S17). After i.v. injection of PPCH, the photoacoustic signal intensity in tumor sites increased over time and peaked at 4 h post injection (Figure 6E and F), displaying the ability of the PPCH to serve as an effective PA contrast agent to guide therapy via real-time bioimaging. All of the above results indicate that the PPCH exhibited notable dual-modal fluorescence (FL)/PA imaging capacities.
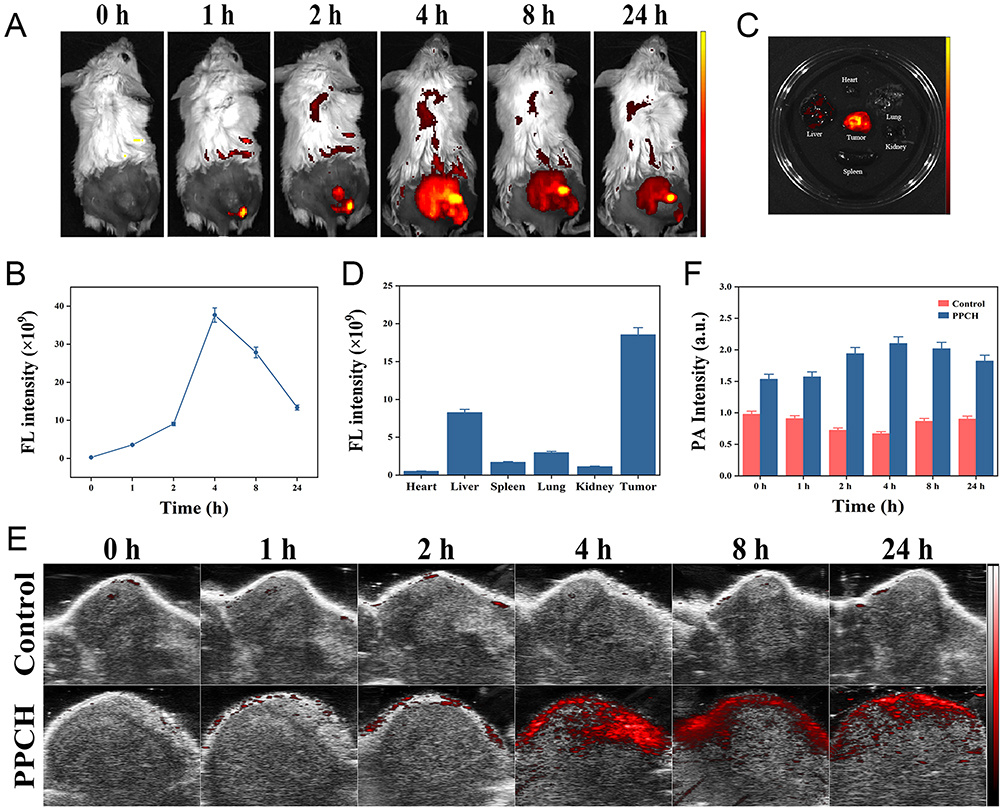 |
Figure 6 (A) FL images and (B) signal values of PPCH at different time points after i.v. injection of PPCH. (C) FL imaging and (D) quantitative analysis of the intensity of tumor and major organs 24 h after injection of PPCH. In vivo (E) PA images and (F) PA signal intensities of tumors in 4T1 tumor-bearing mice at different time points after i.v. injection of PPCH. |
In vivo Antitumor Therapy
Compared with normal tissue, tumor tissue contains a higher content of M2 macrophages, and PPCH can polarize M2 macrophages to become M1 macrophages to reverse immunosuppression, increase endogenous H2O2 content. After various treatments, the tumors were collected on day 3 and analyzed by immunofluorescent staining and flow cytometry. As revealed in Figure 7A, the red fluorescence intensity of the M1 macrophages in the PPCH and PPCH+LIFU groups were obviously higher than that in the other groups, while the green fluorescence intensity of the M2 macrophages in the PPCH and PPCH+LIFU groups significantly decreased. Moreover, the flow cytometry (Figure 7B) showed that the number of M1 macrophages was significantly increased after PPCH administration with LIFU irradiation (22.6%; higher than that in the PPCH group (17.2%)). This increase was due to the increase in HA release from the PPCH upon LIFU irradiation. Additionally, the PC and PPC groups with LIFU irradiation showed more M1 macrophages than the number of M1 macrophages in the control with LIFU irradiation groups (7.56% and 8.57% vs 6.62%) due to ROS generation accelerating the formation of M1 macrophages.59 The percentage of M2 macrophages significantly decreased after PPCH treatment, which is the opposite result that was obtained for M1 macrophages. All of the above results were consistent with the in vitro data and indicated that PPCH with HA could significantly transform M2 macrophages to M1 macrophages and reverse immunosuppression; these conclusions are similar to the results from previous studies.60 By reversing TAM polarization, endogenous H2O2 content is increased, which is expected to undergo decomposition via catalysis by the Pt nanozyme in the PPCH to increase the oxygen level in the TME.61
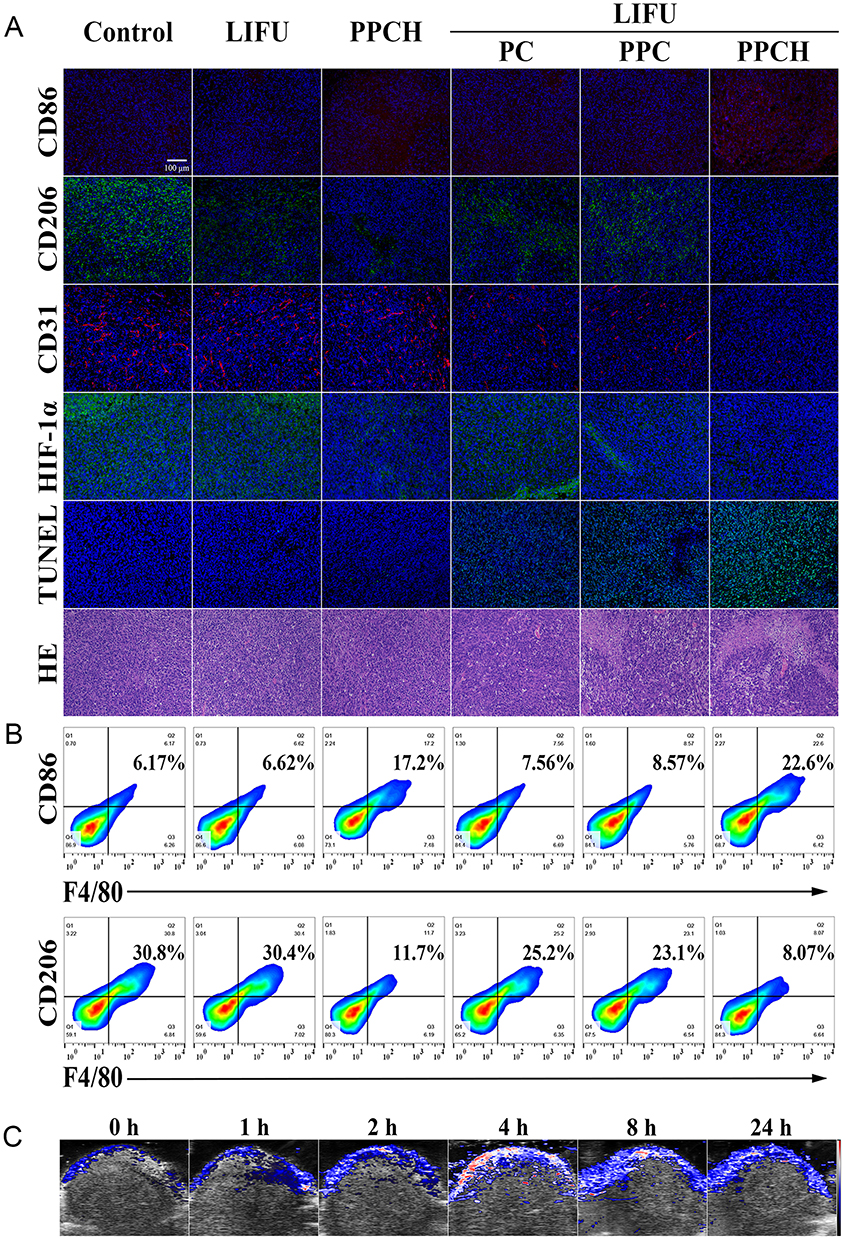 |
Figure 7 (A) CD86 (M1/red), CD206 (M2/green), CD31, HIF-1α, TUNEL and HE staining of tumors after various treatments. (B) Representative flow cytometry plots of M1/M2 macrophages in tumor tissues after various treatments. (C) Oxyhemoglobin level of tumors injected with PPCH before and after different times. |
To investigate the ability of PPCH to relieve tumor hypoxia, 4T1 tumor-bearing mice were intravenously injected with different PPCHs and irradiated by LIFU 4 h later. The tumors were stripped and stained with hypoxia-inducible factor (HIF-1α, green), platelet endothelial cell adhesion molecule-1 (CD31, red), and the nuclear marker DAPI (blue) for immunofluorescence imaging 24 h post-injection. The mice in the Pt-free groups showed bright green fluorescence at the tumor sites after LIFU, similar to the control group (Figure 7A). However, the green fluorescence of the tumors from mice treated with PPCH was distinctly reduced after LIFU. This is because PPCH can achieve endogenous H2O2 self-replenishment and a sustainable cascade, continuously transforming M2 macrophages into M1 macrophages, and the generated H2O2 is decomposed into O2, thus increasing the oxygen content in the TME. However, in the PPC+LIFU experimental group, due to the failure of H2O2 self-replenishment, the tumor site relied on only the H2O2 in the tumor area to produce a small amount of oxygen. Therefore, the PPCH could effectively alleviate hypoxia in the TME. To further verify that PPCH can relieve tumor hypoxia, PA imaging was used to detect oxygenated hemoglobin in the tumor tissue before and after PPCH injection. The hemogram showed that the color of the tumor area tended to be bright after PPCH injection 4 h, indicating an increase in the level of oxygenated hemoglobin (Figure 7C and S18). This result represents the increase in oxygen in the tumor area after PPCH injection.
Inspired by the aforementioned results, the in vivo therapeutic effect of PPCH on tumors was studied. The therapeutic benefits of in vivo were explored in a 4T1 subcutaneous xenograft BALB/c mice model (Figure 8A). 4T1 tumor-bearing mice were randomly divided into six groups (n = 5) and treated as follows: (I) control, (II) LIFU, (III) PPCH, (IV) PC + LIFU, (V) PPC + LIFU, and (VI) PPCH + LIFU. The mice’s body weights and tumor volumes were measured every 3 days during the experiment. The results showed that the changes in the body weights of the mice in each experimental group and the control group were similar over 18 d (Figure 8B), indicating that the PPCH and other treatments did not harm the mice. The tumor volume data showed that LIFU alone and PPCH administration without LIFU could not inhibit tumor growth. After LIFU irradiation (PC + LIFU and PPC + LIFU), tumor growth was pronouncedly inhibited, but remained relatively rapid (Figure 8C), indicating that the antitumor effect of SDT was limited under hypoxic conditions (Figure 8D). In the HA and Pt-assisted SDT group (PPCH + LIFU), the tumor growth rates were further reduced, and the inhibitory effects were more obvious than those in the other groups (p < 0.001). This result might be due to the following reasons. First, PPCH is a pH-responsive nanoparticle that can accumulate at tumor sites. In addition, PPCH increased the number of M1 macrophages through TAM reprogramming, reversed immunosuppression, and produced H2O2 at the same time, achieving endogenous H2O2 self-replenishment and a continuous cascade. Much O2 continued to be produced under the action of Pt nanozymes, alleviating TME hypoxia and further regulating the immunosuppressive microenvironment. O2 produced 1O2 under the action of Ce6 and LIFU, and ROS levels were amplified, improving the antitumor effect of SDT. Finally, since the subcellular localization of PPCH is in mitochondria, PPCH can directly damage mitochondria in tumor regions and further amplify the efficacy of SDT. For all of the above reasons, PPCH can fundamentally guarantee the efficacy of SDT. Further, HE staining for the major organs of surviving mice was performed. The results showed that the organs of mice were intact without pathological changes (Figure S19). Therefore, the above results demonstrated that PPCH + LIFU could effectively clear tumors, not only reshaping the TAM phenotype to achieve endogenous H2O2 self-supplementation and a sustainable cascade but also using the weakly acidic TME to promote PPCH release and achieve mitochondrial targeting in order to achieve enhanced therapeutic efficacy of SDT. TUNEL staining was further used to detect the damage to tumor in mice under different treatments. The results showed that there was no obvious damage to the tumors treated with LIFU alone and PPCH without LIFU, but a small number of apoptotic cells were observed in tumors treated with PC+LIFU and PPC + LIFU (Figure 7A). However, in the PPCH + LIFU group, many apoptotic cells were found, which was consistent with the results of HE staining. Collectively, these data demonstrate that endogenous H2O2 self-replenishment and sustainable cascades are efficient ROS amplifiers that can effectively improve the efficacy of anti-tumor SDT.
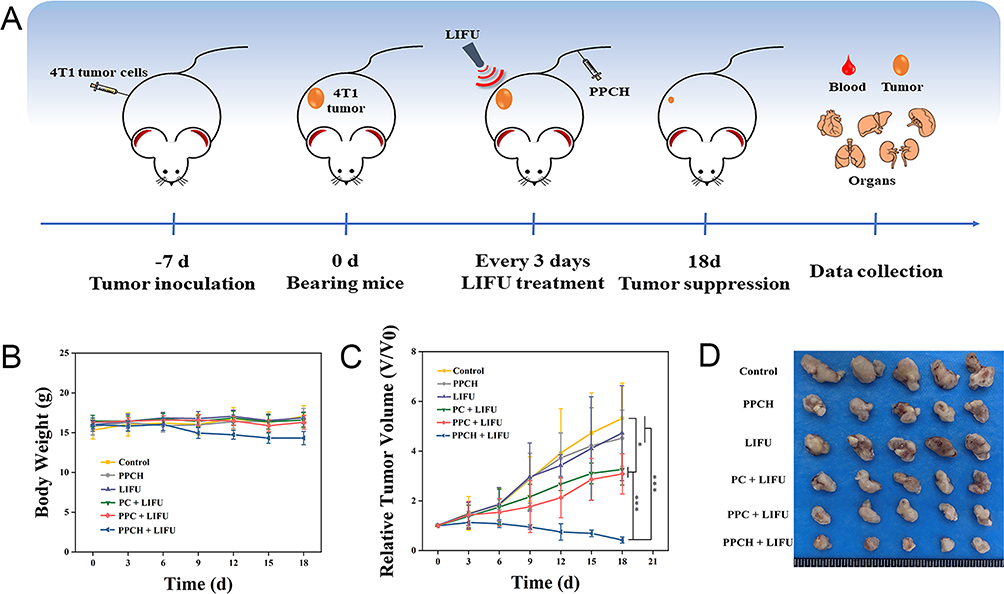 |
Figure 8 (A) Schematic illustration of the tumor treatment process in vivo. (B) Body weight changes in the different groups. (C) Tumor volume changes in the different groups. (D) Representative photos of tumor tissues dissected from mice after different treatments at day 18. Values of *p < 0.05 and ***p < 0.001. |
Conclusion
In this study, we developed a biomimetic cascade nanoplatform to optimize sonodynamic therapy by reversing immunosuppression and relieving hypoxia. This cascade nanoplatform not only reverses immunosuppression but also relieves hypoxia and increases ROS. The nanoplatform PPCH, with excellent pH-stimulus responsibility, mitochondrial targeting capacity, and biocompatibility, provided a possibility for further applications. Moreover, PPCH can be used for FL/PA dual-modal imaging to achieve precise tumor diagnosis. In summary, this study provides a novel and promising therapeutic strategy for improving SDT efficacy.
Animal Ethics Statement
Our animal experiments were done at Changchun Wish Detection Technology Service Co., Ltd. Ethical approval was provided by Changchun Wish Detection Technology Service Co., Ltd., and our laboratory animal welfare followed GB/T 35892-2018 Laboratory Animal – Guideline for ethical review of animal welfare, and the Guide for the Care and Use of Laboratory Animals: Eighth Edition. The company was chosen because Changchun Wish Detection Technology Service Co., Ltd. signed a cooperation agreement with the Bethune Medical Science Center of Jilin University to ensure the smooth conduct of our animal experiments, and our unit, the China–Japan Union Hospital of Jilin University, is affiliated to the Bethune Medical Science Center of Jilin University.
Acknowledgments
The authors thank the State Key Laboratory of Inorganic Synthesis and Preparative Chemistry, College of Chemistry, Jilin University. They also thank the Scientific Research Center of China–Japan Union Hospital of Jilin University for providing confocal laser scanning microscope and the Key Laboratory of Pathobiology of the Ministry of Education of Jilin University for providing imaging of live animals. This work was supported by the Department of Science and Technology of Jilin Province (grant number YDZJ202301ZYTS097).
Disclosure
The authors report no conflicts of interest in this work.
References
1. Tang Z, Liu Y, He M, Bu W. Chemodynamic Therapy: tumour Microenvironment-Mediated Fenton and Fenton-like Reactions. Angewandte Chem Int Edition. 2019;131:958–968. doi:10.1002/anie.201805664
2. Yang X, Yang Y, Gao F, Wei -J-J, Qian C-G, Sun M-J. Biomimetic hybrid nanozymes with self-supplied H+ and accelerated O2 generation for enhanced starvation and photodynamic therapy against hypoxic tumors. Nano Lett. 2019;19:4334–4342. doi:10.1021/acs.nanolett.9b00934
3. Fu J, Li T, Zhu Y, Hao Y. Ultrasound‐activated oxygen and ROS generation nanosystem systematically modulates tumor microenvironment and sensitizes sonodynamic therapy for hypoxic solid tumors. Adv Funct Mater. 2019;29:1906195. doi:10.1002/adfm.201906195
4. Gong F, Cheng L, Yang N. Preparation of TiH 1.924 nanodots by liquid-phase exfoliation for enhanced sonodynamic cancer therapy. Nat Commun. 2020;11:3712. doi:10.1038/s41467-020-17485-x
5. Zhang Y, Zhang X, Yang H, et al. Advanced biotechnology-assisted precise sonodynamic therapy. Chem Soc Rev. 2021;50:11227–11248. doi:10.1039/d1cs00403d
6. Xiao Z, Chen Q, Yang Y, et al. State of the art advancements in sonodynamic therapy (SDT): metal-Organic frameworks for SDT [J]. Chem Eng J. 2022;449:137889. doi:10.1016/j.cej.2022.137889
7. Liang S, Deng X, Ma P, Cheng Z, Lin J. Recent advances in nanomaterial-assisted combinational sonodynamic cancer therapy. Adv Mater. 2020;32:2003214. doi:10.1002/adma.202003214
8. Son S, Kim JH, Wang X, et al. Multifunctional sonosensitizers in sonodynamic cancer therapy. Chem Soc Rev. 2020;49:3244–3261. doi:10.1039/c9cs00648f
9. An J, Hu YG, Cheng K, et al. ROS-augmented and tumor-microenvironment responsive biodegradable nanoplatform for enhancing chemo-sonodynamic therapy. Biomaterials. 2020;119761. doi:10.1016/j.biomaterials.2020.119761
10. Zhang C, Chen WH, Liu LH, Qiu WX, Yu WY, Zhang XZ. An O2 self-supplementing and reactive-oxygen-species-circulating amplified nanoplatform via H2O/H2O2 splitting for tumor imaging and photodynamic therapy. Adv Funct Mater. 2017;27:1700626. doi:10.1002/adfm.201700626
11. Liu LH, Zhang YH, et al. Dual-stage light amplified photodynamic therapy against hypoxic tumor based on an O2 self-sufficient nanoplatform. Small. 2017;13:1701621. doi:10.1002/smll.201701621
12. Yang G, Xu L, Chao Y, et al. Hollow MnO2 as a tumor-microenvironment-responsive biodegradable nano-platform for combination therapy favoring antitumor immune responses. Nat Commun. 2017;8:902. doi:10.1038/s41467-017-01050-0
13. Yang Y, Huang J, Liu M, et al. Emerging Sonodynamic Therapy-Based Nanomedicines for Cancer Immunotherapy. Adv Sci. 2023;10:2204365. doi:10.1002/advs.202204365
14. Du JR, Wang Y, Yue ZH, et al. Recent advances in sonodynamic immunotherapy. J Cancer Res Clin Oncol. 2023;149(4):1645–1656. doi:10.1007/s00432-022-04190-z
15. Wang J, Sun J, Hu W, et al. A porous Au@Rh bimetallic core-shell nanostructure as an H2O2-driven oxygenerator to alleviate tumor hypoxia for simultaneous bimodal imaging and enhanced photodynamic therapy. Adv Mater. 2020;32:2001862. doi:10.1002/adma.202001862
16. Pan M, Jiang Q, Sun J, et al. Programming DNA nanoassembly for enhanced photodynamic therapy. Angew Chem. 2020;59:1897. doi:10.1002/anie.201912574
17. Xu S, Zhu X, Zhang C, Huang W, Zhou Y, Yan D. Oxygen and Pt (II) self-generating conjugate for synergistic photo-chemo therapy of hypoxic tumor. Nat Commun. 2018;9:2053. doi:10.1038/s41467-018-04318-1
18. QWu G. MnO2-laden black phosphorus for MRI-guided synergistic PTT/PDT/chemotherapy. Matter. 2019;1:496. doi:10.1016/j.matt.2019.03.007
19. Li X, Kwon N, Guo T, Liu Z, Yoon J. Innovative strategies for hypoxic-tumor photodynamic therapy. Angew Chem. 2018;57:11522. doi:10.1016/j.ajps.2023.100775
20. Chu C, Lin H, Liu H, et al. Tumor Microenvironment-Triggered Supramolecular System as an In Situ Nanotheranostic Generator for Cancer Phototherapy. Adv Mater. 2017;29:1605928. doi:10.1002/adma.201605928
21. Chen Y, Ye D, Wu M, et al. Break-up of two-dimensional MnO2 nanosheets promotes ultrasensitive pH-triggered theranostics of cancer. Adv Mater. 2014;26:7019–7026. doi:10.1002/adma.201402572
22. Chen Z, Guo W, Wu Q, et al. Tumor reoxygenation for enhanced combination of radiation therapy and microwave thermal therapy using oxygen generation in situ by CuO nanosuperparticles under microwave irradiation. Theranostics. 2020;10:4659–4675. doi:10.7150/thno.42818
23. Li G, Wang S, Deng D, et al. Fluorinated Chitosan To Enhance Transmucosal Delivery of Sonosensitizer-Conjugated Catalase for Sonodynamic Bladder Cancer Treatment Post-intravesical Instillation. ACS Nano. 2020;14:1586–1599. doi:10.1021/acsnano.9b06689
24. Zhang Y, Zhao J, Zhang L, et al. A cascade nanoreactor for enhancing sonodynamic therapy on colorectal cancer via synergistic ROS augment and autophagy blockage. Nano Today. 2023;49:101798. doi:10.1016/j.nantod.2023.101798
25. Cao C, Zou H, Yang N, et al. Fe3O4/Ag/Bi2MoO6 Photoactivatable Nanozyme for Self-Replenishing and Sustainable Cascaded Nanocatalytic Cancer Therapy. Adv Mater. 2021;33:2106996. doi:10.1002/adma.202106996
26. Zhu P, Chen Y, Shi J. Nanoenzyme-Augmented Cancer Sonodynamic Therapy by Catalytic Tumor Oxygenation. ACS Nano. 2018;12:3780–3795. doi:10.1021/acsnano.8b00999
27. Liu Y, Cheng Y, Zhang H, et al. Integrated cascade nanozyme catalyzes in vivo ROS scavenging for anti-inflammatory therapy. Sci Adv. 2020;6:eabb2695. doi:10.1126/sciadv.abb2695
28. Cheng Y, Kong X, Chang Y, et al. spatiotemporally synchronous oxygen self-supply and reactive oxygen species production on Z-scheme heterostructures for hypoxic tumor therapy. Adv Mater. 2020;32:1908109. doi:10.1002/adma.201908109
29. LPZhao RR. Self-delivery nanomedicine for O2-economized photodynamic tumor therapy [J]. Nano Lett. 2020;20:2062–2071. doi:10.1021/acs.nanolett.0c00047
30. Wang D, Wu H, Lim WQ, et al. A mesoporous nanoenzyme derived from metal organic frameworks with endogenous oxygen generation to alleviate tumor hypoxia for significantly enhanced photodynamic therapy. Adv Mater. 2019;31:1901893. doi:10.1002/adma.201901893
31. Jochems C, Schlom J. Tumor-infiltrating immune cells and prognosis: the potential link between conventional cancer therapy and immunity. Exp Biol Med (Maywood). 2011;236:567–579. doi:10.1258/ebm.2011.011007
32. Zhang Z, Li B, Xie L, et al. Metal-Phenolic Network-Enabled Lactic Acid Consumption Reverses Immunosuppressive Tumor Microenvironment for Sonodynamic Therapy. ACS nano. 2021;16934–16945. doi:10.1021/acsnano.1c08026
33. Cao Y, Qiao B, Chen Q, et al. Tumor microenvironment remodeling via targeted depletion of M2-like tumor-associated macrophages for cancer immunotherapy. Acta Biomaterialia. 2023;160:239–251. doi:10.1016/j.actbio.2023.02.006
34. Chen Q, Xu L, Chen J, et al. Tumor vasculature normalization by orally fed erlotinib to modulate the tumor microenvironment for enhanced cancer nanomedicine and immunotherapy. Biomaterials. 2017;148:69–80. doi:10.1016/j.biomaterials.2017.09.021
35. Peng J, Xiao Y, Li W, et al. Photosensitizer Micelles Together with IDO Inhibitor Enhance Cancer Photothermal Therapy and Immunotherapy. Adv Sci. 2018;5:1700891. doi:10.1002/advs.201700891
36. Zhong X, Chen B, Yang Z. The role of tumor-associated macrophages in colorectal carcinoma progression. Cell Physiol Biochem. 2018;45:356–365. doi:10.1159/000486816
37. Pittet MJ, Nahrendorf M, Swirski FK. The journey from stem cell to macrophage. Ann N Y Acad Sci. 2014;1319:1–18. doi:10.1111/nyas.12393
38. Jeong SK, Kim JS, Lee CG, et al. Tumor associated macrophages provide the survival resistance of tumor cells to hypoxic microenvironmental condition through IL-6 receptor-mediated signals. Immunobiology. 2017;222:55–65. doi:10.1016/j.imbio.2015.11.010
39. Trac NT, Chung EJ. Peptide-based targeting of immunosuppressive cells in cancer. Bioact Mater. 2020;5:92–101. doi:10.1016/j.bioactmat.2020.01.006
40. Gupta V, Yull F, Khabele D. Bipolar tumor-associated macrophages in ovarian cancer as targets for therapy. Cancers. 2018;10:366. doi:10.3390/cancers10100366
41. Lewis CE, Pollard JW. Distinct role of macrophages in different tumor microenvironments. Canc Res. 2006;66:605–612. doi:10.1158/0008-5472.CAN-05-4005
42. El-Dakdouki MH, Zhu DC, El-Boubbou K. Huang, Development of multifunctional hyaluronan-coated nanoparticles for imaging and drug delivery to cancer cells. Biomacromolecules. 2012;13:1144–1151. doi:10.1021/bm300046h
43. Toole BP. Hyaluronan-CD44 interactions in cancer: paradoxes and possibilities. Clin Canc Res. 2009;15:7462–7468. doi:10.1158/1078-0432.CCR-09-0479
44. Rayahin JE, Buhrman JS, Zhang Y, Koh TJ, Gemeinhart RA. High and low molecular weight hyaluronic acid differentially influence macrophage activation. ACS Biomater Sci Eng. 2015;1:481–493. doi:10.1021/acsbiomaterials.5b00181
45. Wang T, Niu K, Ni S, Zhang W, Liu Z, Zhang X. Hyaluronic Acid-Modified Gold-Polydopamine Complex Nanomedicine for Tumor-Targeting Drug Delivery and Chemo-Photothermal-Therapy Synergistic Therapy. ACS Sustain Chem Eng. 2022;10:1585–1594. doi:10.1021/acssuschemeng.1c07231
46. Li G, Li J, Zhou Z, et al. Silica-polydopamine core-shell self-confined templates for ultra-stable hollow Pt anchored N-doped carbon electrocatalysts. Dalton Trans. 2017;46:16419–16425. doi:10.1039/c7dt03021e
47. Mura S, Nicolas J, Couvreur P. Stimuli-responsive nanocarriers for drug delivery. Nat Mater. 2013;12:991–1003. doi:10.1038/nmat3776
48. Li Q, Yang M, Sun X, et al. NIR responsive nanoenzymes via photothermal ablation and hypoxia reversal to potentiate the STING-dependent innate antitumor immunity. Materials Today Bio. 2023;19:100566. doi:10.1016/j.mtbio.2023.100566
49. Qi C, Fu LH, Xu H, Wang TF, Lin J, Huang P. Melanin/polydopamine-based nanomaterials for biomedical applications. Sci China Chem. 2019;62:162–188. doi:10.1007/s11426-018-9392-6
50. Bernsmann F, Ball V, Addiego F, et al. Dopamine-melanin film deposition depends on the used oxidant and buffer solution. Langmuir. 2011;27:2819–2825. doi:10.1021/la104981s
51. Dong Z, Feng LZ, Hao Y, et al. Synthesis of hollow biomineralized CaCO3−Polydopamine nanoparticles for multimodal imaging-guided cancer photodynamic therapy with reduced skin photosensitivity. J Am Chem Soc. 2018;140:2165–2178. doi:10.1021/jacs.7b11036
52. Cheng W, Ling C, Xu L, et al. TPGS-functionalized polydopamine-modified mesoporous silica as drug nanocarriers for enhanced lung cancer chemotherapy against multidrug resistance. Small. 2017;13:1700623. doi:10.1002/smll.201700623
53. Ding L, Zhu X, Wang Y, et al. Intracellular fate of nanoparticles with polydopamine surface engineering and a novel strategy for exocytosis-inhibiting, lysosome impairment-based cancer therapy. Nano Lett. 2017;17:6790–6801. doi:10.1021/acs.nanolett.7b03021
54. Miller T, Breyer S, Colen G, et al. Premature drug release of polymeric micelles and its effects on tumor targeting. Int J Pharm. 2013;445:117–124. doi:10.1016/j.ijpharm.2013.01.059
55. Wang H, Morales RTT, Cui X, et al. A Photoresponsive Hyaluronan Hydrogel Nanocomposite for Dynamic Macrophage Immunomodulation. Adv Healthc Mater. 2019;8:e1801234. doi:10.1002/adhm.201801234
56. Rosa JMR. The CD44-Mediated Uptake of Hyaluronic Acid-Based Carriers in Macrophages. Adv Healthc Mater. 2017;6. doi:10.1002/adhm.201601012
57. Xu J, Xia X, Leung AW, et al. Sonodynamic action of pyropheophorbide-a methyl ester induces mitochondrial damage in liver cancer cells. Ultrasonics. 2011;51(4):480–484. doi:10.1016/j.ultras.2010.11.014
58. Li Q, Wang X, Wang P, et al. Efficacy of Chlorin e6 mediated Sono-Photodynamic therapy on 4T1 cells. Cancer Biother Radiopharm. 2014;29:42–52. doi:10.1089/cbr.2013.1526
59. Zhang Q, Bao C, Cai X, et al. Sonodynamic therapy‐assisted immunotherapy: a novel modality for cancer treatment. Cancer Sci. 2018;109:1330–1345. doi:10.1111/cas.13578
60. Ji C, Si J, Xu Y, et al. Mitochondria-targeted and ultrasound-responsive nanoparticles for oxygen and nitric oxide codelivery to reverse immunosuppression and enhance sonodynamic therapy for immune activation. Theranostics. 2021;11:8587–8604. doi:10.7150/thno.62572
61. He D, Hai L. Glutathione-activatable and O2/Mn2+-evolving nanocomposite for highly efficient and selective photodynamic and gene-silencing dual therapy. Adv Funct Mater. 2017;27:1704089. doi:10.1002/adfm.201704089
 © 2023 The Author(s). This work is published and licensed by Dove Medical Press Limited. The
full terms of this license are available at https://www.dovepress.com/terms
and incorporate the Creative Commons Attribution
- Non Commercial (unported, 3.0) License.
By accessing the work you hereby accept the Terms. Non-commercial uses of the work are permitted
without any further permission from Dove Medical Press Limited, provided the work is properly
attributed. For permission for commercial use of this work, please see paragraphs 4.2 and 5 of our Terms.
© 2023 The Author(s). This work is published and licensed by Dove Medical Press Limited. The
full terms of this license are available at https://www.dovepress.com/terms
and incorporate the Creative Commons Attribution
- Non Commercial (unported, 3.0) License.
By accessing the work you hereby accept the Terms. Non-commercial uses of the work are permitted
without any further permission from Dove Medical Press Limited, provided the work is properly
attributed. For permission for commercial use of this work, please see paragraphs 4.2 and 5 of our Terms.