Back to Archived Journals » Advances and Applications in Bioinformatics and Chemistry » Volume 17
Elucidation of Molecular Interactions Between Drug–Polymer in Amorphous Solid Dispersion by a Computational Approach Using Molecular Dynamics Simulations
Authors Aulifa DL ![]() , Al Shofwan AA, Megantara S
, Al Shofwan AA, Megantara S ![]() , Fakih TM
, Fakih TM ![]() , Budiman A
, Budiman A
Received 22 September 2023
Accepted for publication 16 January 2024
Published 23 January 2024 Volume 2024:17 Pages 1—19
DOI https://doi.org/10.2147/AABC.S441628
Checked for plagiarism Yes
Review by Single anonymous peer review
Peer reviewer comments 2
Editor who approved publication: Dr Maria Miteva
Diah Lia Aulifa,1 Adnan Aly Al Shofwan,2 Sandra Megantara,1 Taufik Muhammad Fakih,3 Arif Budiman2
1Department of Pharmaceutical Analysis and Medicinal Chemistry, Faculty of Pharmacy, Universitas Padjadjaran, Sumedang, Indonesia; 2Department of Pharmaceutics and Pharmaceutical Technology, Faculty of Pharmacy, Universitas Padjadjaran, Sumedang, Indonesia; 3Department of Pharmacy, Faculty of Mathematics and Natural Sciences, Universitas Islam Bandung, Bandung, Indonesia
Correspondence: Diah Lia Aulifa, Department of Pharmaceutical Analysis and Medicinal Chemistry, Faculty of Pharmacy, Universitas Padjadjaran, Jl. Raya Bandung-Sumedang Km. 21, Sumedang, 45363, Indonesia, Email [email protected]
Introduction: Amorphous drug dispersion is frequently used to enhance the solubility and dissolution of poorly water-soluble drugs, thereby improving their oral bioavailability. The dispersion of these drugs into polymer matrix can inhibit their recrystallization. The inter-molecular interactions between drug and polymer plays a role in the improvement of the dissolution rate, solubility, and physical stability of drug.
Aim: This study aims to investigate the formation and interactions of ritonavir (RTV)/poloxamer (PLX) amorphous formulation using a computational approach via molecular dynamics (MD) simulations, which mimicked solvent evaporation and melt-quenching method.
Methods: TheRoot Mean Square Deviation (RMSD) value, Root Mean Square Fluctuation (RMSF), Radial Distribution Function (RDF), Radius of Gyration (Rg), Solvent Accessible Surface Area (SASA), and hydrogen bond interactions were analyzed to determine interaction mechanisms between RTV and PLX in amorphous solid dispersion.
Results: The pi-alkyl bonds between RTV and PLX were formed after simulations of solvent evaporation, while the hydrogen bond interactions of RTV-PLX was observed during melt method simulations. These results indicate the successful formulation of amorphous solid dispersion (ASD) from RTV and PLX. The RMSD values obtained from the solvent evaporation, melt-cooling-A, melt-cooling-B, and melt-cooling-C methods were 3.33 Å, 1.97 Å, 1.30 Å, and 1.29 Å, respectively, while the average RMSF values were 2.65 Å, 1.04 Å, 1.05 Å, and 1.07 Å, respectively. This indicates that the suppression of translational motion of RTV from the melt method can be stronger than solvent evaporation caused by the intermolecular interactions of RTV-PLX.
Conclusion: MD simulations helped in understanding the formation and interaction mechanisms of ASD formulations that were difficult to detect by experimental approaches.
Keywords: amorphous solid dispersion, molecular interaction, molecular dynamics simulations, ritonavir, poloxamer
Introduction
Approximately 70–90% of new drug candidates are poorly water-soluble, resulting in insufficient bioavailability when administered orally.1–3 To overcome this problem, drug amorphization has emerged as a promising strategy for improving drug solubility due to its higher free energy compared to crystalline counterparts.4–6 This shows that drug in amorphous state can generate supersaturated solutions in water,7,8 leading to the improvement of oral bioavailability.9 However, crystallization of amorphous drug formulation commonly occurs during storage and dissolution due to its thermodynamic instability.10
Amorphous solid dispersion (ASD) is one of the promising strategies to stabilize amorphous drug by dispersing it into polymer matrix. Therefore, ASD has been widely used by the pharmaceutical industry to enhance the oral bioavailability of poorly soluble drugs.11 Intermolecular interactions between drugs and polymers play a critical role in the stabilization of amorphous drug in ASD, thereby reducing molecular mobility.12 A suitable polymer can also contribute to the stabilization of amorphous drug during storage and maintenance of its supersaturated solution.6,13 This shows the need to understand molecular interactions between drugs and polymers in ASD as a prerequisite for predicting the miscibility of drug–carriers that contribute to the stabilization of amorphous drug.
Currently, computational simulations such as molecular dynamics (MD) have been widely used in pharmaceutical formulation studies. MD simulations provide detailed atomic-level structural information that is often challenging to obtain experimentally but can be used to predict the miscibility of drug–excipient. In ASD systems, MD simulations are important tools to investigate drug–polymer interactions patterns, drug-polymer miscibility, and the formation of ASD.14,15 By using these simulations, a model of drug–excipient glasses and an understanding of their solubility/miscibility properties can be developed.16–18 Although previous studies have reported the use of MD simulations to predict the miscibility of drugs with certain pharmaceutical carriers,15,19 the underlying molecular interactions between drugs and polymers in ASD systems, which mimicked solvent evaporation and melt-quenching methods, have not been investigated. Therefore, the comparison study of drug–polymer interactions in ASD system using MD simulations from both methods is important as a guideline for further experimental laboratory study.
This study aims to investigate the formation of ASD system and interactions of ritonavir (RTV) – poloxamer (PLX) in ASD formulation using a computational approach via MD simulations, which mimicked the solvent evaporation and the melt-quenching method. RTV was used as a model of the poorly water-soluble drug due to its low recrystallization tendency, categorized as class III according to Taylor’s classification.20 A previous study reported that amorphous RTV can be formed by solvent-evaporation and melt-cooling methods.21,22 This makes it necessary to evaluate the comparison of RTV–polymer interactions in ASD system via MD simulations. This approach mimicked solvent evaporation and melt-quenching method to determine the potential of polymers in enhancing the pharmaceutical properties of amorphous drugs.
Materials and Methods
RTV and PLX Structure Preparation
The description and optimization of ligand structures were carried out before being used in MD processes. In this study, molecular structures used included RTV and PLX, downloaded from PubChem (http://pubchem.ncbi.nlm.nih.gov) (Figure 1). Subsequently, two-dimensional (2D) structures were described using the ChemDraw Professional 16.0 program and three-dimensional (3D) structures were obtained by converting 2D structures into 3D using the Chem3D 16.0 program. The ligand structure was optimized with GaussView 5.0.8 and Gaussian 09 using the Density Functional Theory (DFT) method with 6–31 basis sets. The optimized structure was added to polar hydrogen atoms and Gasteiger partial charge data with the AutoDock 4.2 program with MGLTools 1.5.6.
 |
Figure 1 (a) The Structure of Ritonavir (RTV); (b) The Structure of Poloxamer (PLX). |
Preparation of Melt-Cooling Systems
In the melt-cooling method, the system was made without using the addition of solvents. In this study, the melt-cooling system was built using 1 molecule of RTV and 25 molecules of PLX, formed by six-coordinate points with simulations box size of 5 Å × 4 Å × 4 Å and a tolerance distance of 2 Å between molecules. The system was created using the PACKMOL (Initial Configurations for MD Simulations by packing optimization) program.
Preparation of Solvent-Evaporation Systems
The solvent-evaporation method involves the addition of ethanol solvent in the system construction. In this study, a solvent-evaporation system was constructed using 1 molecule of RTV, 25 molecules of PLX, and 1440 molecules of ethanol, formed by six-coordinate points with a simulated box size of 5 nm × 4 nm × 4 nm and a tolerance distance of 0.2 nm between molecules. The solvent-evaporation system was created using the PACKMOL (Initial configuration for MD Simulations with packing optimization) pro-gram. The constructed ethanol solvent system is equilibrated for a 2fs time step before adding RTV and PLX.
Molecular Dynamics Simulation of Melt-Cooling Systems
MD simulations were carried out on three melt-cooling system complexes that had been formed. These systems were characterized by different cooling rates, namely 1°C/ns (Melt-Cooling-A), 20.5°C/ns (Melt-Cooling-B), and 40°C/ns (Melt-Cooling-C) using the Gromacs 2016.3 program with AMBER99SB-ILDN and AMBER (GAFF) common force fields. Topology and molecular parameterization of RTV and PLX were created using the Antechamber Python Parser interface (ACPYPE) program. Subsequently, long-distance electrostatic forces were determined using the Ewald Particle Mesh method. System neutralization was carried out by adding sodium (Na+) and chloride (Cl−) ions. The preparation stage for MD simulations includes minimization, temperature equilibrium, and pressure equilibrium. Berendsen thermostats and barostats are used during the heating stage, with the pressure being maintained at 1 bar. In this simulation, a large canonical ensemble is used to model molecular systems. The large canonical ensemble maintains constant particle count (N), volume (V), and temperature (T) throughout the simulation to investigate molecular motion and thermodynamic properties. The process was continued with simulations process (production run) with a 2 fs timestep. The production run process included setting the temperature from 0°C to 140°C with a heating rate of 30°C/ns and maintained at a temperature of 140°C. The system was cooled down to a temperature of 0°C with a variation of the cooling rate of 1°C/ns, 20.5°C/ns, and 40°C/ns. Simulations for 500 ns were carried out on all systems until they reached a stable state based on analysis of energy, pressure, temperature, and Root Mean Square Deviation (RMSD).
Molecular Dynamics Simulation of Solvent-Evaporation Systems
MD simulations were carried out on complex solvent-evaporation systems that had been formed using the Gromacs 2016.3 program with AMBER99SB-ILDN and AMBER (GAFF) general force fields. The topology and molecular parameterization of RTV and PLX were created using the AnteChamber Python Parser interface (ACPYPE) program. Long-distance electrostatic forces were determined using the Ewald Particle Mesh method. System neutralization was carried out by adding sodium (Na+) and chloride (Cl−) ions. Berendsen thermostats and barostats are used during the heating stage, with the pressure being maintained at 1 bar. In this simulation, a large canonical ensemble is used to model molecular systems. The large canonical ensemble maintains constant particle count (N), volume (V), and temperature (T) throughout the simulation to investigate molecular motion and thermodynamic properties. The preparation stage for MD simulations included minimization, temperature equilibrium, and pressure equilibrium, which was continued with simulations process (production run) with a 2 fs timestep. The production run process included setting the temperature from 0°C to 80°C with a heating rate of 20°C/ns and maintained at 80°C. Subsequently, the system was cooled down to a temperature of 20°C with a variation of cooling rate of 10°C/ns. Simulations for 500 ns were carried out on all systems until they reached a stable state based on analysis of energy, pressure, temperature, and the RMSD.
Analysis of Molecular Dynamics Simulation Results
The root-mean-square deviation (RMSD), root-mean-square fluctuation (RMSF), radial distribution function (RDF), radius of gyration (Rg), solvent-accessible surface area (SASA), and number of hydrogen bonds were calculated and analyzed for the complexes. These calculations were performed using Gromacs 2016.3 modules. RMSD is defined by
where N is the number of atoms, mi is the mass of atom i, t0 is the start time of the simulation, t is time, and ri is the position of atom i. This calculation was performed after fitting was done using the least-squares method. RMSF is defined by
where t is time, T0 is the reference time for the calculation, T is time at the end, ri is position of atom i, and [ri]t is position averaged over time of atom i. The relationship between RMSF and B-factor Bi is
where RMSFi is the RMSF of atom i. RDF is defined by
where r is the distance between a pair of particles, p(r) is the average number of atom pairs found at a distance between r and r +dr, V is the total volume of the system, and N pairs is the number of unique pairs of atoms. Rg is defined by
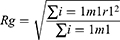
where mi is the mass of atom i, and ri is the position of atom i. SASA is defined by

The SASA of each atom in an RTV and PLX configuration is its maximum surface area (shieldedj1) subtracting the patches shielded by close neighbor atoms (shieldedj2).
In the context of polymers, the term SASAi refers to the solvent-accessible surface area of an atom, which corresponds to the surface area of an isolated sphere centered on that atom. Due to the presence of covalent bonds in all atoms within polymers, it ensures that atoms are never fully exposed to the solvent (Figure 2).23 Hydrogen bond formation was assessed based on measurements of the distance and angle between the donor atom, acceptor atom, and hydrogen atom. Hydrogen bonds are considered to exist if two conditions are satisfied (Supplementary Figure 1).24 Firstly, the distance between the donor and acceptor atoms was less than 0.30 nm. Secondly, the angle ø formed by the hydrogen, donor, and acceptor atoms was less than 30 degrees.
 |
Figure 2 Conditions for Calculating Solvent-Accessible Surface Area (SASA). Reprinted (adapted) with permission from Huang H, Simmerling C. Fast Pairwise Approximation of Solvent Accessible Surface Area for Implicit Solvent Simulations of Proteins on CPUs and GPUs. J Chem Theory Comput. 2018;14(11):5797–5814.23 Copyright 2023 American Chemical Society. |
Results
According to a previous study, RTV crystal showed a melting peak at 122°C, while amorphous RTV prepared by solvent evaporation and melt method showed a glass transition event at 47°C and 47.40°C, respectively. After heating, the melting peak of RTV was not observed, indicating that amorphous state can be formed by solvent evaporation and melt method.22 Based on Taylor’s classification, RTV was categorized in class III, which had a stable amorphous form.20,25 Therefore, the preparation of RTV and polymer using solvent evaporation and melt method can form RTV in amorphous state.
Molecular Simulating Motions of RTV and PLX
Molecular motions of each Melt-Cooling-A, Melt-Cooling-B, and Melt-Cooling-C complex system were analyzed using the paths as shown in Figure 3. The trajectories were extracted at the start of the simulations at 0 ns and at the end at 500 ns with 50 ns intervals. Based on the visualization of each pathway, PLX was predicted as a good complexing agent for RTV molecule. At 50 ns, the MD simulations showed that PLX bind to RTV molecule and was stable until the end of simulations. In this case, the oxyethylene moiety in PLX structure was hydrophilic, which allowed it to interact with hydrophobic agents such as RTV. PLX also increased the solubility of RTV in the molten phase and formed a stable solution. Furthermore, PLX acted as a protective agent against RTV degradation and oxidation during the melt-cooling process. By forming a complex with RTV, PLX can protect drug from damage caused by heat and oxygen during the cooling process. PLX can also modify the physical properties of drug mixture, thereby affecting various aspects of RTV such as particle size, crystallinity, and drug release ability. This indicates that PLX has the potential to improve the physical properties and stability of RTV.26–28 PLX was also selected in this study based on the screening conducted using in silico method (docking simulation). The results of this study showed that PLX has better molecular interaction with ritonavir compared to other polymers (data presented in Supplementary Table 1).
 |
Figure 3 Molecular Motion of the Complex System During Molecular Dynamics Simulations using Melt-Cooling Methods. |
A significant difference was shown by RTV and PLX complexes in the solvent-evaporation method using ethanol solvent, from 0 ns to the end of simulations at 500 ns, as they were unable to form a perfect complex. Furthermore, the ethanol solvent evaporated when MD simulations reached 200 ns to 500 ns, as presented in Figure 4. This phenomenon occurred because the chemical interactions between RTV, PLX, and ethanol interfered with the formation of complexes. These molecular interactions can produce new unwanted products or destroy complex structures that were expected to form. The solvent-evaporation method involves evaporating the solvent to form a complex. However, the rapid evaporation of ethanol can affect the stability and integrity of the complex. Some complexes also formed when the solvent evaporated but were unstable in the long term due to changes or increase in temperature.21,25,29,30 When complexes are unstable, they can break down or separate back into their original components over time.
 |
Figure 4 Molecular Motion of the Complex System During Molecular Dynamics Simulations using Solvent Evaporation Methods. |
Conformational Changes During Molecular Dynamics Processes
RMSD was measured to confirm structural changes during MD simulations. RMSD was employed as one of the metrics used to check the correlation of MD simulations with the reference structure. This was carried out to monitor the conformational changes of the molecule during simulations and compare it with the initial or reference structure. In this study, the RMSD values of the four RTV and PLX complex systems were calculated, and the conformational changes were observed by plotting the RMSD over simulations.31,32 The graph in Figure 5 shows the conformational changes of RTV and PLX complexes using the melt-cooling and solvent evaporation methods during MD simulations. By considering the RSMD graph, we can depict the stability of the polymer complex formed during the simulation. This complex stability confirms that PLX is suitable for forming a complex with RTV.
 |
Figure 5 Comparison of the Root Mean Square Deviation (RMSD) Graphs of the Complex Systems During Molecular Dynamics Simulations. |
The solvent-evaporation method involves the removal of ethanol solvent from the system through evaporation. This process affects the initial conformation of the molecule or molecular complex of RTV and PLX. During solvent-evaporation, the molecules or complexes dissolved in the solvent experienced changes in interactions. When the solvent is removed, interactions with the solvent are no longer present, thereby affecting the conformational stability of the molecule or complex. This phenomenon is evidenced by the average RMSD value from the solvent-evaporation method, which falls within the range of 3–4 nm, indicating the stability of the formed polymer during the process. This process also involves changing environmental conditions from a solution to a solid phase, which affects interactions between molecules or complexes with the surrounding environment. Meanwhile, the melt-cooling method involves melting and cooling of a complex system. This process maintains a more stable conformation of the molecule or complex because it does not involve significant changes in the environment and interactions with the solvent. Therefore, the fluctuations in interaction distance on the RMSD graph tend to be smaller when using the melt cooling method.
RMSF graphs were used to understand atomic fluctuations in a system during MD simulations. RMSF measures the extent to which the positions of atoms in simulations fluctuate from their average positions over a given period. In this case, several atoms considered for displacement include carbon (C), hydrogen (H), oxygen (O), nitrogen (N), sulfur (S), and phosphorus (P). Furthermore, RMSF chart observations provided insight into the degree of flexibility or stability of atoms.32,33 In the RTV and PLX complexes, the solvent evaporation method exhibits considerable atomic displacement fluctuations in the RMSF graph compared to the melt cooling approach, as shown in Figure 6. This phenomenon arises due to the solvent evaporation method involving interactions with the solvent in the system, thereby affecting the interactions between the RTV and PLX molecules. The displacement of atoms in the solvent evaporation method increases after reaching 100 ns, concurrent with the rise in temperature within the system. These interactions affect the stability, flexibility, and initial conformation of complex molecules due to variations in the environment and interactions when the solvent is removed. Meanwhile, the melt-cooling method involves melting and cooling of complex systems. This process attenuates atomic vibrations and reduces any fluctuations that occur in the system. The solvent-evaporation method involves changing environmental conditions from a liquid to a solid phase, resulting in a dry state. These changes caused an increase in atomic fluctuations and produced more fluctuations in the RMSF chart.
 |
Figure 6 Comparison of the Root Mean Square Fluctuation (RMSF) Graphs of the Complex Systems During Molecular Dynamics Simulations. |
Increased Solubility of the RTV in the Presence of PLX
Radial distribution function (RDF) analysis of RTV and PLX complexes using the melt-cooling and solvent evaporation methods was used to understand the spatial relationship between the molecules in the system. RDF describes the tendency of certain particles such as atoms or molecules to exist at a certain distance from a reference particle. Specifically, RDF measured the relative density of RTV and PLX particles along a radial distance from a reference.34 The considered radial distance uses the RTV center as the origin and measures the number of PLX molecular centers at specific points along the radial axis. In RTV and PLX complexes, RDF provided information on the spatial distribution of PLX around RTV and vice versa. This assisted in understanding interactions between RTV and PLX, including spatial arrangement, possible hydrogen bonding, and formation of complex structures.
The RDF graph in Figure 7 shows that the rate of formation of complexes between RTV and PLX results in stronger interactions between PLX molecular atoms and the neighboring RTV molecular atoms when the melt-cooling process is used. This phenomenon can be observed due to the presence of sharp and flat peaks at certain points in the molecular dynamic simulation in the RDF graph of the melt-cooling method. Moreover, the melt-cooling method involves cooling the mixture to form a solid state of the complex. In solid state, the complex molecules are arranged orderly thereby conserving their interactions. The method also allows the formation of RTV and PLX complexes to occur directly while cooling the mixture. This allows the PLX and RTV complex molecules to be properly organized and prevents potential errors or unwanted changes in their structures during the solvent evaporation process. Additionally, it helps prevent degradation that may occur in the molecular structure of the complexes during this process. However, the solvent-evaporation method involves the evaporation of the solvent to form complexes. This process can lead to the formation of larger aggregates from the dissolved particles in the solvent (Figure 4). These large aggregates can interfere with RDF analysis because they did not represent the true distribution of complex particles. The melt-cooling method tends to circumvent this problem by forming the complex directly in solid state. Furthermore, in the solvent-evaporation method, the solvent had a significant presence in the complex formation process that can affect interactions and spatial distribution between RTV and PLX. In the melt-cooling method, no solvent was involved after cooling the mixture, allowing RDF analysis to focus more on interactions between the complex components.
 |
Figure 7 Comparison of the Radial Distribution Function (RDF) Graphs of the Complex Systems During Molecular Dynamics Simulations. |
Packaging and Compactness of the RTV and PLX Complexes
Radius of gyration (Rg) of molecular inclusion model was measured to investigate cohesiveness in RTV and PLX complexes. The Rg measured how dispersed the particles were in the system, by calculating the average distance of the PLX particles from the center of mass of the RTV molecule. Furthermore, the Rg provided information about the conformation of a molecule, indicating whether a molecule was more compact or open. It also showed more about the flexibility of a molecule, indicating how easily a molecule can change shape or move. When the Rg value was low, the cohesiveness of molecular inclusion model shows good conformation in the system during simulations.
Figure 8 shows the fluctuation of the Rg as a function of time for the simulated model. At Rg of 500 ns, RTV and PLX complexes using the melt-cooling method exhibited more stability with the solvent-evaporation method. The melt-cooling method allows the formation of RTV and PLX complexes in the solid state, which represents the actual state such as in encapsulated or crystalline drug formulations. In the solid state, the spatial distribution of complex molecules was more organized and stable, leading to the accurate measurement of Rg by the melt-cooling method. The melt-cooling method also allows the complex formation to occur directly through the process of cooling the mixture. This process allows for finer control of factors such as temperature, time, and cooling rate, which affect the structure and properties of the complex. In the solvent-evaporation method, the influence of the solvent and evaporation parameters can be difficult to control with precision, leading to the inconsistent measurement of the Rg.
 |
Figure 8 Comparison of the Radius of Gyration (Rg) Graphs of the Complex System During Molecular Dynamics Simulations. |
The solvent-evaporation process involves the evaporation of the solvent, which causes structural changes to the systems. These changes occur due to interactions with solvents or variations in physical states, such as increased temperature variations. Meanwhile, the melt-cooling method allows the formation of complexes in a more stable solid state, with little or no significant structural change. Rg also provides information about the movement and flexibility of molecules in complexes. The melt-cooling method allows measurement of the Rg in a stable solid state, which properly reflected dynamics properties of the complex. The solvent-evaporation method may affect the flexibility of the molecule and internal movement due to the solvent effect, thereby reducing the information that can be obtained about dynamics properties of the systems.
The analysis of SASA analysis for RTV and PLX complexes using melt-cooling and solvent-evaporation methods was employed to understand the exposure of the surface of the molecules in the complex to solvents or the surrounding environment. SASA provides insights into the surface area accessible to the solvent, thereby reflecting the hydrophobic and hydrophilic characteristics of the molecules within the complex. For the solvent-evaporation system, the SASA calculation was continuously conducted throughout the simulation. However, in the melt-cooling model, it was performed only at the beginning to confirm the absence of solvent. In the melt-cooling method, the complex is formed in solid state directly by cooling the mixture. SASA analysis with the melt-cooling method made it possible to calculate the complex surface area that can be accessed by the solvent numerically. Meanwhile, in the solvent-evaporation method, a complex is formed by evaporating the solvent. SASA analysis in this method provided information about the surface area of the complex exposed or protected from the solvent after evaporation.
The SASA graph in Figure 9 indicates that the RTV and PLX complexes formed using the melt-cooling method exhibit higher complexity compared to the solvent-evaporation approach. In the solvent-evaporation system, the fluctuations in the SASA graph are believed to be primarily influenced by the accessibility of solvents around the RTV and PLX molecules. Furthermore, the melt-cooling method involves forming the complex in solid state directly by cooling the mixture. This process allows for well-ordered complex molecules and maintains their interactions in solid state. Based on the stability of the complex molecular structure, the melt-cooling method provided higher stability because the complex molecules were organized in solid state. Meanwhile, the solvent-evaporation method involves evaporating the solvent to form a complex. This process affects the stability of the complex based on the nature of the solvent, temperature, evaporation rate, and other conditions. When the solvent had strong interactions with complex molecules or caused significant structural changes, the stability of the complex is negatively affected.
 |
Figure 9 Comparison of the Solvent Accessible Surface Area (SASA) Graphs of the Complex System During Molecular Dynamics Simulations. |
RTV and PLX Complex Binding Ability
Hydrogen bonds are one of the most important types of intermolecular interactions in chemistry and biology. The observation of H-bonds in RTV and PL complexes helps to understand interactions between these molecules, thereby providing insight into the hydrogen bonds formed, the stability of complexes, and their roles in influencing the structure, stability, and overall properties of complexes. H-bond observations also identify the hydrogen bonding motifs formed in complexes. This motif refers to a particular pattern in which a hydrogen atom from one molecule interacts with a hydrogen bond acceptor atom from another molecule. The identification of the dominant hydrogen bond motif in a complex can provide a better understanding of molecular structure and interactions involved. In MD simulations of RTV and PLX, the H-bond observations can also be used to validate experimental results. By comparing the hydrogen bonds observed in simulations with the experimental data, it is possible to verify the accuracy of simulations model and the re-production capacity of molecular interactions that occur under experimental conditions.
Supplementary Figure 2 demonstrates that by employing different atomic approximations for the Bader molecule, specifically based on (1) Laplacian signs, (2) the magnitude of the electron density, and (3) the ratio of the density of kinetic and potential energies, the RTV and PLX complexes formed using the melt-cooling method exhibited a more stable presence of hydrogen bonds, as opposed to when the solvent-evaporation approach was utilized. This is because the melt-cooling method involves melting a mixture of an active substance such as RTV and a carrier, namely PLX at high temperatures, followed by rapid cooling to form a solid structure. During the melt-cooling process, hydrogen bonds form spontaneously between the complex molecules due to the presence of hydroxyl groups in PLX and other functional groups in RTV. The functional groups in RTV include aromatic groups, amide groups, hydroxyl groups, and aliphatic groups. These functional groups facilitate the formation of hydrogen bonds, which play a crucial role in stabilizing the complex during the cooling process. This process also allows hydrogen bonds to form at a higher and more constant density. However, the solvent-evaporation method involves diluting the active substance in an organic solvent, such as ethanol, which is evaporated to obtain a thin layer of precipitated active substance. In this method, the organic solvent acts as a barrier between the active substance and the carrier. However, the removal of the organic solvent resulted in the disruption of the hydrogen bonds formed between RTV and PLX during the complex formation process.
Observation of hydrogen bond occupancy in the MD simulation was performed to determine the frequency of hydrogen bond formation between RTV and PLX in the molecular system. Hydrogen bond occupancy refers to the fraction of time during which hydrogen bonds are present in MD simulations, and this calculation was integrated into the visual molecular dynamics (VMD, Theoretical and Computational Biophysics group at the Beckman Institute, University of Illinois at Urbana-Champaign). This information provides a better understanding of the strength and stability of interactions between molecules. The data in Table 1 shows that RTV and PLX complex systems using the melt-cooling method exhibited promising binding capabilities, with occupancy percentages of 77.94% (Melt-Cooling-A), 58.43% (Melt-Cooling-B), and 72.44% (Melt-Cooling-C). Meanwhile, in the solvent-evaporation method, the active substance (RTV) and carrier (PLX) were dissolved in the organic solvent ethanol. These organic solvents block the hydrogen bonding interactions between the active substance and the carrier. Organic solvents also had different properties from carriers, which interfere with the formation of stable hydrogen bonds.
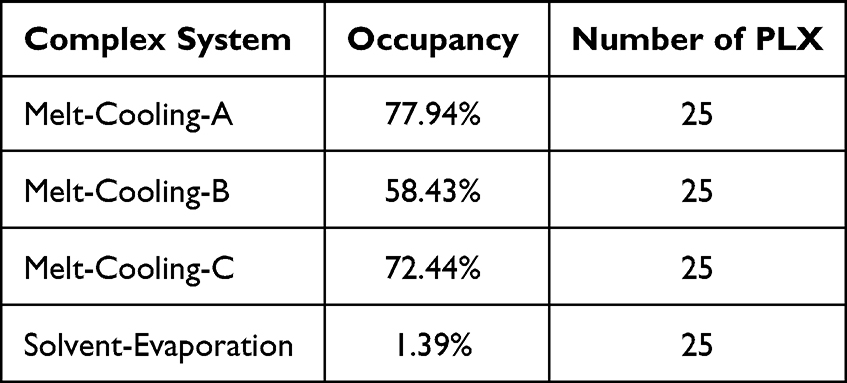 |
Table 1 Percentage of Hydrogen Bond Occupancy of a Complex System During Molecular Dynamics Simulations |
The drying process in the solvent-evaporation method usually takes longer than the melt-cooling method. The slow evaporation process allows opportunities for interactions between organic solvents, active substances, and carriers, which can interfere with the formation of consistent hydrogen bonds. This method also produces greater concentration variations in complex systems, which can affect the distribution of active substances and carriers in solid matrix formed, thereby reducing the possibility of consistent hydrogen bonding between complex molecules. Furthermore, hydrogen bond occupancy is a measure of the frequency of hydrogen bond formation in polymers over a period of time. The hydrogen bond occupancy in polymers depends on several factors, including polymer concentration and environmental conditions such as temperature and humidity. The higher the occupancy, the more often hydrogen bonds are formed.
Characterization of Glass Transition Temperature of RTV and PLX Complexes
Glass Tg analysis is an important function in understanding the physical properties and stability of RTV and PLX systems that are prepared using melt-cooling and solvent-evaporation methods. Tg is the temperature observed during the transition from solid to amorphous state, where the organic material or polymer passes through a phase change from an ordered structure to a random structure. In the melt-cooling method, Tg analysis can provide information about solid state of RTV and PLX complexes formed. Meanwhile, in the solvent-evaporation method, Tg analysis provides insight into solid state of the resulting RTV and PLX complexes. Moreover, a low Tg temperature indicates the effect of organic solvents remaining in solid matrix, which can affect the stability and physical properties of the complex.
Several complex relationships were observed between Tg and density, volume, and pressure. The correlation between Tg and density is not always consistent, as it is influenced by other factors such as composition and molecular structure. When Tg is reached, there is a change in the volume of the substance, which tends to increase due to the more random and wider molecular structure during Tg transition. Furthermore, pressure plays a significant role in influencing Tg as it affects intermolecular interactions and the mobility of molecules in the material. This shows that increasing pressure can improve molecular density and strengthen intermolecular bonds to increase Tg. Conversely, a decrease in pressure can reduce molecular density and weaken intermolecular bonds, thereby reducing Tg.
Based on Table 2, the RTV and PLX complexes obtained using the melt-cooling method exhibited Tg values that fulfilled the requirements (above the melting point of RTV). This occurred because the melt-cooling method involved melting a mixture of the active substance (RTV) and carrier (PLX) at high temperatures, followed by rapid cooling to form a solid structure. This rapid cooling process allows the formation of strong molecular interactions, such as hydrogen bonds, van der Waals bonds, or hydrophobic interactions, between the active ingredient and the carrier. These strong molecular interactions result in stable complex structures with Tg that met the requirements. Tg is the temperature at the transition from solid state to amorphous state. When Tg meets the specified requirements, it indicates that RTV and PLX complexes have good stability against temperature changes. By rapid cooling, the melt-cooling method allowed the formation of a compact and ordered structure, which provided stability to temperature changes. The ordered structure strengthens the intermolecular bonds and maintains the physical properties of the complex at higher temperatures. In this study, RTV and PLX were selected as ingredients in complex formation because of their compatibility in forming a stable structure. PLX, which was used as a carrier, showed good solubility in RTV and was capable of forming strong intermolecular bonds. Furthermore, the presence of complementary active substances and carriers allowed the formation of stable complexes with Tg that complied with the requirements (above the melting point of RTV).
 |
Table 2 Characteristic Data of a Complex System During Molecular Dynamics Simulations |
The Dynamics of the Interactions Formed from the Complex System
In MD simulations, identification of interactions can be carried out in various ways, including potential energy analysis between guest and host molecules, group correlation and cohesion analysis, as well as analysis of molecular motions. By comprehending interactions between guest and host molecules in complex systems, an enhanced understanding of system properties and improved predictions of system behavior can be achieved. Furthermore, the identification of interactions is important in MD simulations of complex systems, including understanding the physical and chemical properties, designing a more effective host, and predicting the performance of the system.
The data presented in Supplementary Table 2 show that RTV had a strong interaction with PLX during MD simulations using the melt-cooling method. RTV and PLX were selected due to their good chemical compatibility and functional groups that can form hydrogen bonds as well as other intermolecular interactions. This compatibility is predicted to facilitate strong interactions between RTV and PLX during MD simulations. RTV has hydroxyl, amide, and other functional groups that can interact with the hydroxyl groups on PLX. During MD simulations, these groups interact with each other, form hydrogen bonds, and contribute to the stability of the complex. By rapid cooling, the melt-cooling method allowed hydrogen bonds to form at a higher density and was more stable, thereby strengthening interactions between RTV and PLX in the complex. During MD simulations using the melt-cooling method, rapid cooling reduced molecular mobility in RTV and PLX complexes. This limited mobility strengthened the intermolecular interactions and increased the stability of the complex. Additionally, RTV and PLX possess suitable molecular structure sizes and shapes, as well as appropriate functional groups, which enable effective interactions during MD simulations. This allows close interactions between both complexes, thereby strengthening bonds and intermolecular interactions.
Binding Free Energy of RTV and PLX System Complexes
In the analysis of Molecular Mechanics Poisson-Boltzmann Surface Area (MM-PBSA), each molecular conformation of RTV and PLX systems using the melt-cooling and solvent-evaporation methods was assessed by calculating the total energy. This consists of contributions from covalent bonds, electrostatic interactions, van der Waals interactions, and solvation energy. The MM-PBSA method consists of three main components, namely Molecular Mechanics (MM), Poisson-Boltzmann (PB), and Surface Area.35 Furthermore, MM was used to calculate molecular potential energy and MD of the system. PB was used to model the electrolytic environment and measure interactions between molecules and the electrolytic environment. SA was used to estimate the entropy effect involved in molecular bonding process.
The data presented in Table 3 show that RTV and PLX complexes using the melt-cooling method had good bond-free energies, with values of −130.16, −133.62, and −125.18 for melt-cooling-A, melt-cooling-B, and melt-cooling-C, respectively. This phenomenon shows that the melt-cooling method involves a rapid cooling process, allowing the formation of strong intermolecular interactions between RTV and PLX. In this study, RTV and PLX were selected based on the suitability of the complementarity of their molecules, which allowed the formation of strong bonds within the complex. Both complexes had good solubility and affinity for each other, which enhanced the formation of strong and stable molecular interactions. The numerous hydrogen-bond donor moieties on RTV, such as -OH and -NH groups, should favorably interact with the hydrogen-bond accepting –O– groups on the PLX backbone, involving like-seeks-like. This complementary interaction between the hydrogen-bond donor and acceptor groups enhances the formation of stable hydrogen bonds between RTV and PLX during the MD simulations, contributing to the overall stability and structural integrity of the complex. The melt-cooling method produces a dense and ordered complex structure to maintain a more stable molecular conformation, thereby contributing to low bond-free energy.
 |
Table 3 The Free Binding Energies and Their Corresponding Components for a Complex System During Molecular Dynamics Simulations |
Discussion
In this study, MD simulations were used to evaluate interactions between RTV and PLX after being simulated by solvent-evaporation and melt-cooling methods. Interactions between RTV and PLX during simulations of the solvent-evaporation method is presented in Figure 10.
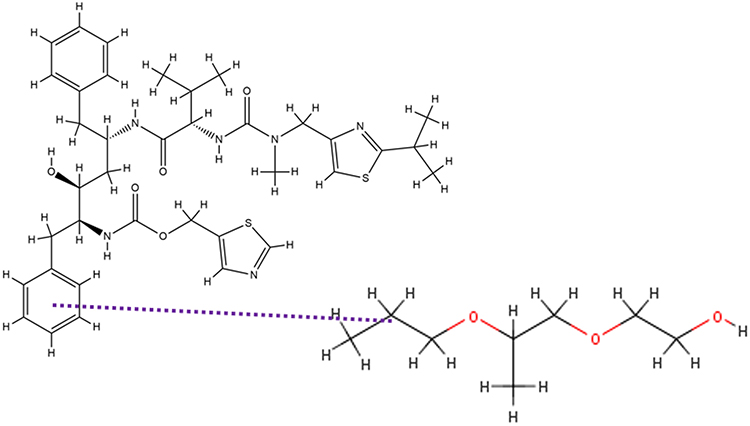 |
Figure 10 The Interaction Formed Between RTV and PLX During the Simulation of the Solvent-Evaporation Method. |
Figure 10 shows that when the solvent was completely lost at 200 ns in the solvent-evaporation method, there was no formation of the hydrogen bonds between RTV and PLX. However, the pi-alkyl bonds of RTV-PLX were formed and Tg value of 273.05°C was also obtained, indicating that ASD of RTV-PLX was formed. The RMSD analysis demonstrated that the translational motion of RTV was significantly reduced during both evaporation processes by the addition of PLX, which can be attributed to the intermolecular interactions between RTV and PLX. Specifically, the RMSD analysis indicates a notable sup-pression of translational movement in the presence of PLX, suggesting a stronger binding or complex formation between the two molecules.
At 0°C, after cooling (500 ns) in the Melt-Cooling method with a cooling rate of 1°C/ns, RTV interacted with 2 PLX molecules and formed 2 hydrogen bonds (Figure 11). The first hydrogen bond was formed between the O atom on RTV carbonyl group and the H atom on PLX hydroxyl group. A second hydrogen bond was formed between the O atom on RTV carbonyl group and the H atom on the other PLX hydroxyl group. Tg value obtained from this method was 272.00°C, indicating that ASD of RTV-PLX was formed.
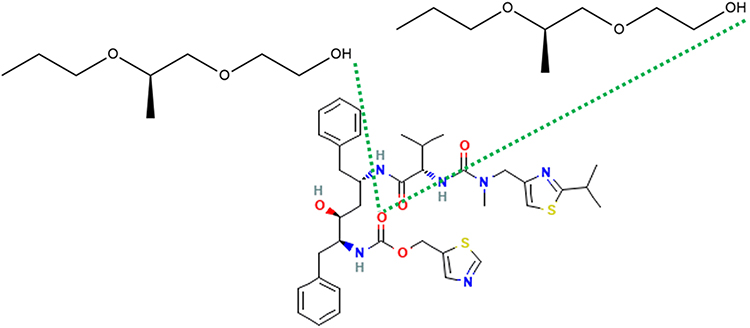 |
Figure 11 The Interaction Formed Between RTV and PLX During the Simulation of the Melt-Cooling-A Method. |
At 0°C, after cooling (500 ns) in the Melt-Cooling method with a cooling rate of 20.50°C/ns, RTV interacted with 2 PLX molecules and formed 7 hydrogen bonds (Figure 12). The first hydrogen bond was formed between the H atom of RTV hydrocarbon group and the O atom of PLX hydroxyl group. A second hydrogen bond was formed between the H atom of the amide group of RTV and the O atom of the carbonyl group of PLX. The third hydrogen bond is formed between the O atom of RTV carbonyl group and the H atom of the hydroxyl group of the second PLX. The fourth hydrogen bond is formed between the O atom of RTV carbonyl group and the H atom of the hydrocarbon group of the second PLX. Furthermore, the fifth hydrogen bond was formed between the O atom of RTV carbonyl group and the H atom of another hydrocarbon group of the second PLX. The sixth hydrogen bond was formed between the O atom of the other carbonyl group of RTV and the H atom of the hydrocarbon group of the second PLX. The seventh hydrogen bond was formed between the H atom of the amine group of RTV and the O atom of the hydroxyl group of the second PLX. Tg value obtained from this method was 272.82°C, indicating the formation of ASD of RTV-PLX.
 |
Figure 12 The Interaction Formed Between RTV and PLX During the Simulation of the Melt-Cooling-B Method. |
At 0°C, after cooling (500 ns) in the Melt-Cooling method with a cooling rate of 40°C/ns, RTV interacted with 2 PLX molecules and formed 6 hydrogen bonds (Figure 13). The first hydrogen bond was formed between the O atom of RTV hydroxyl group and the H atom of PLX hydrocarbon group. The second hydrogen bond is formed between the O atom of RTV carbonyl group and the H atom of the carbonyl group of the second PLX. The third hydrogen bond is formed between the O atom of RTV carbonyl group and the H atom of the hydrocarbon group of the second PLX. The fourth hydrogen bond is formed between the O atom of RTV carbonyl group and the H atom of the hydrocarbon group of the second PLX. The fifth hydrogen bond is formed between the H atom of RTV hydroxyl group and the O atom of the carbonyl group of the second PLX. Furthermore, a sixth hydrogen bond was formed between the H atom on cyclopentene RTV and the O atom of the hydroxyl group of the second PLX. Tg value obtained from this method was 272.97°C, indicating the formation of ASD of RTV-PLX.
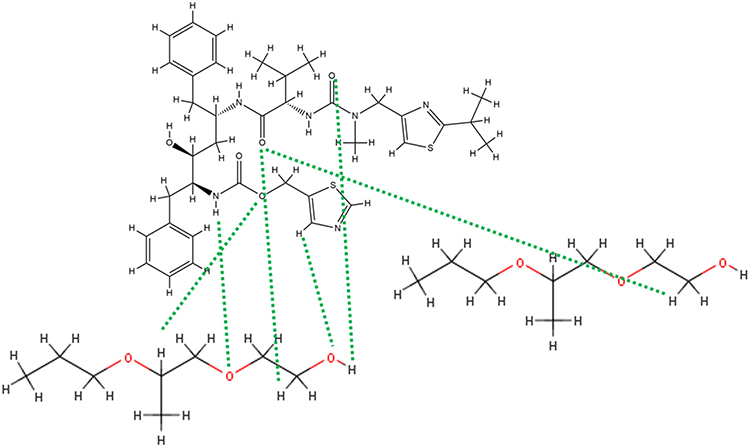 |
Figure 13 The Interaction Formed Between RTV And PLX During the Simulation of the Melt-Cooling-C Method. |
The RMSD values obtained from the solvent-evaporation, melt-cooling-A, melt-cooling-B, and melt-cooling-C methods were 3.33 Å, 1.97 Å, 1.30 Å, and 1.29 Å, respectively. RMSF analysis provides information about the atomic fluctuations in each molecule. The solvent removal process in the solvent evaporation method leads to larger atomic fluctuations compared to the melt-cooling method. Based on the results, the average RMSF values obtained from the solvent evaporation, melt-cooling-A, melt-cooling-B, and melt-cooling-C methods were 2.65 Å, 1.04 Å, 1.05 Å, and 1.07 Å, respectively. RDF analysis was used to describe the tendency of certain particles such as atoms or molecules to exist at specified distances from a reference particle. Compared to the melt-cooling method, the use of solvent in the solvent-evaporation method influenced interactions and spatial arrangement between RTV and PLX. The average RDF values obtained from the solvent evaporation, melt-cooling-A, melt-cooling-B, and melt-cooling-C methods were 0.77 g(r), 0.36 g(r), 0.44 g(r), and 0.44 g(r), respectively. The Rg values provide information on whether a molecule is more compact or open, with the low Rg values indicating good conformation in the system during simulations. The melt-cooling method allows for the measurement of the Rg in a stable solid-state compared to the solvent-evaporation approach. In this study, the average Rg values obtained from the solvent-evaporation, melt-cooling-A, melt-cooling-B, and melt-cooling-C methods were 2.82 nm, 1.10 nm, 1.10 nm, and 1.11 nm, respectively. SASA analysis of RTV and PLX complexes was used to understand the exposure of the surface of the molecules in the complex to solvents or the surrounding environment. The average SASA values obtained from the solvent-evaporation, melt-cooling-A, melt-cooling-B, and melt-cooling-C methods were 103.95 nm2, 1.88 nm2, 0.38 nm2, and 0.47 nm2, respectively. Furthermore, the observation of the H-bond helped to understand interactions between these molecules and provided insight into the stability of complexes.
Conclusion
In conclusion, ASD of RTV with PLX was investigated using MD simulations. The validity of MD simulations, which mimicked the solvent-evaporation and melt-cooling method was confirmed by calculating Tg values of RTV/PLX and compared with experimental Tg. MD simulations of RTV/PLX amorphous formulation showed that the translational motion of RTV was suppressed by the addition of PLX during the solvent-evaporation and the cooling process. The pi-alkyl bonds of RTV-PLX were formed after the solvent was completely removed during the solvent-evaporation method. Meanwhile, hydrogen bond interactions between RTV and PLX were formed during simulations of the melt-cooling method. The rate of the cooling process affected the amount of hydrogen bond formation between RTV and PLX. Interactions between RTV and PLX also play an important role in the stabilization of amorphous films. This study provides fundamental insight into in silico studies that can be used as a powerful tool to design amorphous formulations of poorly water-soluble drugs. The results show that a computational method of MD simulations enables the evaluation of the intermolecular interactions between drugs and polymers. Approach also monitored dynamics and interactions, which facilitated the screening of appropriate polymer in the formulation of ASD.
Acknowledgments
We would like to thank Universitas Padjadjaran for supporting this work and APC.
Funding
This research was funded by Universitas Padjadjaran (Riset Data Pustaka dan Daring) to Diah Lia Aulifa No. 1549/UN6.3.1/PT.00/2023 on March 27, 2023.
Disclosure
The authors report no conflicts of interest in this work.
References
1. Budiman A, Megantara S, Raraswati P, Qoriah T. Solid dosage form development of glibenclamide with increasing the solubility and dissolution rate using cocrystallization. Intl J App Pharm. 2018;10(6):181–186. doi:10.22159/ijap.2018v10i6.29257
2. Kawabata Y, Wada K, Nakatani M, Yamada S, Onoue S. Formulation design for poorly water-soluble drugs based on biopharmaceutics classification system: basic approaches and practical applications. Int J Pharm. 2011;420(1):1–10. doi:10.1016/j.ijpharm.2011.08.032
3. Budiman A, Husni P, Alfauziah TQ, Alfauziah TQ. The development of glibenclamide-saccharin cocrystal tablet formulations to increase the dissolution rate of the drug. Intl J App Pharm. 2019;11(4):359–364. doi:10.22159/ijap.2019v11i4.33802
4. Hancock BC, Zografi G. Characteristics and significance of the amorphous state in pharmaceutical systems. J Pharm Sci. 1997;86(1):1–12. doi:10.1021/js9601896
5. Yu L. Amorphous pharmaceutical solids: preparation, characterization and stabilization. Adv Drug Deliv Rev. 2001;48(1):27–42. doi:10.1016/S0169-409X(01)00098-9
6. Baghel S, Cathcart H, O’Reilly NJ. Polymeric amorphous solid dispersions: a review of amorphization, crystallization, stabilization, solid-state characterization, and aqueous solubilization of biopharmaceutical classification system class II drugs. J Pharm Sci. 2016;105(9):2527–2544. doi:10.1016/j.xphs.2015.10.008
7. Hancock BC, Parks M. What is the true solubility advantage for amorphous pharmaceuticals? Pharm Res. 2000;17(4):397–404. doi:10.1023/A:1007516718048
8. Bogner RH, Murdande SB, Pikal MJ, Shanker RM. Solubility advantage of amorphous pharmaceuticals: II. application of quantitative thermodynamic relationships for prediction of solubility enhancement in structurally diverse insoluble pharmaceuticals. Pharm Res. 2010;27(12):2704–2714. doi:10.1007/s11095-010-0269-5
9. Brouwers J, Brewster ME, Augustijns P. Supersaturating drug delivery systems: the answer to solubility-limited oral bioavailability? J Pharm Sci. 2009;98(8):2549–2572. doi:10.1002/jps.21650
10. Okada H, Ueda K, Yasuda Y, et al. Correlation between drug dissolution and resistance to water-induced phase separation in solid dispersion formulations revealed by solid-state NMR spectroscopy. Int J Pharm. 2020;577:119086. doi:10.1016/j.ijpharm.2020.119086
11. Vasconcelos T, Marques S, Das Neves J, Sarmento B. Amorphous solid dispersions: rational selection of a manufacturing process. Adv Drug Deliv Rev. 2016;100:85–101. doi:10.1016/j.addr.2016.01.012
12. Janssens S, Van den Mooter G. Review: physical chemistry of solid dispersions. J Pharm Pharmacol. 2009;61(12):1571–1586. doi:10.1211/jpp/61.12.0001
13. Ueda K, Higashi K, Yamamoto K, Moribe K. The effect of HPMCAS functional groups on drug crystallization from the supersaturated state and dissolution improvement. Int J Pharm. 2014;464(1–2):205–213. doi:10.1016/j.ijpharm.2014.01.005
14. Barmpalexis P, Karagianni A, Kachrimanis K. Molecular simulations for amorphous drug formulation: polymeric matrix properties relevant to hot-melt extrusion. Eur J Pharm Sci. 2018;119:259–267. doi:10.1016/j.ejps.2018.04.035
15. Xiang TX, Anderson BD. Molecular dynamics simulation of amorphous indomethacin-poly(Vinylpyrrolidone) glasses: solubility and hydrogen bonding interactions. J Pharm Sci. 2013;102(3):876–891. doi:10.1002/jps.23353
16. Gupta J, Nunes C, Vyas S, Jonnalagadda S. Prediction of solubility parameters and miscibility of pharmaceutical compounds by molecular dynamics simulations. J Phys Chem B. 2011;115(9):2014–2023. doi:10.1021/jp108540n
17. Huynh L, Grant J, Leroux JC, Delmas P, Allen C. Predicting the solubility of the anti-cancer agent docetaxel in small molecule excipients using computational methods. Pharm Res. 2008;25(1):147–157. doi:10.1007/s11095-007-9412-3
18. Yang H, Li ZS, Qian HJ, et al. Molecular dynamics simulation studies of binary blend miscibility of poly (3-hydroxybutyrate) and poly(ethylene oxide). Polymer. 2004;45(2):453–457. doi:10.1016/j.polymer.2003.11.021
19. Ma X, Higashi K, Fukuzawa K, et al. Computational approach to elucidate the formation and stabilization mechanism of amorphous formulation using molecular dynamics simulation and fragment molecular orbital calculation. Int J Pharm. 2022:615. doi:10.1016/j.ijpharm.2022.121477
20. Baird JA, Van Eerdenbrugh B, Taylor LS. A classification system to assess the crystallization tendency of organic molecules from undercooled melts. J Pharm Sci. 2010;99(9):3787–3806. doi:10.1002/jps.22197
21. Budiman A, Aulifa DL. A comparative study of the pharmaceutical properties between amorphous drugs loaded-mesoporous silica and pure amorphous drugs prepared by solvent evaporation. Pharmaceuticals. 2022;15(6):730. doi:10.3390/ph15060730
22. Budiman A, Aulifa DL. Characterization of drugs with good glass formers in loaded-mesoporous silica and its theoretical value relevance with mesopores surface and pore-filling capacity. Pharmaceuticals. 2022;15(1):93. doi:10.3390/ph15010093
23. Huang H, Simmerling C. Fast pairwise approximation of solvent accessible surface area for implicit solvent simulations of proteins on CPUs and GPUs. J Chem Theory Comput. 2018;14(11):5797–5814. doi:10.1021/acs.jctc.8b00413
24. Kobayashi A, Nakajima M, Noguchi Y, Morikawa R, Matsuo Y, Takasu M. Molecular dynamics simulation of the complex of PDE5 and evodiamine. Life. 2023;13(2):578–592. doi:10.3390/life13020578
25. Budiman A, Kalina K, Aristawidya L, Al Shofwan AA, Rusdin A, Aulifa DL. Characterizing the impact of chitosan on the nucleation and crystal growth of ritonavir from supersaturated solutions. Polymers. 2023;15(5):1282. doi:10.3390/polym15051282
26. Khan AA, Mudassir J, Akhtar S, Murugaiyah V, Darwis Y. Freeze-dried lopinavir-loaded nanostructured lipid carriers for enhanced cellular uptake and bioavailability: statistical optimization, in vitro and in vivo evaluations. Pharmaceutics. 2019;11(2):97. doi:10.3390/pharmaceutics11020097
27. Arca HÇ, Mosquera-Giraldo LI, Dahal D, Taylor LS, Edgar KJ. Multidrug, anti-HIV amorphous solid dispersions: nature and mechanisms of impacts of drugs on each other’s solution concentrations. Mol Pharm. 2017;14(11):3617–3627. doi:10.1021/acs.molpharmaceut.7b00203
28. Siriwannakij N, Heimbach T, Serajuddin ATM. Aqueous dissolution and dispersion behavior of polyvinylpyrrolidone vinyl acetate-based amorphous solid dispersion of ritonavir prepared by hot-melt extrusion with and without added surfactants. J Pharm Sci. 2021;110(4):1480–1494. doi:10.1016/j.xphs.2020.08.007
29. de Alvarenga BR, Moseson DE, Carneiro RL, Taylor LS. Impact of polymer type on thermal degradation of amorphous solid dispersions containing ritonavir. Mol Pharm. 2022;19(1):332–344. doi:10.1021/acs.molpharmaceut.1c00823
30. Zhao Y, Xie X, Zhao Y, et al. Effect of plasticizers on manufacturing ritonavir/copovidone solid dispersions via hot-melt extrusion: preformulation, physicochemical characterization, and pharmacokinetics in rats. Eur J Pharm Sci. 2019;127:60–70. doi:10.1016/j.ejps.2018.10.020
31. Muchtaridi M, Triwahyuningtyas D, Muhammad Fakih T, Megantara S, Choi SB. Mechanistic insight of α-mangostin encapsulation in 2-hydroxypropyl-β-cyclodextrin for solubility enhancement. J Biomol Struct Dyn. 2023;1–10. doi:10.1080/07391102.2023.2214237
32. Farmer J, Kanwal F, Nikulsin N, Tsilimigras MCB, Jacobs DJ. Statistical measures to quantify similarity between molecular dynamics simulation trajectories. Entropy. 2017;19(12):646–662. doi:10.3390/e19120646
33. Ghahremanian S, Rashidi MM, Raeisi K, Toghraie D. Molecular dynamics simulation approach for discovering potential inhibitors against SARS-CoV-2: a structural review. J Mol Liq. 2022;354:118901–118912. doi:10.1016/j.molliq.2022.118901
34. He Q, Liu J, Zhang M, Zhai Z, Jiang B. Molecular dynamics simulation on the effect of self-resistance electric heating on carbon fiber surface chemical properties and Fiber/PP interfacial behavior. Polymers. 2022;14(5):1043. doi:10.3390/polym14051043
35. Genheden S, Ryde U. The MM/PBSA and MM/GBSA methods to estimate ligand-binding affinities. Expert Opin Drug Discov. 2015;10(5):449–461. doi:10.1517/17460441.2015.1032936
 © 2024 The Author(s). This work is published and licensed by Dove Medical Press Limited. The
full terms of this license are available at https://www.dovepress.com/terms
and incorporate the Creative Commons Attribution
- Non Commercial (unported, 3.0) License.
By accessing the work you hereby accept the Terms. Non-commercial uses of the work are permitted
without any further permission from Dove Medical Press Limited, provided the work is properly
attributed. For permission for commercial use of this work, please see paragraphs 4.2 and 5 of our Terms.
© 2024 The Author(s). This work is published and licensed by Dove Medical Press Limited. The
full terms of this license are available at https://www.dovepress.com/terms
and incorporate the Creative Commons Attribution
- Non Commercial (unported, 3.0) License.
By accessing the work you hereby accept the Terms. Non-commercial uses of the work are permitted
without any further permission from Dove Medical Press Limited, provided the work is properly
attributed. For permission for commercial use of this work, please see paragraphs 4.2 and 5 of our Terms.