Back to Journals » Patient Related Outcome Measures » Volume 12
Eliciting Health State Utilities for Aromatic L-Amino Acid Decarboxylase (AADC) Deficiency: A Vignette Study in France
Authors Smith AB ![]() , Hanbury A
, Hanbury A ![]() , Beitia Ortiz de Zarate I, Hammes F, de Pouvourville G, Buesch K
, Beitia Ortiz de Zarate I, Hammes F, de Pouvourville G, Buesch K
Received 12 February 2021
Accepted for publication 23 June 2021
Published 12 July 2021 Volume 2021:12 Pages 237—246
DOI https://doi.org/10.2147/PROM.S306228
Checked for plagiarism Yes
Review by Single anonymous peer review
Peer reviewer comments 2
Editor who approved publication: Professor Lynne Nemeth
Adam B Smith,1 Andria Hanbury,1 Igor Beitia Ortiz de Zarate,2 Florence Hammes,2 Gerard de Pouvourville,3 Katharina Buesch4
1York Health Economics Consortium, University of York, York, UK; 2PTC Therapeutics France, Paris, France; 3Department of Economics, ESSEC, Paris, France; 4PTC Therapeutics GmbH, Zug, Switzerland
Correspondence: Adam B Smith
York Health Economics Consortium, University of York, Enterprise House, Innovation Way, YO10 5NQ, UK
Tel +44 1904 323620
Fax +44 1904 323628
Email [email protected]
Purpose: Health-related quality of life (HRQoL) is difficult to measure in rare diseases, especially in paediatric populations, yet capturing HRQoL is critical to evaluating treatment, including the cost-effectiveness of treatments. Given the ultra-rare nature of AADC deficiency indirect elicitation of HRQoL data through proxy caregiver/parent ratings is not feasible. In these circumstances, HRQoL data may be derived through vignette studies using the general population. The aim of the study was to generate health utility values specific for France for AADC deficiency using vignettes.
Methods: The study was completed online by panel participants from a French representative sample. Five health state vignettes, reflecting key milestones in the eladocagene exuparvovec clinical trials and economic model, were presented to the participants: “bedridden”, “head control”, “sitting unsupported”, “standing with assistance” and “walking with assistance”. The vignettes had been previously developed with input from parents of patients with AADC deficiency, patients and expert opinion. Participants also completed the Health Utilities Index-3 for the “bedridden” health state.
Results: A total of 1001 participants (51% females; mean age 46 years) completed the vignettes. Utilities increased linearly as the health state improved for both the time trade-off (TTO): 0.47 (standard deviation, SD 0.36) to 0.54 (SD 0.36) and standard gamble (SG): 0.61 (SD 0.29) to 0.67 (SD 0.27). A significant minority had incongruent responses (high utilities for the bedridden compared to walking health states) for the vignette (27%). When these were removed, the TTO health utilities (N=729) ranged from 0.39 (SD 0.36) to 0.56 (SD 0.38) and 0.61 (SD 0.30) to 0.69 (SD 0.27) for the SG.
Conclusion: Health utilities were derived for AADC deficiency which will be used for a cost-effectiveness model of an AADC deficiency treatment.
Keywords: AADC deficiency, vignettes, time trade-off, standard gamble
Introduction
Aromatic L-amino acid decarboxylase (AADC) deficiency is a rare, genetic condition, which typically presents in early infancy with common symptoms, such as hypotonia, developmental delay, and movement disorders, including oculogyric crises.1,2 Health-related quality of life (HRQoL) assessments, expressed as health utilities, are pivotal to evaluating the economic cost-effectiveness of therapeutic interventions; however, rare diseases and particular paediatric populations, such as AADC deficiency present a problem in terms of determining HRQoL of the affected child. The nature and rarity of AADC deficiency with only between 100 and 120 reported cases worldwide1,3 means it is not possible to derive health state utilities from the child. For instance, whereas in many cases health utilities may be obtained through patient-reported outcome measures (PROs), such as the EuroQol 5-dimension (EQ-5D)4–6 and the Health Utilities Index (HUI3),7 this is prevented in AADC deficiency. Health utilities derived through proxy-ratings from parents or caregivers8 present an option; however, the small sample size from which these may be drawn could bring the robustness of the utilities into question. The use of proxy-ratings from clinicians9,10 (through rating (hypothetical) case studies using PROs) may also be subject to similar limitations. It may also be argued that there are inherent issues with proxy-ratings (for parents/caregivers and clinicians alike) through unwitting biases.11
Other approaches to deriving health state utilities for rare medical conditions include time trade-off (TTO) and standard gamble (SG) tasks12 used alongside vignettes. In both methods participants' health state utilities are derived through the use of vignettes where either hypothetical life-years may be traded off or participants are asked to select the level of risk for a specific treatment failure in return for spending the remaining years in full health for both tasks. These standard approaches to evaluations using general population samples have been previously used to derive health state utilities for rare conditions.13,14
The aim of this study was to derive health state utilities for AADC deficiency using TTO and SG tasks presented to a representative sample of the French general population. The results of the study will be used as inputs to an economic model evaluating the cost-effectiveness of gene therapy for AADC deficiency.
Methods
Sample
Respondents were recruited from a panel maintained by a third party (Qualtrics, Provo, USA). The sample was selected to be representative of the adult population in France. Basic socio-demographic details (age, biological sex (male/female), parental status, and region of residence) were collected from respondents and used to screen for eligibility. Respondents were eligible to participate provided they were a resident of France and aged ≥18 years. In order to reduce any potential bias parents and caregivers of children with life-threatening or life-limiting conditions were not eligible to participate. The study was conducted on an online platform; participants completing the study received a nominal incentive (redeemable points) to complete the study. The study was submitted for review to the University of York’s Health Sciences Research Governance Committee and received ethics approval on 20 March 2020 and was conducted in accordance with the Declaration of Helsinki. Potential participants were provided with information outlining the study and were requested to provide their consent prior to participating. A sample size of N=1000 was estimated to be sufficient to allow robust parameter estimation and allow subgroup analyses.
Vignettes
Five health state vignettes were developed reflecting motor and developmental milestones associated with AADC deficiency. These were based on an ongoing clinical trial investigating gene therapy for AADC deficiency (NCT02926066) and correspond to the economic model being developed to evaluate this therapy. The five health states were as follows: 1. the base health state (“bedridden”); 2. “head control”; 3. “ability to sit unaided”; 4. “standing with support”; and 5. “walking with assistance”. The vignettes comprised descriptions of the main symptoms of AADC deficiency: oculogyric crises, feeding ability, cognitive impairment and screaming. The health states descriptions from the “bedridden” through to the “walking with assistance” health state reflected a gradual, global improvement in AADC deficiency symptoms and milestones. An example of one of the vignettes is shown in Table 1. The development of the vignettes has been described in detail elsewhere.14 The vignettes were developed in a series of steps including a pragmatic literature review; online case stories from AADC deficiency support groups; an advisory board with parents and caregivers of children with AADC deficiency; and an advisory panel with (including French) physicians of patients with AADC deficiency. The initial vignettes were developed in English (for use in a parallel study in the United Kingdom15) and were reviewed by parents and caregivers of children with AADC deficiency and physicians. Following this review, the vignettes were translated into French (by a third-party translation agency, TransPerfect) using a forward-backward translation process. As a final stage, the translated vignettes were reviewed by 4 French physicians from reference centres for the disease.
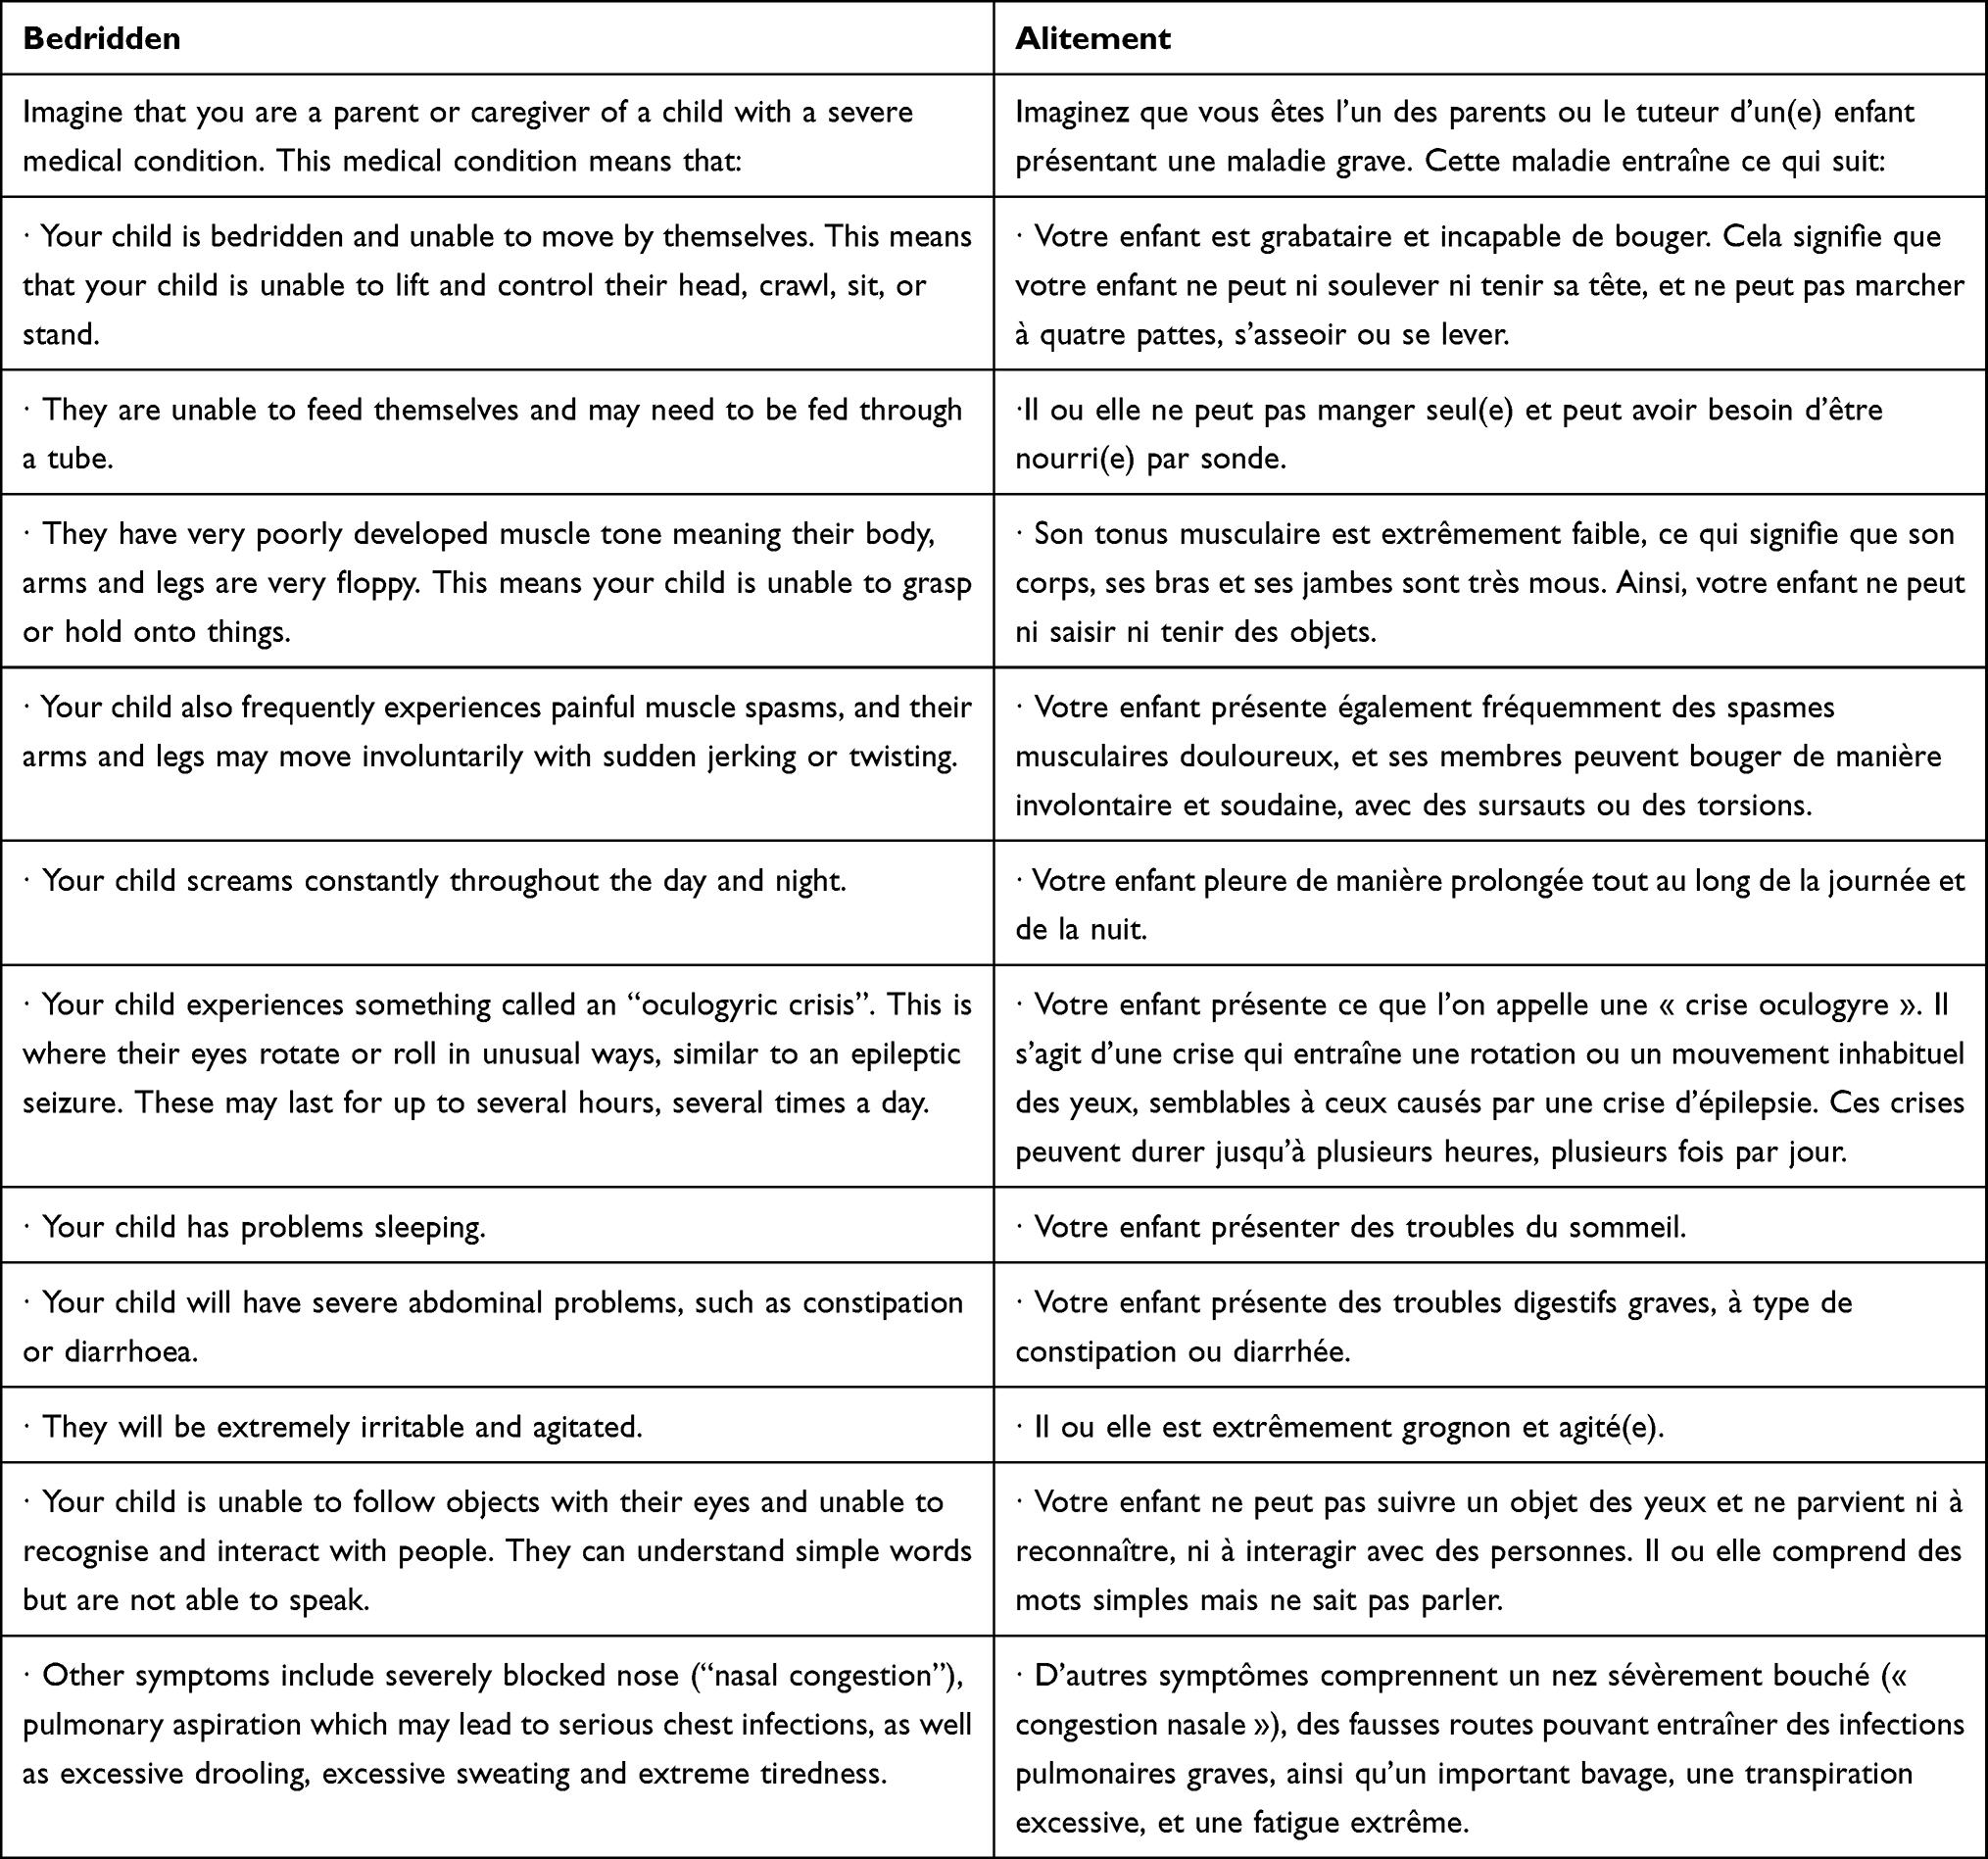 |
Table 1 Example Vignette |
Instruments
Participants completed the proxy-version of the Health Utilities Index 3 (HUI3)16 for the bedridden health state (see Procedure below). The HUI3 is a 15-item preference-based, generic health-related quality of life measure. The instrument comprises 8 attributes: Vision, Hearing, Speech, Ambulation, Dexterity, Emotion, Cognition and Pain. Each of these attributes has 5 to 6 levels. The attributes may be scored to produce single-attribute utilities as well as an overall utility value on a 0 to 1 scale (where 0 is “dead” and 1 is “full health”). The HUI3 has been validated and culturally adapted for use with French speakers.17,18
Recruitment
The survey underwent initial testing with a small sample of participants (N=45). In order to ensure participants were spending a sufficient time reading and considering the vignettes, a time limit for overall completion was set at 6 minutes. This was based on previous results observed in a UK sample.15 Following this, recruitment was conducted over 4 subsequent rounds. Approximately 200 to 250 participants were recruited at each round to ensure the sample strata was as closely representative as possible of the French general population (Supplementary Table 1).
Procedure
As part of the informed consent process, participants were provided with a description of the nature of the study. Participants were also informed that the vignettes reflected the severe nature of the AADC deficiency. Participants were informed they were free to withdraw from the study at any stage. Once they had consented to take part participants were presented with a screening question to ensure that any parent or caregiver of a child with a potentially life-threatening or life-limiting condition was screened out of the study (to minimise any potential bias). The participants were then asked to provide their geographical region in France; their age; biological gender (male, female), highest level of education (Brevet des collegès; CAP/BEP or equivalent, Baccalauréat/Brevet professionnel or equivalent; Supérieur court; and Supérieur long), to record whether they were parents and if so, whether they were parents of a child under the age of 16 (for demographic purposes only; this was not used to screen out participants).
Prior to starting the study tasks, participants were provided with details of the TTO and SG tasks and the response formats. Participants were presented with a number of practice tasks to familiarise themselves with the TTO and SG rating systems. The tasks were then explained to participants: participants were told they would be presented with 5 vignettes describing a hypothetical child with AADC deficiency (Table 1). In responding to each vignette participants were asked to imagine themselves as the parent or caregiver of the child described.
Symptom severity (eg oculogyric crises, sleeping problems, motor skills, etc.) was varied across the five vignettes, ie severity decreased as the health state improved. The TTO time period was set at 10 years, ie participants were told the child had 10 years of life to live in the health state described. Participants were asked to indicate how much of the (hypothetical) child’s life they were willing to trade in order for the child to live the remaining years in full health. For the SG, participants were told there was a cure available to treat the child resulting in perfect health, however, that there was also a risk the treatment could fail leading to the immediate death of the child. Participants were asked to indicate the level of risk of immediate death they were willing to accept. Risk was rated on a scale of 0 to 100 (the higher value reflecting the greater degree of risk participants were willing to accept).
The bedridden health state was presented first. Participants completed the TTO and SG tasks for this health state. Subsequently, they were asked to rate the bedridden state using the HUI3: participants were reminded to consider themselves as parents/caregivers of a child with severe AADC deficiency (in a bedridden state) and asked to then rate that (hypothetical) child’s HRQoL using the HUI3. Following this, the other health states were presented in a random order, and participants were instructed to complete the TTO and SG tasks for each of those health states.
Statistical Analysis
The data were collected on an MS Excel spreadsheet and transferred into SPSS (IBM SPSS Statistics, version 25). The health state utilities were derived by subtracting the participants’ response from 10 (TTO) and 100 (SG), and dividing the result by 10 and 100, respectively. This meant that the highest possible health state utility value was 1 (perfect health) and the lowest 0. No health state could be rated as worse than dead. The HUI3 scores were converted to utility values using the developers’ manual (Health Utilities Inc., 2001–2019; http://www.healthutilities.com/manual.htm).
Descriptive statistics (mean, standard deviation (SD) and 95% confidence intervals (95% CI)) were generated for the utilities (TTO, SG) for each health state and across the sociodemographic categories. Descriptive statistics were also calculated for the HUI3 for the bedridden health state and by sociodemographic categories. Independent samples t-tests were used to evaluate differences for continuous variables (eg completion time and mean health state utilities) by sociodemographic categories (parental status, gender and education). A one-way within-subjects analysis of variance (ANOVA) was used to evaluate differences in overall health state utilities between the vignettes (both TTO and SG).
Results
Participants – Total Sample
A total of 1001 participants completed the study. The sociodemographic details are shown in Table 2. The sample was representative of the French population in terms of age, gender, regions and level of education (Supplementary Table 1). There were approximately equal numbers of females and males. The average age of the sample was 45.7 years (standard deviation (SD) 16.78). The most represented regions in France were Ile-de-France (18.88%) and Auvergne-Rhone-Alpes (12.48%). Approximately a third of participants (35%) were parents of children under the age of 16; however, none were parents of children with a severe medical condition. The average completion time was 19 minutes (SD 41.44 minutes).
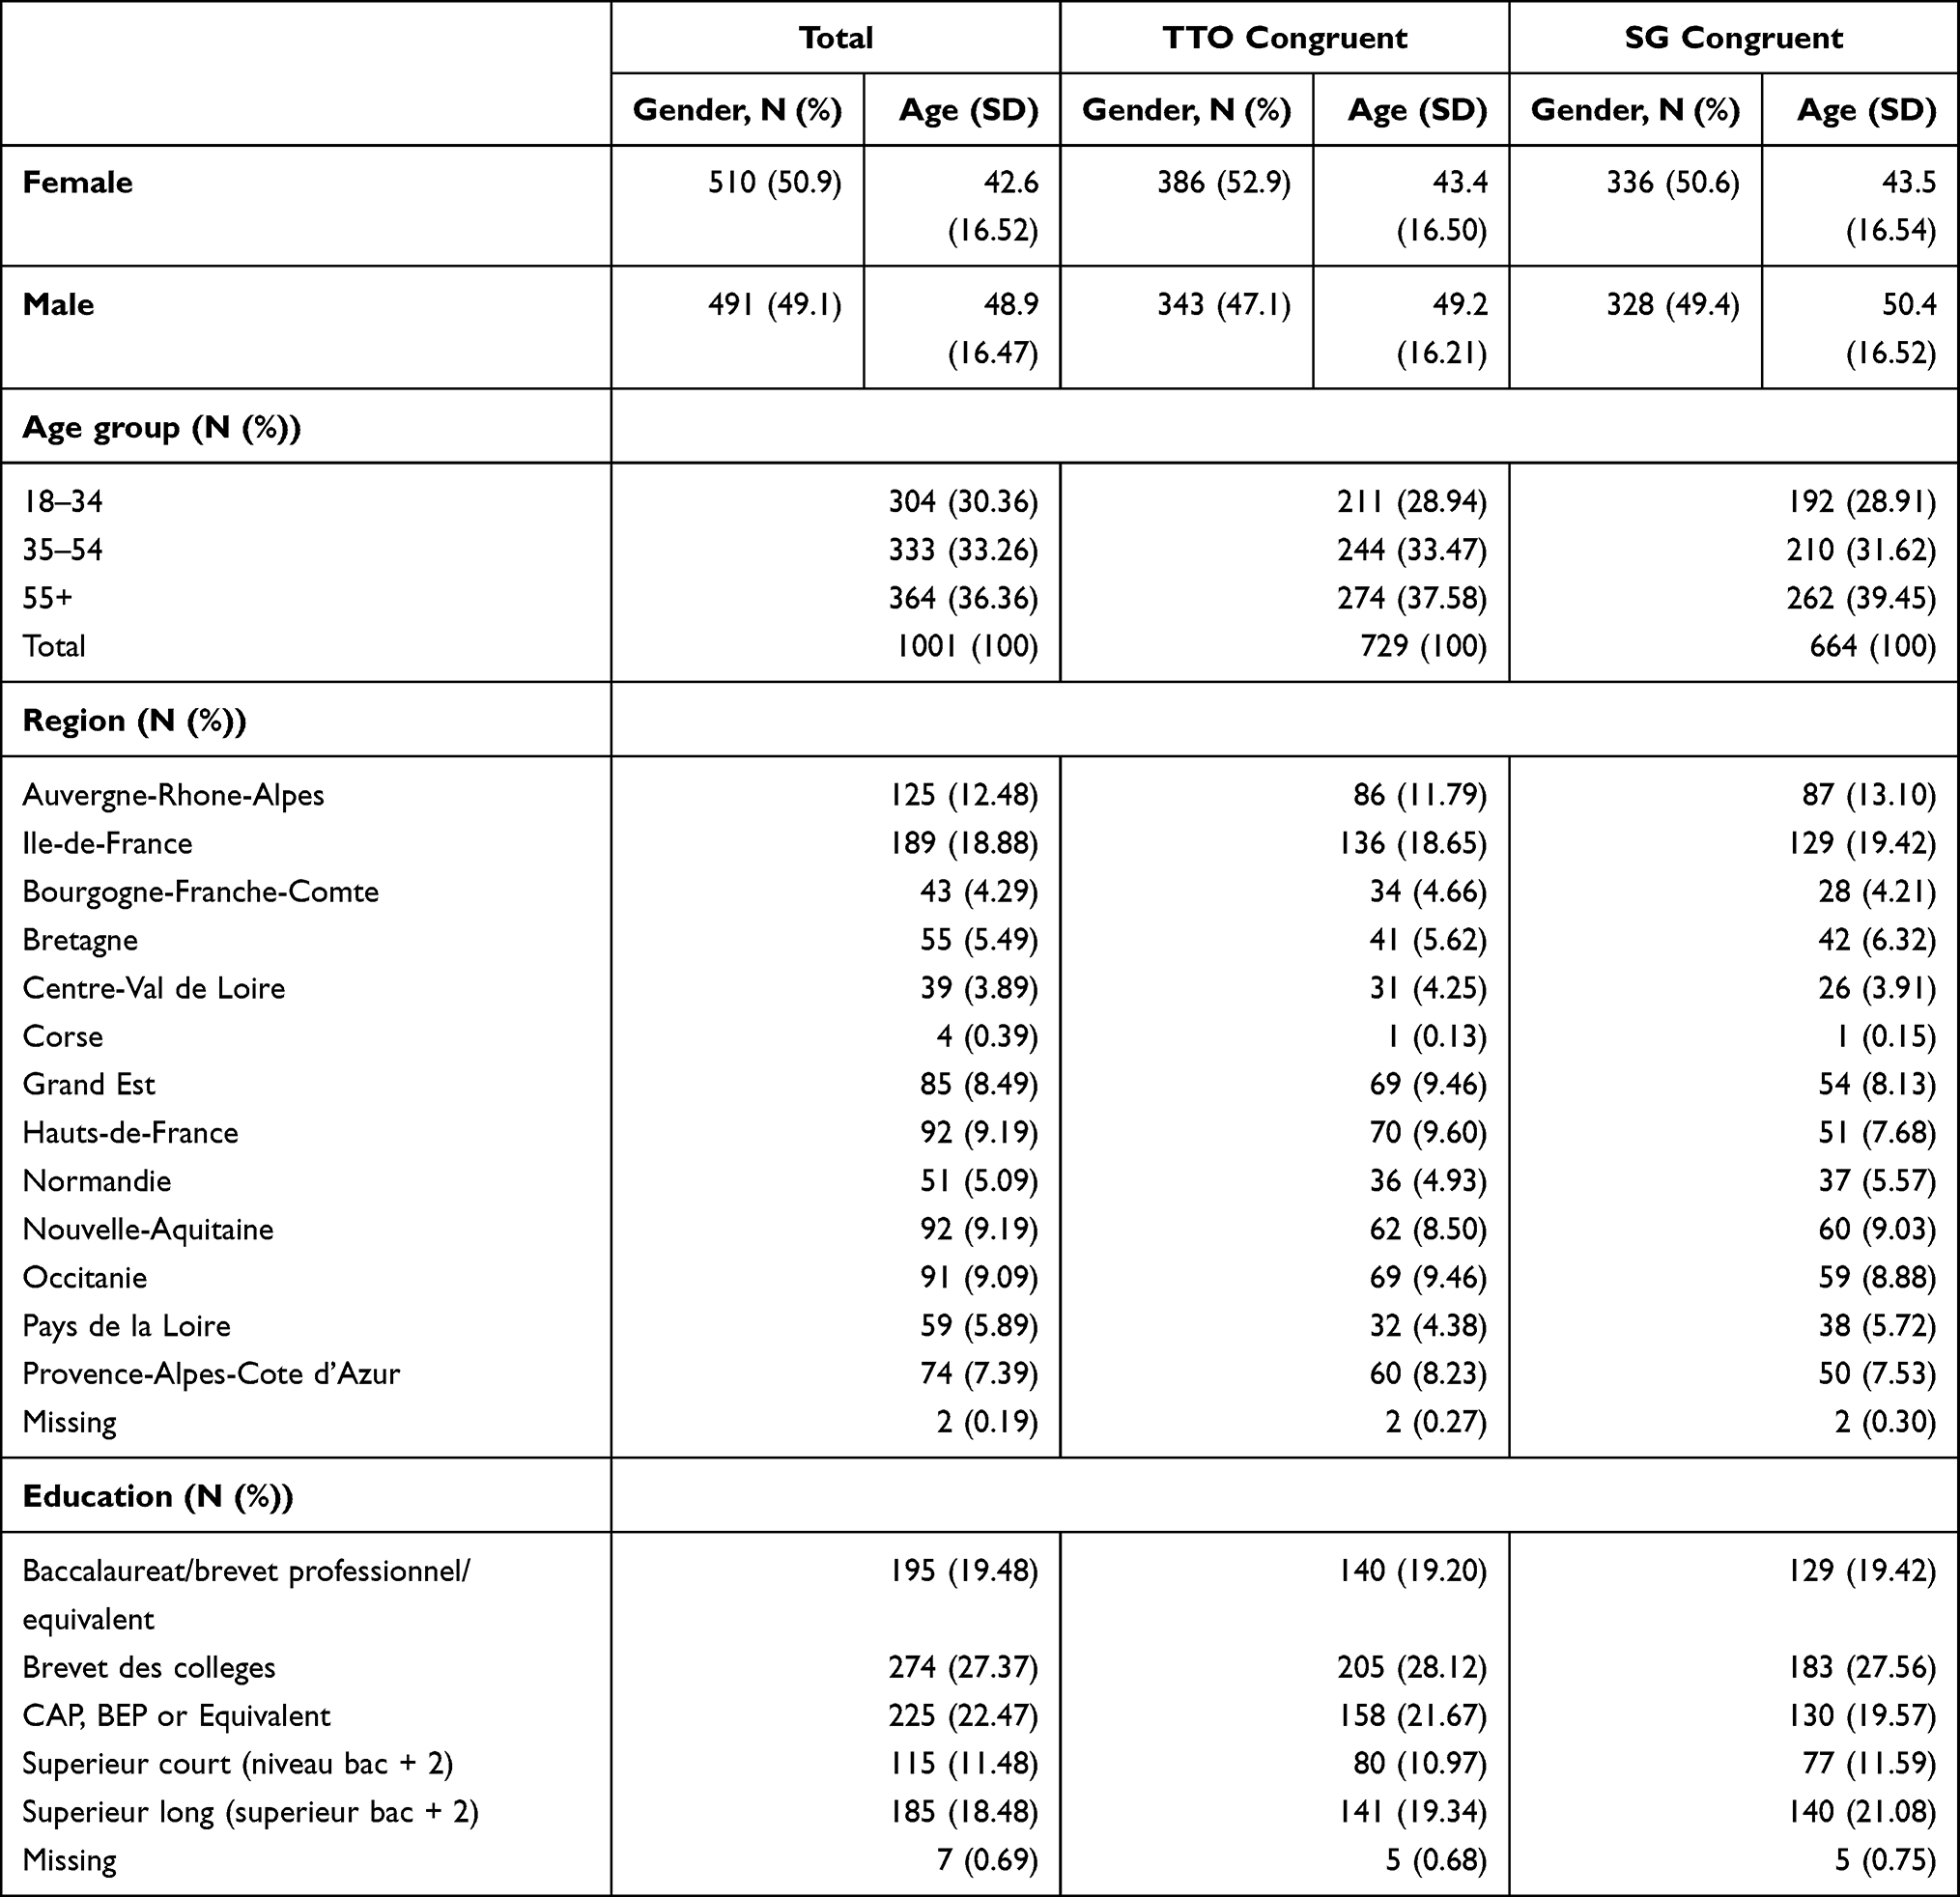 |
Table 2 Sociodemographic Details |
Congruence
Although the majority of participants recorded logically consistent responses, incongruent responses were observed for both tasks. For the purposes of this study an incongruent response was defined as a participant recording a utility value for the worst health state (“bedridden”) which was greater than that for the best health state (“walking with assistance”): 27.2% and 33.7% for the TTO and SG tasks, respectively, were incongruent. For the TTO tasks, participants with incongruent responses completed the task in less time (15.18 minutes (SD 19.55) than those with congruent responses (19.87 minutes (SD 48.22). However, this difference was not statistically significant (t (1999) = 1.56, p = 0.12). A similar result was observed for the SG task (17.77 minutes (SD 48.69) versus 19 minutes (SD 38.90)) (t (1999)= 0.44, p = 0.66). Those participants with incongruent responses were subsequently removed from the analysis. The sociodemographic details for those participants with TTO-congruent and those with SG-congruent responses are shown in Table 2. These details closely match the overall sample in terms of age group, geographical region and education levels.
HUI3 Values
The mean values for the HUI3 for the “bedridden” health state are shown in Table 3. The mean global HUI3 utility values were 0.5263 (SD 0.4123) and 0.4924 (SD 0.4198) for the TTO and SG tasks, respectively.
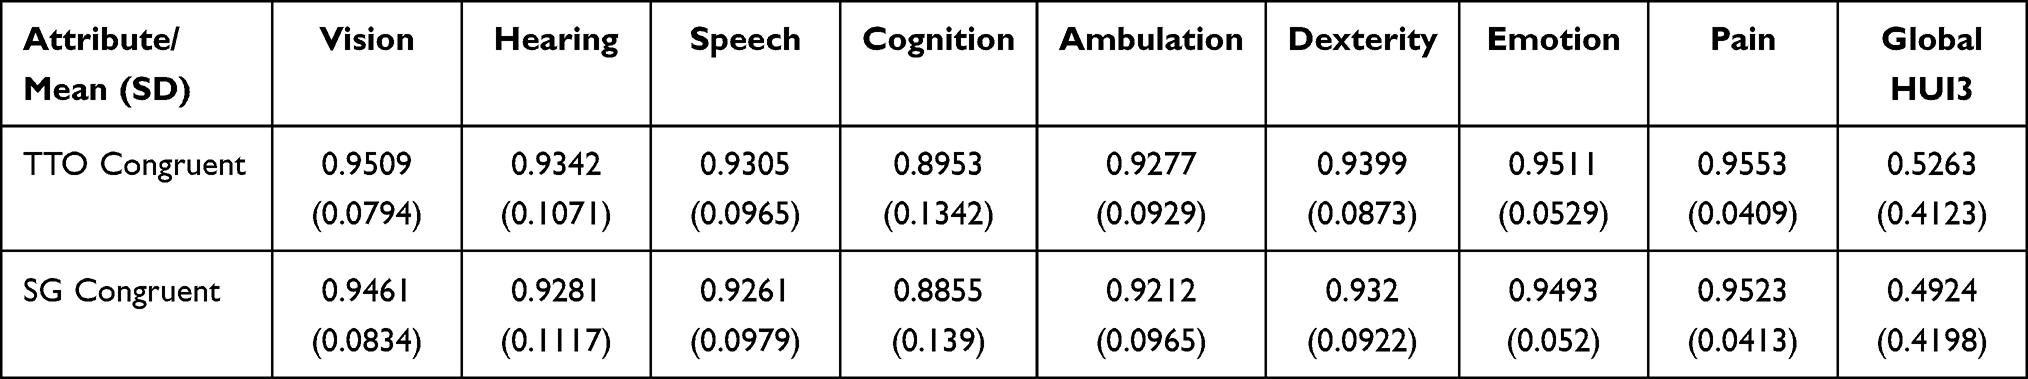 |
Table 3 HUI3 Values |
Health State Utilities
The mean health state utilities are presented in Table 4. For both the TTO and SG tasks, the mean utility values increased as the health state improved (ie as the severity of symptomatology decreased). The mean health state utilities were greater for the SG task compared to the TTO. There was little or no differentiation between the “head control” and “sitting unaided” health states for both tasks. The largest difference in utility values was observed between the “bedridden” and “head control” health states, which was approximately 0.09 and 0.07, respectively, for the TTO and SG tasks. There was an overall main effect for mean health state utilities, that is to say that difference in mean health state utilities was statistically significant for both the TTO (F (4,2918) = 130.56, p<0.0001) and SG (F (4,2652) = 134.99, p<0.0001) tasks.
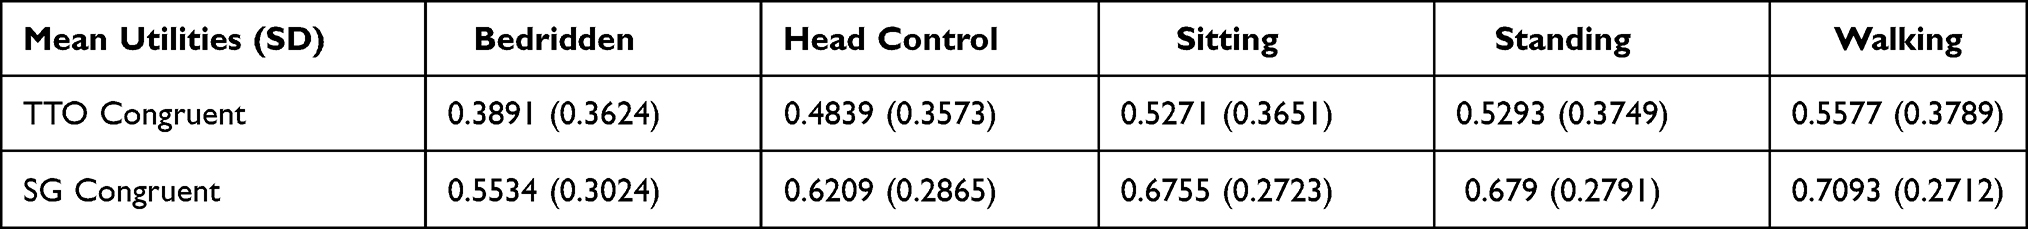 |
Table 4 Mean Health State Utilities |
Health States by Sociodemographic Categories
Gender
The mean health utilities by gender are shown in Table 5. For the TTO congruent responses, the mean utility values were consistently lower for each health state for females compared to the corresponding value for male participants. Mean health utilities did, however, increase across the states for both groups in line with the decrease in severity. Only the difference in mean utility value for the “bedridden” health was statistically significant (F (1727) = 4.37, p=0.037). The reverse pattern was observed for the SG task with higher mean utility values for female participants. Mean utility values for the “sitting” (F (1662) = 7.83, p = 0.005), “standing with assistance” (F (1662) = 8.251, p = 0.004) and “walking with assistance” (F (1662) = 8.12, p = 0.005) were all statistically different.
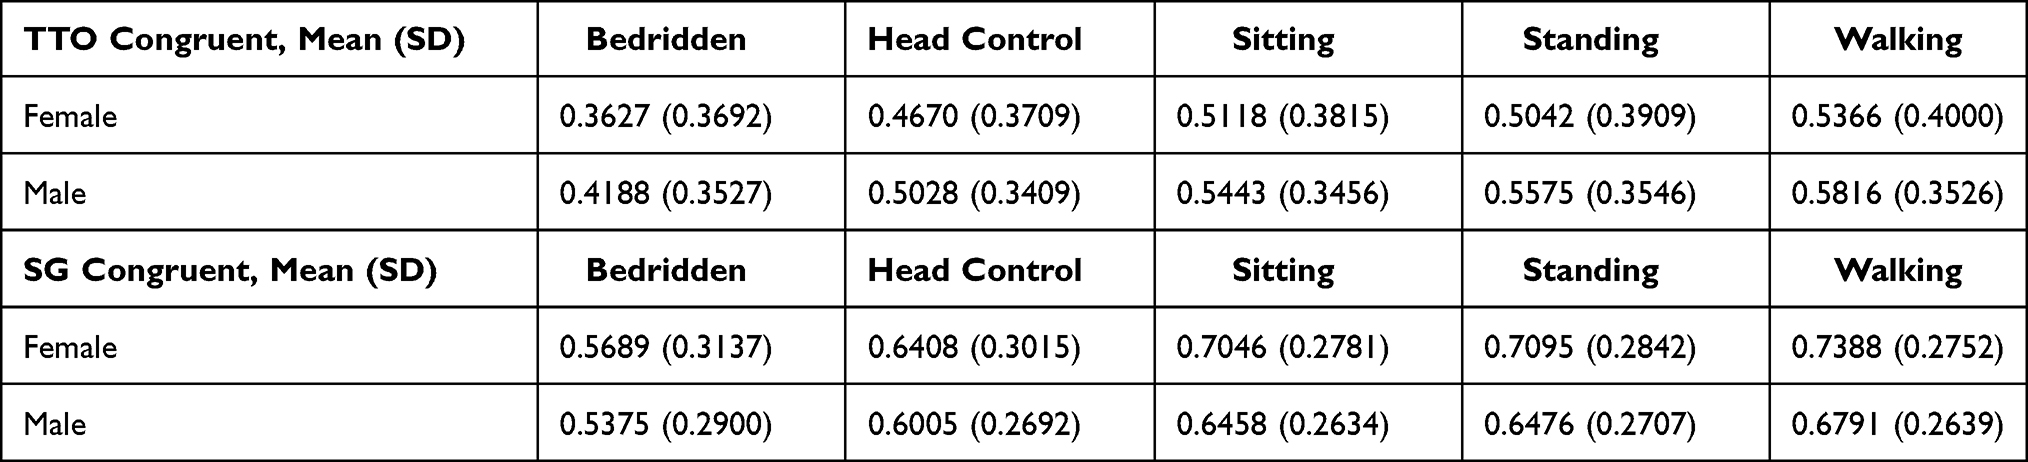 |
Table 5 Mean Health State Utilities by Gender |
Parental Status
For the TTO task, mean utility values were lower for those participants who were parents compared to those who were not, although, again, for both groups the utilities increased as health states improved (Table 6). All of these were statistically different: “bedridden” F (1727) = 6.86, p = 0.009; “head control” F (1727) = 7.72, p = 0.006; “sitting unaided” F (1727) = 7.11, p = 0.006; “standing with assistance” F (1727) = 8.53, p = 0.004; and “walking with assistance” F (1727) = 11.67, p = 0.001.
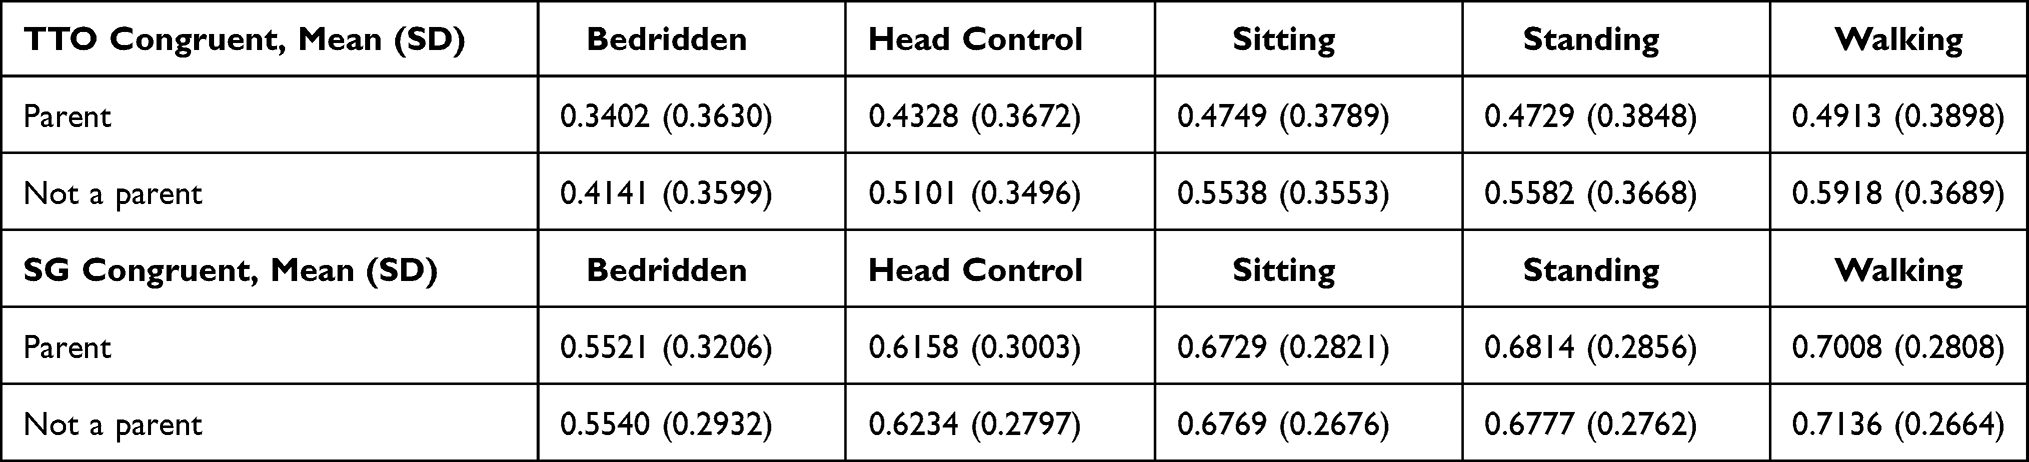 |
Table 6 Mean Health Utilities by Parental Status |
This pattern was not evident for the SG task with little or no differences observed between the two groups of participants. None of these were statistically significant.
Educational Status
For the TTO task (Table 7) and educational status, the overall pattern was similar to that observed for gender and parental status with an increase in mean utilities in line with the health states. Participants with higher levels of education (Supérieur court and long) tended to value all health states better than the other participants with, for instance, a difference in mean utilities of around 0.10 between the “baccalauréat” and “supérieur court” groups for both the worst and best health state. All differences observed between the education groups were statistically significant for each health state (p<0.05).
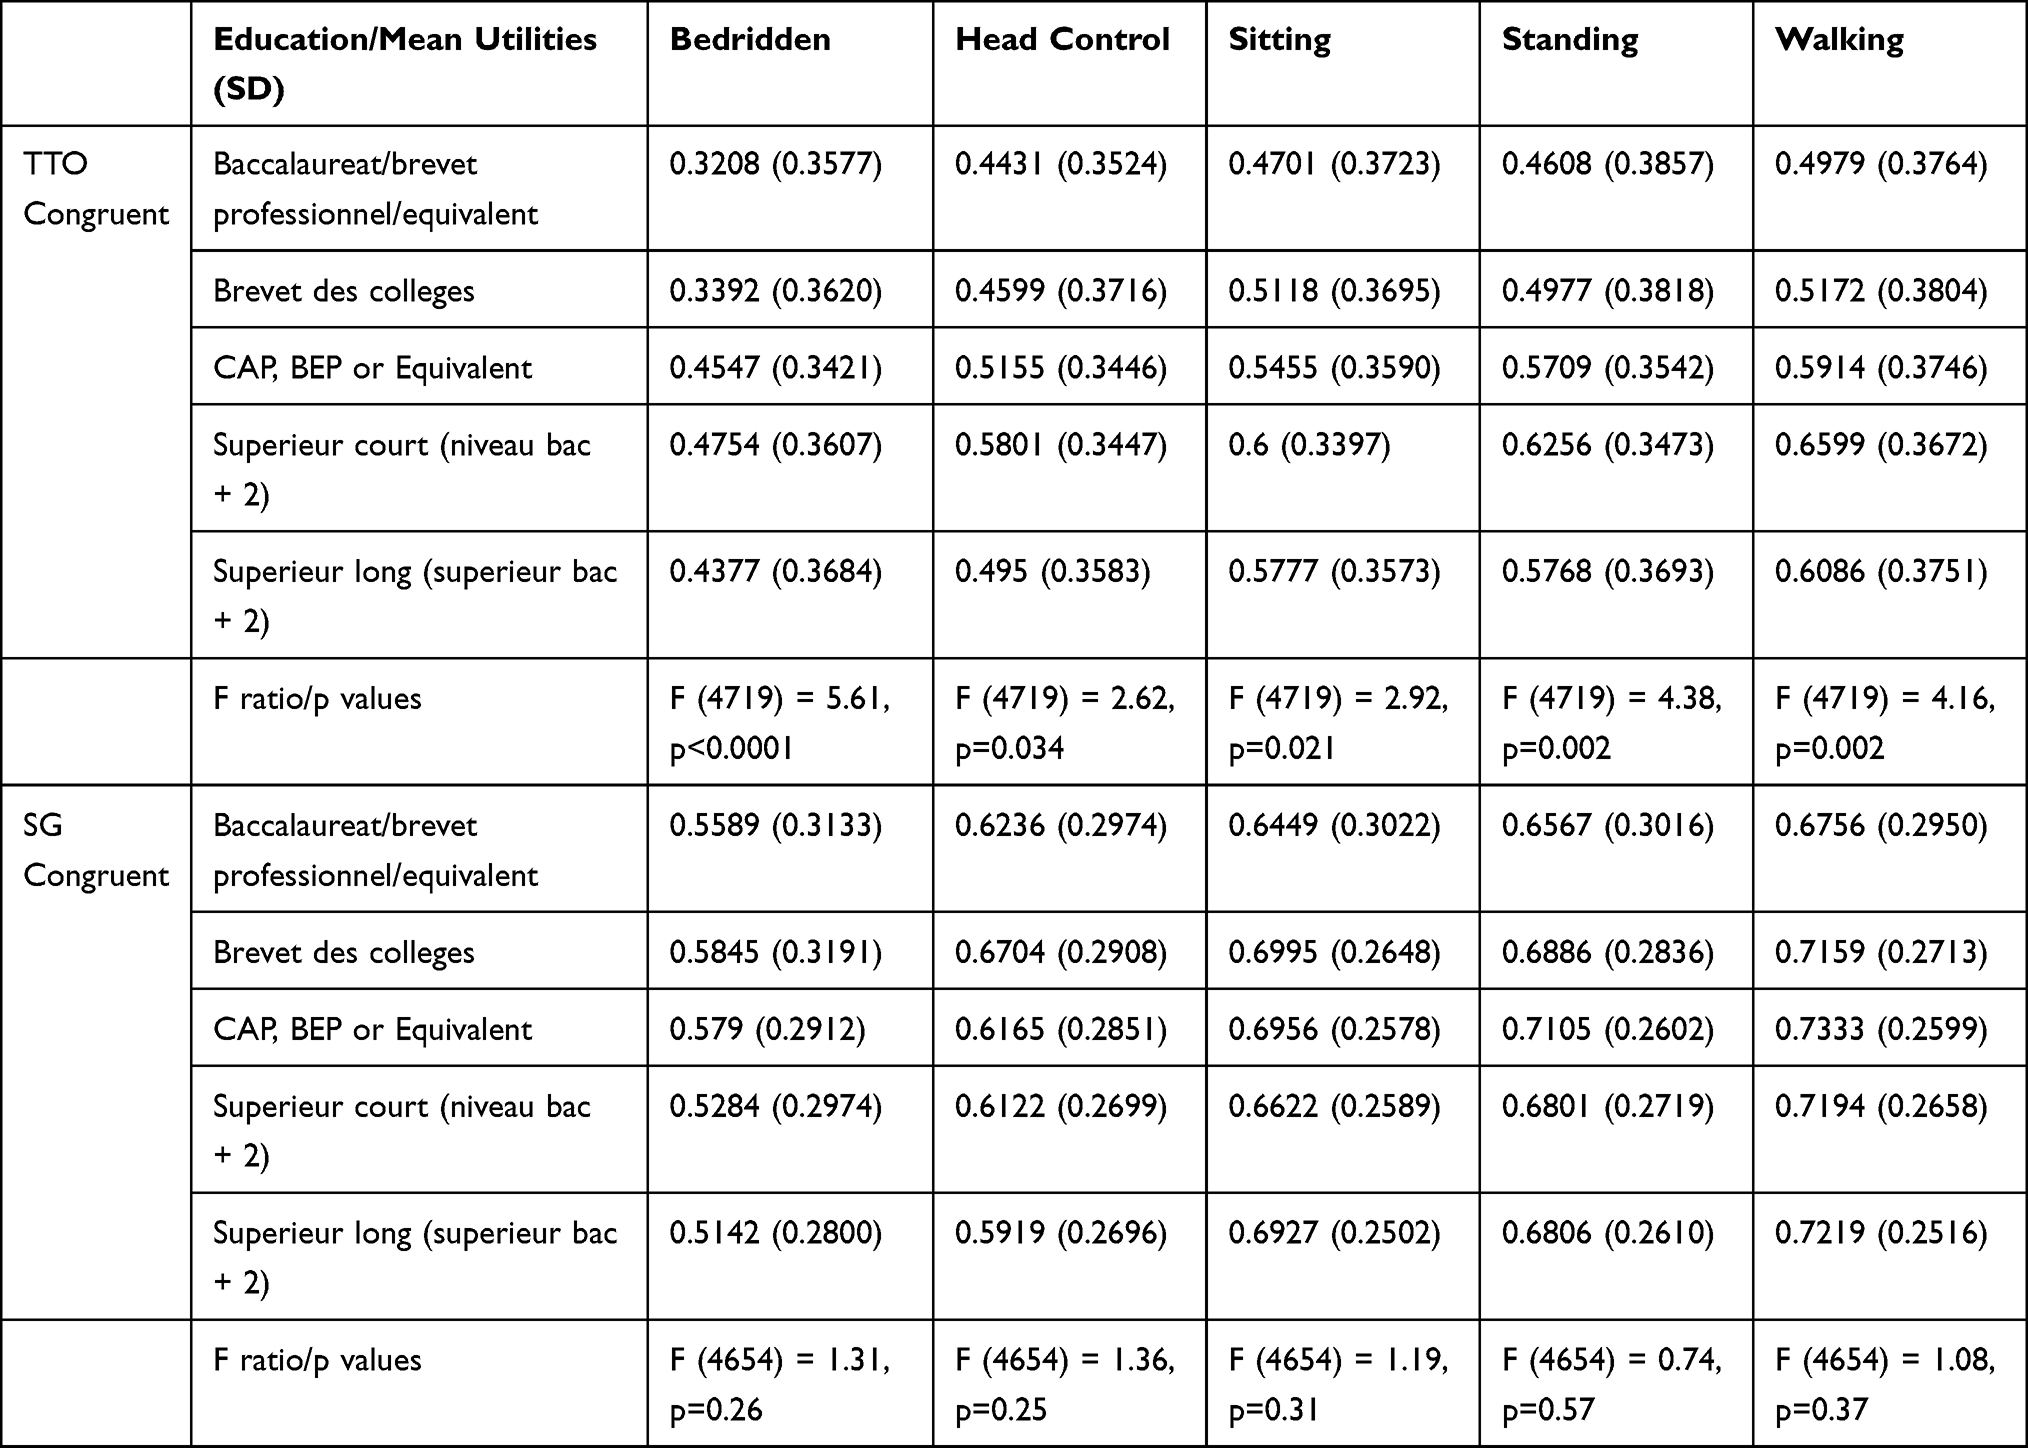 |
Table 7 Mean Health Utilities by Education Status |
The overall pattern for the SG task and educational status was similar to that for the TTO task. However, for this task, higher mean utilities were recorded for those participants with the least amount of formal education for the bedridden health state. None of these differences were statistically significant.
Discussion
The aim of this study was to derive health state utilities for patients with AADC deficiency using a sample representative of the French population. The results demonstrated that mean health state utilities increased moving from the most severe (“bedridden”) to the least severe (“walking with assistance”) health states for both the TTO and SG tasks. The largest mean differences observed were between the two “worst” health states. Furthermore, participants were not able to clearly differentiate between “sitting unaided” and “standing with assistance”. However, overall, there was a large difference around 0.17 and 0.15 between the “worst” and “best” health state for the TTO and SG tasks, respectively. The SG utilities were higher than the corresponding TTO health state utilities. This has been reported in the literature19,20 and may reflect a difficulty in appraising and processing probabilities.21 Similarly, the HUI3 overall mean – which reflected the worst, bedridden, health state was relatively high (0.5263) for the TTO congruent responses. This was, for instance, equivalent to the mean utilities for the “sitting unaided” (0.5271) and “standing with assistance” (0.5293) health states on the TTO tasks. This may reflect participants’ difficulty in translating the health state descriptions onto the HUI3 system. However, the corresponding mean utilities for the SG congruent responses on the HUI3 (0.4924) were lower and fell below the mean utility worst health state on the SG task (0.5534). The higher values for the TTO responses may therefore also reflect both a facet of the differences between the TTO and SG tasks, as well as potential issues (experienced by participants) in translating health states onto the HUI3. It should also be noted that the HUI3 has not (to the authors’ knowledge) previously been applied in an AADC deficiency context, nor had the appropriateness of the instrument been evaluated by the parents or caregivers involved in developing the vignettes. The relatively higher mean utilities on the HUI3 may therefore also be reflective of this.
Some differences were also observed for the sociodemographic groups. For instance, lower mean utility values were observed for female participants for each health state in the TTO tasks; whereas the opposite was observed for the SG tasks with males having lower mean utilities. There may, therefore, be a gender bias. However, published results are mixed with some studies suggesting female participants demonstrate greater risk aversion on the standard gamble task (as evidenced by higher mean utilities),22 whereas others have suggested females are more likely to be risk neutral.23 Participants who were parents also had lower mean utility values for each health state on the TTO task. Some of these differences were statistically significant suggesting that sociodemographic categories may impact on utility evaluations. However, the results were considered collectively from this large, representative French sample showed an increase in the utility values as the health states improved.
There are some potential study limitations that need to be addressed. The first being the incongruent responses defined, in this study, as higher utility values for the “worst” health state compared to the “best” health state. Inconsistencies of this magnitude have been reported in the literature for both TTO and SG tasks24,25 and have been shown to be the result of a combination of task and respondent characteristics.26 An analysis of the responses indicated that participants with logically inconsistent responses took less time to complete the study. However, there was a non-statistically significant difference in the average time to completion and given that participants with non-congruent responses were taking on average 15 minutes to complete the study, this does suggest participants were considering their responses carefully. A further post hoc analysis was undertaken to investigate potential predictors of incongruent responses. Multivariate logistic regression analyses were undertaken for both TTO and SG incongruent responses including gender, parental and educational status (categorical) and completion time and age (continuous) as variables. Only gender was a statistically significant predictor for TTO incongruent responses (beta = 0.338, standard error (SE) = 0.15, p=0.025), suggesting that male gender was more predictive of incongruent TTO responses. However, this was not observed for SG incongruent responses (beta=0.036, SE = 0.142, p=0.80), although educational status was a significant predictor: specifically, the lowest level of education (Brevet) achieved was statistically significant relative to the highest educational level (beta = 0.838, SE = 0.22, p<0.0001).
One other potential limitation was the fact that the vignettes reflected global milestone and symptom improvement, which meant that it was not possible to identify the contribution of each symptom or milestone to the health state utilities. Further work is needed to determine the exact drivers of the health state utilities.
Conclusion
In conclusion, health state utilities were derived for AADC deficiency from a large sample size representative of the French adult population. Health state utilities increased as severity of symptoms decreased, and as various motor milestones improved.
Further research is required to determine the exact drivers in terms of the symptoms and milestones impacting the most on the health state utilities. To the authors’ knowledge this is the first study of its kind to generate health state utilities for patients suffering from AADC deficiency using a sample of the French population. This study builds on the results from AADC deficiency vignette study in the UK.14,15 These robust data will be utilised in a health-economic evaluation of a gene therapy for AADC deficiency.
Acknowledgments
The authors are very grateful to the parents and caregivers who gave their time and insights, as well as to the clinicians who helped shape the vignettes.
Funding
The study was funded by PTC Therapeutics.
Disclosure
KB, FH and IBOZ are employees of PTC Therapeutics or work under contract for PTC Therapeutics. GdP received an honorarium from PTC Therapeutics. York Health Economics Consortium (ABS and AH) was commissioned by PTC Therapeutics to undertake the study. The authors report no other conflicts of interest in this work.
References
1. Wassenberg T, Molero-Luis M, Jeltsch K, et al. Consensus guideline for the diagnosis and treatment of aromatic l-amino acid decarboxylase (AADC) deficiency. Orphanet J Rare Dis. 2017;12:12. doi:10.1186/s13023-016-0522-z
2. Kojima K, Nakajima T, Taga N, et al. Gene therapy improves motor and mental function of aromatic l-amino acid decarboxylase deficiency. Brain. 2019;142:322–333. doi:10.1093/brain/awy331
3. Hyland K, Reott M. Prevalence of aromatic l-amino acid decarboxylase deficiency in at-risk populations. lPediatr Neurol. 2020;106:38–42. doi:10.1016/j.pediatrneurol.2019.11.022
4. Dolan P. Modeling valuations for EurQol health states. Med Care. 1997;35:1095–1108. doi:10.1097/00005650-199711000-00002
5. Janssen M, Birnie E, Bonsel G. Quantification of the level descriptors for the standard EQ-5D three level system and a five level version according to 2 methods. Qual Life Res. 2008;17:463–473. doi:10.1007/s11136-008-9318-5
6. Herdman M, Gudex C, Lloyd A, et al. Development and preliminary testing of the new five-level version of EQ-5D (EQ-5D-5L). Qual Life Res. 2011;20:1727–1736. doi:10.1007/s11136-011-9903-x
7. Feeny D, Furlong W, Boyle M, Torrance GW. Multi-attribute health status classification systems: health utilities index. Pharmacoeconomics. 1995;7(6):490–502. doi:10.2165/00019053-199507060-00004
8. Landfeldt E, Lindgren P, Bell CF, et al. Health-related quality of life in patients with Duchenne muscular dystrophy: a multinational, cross-sectional study. Dev Med Child Neurol. 2016;58:508–515. doi:10.1111/dmcn.12938
9. Lloyd AJ, Thompson R, Gallop K, Teynor M. Estimation of the quality of life benefits associated with treatment for spinal muscular atrophy. Clinicoecon Outcomes Res. 2019;11:615–622. doi:10.2147/CEOR.S214084
10. Landfeldt E, Lindberg C, Sejersen T. Improvements in health status and utility associated with ataluren for the treatment of nonsense mutation Duchenne muscular dystrophy. Muscle Nerve. 2020;61:363–368. doi:10.1002/mus.26787
11. Pickard AS, Knight SJ. Proxy evaluation of health-related quality of life: a conceptual framework for understanding multiple proxy perspectives. Med Care. 2005;43:493–499. doi:10.1097/01.mlr.0000160419.27642.a8
12. Torrance GW. Measurement of health state utilities for economic appraisal. J Health Econ. 1986;5:1–30. doi:10.1016/0167-6296(86)90020-2
13. Smith AB, Retzler J, Taylor MJ. Standard gamble to derive utility health states for limbal stem cell deficiency. Clinicoecon Outcomes Res. 2020;12:535–546. doi:10.2147/CEOR.S251918
14. Hanbury A, Smith AB, Buesch K. Deriving vignettes for the rare disease AADC using parent, caregiver and clinician interviews to evaluate the impact on health-related quality of life. Patient Relat Outcome Meas. 2021;12:1–12. doi:10.2147/PROM.S278258
15. Smith AB, Hanbury A, Buesch K. A vignette study to derive health state utilities for aromatic l-amino acid decarboxylase (AADC) deficiency in the United Kingdom. (under review). Patient Rep Outcomes.
16. Feeny DH, Furlong WJ, Torrance GW, et al. Multi-attribute and single-attribute utility functions for the health utilities index mark 3 system. Med Care. 2002;40:113–128. doi:10.1097/00005650-200202000-00006
17. Costet N, Le Galès C, Buron C, et al. French cross-cultural adaptation of the Health Utilities Indexes Mark 2 (HUI2) and 3 (HUI3) classification systems. Clinical and Economic Working Groups. Qual Life Res. 1998;7:245–256. doi:10.1023/A:1008830115246
18. Le Galès C, Buron C, Costet N, Rosman S, Slama G. Development of a preference-weighted health status classification system in France: the health utilities index 3. Health Care Manag Sci. 2002;5:41–51. doi:10.1023/A:1013201102918
19. Bleichrodt H, Johannesson M. Standard gamble, time trade‐off and rating scale: experimental results on the ranking properties of QALYs. J Health Econ. 1997;16:155–175. doi:10.1016/S0167-6296(96)00509-7
20. Torrance GW. Toward a utility theory foundation for health status index models. Health Serv Res. 1976;11:349.
21. Torrance GW, Thomas WH, Sackett DL. A utility maximization model for evaluation of health care programs. Health Serv Res. 1972;7:118–133.
22. Obaidi LA, Jörg Mahlich J. A potential gender bias in assessing quality of life - a standard gamble experiment among university students. Clinicoecon Outcomes Res. 2015;7:227–233. doi:10.2147/CEOR.S84065
23. Warshawsky-Livne L, Novack L, Rosen AB, Downs SM, Shkolnik-Inbar J, Pliskin JS. Gender differences in risk attitudes. Adv Health Econ Health Serv Res. 2014;24:123–140.
24. Ock M, Lim SY, Lee HJ, Kim SH, Jo MW. Estimation of utility weights for major liver diseases according to disease severity in Korea. BMC Gastroenterol. 2017;17:103. doi:10.1186/s12876-017-0660-3
25. Kim SH, Lee SI, Jo MW. Feasibility, comparability, and reliability of the standard gamble compared with the rating scale and time trade-off techniques in Korean population. Qual Life Res. 2017;26:3387–3397. doi:10.1007/s11136-017-1676-4
26. Yang Z, van Busschbach J, Timman R, Janssen MF, Luo N. Logical inconsistencies in time trade-off valuation of EQ-5D-5L health states: whose fault is it? PLoS One. 2017;12:e0184883. doi:10.1371/journal.pone.0184883
 © 2021 The Author(s). This work is published and licensed by Dove Medical Press Limited. The
full terms of this license are available at https://www.dovepress.com/terms
and incorporate the Creative Commons Attribution
- Non Commercial (unported, 3.0) License.
By accessing the work you hereby accept the Terms. Non-commercial uses of the work are permitted
without any further permission from Dove Medical Press Limited, provided the work is properly
attributed. For permission for commercial use of this work, please see paragraphs 4.2 and 5 of our Terms.
© 2021 The Author(s). This work is published and licensed by Dove Medical Press Limited. The
full terms of this license are available at https://www.dovepress.com/terms
and incorporate the Creative Commons Attribution
- Non Commercial (unported, 3.0) License.
By accessing the work you hereby accept the Terms. Non-commercial uses of the work are permitted
without any further permission from Dove Medical Press Limited, provided the work is properly
attributed. For permission for commercial use of this work, please see paragraphs 4.2 and 5 of our Terms.