Back to Journals » Diabetes, Metabolic Syndrome and Obesity » Volume 15
Elevated Serum Osteoprotegerin is Associated with Reduced Risks of Albuminuria and CKD Progression in Patients with Type 2 Diabetes
Authors Lou X, Yang Z, Wu K, Li W, Hu W, Nie R, Tu P, Duan P
Received 19 September 2022
Accepted for publication 26 November 2022
Published 12 December 2022 Volume 2022:15 Pages 3831—3841
DOI https://doi.org/10.2147/DMSO.S390483
Checked for plagiarism Yes
Review by Single anonymous peer review
Peer reviewer comments 2
Editor who approved publication: Prof. Dr. Antonio Brunetti
Xiaoyang Lou,1,2,* Zhi Yang,1,* Kexia Wu,1,* Weihong Li,1 Wan Hu,1 Ronghui Nie,1,3 Ping Tu,1 Peng Duan1
1Department of Endocrinology and Metabolism, The Third Hospital of Nanchang, Nanchang, Jiangxi, People’s Republic of China; 2Department of Postgraduate Studies, Jiangxi University of Traditional Chinese Medicine, Nanchang, Jiangxi, People’s Republic of China; 3Third Clinical School of Medicine, Jiangxi Medical College of Nanchang University, Nanchang, Jiangxi, People’s Republic of China
*These authors contributed equally to this work
Correspondence: Peng Duan, Department of Endocrinology and Metabolism, The Third Hospital of Nanchang, Nanchang, Jiangxi, 330000, People’s Republic of China, Tel +86 13479111177, Email [email protected]
Objective: To analyze the correlation between serum osteoprotegerin (OPG) level and chronic kidney disease (CKD) at different CKD stages in patients with type 2 diabetes.
Methods: All subjects were hospitalized patients with type 2 diabetes. Medical history collection, physical examinations, and blood and urine samples testing were performed. Stages of CKD (G1– 5) were defined by eGFR, groups of persistent albuminuria (normal, microalbuminuria and massive albuminuria) were divided by UACR, and categories of CKD progression risks (low, moderate and high or very high risk) were recommended by the Kidney Disease: Improving Global Outcomes (KDIGO). Serum OPG level was determined by enzyme-linked immunosorbent assay in the central laboratory.
Results: Four hundred and eighty-four patients were included in the study. The average level of OPG of all subjects was 941.30 (547.53– 1332.62) pg/mL. The levels of OPG decreased gradually with the aggravation of albuminuria (P = 0.007, P for trend=0.003) and CKD progression (P = 0.001, P for trend=0.001). No differences were found between OPG levels and stages of CKD (P = 0.31). After the adjustment, each 100 pg/mL increase in OPG levels could reduce the risk of massive albuminuria (OR 0.92, 95% CI 0.86– 0.99, P = 0.02) and the high or very high risk of CKD progression (OR 0.94, 95% CI 0.89– 0.99, P = 0.04) by multivariate logistic regression analysis. No correlations were found between OPG and stages of CKD.
Conclusion: In patients with type 2 diabetes, elevated serum osteoprotegerin is associated with albuminuria and the risk of CKD progression, and may delay the progression of CKD.
Keywords: osteoprotegerin, chronic kidney disease, type 2 diabetes mellitus, albuminuria, glomerular filtration rate
Introduction
In recent years, chronic kidney disease (CKD) has emerged as one of the major diseases endangering human health, which is prone to end-stage renal disease (ESRD) and cardiovascular disease.1,2 CKD is characterized by chronic renal structural changes and dysfunction caused by various reasons.3 In clinical practice, urinary albumin/creatinine ratio (UACR) is usually used to determine persistent albuminuria in patients with CKD, and estimated glomerular filtration rate (eGFR) is used to classify the stages of CKD. Furthermore, KDIGO (Kidney Disease: Improving Global Outcomes) Clinical Practice Guideline suggested that the prognosis of CKD could be predicted by a combination of eGFR and albuminuria categories, and provided a guide to the frequency of monitoring.4 Nowadays, with the increase of the prevalence of diabetes, the number of CKD patients inevitably increases. However, only about 5% of them retain normal renal function.5 Diabetic kidney disease (DKD) has become a major cause of CKD and ESRD.6
Osteoprotegerin (OPG) is a soluble secreted glycoprotein of the tumor necrosis factor (TNF) receptor superfamily. It mainly inhibits osteoclast activation through OPG/RANK/RANKL [osteoprotegerin/receptor activator of nuclear factor-κB (NF-κB)/receptor activator of NF-κB ligand] system and plays an important role in bone metabolism. OPG is dominantly produced by osteoblasts and vascular endothelial cells in vivo, and can also be secreted by heart, liver, kidney and other organs. Therefore, in addition to participating in bone metabolism, OPG has also been found to play a role in cardiovascular disease, diabetes and its complications.7,8 Our previous study has revealed that serum OPG levels are significantly elevated in both pre-diabetic and type 2 diabetic patients.9 Other studies have shown that OPG can be expressed in the kidneys.8 It was suggested that the proportion of decreased eGFR was higher in DKD patients with high OPG level, and the risk of progression to ESRD was significantly increased.10 The plasma OPG level was also obviously higher in type 2 diabetic patients with microalbuminuria than that in patients without albuminuria.11 However, the relationship between OPG level and different stages of CKD in patients with type 2 diabetes, especially its relationship with the risk of CKD progression, remains to be explored.
Based on these backgrounds, this study used albuminuria and eGFR categories separately, and combined UACR and eGFR for CKD progression risk classification according to the KDIGO guideline to analyze the correlation between OPG levels and CKD in patients with type 2 diabetes.
Methods
Subjects
A total of 484 subjects with type 2 diabetes were included in this study for analysis, who were hospitalized in the Department of Endocrinology and Metabolism of the Third Hospital of Nanchang from February 2018 to November 2020. All subjects met the diagnostic criteria for type 2 diabetes.12 Subjects aged 18 years and above. They all participated in the study voluntarily and signed a written informed consent at admission. Exclusion criteria were as follows: (1) other types of diabetes; (2) participants having acute complications of diabetes; (3) those with severe primary diseases of the heart, brain, and hematopoietic system or malignant tumors; (4) subjects with acute renal failure or dialysis or renal transplantation; (5) patients with incomplete clinical data or psychiatric disorders.
Data Collection
General information was routinely collected from the patients, including gender, age, duration of diabetes, medical history, and current smoking and drinking behavior. Standardized measurements of height and weight were taken, and body mass index (BMI) was calculated by weight (kg)/height2 (m2).
In the early morning (fasting for at least 8 h), each patient performed a standard steamed bread meal test. Fasting blood and two-hour postprandial blood samples were collected respectively. Fasting plasma glucose (FPG), postprandial plasma glucose (2hPG), serum creatinine (SCr) and uric acid (UA) were all measured by an automatic analyzer (Roche, Basel, Switzerland). The eGFR was calculated using the Chronic Kidney Disease Epidemiology Collaboration (CKD-EPI) equation.4 Hemoglobin A1c (HbA1c) was determined by high-performance liquid chromatography (Bio-Rad D–10, Berkeley, USA). Serum OPG levels were detected by enzyme-linked immunosorbent assay (Human osteoprotegerin kit MM–0849H1, Jiangsu, China). Besides, the first urine sample in the morning was collected, and urine albumin and urine creatinine were tested by Siemens ADVRI 2400, Germany. The urinary albumin/creatinine ratio (UACR) was calculated.
Population Groupings
In this study, three methods were used to group the population. Firstly, patients were divided into normal (A1), microalbuminuria (A2) and massive albuminuria (A3) groups according to UACR <30, 30–300 and >300 mg/g. Secondly, eGFR ≥90, 60–89, 45–59, 30–44, 15–29 and <15 mL/min/1.73m2 were described as stages 1 (G1), 2(G2), 3a (G3a), 3b (G3b), 4(G4), and 5 (G5) CKD. Subjects with eGFR <60 mL/min/1.73m2 were grouped as G3–5. Thirdly, according to the risk of CKD progression by KDIGO categories, subjects were divided into low (I), moderately increased (II), and high or very high (III) risk groups (Figure 1).
 |
Figure 1 Population groupings by albuminuria, eGFR and the KDIGO risk categories. Abbreviations: UACR, urinary albumin/urinary creatinine ratio; eGFR, estimated glomerular filtration rate; KDIGO, Kidney Disease: Improving Global Outcomes. Notes: I: low risk; II: moderate risk; III: high risk and very high risk. |
Statistical Methods
SAS 9.1 software was used for all statistical analysis. Count data are presented as numbers (proportions), normally distributed measurement data are expressed as mean ± standard deviation, non-normally distributed data are expressed as median (interquartile ranges: 25 and 75 percentile). The comparison among multiple groups were carried out by ANOVA test; moreover, the logistic regression analysis was performed to assess the association of OPG levels with risks of albuminuria, CKD stages, and CKD progression. The difference was considered statistically significant at P < 0.05.
Results
Characteristics of Subjects
The characteristics of the study population are shown in Table 1. A total of 484 subjects were included in this study, of which 261 (53.9%) were male. The mean age and BMI were 62 ± 12 years and 24.9 ± 3.5 kg/m2, respectively. The average levels of HbA1c and OPG were 8.7 (7.0–10.7) % and 941.30 (547.53–1332.62) pg/mL.
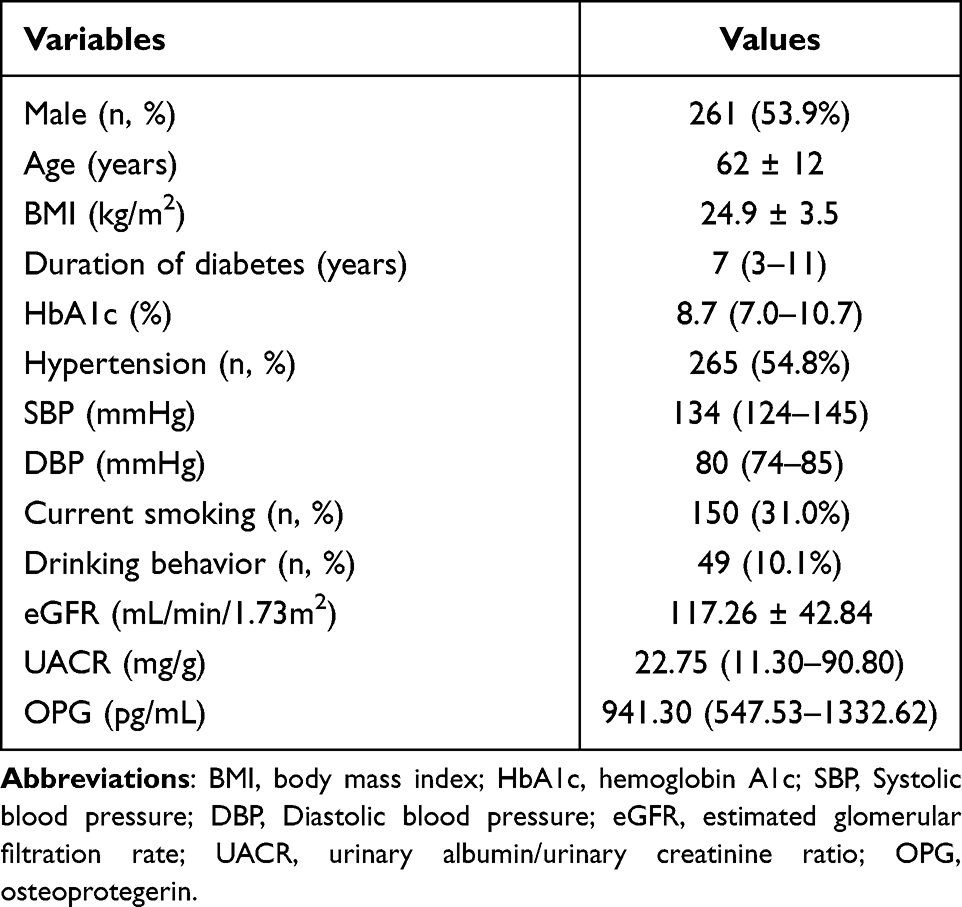 |
Table 1 Characteristics of Subjects |
Comparison of OPG Levels by Persistent Albuminuria Categories
The prevalence of massive albuminuria (n = 71) and microalbuminuria (n = 127) was 14.7% and 26.2%, respectively. The three groups’ BMI, HbA1c, and DBP did not differ between them, but their age, duration of diabetes, and their SBP showed statistically significant differences (P < 0.001). The levels of OPG were 964.43 (546.02–1305.53) and 815.40 (325.55–1243.53) pg/mL in group A2 and A3. Compared with normal subjects (A1) or A2, the levels of OPG in group A3 were significantly decreased (P = 0.001, compared with A1; P = 0.02, compared with A2). Moreover, with the aggravation of albuminuria, the OPG levels showed a downward trend (P = 0.007, P for trend=0.003) (Table 2).
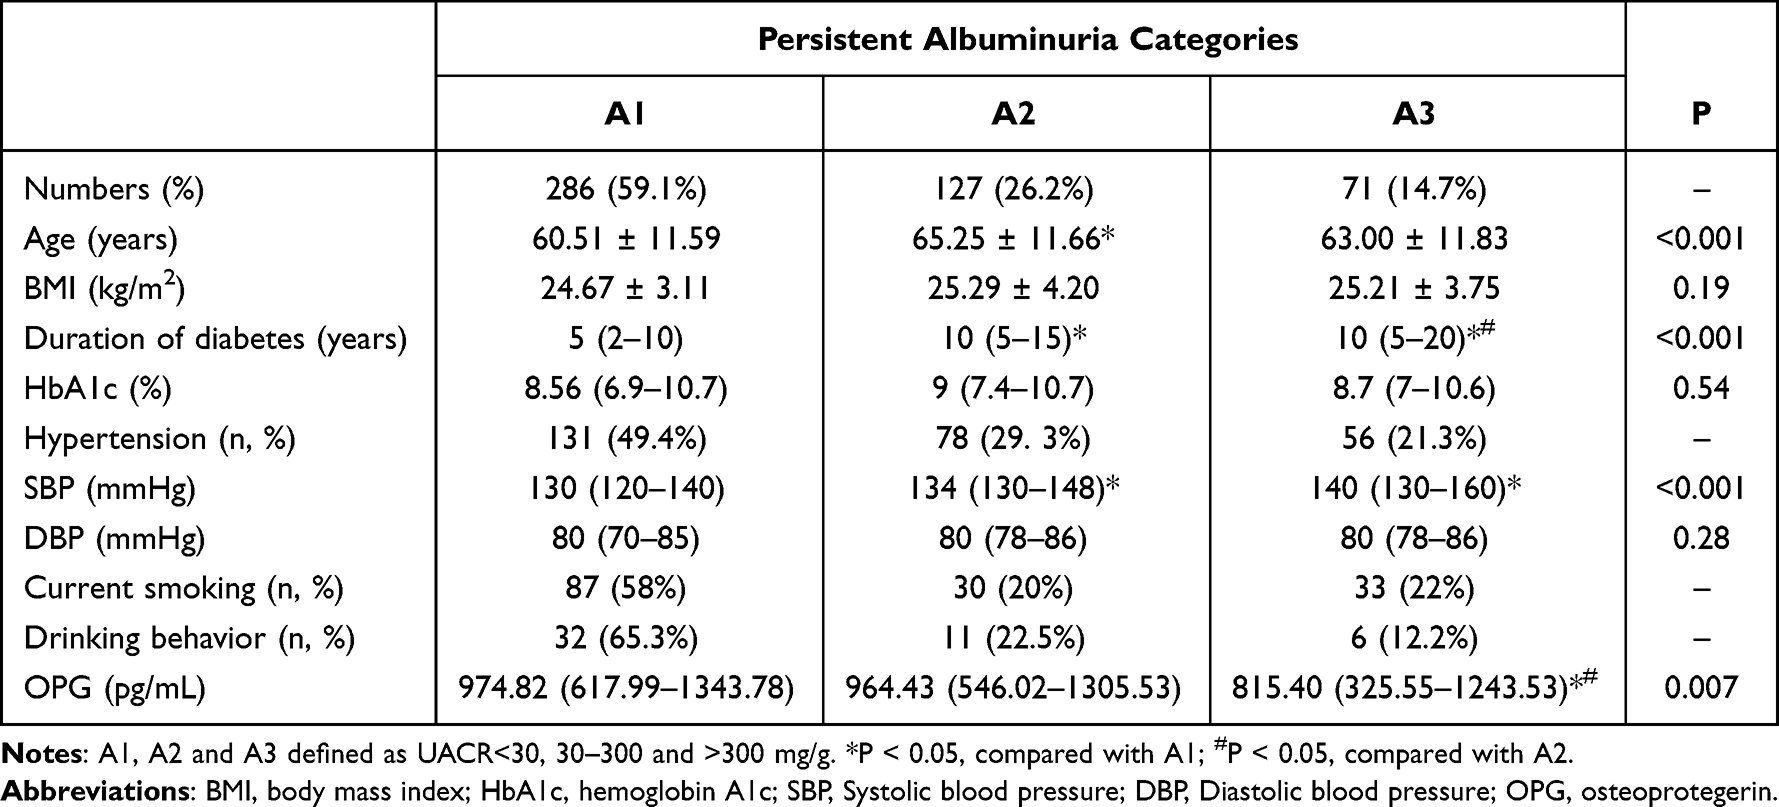 |
Table 2 Comparison of OPG Levels by Persistent Albuminuria Categories |
Comparison of OPG Levels by eGFR Categories
There were 356 participants (59.1%) for the normal group G1, the eGFR decline occurred in 80 patients (16.5%) in the G2 group, 36 (7.45%) in the G3 group, 11 (2.27%) in the G4 group, and 1 (0.2%) in the G5 group. 13.96%, 12%, and 8.17% of patients in the G3-5 group had hypertension, smoking, or drinking habits, respectively. We discovered that these groups still differed in terms of SBP, diabetes duration, and age. The average level of OPG in 48 (9.9%) subjects (group G3–5) was 795.01 (380.55–1211.72) pg/mL. No differences in OPG levels were found at different stages of CKD (P = 0.31, P for trend=0.29), and all P values for pairwise comparisons were greater than 0.05 (Table 3).
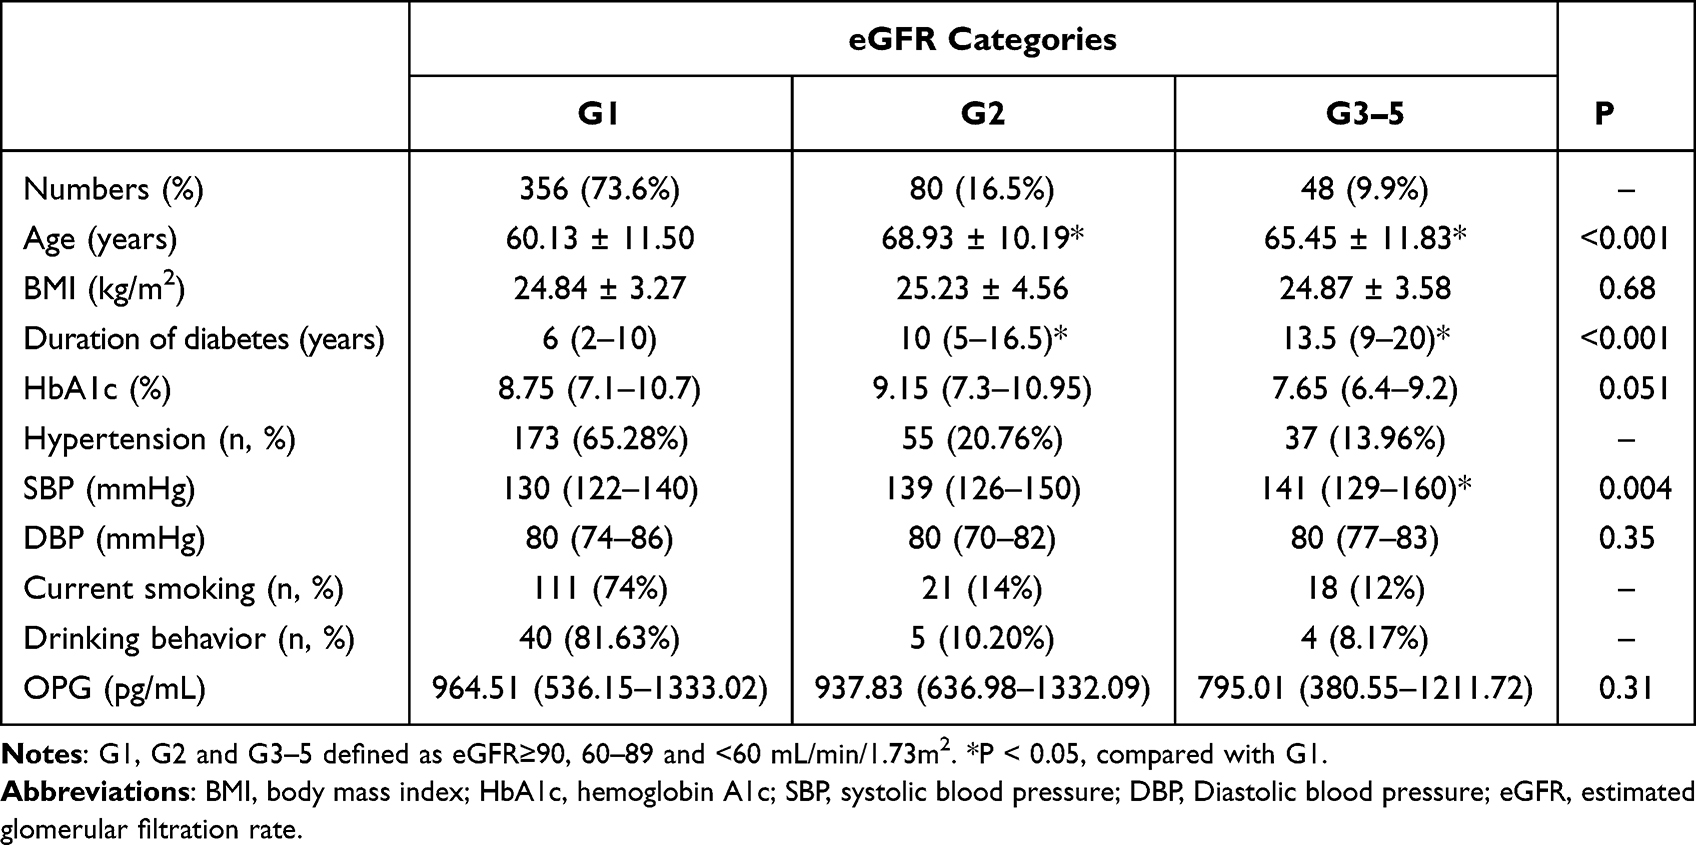 |
Table 3 Comparison of OPG Levels by eGFR Categories |
Comparison of OPG Levels by KDIGO Categories
The proportion of people with low (I), moderately increased (II), and high or very high risk (III) of CKD progression were 58.3%, 23.6% and 18.2%. The low risk group contained 156 (58.87%) patients with hypertension, 79 (52.67%) and 22 (44.90%) of whom were patients who smoked and drank. And 23.02%,26.67%, and 24.29% of patients in the medium-risk group had hypertension, smoking, or drinking habits. At the same time, 18.11%, 20.66% and 30.61% of the patients in the high or very high risk groups had hypertension, smoking and drinking behaviors. The clinical histories of these groups did not differ from one another outside of BIM. The levels of OPG were 978.29 (616.44–1348.51), 964.43 (546.02–1305.53) and 815.40 (325.55–1243.53) pg/mL, respectively. Compared with I or II, the levels of OPG in group III were significantly decreased (P = 0.0003, compared with I; P = 0.003, compared with II). Furthermore, the levels of OPG decreased gradually with the increasing risks of CKD progression (P = 0.001, P for trend=0.001) (Table 4).
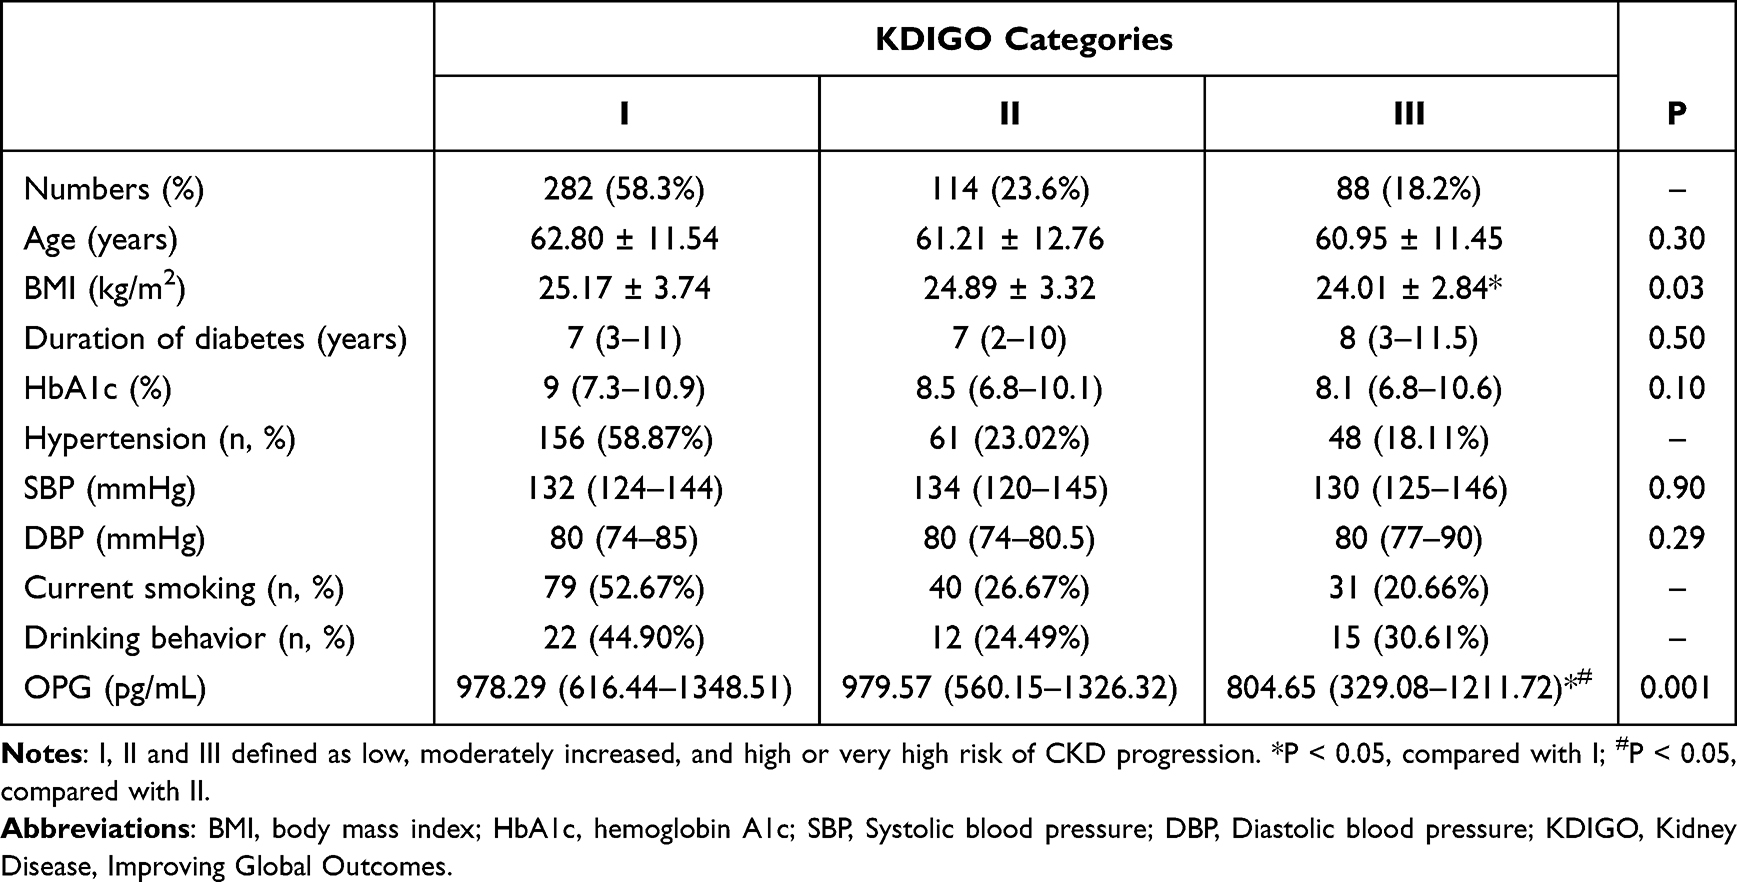 |
Table 4 Comparison of OPG Levels by KDIGO Categories |
Effects of Each 100 Pg/mL Increase in OPG Levels on Albuminuria
Multiple logistic regression analysis was conducted with each 100 pg/mL increase in OPG levels as independent variable, having albuminuria as dependent variable and group A1 as reference. It was found that elevated OPG levels reduced the risk of having massive albuminuria [odds ratio (OR) 0.94, 95% confidence interval (CI) 0.90–0.99, P = 0.02]. After adjusting for sex, age, and BMI (model 2) or further adjusting for sex, age, BMI, duration of diabetes, HbA1c, FPG, 2hPG, history of hypertension (yes or no), systolic and diastolic blood pressure, current smoking and drinking behavior (yes or no), and eGFR (model 3), increased OPG could still reduce the risk of massive albuminuria by 6% and 8% (model 2: OR 0.94, 95% CI 0.89–0.99, P = 0.02; model 3: OR 0.92, 95% CI 0.86–0.99, P = 0.02). The increased OPG levels had no effect on group A2 (Table 5).
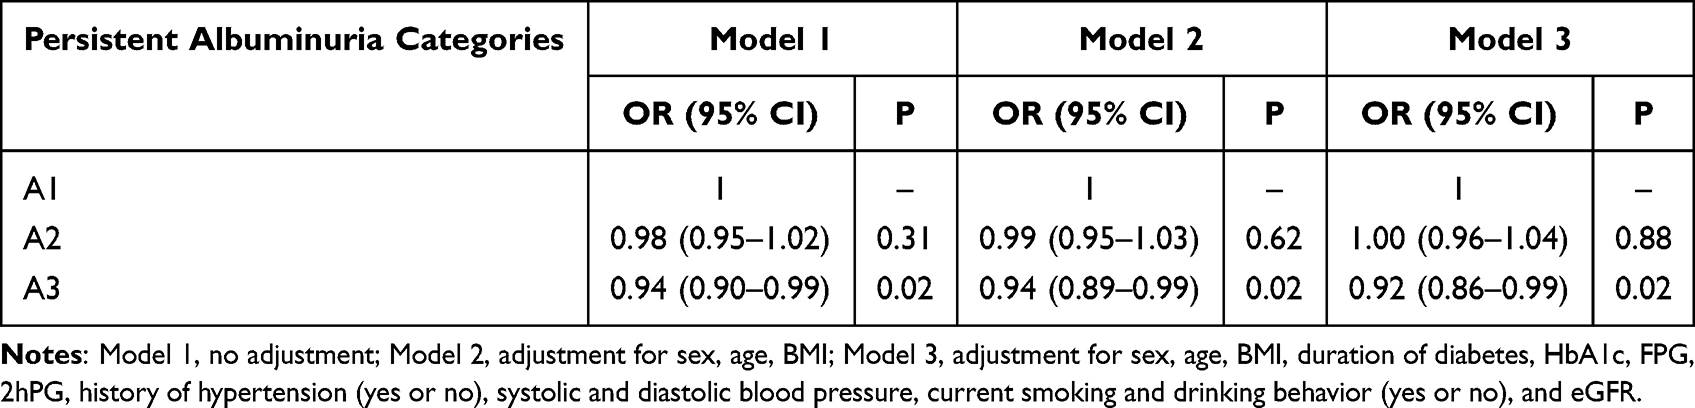 |
Table 5 Effects of Each 100 Pg/Ml Increase in OPG Levels on Albuminuria |
Effects of Each 100 Pg/mL Increase in OPG Levels on eGFR
Similar logistic regression was performed to analyze the relationship between OPG levels and eGFR categories, using stages of CKD as dependent variable and using group G1 as reference. No correlations were found between OPG levels and stages of CKD, not only in unadjusted model, but also in multivariable adjusted models (Table 6).
 |
Table 6 Effects of Each 100 Pg/mL Increase in OPG Levels on eGFR |
Effects of Each 100 Pg/mL Increase in OPG Levels on KDIGO Categories
KDIGO categories were used to group the risks of CKD progression. When group I was treated as a reference group, we found that, increased OPG levels could reduce the high or very high risk of CKD progression up to 6% in all unadjusted or multivariable adjusted models (model 1: OR 0.94, 95% CI 0.90–0.98, P = 0.006; model 2: OR 0.94, 95% CI 0.89–0.98, P = 0.01; model 3: OR 0.94, 95% CI 0.89–0.99, P = 0.04). There was no association between OPG levels and group II (Table 7).
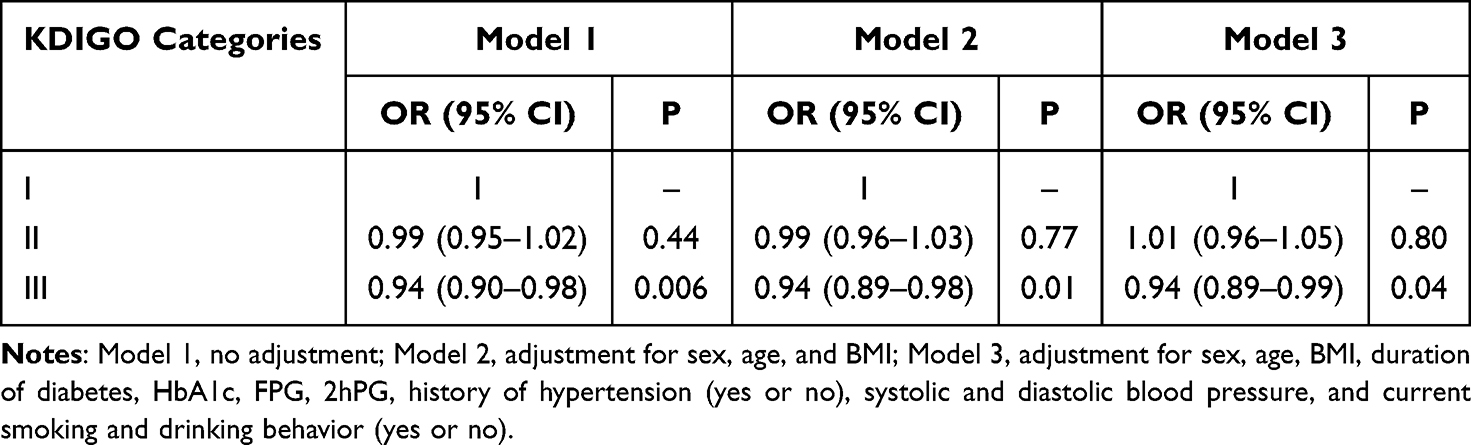 |
Table 7 Effects of Each 100 Pg/mL Increase in OPG Levels on KDIGO Categories |
Discussion
In the present study, serum OPG levels tended to decrease gradually with the aggravation of CKD, not only in albuminuria categories but also in KDIGO risk categories. A similar finding from Mohamed et al13 disclosured that serum OPG was dramatically lower in children with nephrotic syndrome compared to normal children, and was negatively correlated with 24–hour urinary protein. However, many previous studies have found that OPG levels in type 2 diabetic patients with albuminuria were significantly higher than those in patients without albuminuria.8,11,14 High levels of OPG also seemed to have a greater risk of developing to stage 3–5 CKD or ESRD.15 These results are somewhat different from our study. Some scholars believed that the increase of OPG levels in CKD might be related to endothelial cell injury. Such as, Rochette et al16 suggested that this increase might be due to the overproduction of OPG by autocrine after microvascular endothelial cell injury, that is, the damaged endothelial cells release OPG from Weibel-Palade body, resulting in the increase of OPG levels in circulation. In addition, it is also considered that the increase of OPG levels is related to vascular calcification (VC). Recent studies17,18 have shown that when renal failure is accompanied by hyperglycemia, VC is more likely to occur, especially intimal calcification. However, elevated OPG levels may play a role in preventing calcification by inhibiting calcium salt deposition in vivo.19
A growing number of evidence demonstrates that the OPG/RANK/RANKL system, as an important part of bone metabolism, is closely related to VC. This system is not only the key to regulate bone formation, but also may play a core role in the development of vascular complications.20 A previous study21 discovered that, compared with normal glomerular podocytes, the expression levels of RANK and RANKL were significantly increased in podocytes of rats with IgA nephropathy, which implied that the interaction of RANK/RANKL might play a role in the kidney. In summary, we believe that OPG/RANK/RANKL system may be involved in the pathogenesis of DKD-one of the common microvascular complications in type 2 diabetes. In the latest study,22 it was confirmed that RANK made important contribution to the development of DKD, which was mainly manifested in the obvious increase of RANK expression in DKD mice, consistently with the occurrence of albuminuria and renal dysfunction. In contrast, the absence of RANK protected against glomerular basement membrane thickening and mesangial dilatation. These results indicate that RANK is closely correlated with the deterioration of renal function. Overexpression of RANK and RANKL can activate NF-κB in renal tubular cells, promote apoptosis of renal tubular cells and podocytes, and accelerate the development of DKD, while inhibition of RANKL/RANK/NF-κB signaling pathway can improve DKD.23 Well known, by competitively binding RANKL, inhibiting the binding of RANKL and RANK, or forming trimers with RANKL/RANK, OPG can directly inhibit NF-κB activation induced by RANKL and RANK.24 Therefore, we hypothesize that OPG may alleviate the prognosis of DKD through RANKL/RANK/NF-κB pathway to some extent. Further animal and cell experiments are being carried out by us to verify. It can be inferred from the results of our clinical study that the decrease of OPG level may no longer effectively inhibit RANK, thus becoming a risk factor for renal dysfunction. In addition, RANKL is a common activator of endothelial nitric oxide synthase (eNOS),25 OPG may also be useful in protecting against endothelial dysfunction and ultimately improving DKD by inhibiting RANKL-induced eNOS activity. But the eNOS activity of glomerular tissue was reduced in early DKD rats.26 OPG may also be unable to improve endothelial function in early DKD by inhibiting RANKL-induced eNOS activity.
Tumour necrosis factor-related apoptosis-inducing ligand (TRAIL) is another member of TNF superfamily. There is evidence that OPG and TRAIL are both expressed in the kidney and play a role in the pathogenesis of DKD.27,28 Based on proteomics, researchers found that TRAIL Receptor 2 (TRAIL-R2) was closely related to the decline of renal function.29 The expression level of TRAIL in patients with albuminuria was significantly higher than that in patients without albuminuria, and it was even worse in patients with massive albuminuria.27 Elevated TRAIL expression seems to indicate deterioration of renal function. Renal biopsy showed that overexpressed TRAIL would lead to more severe tubular atrophy. After exogenous OPG was supplemented, tubular apoptosis induced by TRAIL was disturbed.30 It is suggested that OPG can indirectly improve tubular survival. Based on previous studies, we believe that OPG may alleviate the development of the kidney by inhibiting TRAIL in the following two aspects. On the one hand, OPG interferes with the TRAIL-induced NF-κB activation. As far as we know, persistent microinflammation is the pathological basis for the development of DKD.31 NF-κB is the central transcription factor of inflammation, which is activated by a variety of inflammatory factors in DKD.32 After exposure to inflammation, NF-κB can stimulate fibroblast proliferation and differentiation, and induce inflammation and matrix synthesis in renal tubular cells.33 OPG can inhibit NF-κB signaling pathway activated by TRAIL, thus playing an anti-inflammatory effect and protecting renal tubules. On the other hand, OPG inhibits TRAIL-induced apoptosis. Our past study reported that OPG was potentially related to insulin sensitivity.9 Dirice et al34 found that the expression of TRAIL and its receptor increased in the islet β-cell of mice injected with streptozotocin. Therefore, we believe that OPG and TRAIL may play a role in the pancreas. A clinical study35 discovered that high expression of TRAIL in pancreas was linked to increased β-cell death. On the contrary, the increase of OPG may perform a protective effect against apoptosis in β-cells. Besides, TRAIL can also promote renal tubular injury and apoptosis. Under the combination of hyperglycemia, pro-inflammatory cytokines and decreased renal clearance, the increase of OPG levels in circulation may become a defense mechanism of tubular apoptosis induced by TRAIL.36 This mechanism needs to be verified in our next basic research. In brief, the inhibitory effect of OPG on TRAIL in kidney and pancreas ultimately may delay the progression to kidney in type 2 diabetes.
Our current results also found that OPG levels were significantly lower in the group with massive albuminuria than in the group without albuminuria, according to albuminuria and eGFR categories, and OPG levels were not associated with the degree of renal impairment. However, most studies suggest that OPG levels are positively correlated with urinary albumin excretion rate and negatively correlated with eGFR.37–39 Vascular endothelial dysfunction is well established to be a significant initiating factor in atherosclerotic lesions, and albuminuria can be utilized as a significant marker of endothelial dysfunction and is linked to an increase in OPG.37 The RANKL/RANK system, once activated, can increase BMP-2 expression and decrease MGP secretion in vascular endothelial cells, which in turn stimulates vascular calcification.40 Alternatively, in progressive CKD, minerals become increasingly disordered,41 and high levels of OPG and a reduced eGFR both indicate that there has been vascular calcification. This is one view of albuminuria, decreased eGFR, and increased OPG in the presence of vascular calcification. From another angle, the systemic inflammatory response is active in the early stages of vascular damage. The body may compensatively increase the level of OPG in the circulation in order to prevent the development of VC and atherosclerosis.42 That is, the increase of OPG level is secondary to vascular calcification or decreased eGFR, albuminuria, etc. Its elevation may contribute to the inhibition of the RANKL/RANK system. When eGFR continues to decline or massive albuminuria develops, which means after decompensation, permanent OPG increases may also no longer be obtained.
Recently, a study38 recommended OPG as a risk factor for CKD progression, which is different from our opinion, because of the different methods used to observe CKD progression. We primarily coupled eGFR and albuminuria to observe the anticipated risk of CKD progression, whereas Tae Ryom Oh considered that reaching a 50% decline in eGFR was the definition of CKD progression. Worse renal function with higher OPG levels were not observed in our results38 probably because the majority of patients included were in the G1 phase and the sample size in the G3-5 phase was too small. On the other hand, even with normal or slightly decreased eGFR, patients with albuminuria have increased mortality and risk of developing ESRD, suggesting that the two are independent.43 Albuminuria can be used as a prognostic indicator of CKD progression independent of eGFR stage.44 Therefore, we believe that it can still be concluded that OPG is associated with the risk of CKD progression, even if no association between OPG and eGFR was found.
Our results also showed that OPG levels were primarily associated with massive albuminuria, but no association was observed with microalbuminuria. Previous researchers have found glomerular changes in the kidneys of patients with microalbuminuria and massive albuminuria by renal biopsy,45 and significant glomerular changes (diffuse or nodular glomerulosclerosis) and tubulointerstitial injury can occur simultaneously after the further deterioration of DKD. However, no positive OPG expression was obtained on glomeruli in either microalbuminuria group or massive albuminuria group, mild or severe lesions. However, in the massive albuminuria group, OPG expression can be positive in the renal tubules, and it is significantly higher than that in the microalbuminuria group.8 This may be one of the reasons supporting a more significant relationship between OPG and massive albuminuria. In addition, the study did not find significant differences in OPG between group A1 and A2, neither between the different stages of CKD. A recent study has shown that renal tubular cell lesions are predominantly proliferative hypertrophy and senescence (not apoptosis) in early stages of DKD,31 OPG cannot inhibit TRAIL-induced renal tubular apoptosis. This may lead to elevated levels of OPG, reducing sensitivity to early CKD progression in the early stages of kidney injury.
Finally, advantages of our study are more comprehensive of the effects of OPG levels on CKD, including the analysis of separate ACR, separate eGFR and KDIGO categories which combined ACR and eGFR, and pay more attention to the progress risks of CKD by using KDIGO classification which represents the prognosis of nephropathy. In this study, we concluded that patients with high OPG levels in type 2 diabetes, the risk of progression to DKD or ESKD is significantly lower than in those with low OPG levels. Therefore, we suggest measuring serum OPG levels have potential value in predicting CKD risk progression. Although the reduced sensitivity of OPG levels to microalbuminuria and the clinical research results on OPG still exist many disputes, such as whether serum or plasma OPG levels are increased or decreased in CKD, and which indicators of CKD are associated with OPG levels, in general, the level of circulating OPG can be used as a potential biomarker of CKD, and elevated OPG levels can play a slowing role in the progression of DKD, even ESRD.
Conclusions
In conclusion, a decrease in serum OPG levels were observed with the aggravation of albuminuria or the increased risk of CKD progression. Elevated OPG may delay the progression of CKD disease.
Data Sharing Statement
All data included in this study are available upon request by contact with the corresponding author.
Ethics Approval and Consent to Participate
The study protocol was approved by the ethics committee of the Third Hospital of Nanchang. The written informed consent was obtained from each subject. The study was carried out in conformity to the Declaration of Helsinki (as revised in 2013).
Author Contributions
All authors made a significant contribution to the work reported, whether that is in the conception, study design, execution, acquisition of data, analysis and interpretation, or in all these areas; took part in drafting, revising or critically reviewing the article; gave final approval of the version to be published; have agreed on the journal to which the article has been submitted; and agree to be accountable for all aspects of the work.
Funding
This work was supported by the National Natural Science Foundation of China [grant number 81760153, Recipient: Peng Duan], the Key Research and Development Programs by Science and Technology Department of Jiangxi Province [grant numbers 20171BBG70058 and 20171ACH80002, Recipient: Zhi Yang and Ping Tu], the Science and Technology Support Project by Science and Technology Department of Nanchang City [grant number [2020]133, Recipient: Peng Duan].
Disclosure
The authors declare that they have no competing interests in this work.
References
1. Mills KT, Xu Y, Zhang W, et al. A systematic analysis of worldwide population-based data on the global burden of chronic kidney disease in 2010. Kidney Int. 2015;88(5):950–957. doi:10.1038/ki.2015.230
2. Wakasugi M, Kazama JJ, Narita I. Anticipated increase in the number of patients who require dialysis treatment among the aging population of Japan. Ther Apher Dial. 2015;19(3):201–206. doi:10.1111/1744-9987.12266
3. Almutairi FM, Al-Duais MA, Shalaby KA, et al. Analysis of patients with end-stage renal disease on dialysis in Tabuk City, Saudi Arabia: a single-center, three-year retrospective study. Saudi J Kidney Dis Transpl. 2017;28(2):349–354. doi:10.4103/1319-2442.202769
4. Andrassy KM. Comments on ‘KDIGO 2012 clinical practice guideline for the evaluation and management of chronic kidney disease’. Kidney Int. 2013;84(3):622–623. doi:10.1038/ki.2013.243
5. Zhang L, Long J, Jiang W, et al. Trends in chronic kidney disease in China. N Engl J Med. 2016;375(9):905–906. doi:10.1056/NEJMc1602469
6. Draznin B, Aroda VR, Bakris G, et al. Chronic kidney disease and risk management: standards of medical care in diabetes-2022. Diabetes Care. 2022;45(Suppl 1):S175–S184.
7. Harper E, Forde H, Davenport C, et al. Vascular calcification in type-2 diabetes and cardiovascular disease: integrative roles for OPG, RANKL and TRAIL. Vascul Pharmacol. 2016;82:30–40. doi:10.1016/j.vph.2016.02.003
8. Wang ST, Zhang CY, Zhang CM, et al. The plasma osteoprotegerin level and osteoprotegerin expression in renal biopsy tissue are increased in type 2 diabetes with nephropathy. Exp Clin Endocrinol Diabetes. 2015;123(2):106–111. doi:10.1055/s-0034-1390447
9. Duan P, Yang M, Wei M, et al. Serum osteoprotegerin is a potential biomarker of insulin resistance in Chinese postmenopausal women with prediabetes and type 2 diabetes. Int J Endocrinol. 2017;2017:8724869. doi:10.1155/2017/8724869
10. Blázquez-Medela AM, López-Novoa JM, Martínez-Salgado C. Osteoprotegerin and diabetes-associated pathologies. Curr Mol Med. 2011;11(5):401–416. doi:10.2174/156652411795976565
11. Xiang GD, Pu JH, Zhao LS, et al. Association between plasma osteoprotegerin concentrations and urinary albumin excretion in Type 2 diabetes. Diabet Med. 2009;26(4):397–403. doi:10.1111/j.1464-5491.2009.02683.x
12. Alberti KG, Zimmet PZ. Definition, diagnosis and classification of diabetes mellitus and its complications. Part 1: diagnosis and classification of diabetes mellitus provisional report of a WHO consultation. Diabet Med. 1998;15(7):539–553. doi:10.1002/(SICI)1096-9136(199807)15:7<539::AID-DIA668>3.0.CO;2-S
13. Mohamed GB, Abdel-Latif EA. Serum osteoprotegerin (OPG) in children with primary nephrotic syndrome. Saudi J Kidney Dis Transpl. 2011;22(5):955–962.
14. Niu Y, Yang Z, Li X, et al. Association of osteoprotegerin with impaired glucose regulation and microalbuminuria: the REACTION study. BMC Endocr Disord. 2015;15:75. doi:10.1186/s12902-015-0067-5
15. Kamińska J, Stopiński M, Mucha K, et al. Circulating osteoprotegerin in chronic kidney disease and all-cause mortality. Int J Gen Med. 2021;14:2413–2420. doi:10.2147/IJGM.S302251
16. Rochette L, Meloux A, Rigal E, et al. The role of osteoprotegerin in vascular calcification and bone metabolism: the basis for developing new therapeutics. Calcif Tissue Int. 2019;105(3):239–251. doi:10.1007/s00223-019-00573-6
17. Hénaut L, Sanchez-Nino MD, Aldamiz-Echevarría Castillo G, et al. Targeting local vascular and systemic consequences of inflammation on vascular and cardiac valve calcification. Expert Opin Ther Targets. 2016;20(1):89–105. doi:10.1517/14728222.2015.1081685
18. Kang YH, Jin JS, Son SM. Long term effect of high glucose and phosphate levels on the OPG/RANK/RANKL/TRAIL system in the progression of vascular calcification in rat aortic smooth muscle cells. Korean J Physiol Pharmacol. 2015;19(2):111–118. doi:10.4196/kjpp.2015.19.2.111
19. Reid P, Holen I. Pathophysiological roles of osteoprotegerin (OPG). Eur J Cell Biol. 2009;88(1):1–17. doi:10.1016/j.ejcb.2008.06.004
20. Znorko B, Oksztulska-Kolanek E, Michałowska M, et al. Does the OPG/RANKL system contribute to the bone-vascular axis in chronic kidney disease? A systematic review. Adv Med Sci. 2017;62(1):52–64. doi:10.1016/j.advms.2016.08.001
21. Liu S, Shi W, Xiao H, et al. Receptor activator of NF-kappaB and podocytes: towards a function of a novel receptor-ligand pair in the survival response of podocyte injury. PLoS One. 2012;7(7):e41331. doi:10.1371/journal.pone.0041331
22. Ke G, Chen X, Liao R, et al. Receptor activator of NF-κB mediates podocyte injury in diabetic nephropathy. Kidney Int. 2021;100(2):377–390. doi:10.1016/j.kint.2021.04.036
23. Chen XW, Du XY, Wang YX, et al. Irbesartan ameliorates diabetic nephropathy by suppressing the RANKL-RANK-NF-κB pathway in type 2 diabetic db/db mice. Mediators Inflamm. 2016;2016:1405924. doi:10.1155/2016/1405924
24. Wittrant Y, Theoleyre S, Couillaud S, et al. Relevance of an in vitro osteoclastogenesis system to study receptor activator of NF-kB ligand and osteoprotegerin biological activities. Exp Cell Res. 2004;293(2):292–301. doi:10.1016/j.yexcr.2003.10.016
25. Min JK, Cho YL, Choi JH, et al. Receptor activator of nuclear factor (NF)-kappaB ligand (RANKL) increases vascular permeability: impaired permeability and angiogenesis in eNOS-deficient mice. Blood. 2007;109(4):1495–1502. doi:10.1182/blood-2006-06-029298
26. Keynan S, Hirshberg B, Levin-Iaina N, et al. Renal nitric oxide production during the early phase of experimental diabetes mellitus. Kidney Int. 2000;58(2):740–747. doi:10.1046/j.1523-1755.2000.00220.x
27. Chang YH, Lin KD, He SR, et al. Serum osteoprotegerin and tumor necrosis factor related apoptosis inducing-ligand (TRAIL) are elevated in type 2 diabetic patients with albuminuria and serum osteoprotegerin is independently associated with the severity of diabetic nephropathy. Metabolism. 2011;60(8):1064–1069. doi:10.1016/j.metabol.2010.11.002
28. Chang WW, Liang W, Yao XM, et al. Tumour necrosis factor-related apoptosis-inducing ligand expression in patients with diabetic nephropathy. J Renin Angiotensin Aldosterone Syst. 2018;19(3):1470320318785744. doi:10.1177/1470320318785744
29. Carlsson AC, Ingelsson E, Sundström J, et al. Use of proteomics to investigate kidney function decline over 5 years. Clin J Am Soc Nephrol. 2017;12(8):1226–1235. doi:10.2215/CJN.08780816
30. Sanchez-Nino MD, Benito-Martin A, Goncalves S, et al. TNF superfamily: a growing saga of kidney injury modulators. Mediators Inflamm. 2010;2010:182958. doi:10.1155/2010/182958
31. Chen C, Wang C, Hu C, et al. Normoalbuminuric diabetic kidney disease. Front Med. 2017;11(3):310–318. doi:10.1007/s11684-017-0542-7
32. Song N, Thaiss F, Guo L. NFκB and kidney injury. Front Immunol. 2019;10:815. doi:10.3389/fimmu.2019.00815
33. Chen J, Li D. Telbivudine attenuates UUO-induced renal fibrosis via TGF-β/Smad and NF-κB signaling. Int Immunopharmacol. 2018;55:1–8. doi:10.1016/j.intimp.2017.11.043
34. Dirice E, Kahraman S, Elpek GO, et al. TRAIL and DcR1 expressions are differentially regulated in the pancreatic islets of STZ- versus CY-applied NOD mice. Exp Diabetes Res. 2011;2011:625813. doi:10.1155/2011/625813
35. Sanlioglu AD, Dirice E, Elpek O, et al. High TRAIL death receptor 4 and decoy receptor 2 expression correlates with significant cell death in pancreatic ductal adenocarcinoma patients. Pancreas. 2009;38(2):154–160. doi:10.1097/MPA.0b013e31818db9e3
36. Adachi T, Sugiyama N, Gondai T, et al. Blockade of death ligand TRAIL inhibits renal ischemia reperfusion injury. Acta Histochem Cytochem. 2013;46(6):161–170. doi:10.1267/ahc.13022
37. Elsamahy MH, Elhenawy YI, Nawar MM. Plasma osteoprotegerin concentrations in type 1 diabetic patients with albuminuria. J Diabetes Complications. 2015;29(4):563–567. doi:10.1016/j.jdiacomp.2015.02.008
38. Oh TR, Myeong C, Song SH, et al. Association between serum osteoprotegerin level and renal prognosis in nondialysis patients with chronic kidney disease in the Korean Cohort Study for Outcomes in Patients with Chronic Kidney Disease (the KNOW-CKD Study). Kidney Res Clin Pract. 2022;41(2):200–208. doi:10.23876/j.krcp.21.173
39. Morena M, Jaussent I, Dupuy AM, et al. Osteoprotegerin and sclerostin in chronic kidney disease prior to dialysis: potential partners in vascular calcifications. Nephrol Dial Transplant. 2015;30(8):1345–1356. doi:10.1093/ndt/gfv081
40. Osako MK, Nakagami H, Koibuchi N, et al. Estrogen inhibits vascular calcification via vascular RANKL system: common mechanism of osteoporosis and vascular calcification. Circ Res. 2010;107(4):466–475. doi:10.1161/CIRCRESAHA.110.216846
41. Singh DK, Winocour P, Summerhayes B, et al. Prevalence and progression of peripheral vascular calcification in type 2 diabetes subjects with preserved kidney function. Diabetes Res Clin Pract. 2012;97(1):158–165. doi:10.1016/j.diabres.2012.01.038
42. Lello S, Capozzi A, Scambia G. Osteoporosis and cardiovascular disease: an update. Gynecol Endocrinol. 2015;31(8):590–594. doi:10.3109/09513590.2015.1041908
43. Gansevoort RT, Matsushita K, van der Velde M, et al. Lower estimated GFR and higher albuminuria are associated with adverse kidney outcomes. A collaborative meta-analysis of general and high-risk population cohorts. Kidney Int. 2011;80(1):93–104. doi:10.1038/ki.2010.531
44. Oh KH, Park SK, Park HC, et al. KNOW-CKD (Korean cohort study for outcome in patients with chronic kidney disease): design and methods. BMC Nephrol. 2014;15:80. doi:10.1186/1471-2369-15-80
45. Ekinci EI, Jerums G, Skene A, et al. Renal structure in normoalbuminuric and albuminuric patients with type 2 diabetes and impaired renal function. Diabetes Care. 2013;36(11):3620–3626. doi:10.2337/dc12-2572
 © 2022 The Author(s). This work is published and licensed by Dove Medical Press Limited. The
full terms of this license are available at https://www.dovepress.com/terms
and incorporate the Creative Commons Attribution
- Non Commercial (unported, 3.0) License.
By accessing the work you hereby accept the Terms. Non-commercial uses of the work are permitted
without any further permission from Dove Medical Press Limited, provided the work is properly
attributed. For permission for commercial use of this work, please see paragraphs 4.2 and 5 of our Terms.
© 2022 The Author(s). This work is published and licensed by Dove Medical Press Limited. The
full terms of this license are available at https://www.dovepress.com/terms
and incorporate the Creative Commons Attribution
- Non Commercial (unported, 3.0) License.
By accessing the work you hereby accept the Terms. Non-commercial uses of the work are permitted
without any further permission from Dove Medical Press Limited, provided the work is properly
attributed. For permission for commercial use of this work, please see paragraphs 4.2 and 5 of our Terms.
Recommended articles
Association Between Sleep Duration and Albuminuria in Patients with Type 2 Diabetes: A Cross-Sectional Study in Ningbo, China
Li X, Chattopadhyay K, Qian X, Yu J, Xu M, Li L, Sun J, Li J
Diabetes, Metabolic Syndrome and Obesity 2022, 15:1667-1675
Published Date: 30 May 2022
Association Between Serum Asprosin and Diabetic Nephropathy in Patients with Type 2 Diabetes Mellitus in the Community: A Cross-Sectional Study
Xu L, Cui J, Li M, Wu Q, Liu M, Xu M, Shi G, Yin J, Yang J
Diabetes, Metabolic Syndrome and Obesity 2022, 15:1877-1884
Published Date: 18 June 2022
The Association Between Hypertriglyceridemic-Waist Phenotype and Chronic Kidney Disease in Patients with Type 2 Diabetes: A Cross-Sectional METAL Study
Xuan Y, Zhang W, Wang Y, Wang B, Chen Y, Xia F, Zhang K, Li Q, Wang N, Lu Y
Diabetes, Metabolic Syndrome and Obesity 2022, 15:1885-1895
Published Date: 20 June 2022
A 5-Year Follow-Up Study to Explore Factors Associated with Rapid Kidney Function Decline Among Bus Drivers
Wu Y, Chen Q, Zhang Q, Wu Y, Zheng X
International Journal of General Medicine 2023, 16:3193-3201
Published Date: 28 July 2023
Patient Characteristics and Outcomes of Hospitalized Chronic Kidney Disease Patients with and without Type 2 Diabetes Mellitus: Observations from the German Claims Data-Based Cohort of the CaReMe-CKD Multinational Study

Leiner J, Pellissier V, König S, Stellmacher L, Hohenstein S, Schanner C, Kwast S, Kuhlen R, Bollmann A
Clinical Epidemiology 2024, 16:487-500
Published Date: 22 July 2024