Back to Journals » Diabetes, Metabolic Syndrome and Obesity » Volume 16
Electroacupuncture Improves Insulin Resistance in Type 2 Diabetes Mice by Regulating Intestinal Flora and Bile Acid
Authors Pan T, Li X ![]() , Guo X, Wang H
, Guo X, Wang H ![]() , Zhou X, Shang R
, Zhou X, Shang R ![]() , Xie D, Qian X
, Xie D, Qian X ![]() , Dai M
, Dai M ![]() , Fan E, Chen X, Chen C
, Fan E, Chen X, Chen C
Received 29 May 2023
Accepted for publication 2 November 2023
Published 7 December 2023 Volume 2023:16 Pages 4025—4042
DOI https://doi.org/10.2147/DMSO.S421134
Checked for plagiarism Yes
Review by Single anonymous peer review
Peer reviewer comments 2
Editor who approved publication: Dr Konstantinos Tziomalos
Ting Pan,1 Xuefeng Li,2 Xiaole Guo,3 Haili Wang,2 Xue Zhou,2 Rui Shang,4 Donge Xie,5 Xin Qian,6 Mengyao Dai,2 Enshuo Fan,2 Xinhua Chen,1 Chunhai Chen5
1College of Traditional Chinese Medicine, ChangChun University of Chinese Medicine, Changchun, Jilin, People’s Republic of China; 2School of Acupuncture-Moxibustion and Tuina, Changchun University of Chinese Medicine, Changchun, Jilin, People’s Republic of China; 3Prevention and Treatment Center, The Third Affiliated Hospital of Changchun University of Traditional Chinese Medicine, Changchun, Jilin, People’s Republic of China; 4Traditional Chinese Medicine Rehabilitation Center, Jilin Cancer Hospital, Changchun, Jilin, People’s Republic of China; 5Acupuncture and moxibustion Clinical Center, Affiliated Hospital of Changchun University of Chinese Medicine, Changchun, Jilin, People’s Republic of China; 6Tuina Department, Shenzhen Traditional Chinese Medicine Hospital, ShenZhen, Guangdong, People’s Republic of China
Correspondence: Xinhua Chen, ChangChun University of Chinese Medicine, No. 1035 Boshuo Road, Changchun, Jilin Province, 130117, People’s Republic of China, Tel +86 13596104290, Email [email protected] Chunhai Chen, Affiliated Hospital of Changchun University of Chinese Medicine, No. 1478 Gongnong Dalu, Changchun, Jilin Province, 130021, People’s Republic of China, Tel +86 13604404239, Email [email protected]
Introduction: Adjusting internal organs and dredging channel electroacupuncture has a definite effect on type 2 diabetes, but the specific mechanism still needs to be further clarified. This study aims to investigate the effects of electroacupuncture on the gut microbiota and bile acids in db/db mice after the intervention of “adjusting internal organs and dredging channel” and further explore its mechanism of action in treating T2DM.
Methods: We used db/db mice as the animal model and db/m mice from the same litter as the blank control group, a total of 4 weeks of intervention were conducted. We evaluated the effectiveness of the “adjusting internal organs and dredging channel” treatment by detecting indicators related to glucose and lipid- metabolism. Detect changes in the gut microbiota of mice in each group using 16SrDNA sequencing technology. The content of bile acids in mouse feces was determined using liquid chromatography mass spectrometry, and the correlation analysis between different bile acids and differential bacterial communities was performed. The expression levels of TGR5 and GLP-1 proteins were measured using the Western blot method.
Results: Adjusting internal organs and dredging channel electroacupuncture can improve blood glucose levels in db/db mice, increase the abundance of Firmicutes and Actinobacteria, and increase the content of fecal bile acid pool heavy CA and UDCA. At the same time, it also increased the content of TGR5/GLP1 in the small intestine.
Conclusion: Adjusting internal organs and dredging channel electroacupuncture can improve the disorder of glucose and lipid metabolism in db/db mice, regulate the abundance and colony composition of intestinal microbiota in mice, and regulate bile acid metabolism in mice. The interaction between bile acid and intestinal microbiota can also be observed; Mutual influence may play a role in regulating blood sugar together.
Keywords: type 2 diabetes mellitus, electroacupuncture, intestinal flora, bile acid
Introduction
Type 2 diabetes (T2DM) is a chronic metabolic disease characterized by persistent hyperglycemia. Its pathogenesis is insufficient insulin secretion or insulin resistance, or both.1 According to the data of the International Diabetes Federation, it is expected to increase to 700 million in 2045.2,3 With the continuous development of the means and technology for studying microorganisms, the reports on intestinal flora at home and abroad have emerged in recent years. The intestinal flora plays an important role in maintaining a stable metabolic balance in the human body.4 The difference between the intestinal flora of patients with T2DM and healthy people has become a research hotspot at this stage. Studies have proved that in the development of diabetes, some pathogenic bacteria also participate in the process, such as Bacteroides faecalis, Escherichia coli, Streptococcus mutans, Desulfovibrio, etc., as well as some beneficial bacteria that can resist the development of diabetes, such as Clostridium, Microverrucae, Eubacterium rectum, etc.5 The imbalance of intestinal flora may be an important pathogenesis of T2DM.6
Bile acid (BA) is synthesized in the liver and is also the main metabolite of cholesterol.7 When digesting food, BA will enter the intestine with bile.8 To maintain the stability of the bile salt pool, 95% of bile salt in BA can be reabsorbed into the liver by the intestine (mainly ileum). In the intestinal hepatic circulation of BA metabolism, some bile acids are not involved. They generate secondary BA in the intestine through the action of intestinal flora, which plays an important role in the transformation process from primary BA to secondary BA.9 BA is an important metabolic regulator, which can activate a variety of nuclear and membrane receptor mediated signal pathways and participate in a variety of metabolic regulation processes, including T2DM, obesity, and nonalcoholic fatty liver.10,11 Studies have shown that BA is one of the important substances regulating the metabolism of glucose and lipid.8 One of the important signal pathways can activate G-protein coupled bile acid receptor 5 (TGR5), which further promotes the secretion of glucagon-like peptide-1 (GLP-1) by intestinal L-cells to regulate glucose metabolism.12 GLP-1 has been used in the treatment of clinical T2DM, which can regulate insulin secretion of pancreatic cells, reduce cell apoptosis, promote cell proliferation, and inhibit α Cells secrete glucagon.13,14 To sum up, BA decomposition and metabolism are closely related to body glucose and lipid metabolism. The decomposition and metabolism of BA require the participation of intestinal flora. The size and composition spectrum of the BA pool can be changed by adjusting the distribution of intestinal flora. Similarly, the composition of BA affects the diversity of intestinal flora, and both interact to jointly participate in the metabolism of body energy and glucose, and lipid. However, the exact pathogenesis of T2DM by intestinal flora and BA is still not particularly clear. Therefore, this has also become a new direction of our research to find a better method for better prevention and treatment of T2DM. Acupuncture, as one of the external therapeutic methods of traditional Chinese medicine, can regulate the qi, blood, yin, and yang of the human body through the action of acupoints, to achieve the purpose of treating visceral diseases. Studies have shown that acupuncture not only promotes weight loss and hypoglycemia in patients with T2DM but also improves insulin resistance and regulates the levels of metabolic indicators, thus improving and treating T2DM.15 The previous experimental research of the research group has shown that electroacupuncture can regulate and improve the glucose and lipid metabolism and the structure of intestinal flora in db/db mice.16,17 Therefore, on this basis, this experiment continued to study the effect of “adjusting internal organs and dredging channel” on bile acid metabolism and related TGR5/GLP-1 signal pathway and further explored its mechanism of action in treating T2DM.
Materials and Methods
Animals
Twenty-four SPF grade 7-week-old male db/db diabetes mice, weighing (30 ± 3) g, were randomly divided into a model group, electroacupuncture group, and western medicine group. Eight male db/m mice from the same litter were selected as the blank group, weighing (19 ± 2) g, and there were four groups, eight mice in each group. The experimental animals were purchased from Changzhou Kavens Experimental Animal Co, Ltd, and the qualification license of experimental animals: SCXK (Su) 2021–0013. The experimental animals were raised in the Experimental Animal Center of Changchun University of Traditional Chinese Medicine. The breeding environment was clean, ventilated, and 12 hours of alternate lighting. The temperature was 23~25°C, and the humidity was 50%–70%, eat and drink freely. After one week of adaptive feeding, the intervention was carried out. The db/m mice were fed with common feed, and the db/db mice were fed with pellet feed for maintenance. The electroacupuncture group (Acu) was treated with electroacupuncture every time, the intensity was based on the tolerance of mice, and the daily intervention time was 20 minutes. The western medicine group (Met) was given metformin (Shanghai Squibb Pharmaceutical Co, Ltd, China-US, product batch number: ABS9999) 250mg/(kg · d) by gavage. The model group (Mod) and the blank group (Ctrl) were raised under the same conditions and were only caught and fixed at the same time. The above 6 days are a course of treatment. Body weight and fasting blood glucose are measured on the 7th day. Collect mouse feces after treatment. This experiment is in accordance with the relevant provisions on the welfare and ethics of experimental animals of Changchun University of Traditional Chinese Medicine, ethics number: 2021206.
Electroacupuncture Treatment
In the electroacupuncture group (Acu), the mice were fixed in the prone position on the experimental plate with 0.18 × 10mm needle for acupuncture treatment. According to the atlas of experimental acupuncture points, the points are Feishu (BL13), Pishu (BL20), Shenshu (BL23), Hegu (LI4), Zusanli (ST36), Sanyinjiao (SP6), Taichong (LR3) (Figure 1). Connect the electroacupuncture therapeutic apparatus (Suzhou Medical Instruments, China, product batch number: YZB/Su 0691–2013), take the same side of BL13, BL23 and ST36, SP6 as the electroacupuncture connection points, take the density wave (frequency ratio is 1:5), and set the frequency of the dispersion wave to 3Hz.
 |
Figure 1 Schematic diagram of mouse acupoints. LI4, BL13, BL20, BL23, ST36, SP6 and LR3 are symmetrical on both sides of the body. LI4 is located between the first metacarpal bone and the second metacarpal bone of the forelimb; BL13 is located in bilateral intercostal region, directly below the third thoracic vertebra; BL20 is located in bilateral intercostal region, directly below the 11th thoracic vertebra; BL23 is located in bilateral intercostal area, directly below the second lumbar spine; ST36 is located at the posterolateral side of the knee joint, about 3mm below the head of the fibula; SP6 is located about 5mm above the straight point of the inner ankle of the hind limb. LR3 is located between the first and second metacarpal bones of the hind limb. Created using Biorender.com. |
Determination of Diabetes-Related Indices
The mental state, reaction and activity, fur color and glossiness, stool character, etc. of mice in each group were recorded daily, and the weight and fasting blood glucose of mice were measured on the 7th, 14th, 21st, and 28th day of intervention respectively. The insulin resistance index HOMA-IR was used to evaluate the insulin sensitivity of mice. The calculation formula was HOMA-IR=FBG * FINC/22.5. After the intervention, the mice fasted for 12h, and the next day they were given glucose (2g/kg) by gavage. The tail blood glucose of mice was measured for 0min, 30min, 60min, and 120min respectively, and the area under the curve was compared. After the OGTT experiment, 10% chloral hydrate (0.35mL/100g) was injected intraperitoneally to anesthetize. After blood was taken from the heart tip, the blood was left at room temperature for 30min to coagulate, and then centrifuged (3000rpm, 4°C, 15min) to take the serum. Use the Mouse INS ELISA KIT kit (Huangshi Yanke Biotechnology Co, Ltd, product batch No. CK-E20778) to determine the serum insulin (FINS) level. Four items of serum lipids in mice were measured with an automatic biochemical analyzer (Shenzhen Leidu Life Science and Technology, Chemray240 and Chemray800), including total cholesterol (TC), triglyceride (TG), low-density lipoprotein (LDL-C) and high-density lipoprotein (HDL-C).
16SrDNA Gene Sequencing
Fecal samples were collected on the 28th day (8:00–11:00 a.m.) after acupuncture. When collecting feces, first transfer the mouse into a disinfected clean cage, disinfect the area around its anus with 75% alcohol, and gently massage the abdomen of the mouse with a sterilized cotton swab to help it defecate. After defecation, quickly put the feces into a marked cryopreservation tube with a sterile syringe needle (the collection time is not more than 30 minutes), and store them in liquid nitrogen. After all fecal samples are collected, put them into a -80°C refrigerator. The CTAB method was selected to extract the total DNA of microbiome from fecal samples of mice in each group, and the quality of DNA extraction was detected by agarose gel electrophoresis, and the DNA was quantified by ultraviolet spectrophotometer. The universal primer 515 f (5 ʹ- GTGYCAGCMGCCGCGGTAA-3 ʹ) And 806 r (5 ʹ- GGACTACHVGGGTWTCTAAT-3 ʹ).18 PCR products were purified by AMPure XT beans (Beckman Coulter Genomics, Danvers, MA, USA) and quantified by Qubit (Invitrogen, USA). PCR amplification products were detected by 2% agarose gel electrophoresis, and the AMPure XT beads recovery kit was used for recovery. The purified PCR products were evaluated with library quantitative kits of Agilent 2100 biological analyzer (Agilent, USA) and Illumina (KapaBiosciences, Woburn, MA, USA). After gradient dilution of each qualified online sequencing library, mix it according to the required sequencing quantity in the corresponding proportion, and denature it into a single chain by NaOH for online sequencing; Using NovaSeq 6000 Sequencer 2 × 250bp double-ended sequencing, OTU clustering, species annotation, and comparative analysis after preprocessing the sequencing data (sequencing was completed with the assistance of Hangzhou Lianchuan Biotechnology Co, Ltd).
Determination of Bile Acid Content
The content of bile acid in mouse feces was determined by liquid chromatography-mass spectrometry. Accurately weigh about 0.05g (accurate to 0.001 g) of mouse feces sample into a 2mLEP tube (operated on ice), and add 500 μ L80% methanol water – 20 °C precooling for protein precipitation, adding steel balls, extracting with a shaker for 20min, centrifuging (4°C, 12000rpm) for 15min, and taking 100 supernatant μ L in LC injection bottle for UPLC-MS/MS analysis. The chromatographic column is Thermo Hypersil GOLD C18 (100 × 2.1mm, 1.9 µ m), and the column temperature is 50°C. The injection volume is 5 μ L。The evaporation temperature of the ion source is 350°C, the temperature of the ion transfer tube is 300°C, the sheath gas (N2) is 75 Bar, the auxiliary gas (N2) is 10 Bar, and the purge gas is 0 bar.
Detection of Ileum Tissue
Western blotting (WB) is used to detect the expression of TGR5 and GLP1 proteins in ileal tissue samples. Extract the total protein from each group of colon samples and measure the protein concentration using the BCA protein concentration assay kit (Wuhan Servicebio). SDS-PAGE electrophoresis was performed and then transferred to the PVDF membrane. The first antibody used in this work is Rabbit and second antibody (HRP goat anti rabbit).
Metabolomics Analysis
All data are expressed as mean ± standard deviation ( ) SPSS software (SPSS 24.0, SPSS Inc, USA) was used for statistical analysis. Single factor analysis of variance (ANOVA) was used for comparison between groups, and LSD post test was used for comparison between two groups. The difference was statistically significant if p < 0.05. Spearman correlation test was used to evaluate the correlation of diabetes-related parameters, flora and bile acid.
Electroacupuncture Improved the Indexes Related to Diabetes in Db/Db Mice
The effect of electroacupuncture on body weight and blood sugar of db/db mice is shown in Figure 2. After 4 weeks of intervention, the weight of mice in the electroacupuncture group and the western medicine group was significantly lower than that in the model group (Figure 2a). The results suggest that electroacupuncture can effectively control the trend of weight growth in db/db mice, and significant changes occurred from the second week of intervention. Fasting blood glucose (FBG) in the electroacupuncture group and western medicine group was significantly lower than that in the model group (Figure 2b). In order to evaluate the insulin tolerance of mice in each group, we conducted an oral glucose tolerance (OGTT) experiment (Figure 2c) and calculated the area under the curve (ACU) (Figure 2d). The OGTT experiment results showed that the blood glucose in the model group rose sharply after oral glucose, indicating that its glucose tolerance was significantly damaged. Compared with the model group, the acupuncture group and the western medicine group improved significantly, while the ACU in the electroacupuncture group and the western medicine group was also significantly lower than the model group. To evaluate islets of Langerhans β For function and insulin sensitivity, we measured the serum insulin level (FINS) (Figure 2e) and calculated the insulin resistance index (HOMA-IR) (Figure 2f). The results showed that both the electroacupuncture group and the western medicine group were lower than the model group. It shows that electroacupuncture can significantly improve the blood glucose of db/db mice, similar to Met. Figure 3 shows the changes of four blood lipid items of mice in each group. The levels of TC and TG in the electroacupuncture group and western medicine group were significantly lower than those in the model group (Figure 3a and 3b), HDL levels were significantly higher (Figure 3c), and LDL levels were significantly lower (Figure 3d). The effects of electroacupuncture group and MET group were similar. These results suggest that electroacupuncture and metformin can improve dyslipidemia in db/db mice.
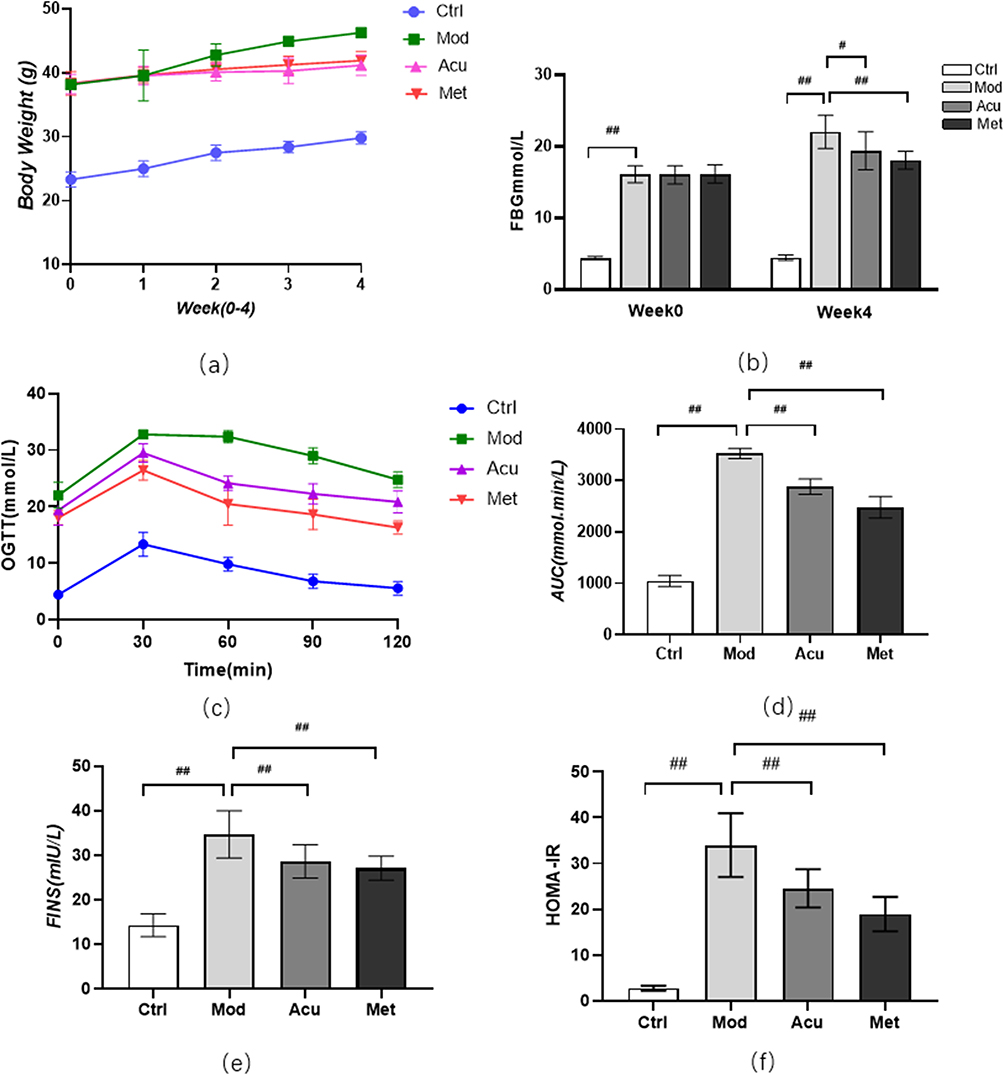 |
Figure 2 Effect of electroacupuncture on body weight and blood sugar of db/db mice. (a) Body weight changes before and after treatment. (b) Fasting blood glucose changes before and after treatment (c) Blood glucose values at each time point of OGTT; (d) AUC is calculated according to OGTT curve. (e) Serum insulin level was measured after treatment; (f) Calculate HOMA-IR index: HOMA-IR=FINS × FBG / 22.5; Data are expressed in mean ± standard deviation, #P < 0.05, ##P < 0.01 (n=8). |
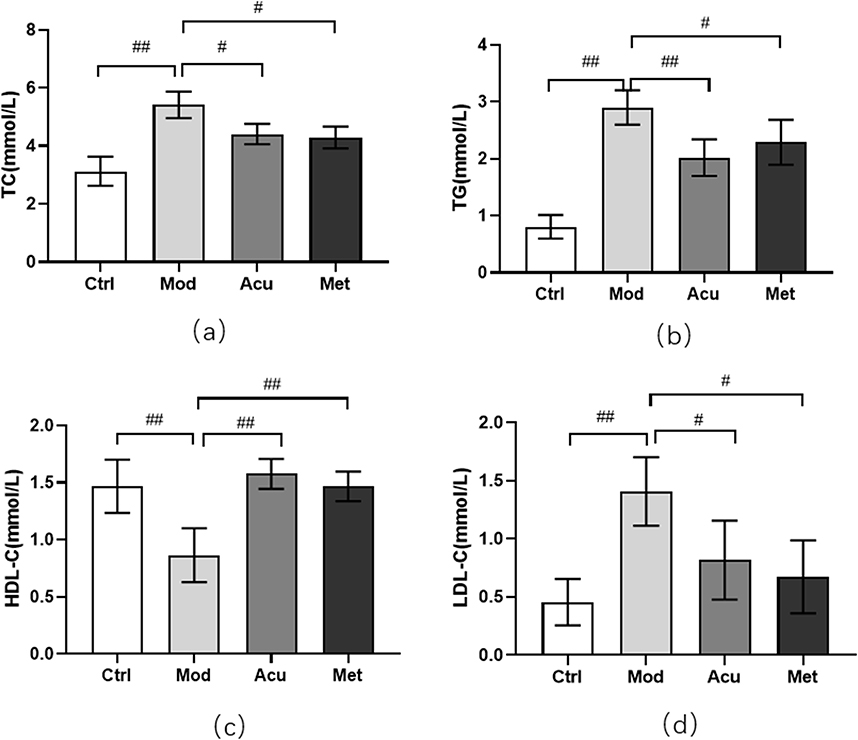 |
Figure 3 Effect of electroacupuncture on blood lipid in db/db mice. (a) Total cholesterol level (TC). (b) Triglyceride level (TG). (c) Low density lipoprotein level (LDL-C). (d) High density lipoprotein level (HDL-C). Data are expressed in mean ± standard deviation, #P < 0.05, ##P < 0.01 (n=8). |
Effect of Electroacupuncture on Intestinal Flora in Db/Db Mice
We used 16srDNA technology to detect intestinal microflora of mice feces in each group. Venn diagram (Figure 4a) shows that at the OTU taxonomic level, there are 406 OTUs in the four groups, 1010 OTUs in the feces of Ctrl mice, 768 OTUs in the feces of Mod mice, 1279 OTUs in the feces of Acu mice, and 917 OTUs in the feces of Met mice. The Rank-abundance (Figure 4b) shows that when the OTUs rank between 0 and 300, the relative abundance of OTUs decreases significantly with the increase of the number of OTUs, while when the OTUs rank is greater than 300, the relative abundance of OTUs does not increase significantly with the increase of the rank, and the curve is gradual and gentle. This indicates that the species distribution of the sequencing data is uniform, and the sequencing depth of this study is sufficient to reflect the richness of species. Alpha diversity analysis showed that the observed specifications index (Figure 4c) in Acu and Met groups was significantly higher than that in Mod groups; Shannon index showed that (Figure 4d) Acu group was significantly higher than Mod group, and the other groups had no significant difference. It shows that electroacupuncture and metformin can increase the intestinal colony diversity of mice. Beta diversity analysis PCoA diagram (Figure 4e) showed that the first principal component was 42.22%, the second principal component was 27.01%, p = 0.001, indicating that the intestinal flora structure was significantly different among the four groups.
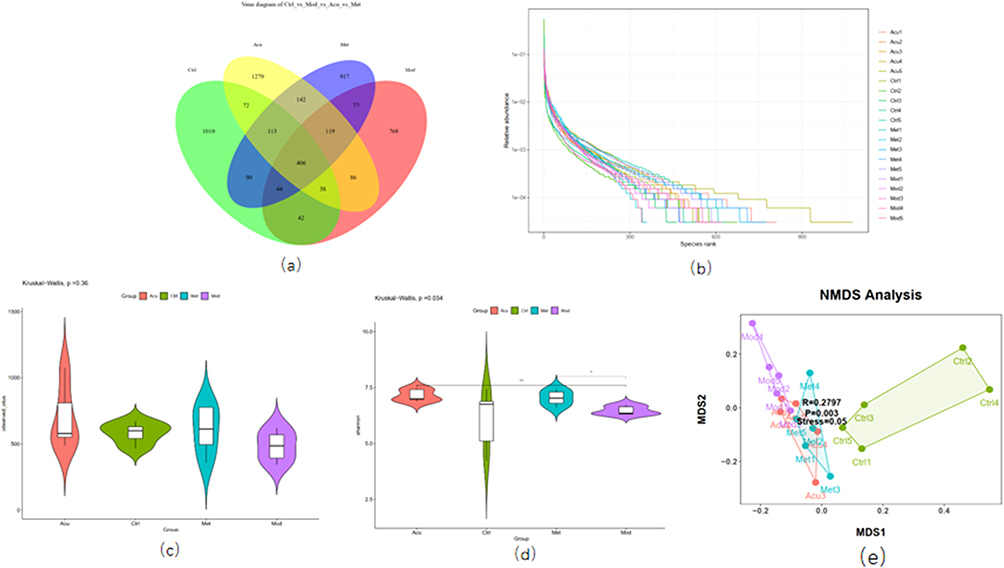 |
Figure 4 Analysis of microbial diversity of mice in each group. (a) The Venn diagram shows the number of 4 groups of OUT. (b) The Rank ambiguity curve shows the species distribution. (c) Alpha diversity analysis Observed specifications index. (d) Alpha diversity analysis Shannon index. (e) Beta diversity analysis NMDS diagram# P<0.05, ##P< 0.01 (n=5). |
Based on the species annotation results and the species characteristic tables of each sample, the species abundance tables at the level of kingdom, phyla, class, order, family, genus and species were obtained, and the species composition and difference analysis of different groups were conducted for the species abundance tables at different levels. The relative abundance of intestinal microflora of mice in each group was counted at the phyla level, as shown in Figure 5a. Furthermore, the diversity analysis was carried out for the top 20 species in the phyla level abundance ranking. The bacteria with differences are shown in Figure 5b–h, and the differences between the Bacteroidetes and Fixtures abundance groups are the most significant. Compared with the blank group, the abundance of Bacteroidetes, Epsilon bacteroaeota, Tenericutes and Bacteroidota in the model group was significantly increased (P < 0.05), the abundance of Firmicutes and Actinobacteria was significantly decreased (P < 0.05), and the ratio of Firmicutes/Bacteroidetes was significantly decreased (P < 0.05). After the intervention, compared with the model group, the abundance of Bacteroidetes, Epsilon bacteraeota, Tenericulates and Bacteroidota in the acupuncture group decreased, while the abundance of Fixtures and Actinobacia increased significantly (P < 0.05). Compared with the model group, the abundance of Bacteroidetes in the western medicine group was significantly reduced (P < 0.05), there was no statistical difference in the abundance of other bacteria.
 |
Figure 5 Structure and difference analysis of phyla horizontal flora. (a) Histogram of relative abundance of mouse flora composition at phyla level in each group. (b) Comparison of the relative abundance of Bacteroidetes. (c) Comparison of relative abundance of Firmicutes. (d) Relative abundance ratio of Firmicutes/Bacteroidetes. (e) Comparison of relative abundance of Epsilonbacteraeota. (f) Comparison of relative abundance of Actinobacteria. (g) Comparison of relative abundance of Tenericutes. (h) Comparison of relative abundance of Bacteroidota. # P<0.05, ##P< 0.01 (n=5). |
At the genus level, we also conducted a diversity analysis on the top 20 species of abundance (Figure 6). Compared with the blank group, the model group Prevotellaceae_ UCG-001, Alloprevotella, Bacteroides, Prevotellaceae_ NK3B31_ The abundance of group increased significantly (P < 0.05), while the abundance of Bacteroides decreased significantly (P < 0.05). Compared with the model group, Enterorhabdus and Clostridiales in the acupuncture group_ vadinBB60_ group_ unclassified, Clostridiales_ unclassified, Bilophila, Firmicutes_ unclassified, Lachnospiraceae_ Unclassified abundance increased significantly (P < 0.05), Prevotellariae_ The abundance of UCG-001 and Alloprevotella decreased significantly (P < 0.05). Compared with the model, Clostridiales in western medicine group_ vadinBB60_ group_ unclassified, Clostridiales_ Unclassified and Bilophila abundance increased significantly (P < 0.05), Alloprevotella abundance decreased significantly (P < 0.05), and there was no significant difference in other bacterial species.
 |
Figure 6 Structure and difference analysis of phyla horizontal flora. (a) Histogram of relative abundance of mouse flora composition at phyla level in each group. (b) Comparison of the relative abundance of Prevotellaceae_UCG-001 (c) Comparison of relative abundance of Alloprevotella. (d) Relative abundance ratio of Prevotellaceae_NK3B31_group. (e) Comparison of relative abundance of Bacteroides. (f) Comparison of relative abundance of Enterorhabdus. (g) Comparison of relative abundance of Clostridiales_vadinBB60_group_unclassified. (h) Comparison of relative abundance of Clostridiales_unclassified. (i) Comparison of relative abundance of Bilophila. (j) Comparison of relative abundance of Firmicutes_unclassified. (k) Comparison of relative abundance of Lachnospiraceae_unclassified. # P<0.05, ##P< 0.01 (n=5). |
Figure 7a is the mulberry diagram of intestinal microflora and genus level of mice in each group. The figure shows the relative abundance of flora at the phyla level (middle) and genus level (right) corresponding to different samples (left side), and visually shows the species annotation information, corresponding relationship and proportion of the two levels that are most concerned in the flora diversity research. Figure 7b is a tree of evolutionary branches. From inside to outside, different spheres represent domain boundary phyla order family genus species respectively. Different nodes in the figure represent different dominant genera. Solid lines indicate positive correlation and dotted lines indicate negative correlation. The size of the node indicates the number of other bacteria associated with the bacteria. The more associations, the larger the node. The above results show that different species in the acupuncture group: Prevotellaceae at the genus level_ NK3B31_ group, Ruminiclostridium_ 6, Ruminococcaceae_ UCG_ 004, Lachnoclostridium, Ruminococcaceae_ UCG_ 005; Rikenellaceae at the class level; Species level Prevotellaceae_ NK3B31_ group_ unclassified, Ruminiclostridium_ 6_ unclassified, Ruminococcaceae_ UCG_ 004_ unclassified, Ruminococcaceae_ UCG_ 005_ unclassified.
 |
Figure 7 (a) Phylum and genus level mulberry map (b) Evolution branch tree generated by LEfSe. |
Effect of Electroacupuncture on Fecal Bile Acids in Db/Db Mice
A total of 41 bile acids were quantified by quantifying the bile acid components in the feces of mice in each group. Among them, TLCA-3-S, GUDCA, GCDCA-3-S, GDCA-3-S, GHDCA, UCA, GHCA, GLCA-3-S, GCDCA, LCA-3-S, GCDCA, LCA-3-S, GLCA, IDCA, OCA, DHCA, THCA had a detection value of 0 in all samples, and more than 2 sample of TUDCA, TDCA, and GCA were not detected, making comparison difficult. Therefore, a total of 21 bile acids were included in the analysis.
We used PCA analysis to generally reflect the overall metabolic differences between samples of each group and the magnitude of variability among samples of each group.
The circle of the graph represents a 95% confidence interval, while samples that are similar is shown on the graph as being close to each other. PCA analysis of 21 bile acid metabolites showed that the blank group, model group, and electroacupuncture group were well differentiated (Figure 8a).
 |
Figure 8 Analysis of fecal bile acid spectrum in each group of mice (a) PCA diagram of fecal bile acid composition in each group of mice (b) Content ratio of primary and secondary bile acids in mouse feces (c) Changes in fecal primary bile acid spectrum in each group of mice (d) Changes in fecal secondary bile acid spectrum in each group of mice (e) Changes in fecal secondary bile acid spectrum in each group of mice. # P<0.05, ##P< 0.01 (n=6). |
By calculating the content and proportion of primary and secondary bile acids in the fecal bile acids of mice in each group, the primary bile acids in the blank group accounted for 32.67% of the total fecal bile acid spectrum, and the secondary bile acids accounted for 67.33% of the total fecal bile acid spectrum. In the model group, primary bile acids accounted for 37.09% of the total fecal bile acid spectrum, and secondary bile acids accounted for 62.91% of the total fecal bile acid spectrum. In the electroacupuncture group, primary bile acids accounted for 29.47% of the total fecal bile acid spectrum, and secondary bile acids accounted for 70.53% of the total fecal bile acid spectrum (Figure 8b). This indicates that electroacupuncture treatment can reduce the content of primary bile acids in db/db mice and increase the content of secondary bile acids in db/db mice. In the seven primary bile acid groups, compared with the model group, the bile acids with significant statistical differences in the blank group were TCA, CA, and TCDCA, respectively (P < 0.05), and all were in an upward trend. Compared with the model group, the bile acid with a significant difference in the electroacupuncture group was TCDCA (P < 0.05), which was also in an upward trend (Figure 8c). The content of 14 secondary bile acids in each group was significantly different between the blank group and the model group. The bile acid with significant difference was T- α- MCA/T- β- MCA, LCA, DBH, UDCA (P < 0.05), DBH, UDCA are in an upward trend, T- α- MCA/T- β- MCA and LCA are in a downward trend. The bile acid with significant difference between the electroacupuncture group and the model group was T- α- MCA/T- β- MCA and LCA (P < 0.05) are in a downward trend (Figure 8d and e).
Correlation Analysis Between Fecal Bile Acids and Intestinal Microbiota
Using Spearman correlation analysis, the correlation between gut microbiota and bile acid at the phylum and genus levels was calculated to reveal the important relationship between the two (Figure 9). At the phylum level, Firmicutes showed a positive correlation with LCA and a negative correlation with TCDCA and TCA (P < 0.05); Bacteroidetes was highly positively correlated with TCDCA (P < 0.01), positively correlated with CA, and negatively correlated with LCA (P < 0.05); Bacteroidota is positively correlated with TCDCA, highly negatively correlated with CDCA (P < 0.01), and negatively correlated with MDCA and LCA (P < 0.05); Epsilonbacteraeota was negatively correlated with CDCA (P < 0.05).
 |
Figure 9 Correlation analysis between fecal bile acids and differential gut microbiota Spearman correlation values were used for the matrix. Significant correlations were noted by *p < 0.05, and **p < 0.01. |
At the genus level, Prevotellaceae_ NK3B31_ The group showed a high positive correlation with CA and TCDCA (P < 0.01), and a negative correlation with CDCA (P < 0.05); Prevotellaceae_ UCG-001 is positively correlated with TCA and CA (P < 0.05), and highly positively correlated with TCDCA (P < 0.01); Alloprevotella is positively correlated with CA (P < 0.05), and negatively correlated with CDCA and LCA (P < 0.05); Clostridiales_ Unclassified vs LCA, 12-KDCA, ILCA α- MCA showed a positive correlation (P < 0.05); Enterorhabdus and T- α- MCA/T- β- MCA showed a high positive correlation (P < 0.01) and a positive correlation with CDCA (P < 0.05); Bilophila and T- α- MCA/T- β- MCA showed a positive correlation (P < 0.05).
Effect of Electroacupuncture on the Expression of TGR5 and GLP-1 Proteins in the Small Intestine of db/db Mice
Western blot analysis showed that compared with the blank group (Figure 10), the expression levels of TGR5 and GLP-1 proteins in the small intestine of the model group mice were significantly reduced (P < 0.05); Compared with the model group, the expression of TGR5 and GLP1 proteins in the acupuncture group and the Western medicine group significantly increased (P < 0.01). Both acupuncture and Western medicine can upregulate the expression levels of TGR5 and GLP1 proteins in db/db mice.
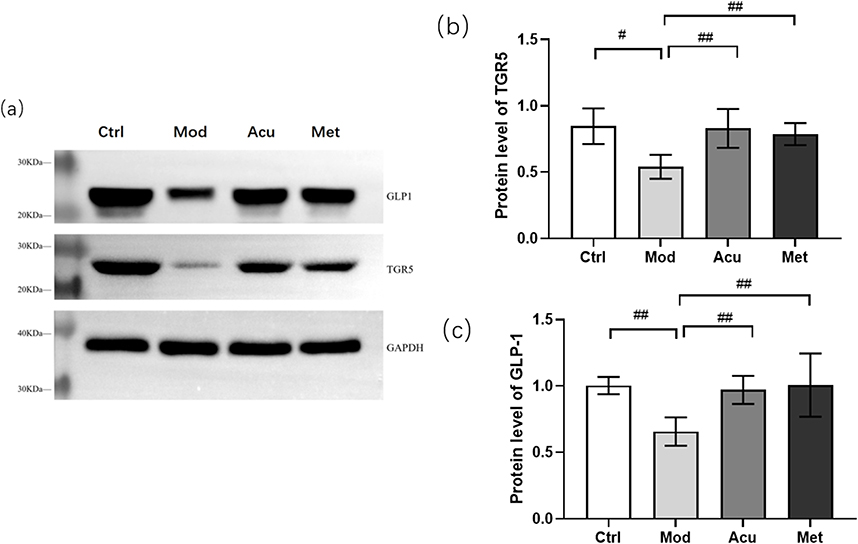 |
Figure 10 Expression of TGR5 and GLP1 proteins in each group of mice. (a) Representative Western blot brands of TGR5 and GLP-1 in the small intestine of db/db mice (b) The density analysis results of TGR5 in the small intestine of db/db mice (c) The density analysis results of GLP-1 in the small intestine of db/db mice. #P<0.05, ##P< 0.01. |
Discussion
Db/db mouse is a classic spontaneous diabetes mouse model caused by deletion of leptin receptor gene.19 Mice will have hyperinsulinemia about 2 weeks after birth, show obvious obesity 3–4 weeks after birth, and have hyperglycemia after 8 weeks, and show symptoms of diabetes such as overeating and polyuria. With the characteristics of hyperglycemia, hyperinsulinemia, hypertriglyceridemia, insulin resistance et, it is a good animal model for studying type 2 diabetes.20 We selected 7-week-old mice for adaptive feeding for 1 week, and used the same period of db/m mice as a blank control group to detect body weight, blood sugar, and experimental related indicators. During the entire experimental intervention process, the blank group mice were smaller in size compared to the other three groups and generally performed well. The model group mice showed signs of lethargy, rough and matte hair, obesity, lack of exercise, excessive drinking, overeating, and urination; The electroacupuncture of “regulating organs and unblocking collaterals” can significantly improve the survival status of experimental animals. Compared with the model control group, the electroacupuncture intervention group has a more lively experiment and shiny hair. After the intervention of “regulating viscera and unblocking collaterals” electroacupuncture, compared with the model, the weight and blood glucose-related indicators (fasting blood glucose, oral glucose tolerance, serum insulin levels, insulin sensitivity) of experimental animals were reduced, and blood lipid levels were also improved. These results clearly demonstrate that “regulating viscera and unblocking collaterals” electroacupuncture has a certain therapeutic effect on T2DM.
We used 16srDNA technology to detect the microbiota, and after preliminary analysis of the alpha diversity and beta diversity of the microbiota composition, we observed the biological heterogeneity between the microbial communities of each group of mice. Alpha diversity analysis showed that the diversity and abundance of db/db mice showed an upward trend after receiving electroacupuncture treatment with “regulating organs and dredging collaterals”. Beta diversity analysis using PCoA and NMDS calculations showed that the four groups of samples were well sorted, with significant differences between the groups and meaningful grouping.
Through the analysis of community composition and differences, we found that at the phylum level, compared with the blank group, the abundance values of Bacteroidetes in the model group mice increased, while the abundance values of Firmicutes decreased. The results are consistent with the intestinal structure of db/db mice studied by Zheng et al.21,22 In the past, Acupuncture can significantly increase the abundance of Firmicutes and upregulate the ratio of Firmicutes to Bacteroidetes. Intestinal bacteria mainly include gram-negative bacteria (Bacteroides and Proteus) and gram-positive bacteria (Actinomyces and Firmicutes). At the phylum level, the core microbial groups of the microbial community are basically the same, mainly composed of Bacteroidetes and Firmicutes, which dominate the intestinal microbiota of healthy adults, accounting for over 90% of the total intestinal microbiota at the phylum level. Bacteroidetes are the main species in the gut microbiota, and they are abundant in the human body and belong to the normal microbiota, playing an important role in maintaining the stability of the gut microbiota. Many studies have shown that it is closely related to metabolic diseases, and the polysaccharide utilization ability of Bacteroidetes is higher. Firmicutes are the dominant bacteria in the human gut microbiota, and their proportion changes play a crucial role in the occurrence and development of T2DM. Different members of Firmicutes also have different effects on the host, with some strains being beneficial for blood sugar control.23 Larsen et al showed that compared with the normal group, the number of Firmicus in the intestinal flora of the diabetes group decreased, and Bacteroides significantly increased.24 The ratio of Bacteroides/Firmicus was positively correlated with the blood glucose level, which confirmed that they were related to the reduction of glucose tolerance, and the above results were consistent with this study. There are also experimental conclusions to the contrary, that is, an increase in the number of Firmicutes in the intestine and a decrease in the abundance of Bacteroidetes.25,26 It can be seen that the gut microbiota is involved in the occurrence and development of T2DM, but a large sample size and comprehensive research strategy is still needed to verify the changes in the microbiota.
At the genus level, we found that after acupuncture and moxibustion treatment, there were 9 species of bacteria with the same trend as the blank group. Prevotellaceae_ UCG-001, Alloprevotella, and Prevotellaceae_ NK3B31_ The groups all belong to the genus Proctoria, and the two dominant genera in the phylum Bacteroidetes are mainly Bacteroidetes and Proctoria.27 The main fermentation products are acetic acid and succinic acid, as well as a small amount of isobutyric acid, isovaleric acid, and lactic acid, which are inhibited by bile acid in growth. Research has shown that healthy overweight adults with high Prevotella abundance lose more fat than subjects with low Prevotella abundance after consuming a free diet rich in whole grains and fiber for 6 weeks.28 This further indicates that high levels of Prevotella are associated with obesity and are significantly correlated with BMI index, insulin resistance, hypertension, and non-alcoholic fatty liver disease.29 There are also studies showing that Prevotella is associated with pro-inflammatory function. Treating mice with Prevotella can exacerbate the occurrence of colitis in mice.30 The reason may be that Prevotella may interact with other bacterial communities, promoting carbohydrate fermentation, inducing visceral hypersensitivity reactions, and exacerbating irritable bowel syndrome.
Bile acids play an important role in glucose and lipid metabolism. Bile acids are derived from cholesterol, which is metabolized to produce primary bile acids.31 In the intestine, bile acids are eliminated through the bile ducts and interact with the microbiota to generate secondary bile acids.32 Some bile acids also play an important role in lipid metabolism in the intestine.33 In general, 95% of bile acids can be reabsorbed by the intestine and returned to the liver through the portal vein. This continuous transmission process between the liver and the intestine is called the hepatointestinal circulation of bile acids.34 The composition of bile acids in humans and mice is very different. In humans, bile acid pools are composed of approximately 40% CA and CDCA, as well as 20% DCA. In mice, the bile acid pool consists of approximately 50% CA and 50% α and β- MCA composition.32 At present, there are more than 150 known bile acids, with over 80 widely studied and around 40 standard products available for purchase. Therefore, in order to clarify the changes in the types and quantities of bile acids in db/db mice after the electroacupuncture intervention of “regulating the organs and unblocking the collaterals”, this study measured the content of 41 bile acids in mouse feces using UPLC-MS/MS technology, and screened out 21 bile acids with effective significance, including 7 primary bile acids and 14 secondary bile acids. Through analysis, it was found that there were 3 different bile acids among the three groups, namely primary bile acid TCDCA and secondary bile acid T- α- MCA/T- β- MCA, LCA, therefore, the following targeted elucidation of the relationship between experimental results and glucose metabolism.
TCDCA is closely related to cholesterol metabolism, bile acid reabsorption, glucose and lipid metabolism and other biological processes. It is a combination form of CDCA taurine and is used to treat cholelithiasis and cholestatic liver disease.35 But different studies have different results regarding its regulation of blood sugar. Zhang et al36 studied that in the ob/ob2 type diabetes mouse model, TCDCA alleviated IR, and reduced oxidative stress and intestinal inflammation. The mechanism of its action may be that TCDCA blocks the binding of KEAP1 and Nrf2, leading to Nrf2 translocation to the nucleus and initiating the transcription of antioxidant genes, ultimately reducing intracellular ROS accumulation and improving insulin signaling. There are also studies showing that a decrease in TCDCA levels can improve insulin sensitivity, thereby reducing liver glucose production.37 This is consistent with the results of this study, where the content of primary bile acid TCDCA decreased after the intervention of “regulating the organs and unblocking the collaterals” electroacupuncture.
T- 1α- MCA and T- β- MCA, these two bile acids, have FXR antagonistic properties. Sun et al found that T- β- The increase of MCA content will inhibit intestinal FXR signal transduction, which can improve liver steatosis, decreased glucose tolerance and inflammation.38 There are research reports on mouse intestinal T- β- MCA accumulation, weakened FXR signal, increased bile acid synthesis, and decreased cholesterol.38 Yang Ling et al demonstrated that T in the distal ileum of elderly mice with lipid metabolism disorders- β- MCA decreases, while T in the liver and serum- β- MCA also significantly decreased, which also proves the increased T in the intestine- β- MCA can lead to a decrease in FXR activity, thereby regulating lipid metabolism disorders.39 T- β- MCA cannot be metabolized in the absence of bacteria. In the small intestine, coupled bile acids are hydrolyzed by BSH into free bile acids, which then pass through 7- α Dehydroxylation generates secondary bile acids. The activity of gut microbiota and bile salt hydrolytic enzymes can regulate intestinal T- β- MCA level.38,40
LCA is a secondary bile acid formed by the conversion of CDCA and UDCA through gut microbiota. Relevant research results show that LCA can promote intestinal Ca2+absorption by inhibiting oxidative stress, thereby improving diabetes.41 An increase in LCA levels can upregulate TGR5 expression, while increasing L cell abundance and serum GLP-1 levels. LCA is the most effective endogenous ligand of TGR5.42 Activation of TGR5 leads to an increase in receptor cyclic adenosine monophosphate (cAMP) levels, protein kinase A (PKA) activation, and target protein phosphorylation levels. LCA induced TGR5 activation is extensive and cell specific, including anti-inflammatory effect on macrophages, increasing energy consumption of brown adipose tissue tissue (BAT), improving glucose metabolism and insulin sensitivity.43 In C57Bl/6J mice, LCA can significantly reduce body weight, which may be related to its effects on energy expenditure and fat metabolism.44 There are also studies showing that increasing LCA levels can activate TGR5 and upregulate the expression of coupling proteins, thereby accelerating energy consumption.45 The increase in LCA can also activate TGR5 mediated cAMP/PKA signaling to maintain glucose homeostasis.46,47 Studies have shown that LCA can alleviate intestinal epithelial cell barrier damage, inhibit inflammatory reactions, and improve intestinal mucosal permeability, which is of great significance for maintaining the integrity of intestinal mucosal barrier function.48
The gut microbiota plays a crucial role in bile acid metabolism, and primary bile acids undergo 7- α Dehydroxylation is converted into secondary bile acids. Previous studies have shown that there are 7- α The types of bacteria with dehydroxylation activity include Firmicutes.49 Without the contribution of microorganisms to bile acid metabolism, host bile acid signals will be disrupted, affecting a range of host physiological processes.50,51 There is experimental evidence that bile acid diversity is significantly reduced in sterile or antibiotic treated rats. At the same time, secondary bile acids can play a role in maintaining intestinal homeostasis and mucosal barrier integrity. In the above, we also mentioned that bile salt hydrolase BSH can catalyze the formation of secondary bile acids. The bacteria with high diversity of distribution of Gram positive intestinal bacteria BSH include Firmicus, Clostridium, Enterococcus, etc which is also the main bacteria we regulate after acupuncture.49,52 In this study, we conducted Spearman correlation analysis between bile acids and differential microbiota, and found a close relationship between bile acids and gut microbiota. Firmicutes and F/B showed a positive correlation with LCA and a negative correlation with TCDCA in the screened bacterial populations with significant differences; Enterorhabdus and Bilophila with T- α- MCA/T- β- MCA shows a positive correlation; Clostridiales_ Unclassified is positively correlated with LCA; Prevotellaceae_ UCG-001 is positively correlated with TCDCA; Alloprevotella is negatively correlated with LCA, and the above research facts also indicate that bile acid metabolism and intestinal flora are associated with the occurrence of diabetes.
Conclusion
The “adjusting internal organs and dredging channel” electroacupuncture can significantly improve the survival status of mice, and after intervention, the body weight, blood sugar, blood lipids, etc. of db/db mice have decreased, indicating that the “adjusting internal organs and dredging channel” electroacupuncture can significantly improve glucose and lipid metabolism disorders in mice. The detection results of 16SrDNA technology showed that electroacupuncture with “adjusting internal organs and dredging channel” can improve the abundance of gut microbiota in db/db mice, while significantly increasing beneficial bacteria and reducing harmful bacteria. It mainly increases the abundance of Firmicutes at the phylum level, upregulates the ratio of Firmicutes to Bacteroidetes, reduces the abundance of Prevotella at the genus level, and increases the abundance of Fusobacterium, consistent with previous studies. Based on UPLC-MS/MS detection technology, we determined the content of 41 bile acids in the feces of mice in each group, and screened out 21 bile acids with detection values of more than half. After statistical analysis, we found that “adjusting internal organs and dredging channel” electroacupuncture treatment can reduce the content of primary bile acids in db/db mice and increase the content of secondary bile acids in db/db mice. Simultaneously obtaining differences in bile acids TCDCA and T among three groups- α- MCA/T- β- MCA and LCA. Through correlation analysis of differential bile acids, it was found that TCDCA, T- α- MCA/T- β- MCA and LCA may interact with gut microbiota as key signaling molecules to participate in blood glucose regulation.
Acknowledgments
This work was supported by the “Jilin Natural Science Foundation Science and Technology Development Plan Project (No. 20200201612JC)” and the “Jilin Provincial Department of Education Science and Technology Research Project (No. JJKH20220854KJ)”.
Disclosure
The authors report no conflicts of interest in this work.
References
1. American Diabetes Association. Diagnosis and classification of diabetes mellitus. Diabetes Care. 2011;34(Suppl 1):S62–S69. doi:10.2337/dc11-S062
2. Saeedi P, Petersohn I, Salpea P, et al. Global and regional diabetes prevalence estimates for 2019 and projections for 2030 and 2045: results from the international diabetes federation diabetes atlas. Diabetes Res Clin Pract. 2019;157:107843.
3. Goyal R, Jialal I. Diabetes Mellitus Type 2. In: StatPearls. Treasure Island (FL): StatPearls Publishing; 2021.
4. Shen TD. Diet and Gut Microbiota in Health and Disease. Nestle Nutr Inst Workshop Ser. 2017;88:117–126.
5. Jiaqing S. Cut microbiota: a new world for the prevention and control of metabolic disease. J Med Postgrad. 2016;29(1):16–20.
6. Peng X, Chen S, Zhong L, et al. Cyclocarya paliurus leaves extracts alleviate metabolic phenotypes in Chinese T2DM patients by modulating gut microbiota and metabolites: a clinical randomized controlled trial. Front Endocrinol. 2023;14:1176256. doi:10.3389/fendo.2023.1176256
7. Plovier H, Everard A, Druart C, et al. A purified membrane protein from Akkermansia muciniphila or the pasteurized bacterium improves metabolism in obese and diabetic mice. Nature Medicine. 2017;23(1):107–113. doi:10.1038/nm.4236
8. Jia W, Li Y, Cheung KCP, et al. Bile acid signaling in the regulation of whole body metabolic and immunological homeostasis. Sci China Life Sci. 2023. doi:10.1007/s11427-023-2353-0
9. McGlone ER, Bloom SR. Bile acids and the metabolic syndrome. Ann Clin Biochem. 2019;56(3):326–337. doi:10.1177/0004563218817798
10. Chiang JY, Ferrell JM. Bile acids as metabolic regulators and nutrient sensors. Annu Rev Nutr. 2019;39:175–200. doi:10.1146/annurev-nutr-082018-124344
11. Q MA, Alessandro M, Herbert T, et al. Risk of cardiomyopathy and cardiac arrhythmias in patients with nonalcoholic fatty liver disease. Nature reviews. Gastroenterol Hepatol. 2018;15(7):425–439.
12. de Aguiar Vallim TQ, Tarling EJ, Edwards PA. Pleiotropic roles of bile acids in metabolism. Cell Metab. 2013;17(5):657–669. doi:10.1016/j.cmet.2013.03.013
13. Son S, Park EJ, Kim Y, et al. Chemical chaperone-conjugated exendin-4 as a cytoprotective agent for pancreatic B-cells. Int J Biochem Cell Biol. 2018;105:13–19. doi:10.1016/j.biocel.2018.09.018
14. Smits MM, Tonneijck L, Muskiet MHA, et al. Gastrointestinal actions of glucagon like peptide - 1 - based therapies: glycaemic control beyond the pancreas. Diabetes Obesity Metab. 2016;18(3):224–235. doi:10.1111/dom.12593
15. Chen C, Liu J, Sun M, Liu W, Han J, Wang H. Acupuncture for type 2 diabetes mellitus: a systematic review and meta-analysis of randomized controlled trials. Complement Ther Clin Pract. 2019;36:100–112. doi:10.1016/j.ctcp.2019.04.004
16. Wang H, Chen X, Chen C, et al. Electroacupuncture at lower he-sea and front-mu acupoints ameliorates insulin resistance in type 2 diabetes mellitus by regulating the intestinal flora and gut barrier. Diabetes Metab Syndr Obes. 2022;15:2265–2276. doi:10.2147/DMSO.S374843
17. Liu S, Guo R, Liu F, et al. Gut microbiota regulates depression-like behavior in rats through the neuroendocrine-immune mitochondrial pathway. Neuropsychiatr Dis Treat. 2020;16:859–869. doi:10.2147/NDT.S243551
18. Walters W, Hyde ER, Berg-Lyons D, et al. Improved Bacterial 16S rRNA Gene (V4 and V4-5) and fungal internal transcribed spacer marker gene primers for microbial community surveys. mSystems. 2015;1(1):e00009–15.
19. Barrios-Correa AA, Estrada JA, Contreras I. Leptin signaling in the control of metabolism and appetite: lessons from animal models. J Mol Neurosci. 2018;66(3):390–402. doi:10.1007/s12031-018-1185-0
20. Bates SH, Kulkarni RN, Seifert M, et al. Roles for leptin receptor/STAT3-dependent and -independent signals in the regulation of glucose homeostasis. Cell Metab. 2005;1(3):169–178. doi:10.1016/j.cmet.2005.02.001
21. Zheng S, Wang Y, Fang J, et al. Oleuropein ameliorates advanced stage of type 2 diabetes in db/db mice by regulating gut microbiota. Nutrients. 2021;13(7):2131. doi:10.3390/nu13072131
22. Li C, Wang X, Sun S, et al. Effects of a ready-to-eat cereal formula powder on glucose metabolism, inflammation, and gut microbiota in diabetic db/db mice. Food Sci Nutr. 2020;8(8):4523–4533. doi:10.1002/fsn3.1761
23. Yassour M, Lim MY, Yun HS, et al. Sub-clinical detection of gut microbial biomarkers of obesity and type 2 diabetes. Genome Med. 2016;8(1):17. doi:10.1186/s13073-016-0271-6
24. Larsen N, Vogensen FK, van den Berg FW, et al. Gut microbiota in human adults with type 2 diabetes differs from non-diabetic adults. PLoS One. 2010;5(2):e9085. doi:10.1371/journal.pone.0009085
25. Qiu J, Zhou H, Jing Y, Dong C, Jing Y, et al. Association between blood microbiome and type 2 diabetes mellitus: a nested case-control study. J Clin Lab Anal. 2019;33(4). doi:10.1002/jcla.22842
26. Lyu Y, Lin L, Xie Y, et al. Blood-glucose-lowering effect of coptidis rhizoma extracts from different origins via gut microbiota modulation in db/db mice. Front Pharmacol. 2021;12:684358. doi:10.3389/fphar.2021.684358
27. Kovatcheva-Datchary P, Nilsson A, Akrami R, et al. Dietary fiber-induced improvement in glucose metabolism is associated with increased abundance of prevotella. Cell Metab. 2015;22(6):971–982. doi:10.1016/j.cmet.2015.10.001
28. Christensen L, Vuholm S, Roager HM, et al. Prevotella abundance predicts weight loss success in healthy, overweight adults consuming a whole-grain diet ad libitum: a post hoc analysis of a 6-Wk randomized controlled trial. J Nutr. 2019;149(12):2174–2181. doi:10.1093/jn/nxz198
29. Ley RE. Gut microbiota in 2015: prevotella in the gut: choose carefully. Nat Rev Gastroenterol Hepatol. 2016;13(2):69–70. doi:10.1038/nrgastro.2016.4
30. Scher JU, Sczesnak A, Longman RS, et al. Expansion of intestinal Prevotella copri correlates with enhanced susceptibility to arthritis. Elife. 2013;2:e01202.
31. Chiang JYL, Ferrell JM. Bile acid metabolism in liver pathobiology. Gene Expr. 2018;18(2):71–87. doi:10.3727/105221618X15156018385515
32. Li T, Chiang JY. Bile acid signaling in metabolic disease and drug therapy. Pharmacol Rev. 2014;66:948–983. doi:10.1124/pr.113.008201
33. Matsubara T, Li F, Gonzalez FJ. FXR signaling in the enterohepatic system. Mol Cell Endocrinol. 2013;368(1–2):17–29. doi:10.1016/j.mce.2012.05.004
34. Voronova V, Sokolov V, Al-Khaifi A, et al. A physiology-based model of bile acid distribution and metabolism under healthy and pathologic conditions in human beings. Cell Mol Gastroenterol Hepatol. 2020;10(1):149–170. doi:10.1016/j.jcmgh.2020.02.005
35. Lu Q, Jiang Z, Wang Q, et al. The effect of Tauroursodeoxycholic acid (TUDCA) and gut microbiota on murine gallbladder stone formation. Ann Hepatol. 2021;23:100289. doi:10.1016/j.aohep.2020.100289
36. Zhang Y, Cheng Y, Liu J, et al. Tauroursodeoxycholic acid functions as a critical effector mediating insulin sensitization of metformin in obese mice. Redox Biol. 2022;57:102481. doi:10.1016/j.redox.2022.102481
37. Zhang SY, Li RJW, Lim YM, et al. FXR in the dorsal vagal complex is sufficient and necessary for upper small intestinal microbiome-mediated changes of TCDCA to alter insulin action in rats. Gut. 2021;70(9):1675–1683. doi:10.1136/gutjnl-2020-321757
38. Jiang C, Xie C, Li F, et al. Intestinal farnesoid X receptor signaling promotes nonalcoholic fatty liver disease. J Clin Invest. 2015;125(1):386–402. doi:10.1172/JCI76738
39. Yang L, Chen KC, Luo DS, Guo J et al., 等. Efficacy and Mechanism of Tianhuang Formula in Regulating Lipid Metabolism Disorders in Senile Mice Based on Gut Microbiota-TβMCA-FXR Axis [基于肠道菌群-TβMCA-FXR轴探讨田黄方对老年脂代谢紊乱小鼠作用机制]. 中药药理与临床. 2023;39(01):18–24.
40. Li F, Jiang C, Krausz KW, et al. Microbiome remodelling leads to inhibition of intestinal farnesoid X receptor signalling and decreased obesity. Nat Commun. 2013;4:2384. doi:10.1038/ncomms3384
41. Marchionatti AM, Pérez A, Rivoira MA, et al. Lithocholic acid: a new emergent protector of intestinal calcium absorption under oxidant conditions. Biochem Cell Biol. 2017;95(2):273–279. doi:10.1139/bcb-2016-0164
42. Nguyen A, Bouscarel B. Bile acids and signal transduction: role in glucose homeostasis. Cell Signal. 2008;20(12):2180–2197. doi:10.1016/j.cellsig.2008.06.014
43. Li P, Zhu L, Yang X, et al. Farnesoid X receptor interacts with cAMP response element binding protein to modulate glucagon-like peptide-1 (7-36) amide secretion by intestinal L cell. J Cell Physiol. 2019;234(8):12839–12846. doi:10.1002/jcp.27940
44. Ward JBJ, Lajczak NK, Kelly OB, et al. Ursodeoxycholic acid and lithocholic acid exert anti-inflammatory actions in the colon. Am J Physiol Gastrointest Liver Physiol. 2017;312(6):G550–G558. doi:10.1152/ajpgi.00256.2016
45. Hui S, Liu Y, Huang L, et al. Resveratrol enhances brown adipose tissue activity and white adipose tissue browning in part by regulating bile acid metabolism via gut microbiota remodeling. Int J Obes. 2020;44(8):1678–1690. doi:10.1038/s41366-020-0566-y
46. Hui S, Huang L, Wang X, et al. Capsaicin improves glucose homeostasis by enhancing glucagon-like peptide-1 secretion through the regulation of bile acid metabolism via the remodeling of the gut microbiota in male mice. FASEB J. 2020;34(6):8558–8573. doi:10.1096/fj.201902618RR
47. Han Z, Yao L, Zhong Y, et al. Gut microbiota mediates the effects of curcumin on enhancing Ucp1-dependent thermogenesis and improving high-fat diet-induced obesity. Food Funct. 2021;12(14):6558–6575. doi:10.1039/D1FO00671A
48. Shao J, Ge T, Tang C, et al. Synergistic anti-inflammatory effect of gut microbiota and lithocholic acid on liver fibrosis. Inflamm Res. 2022;71(10–11):1389–1401. doi:10.1007/s00011-022-01629-4
49. Yao L, Seaton SC, Ndousse-Fetter S, et al. A selective gut bacterial bile salt hydrolase alters host metabolism. Elife. 2018;7:e37182. doi:10.7554/eLife.37182
50. Grüner N, Mattner J. Bile acids and microbiota: multifaceted and versatile regulators of the liver-gut axis. Int J Mol Sci. 2021;22(3):1397. doi:10.3390/ijms22031397
51. Joyce SA, MacSharry J, Casey PG, et al. Regulation of host weight gain and lipid metabolism by bacterial bile acid modification in the gut. Proc Natl Acad Sci U S A. 2014;111(20):7421–7426. doi:10.1073/pnas.1323599111
52. Song Z, Cai Y, Lao X, et al. Taxonomic profiling and populational patterns of bacterial bile salt hydrolase (BSH) genes based on worldwide human gut microbiome. Microbiome. 2019;7(1):9. doi:10.1186/s40168-019-0628-3
 © 2023 The Author(s). This work is published and licensed by Dove Medical Press Limited. The
full terms of this license are available at https://www.dovepress.com/terms
and incorporate the Creative Commons Attribution
- Non Commercial (unported, 3.0) License.
By accessing the work you hereby accept the Terms. Non-commercial uses of the work are permitted
without any further permission from Dove Medical Press Limited, provided the work is properly
attributed. For permission for commercial use of this work, please see paragraphs 4.2 and 5 of our Terms.
© 2023 The Author(s). This work is published and licensed by Dove Medical Press Limited. The
full terms of this license are available at https://www.dovepress.com/terms
and incorporate the Creative Commons Attribution
- Non Commercial (unported, 3.0) License.
By accessing the work you hereby accept the Terms. Non-commercial uses of the work are permitted
without any further permission from Dove Medical Press Limited, provided the work is properly
attributed. For permission for commercial use of this work, please see paragraphs 4.2 and 5 of our Terms.