Back to Journals » Journal of Pain Research » Volume 15
Effects of Exercise-Induced Hypoalgesia at Different Aerobic Exercise Intensities in Healthy Young Adults
Authors Niwa Y ![]() , Shimo K
, Shimo K ![]() , Ohga S
, Ohga S ![]() , Tokiwa Y, Hattori T, Matsubara T
, Tokiwa Y, Hattori T, Matsubara T
Received 29 July 2022
Accepted for publication 25 October 2022
Published 17 November 2022 Volume 2022:15 Pages 3615—3624
DOI https://doi.org/10.2147/JPR.S384306
Checked for plagiarism Yes
Review by Single anonymous peer review
Peer reviewer comments 3
Editor who approved publication: Dr Alaa Abd-Elsayed
Yuto Niwa,1 Kazuhiro Shimo,2 Satoshi Ohga,2 Yuji Tokiwa,1 Takafumi Hattori,1 Takako Matsubara1,2
1Faculty of Rehabilitation, Kobe Gakuin University Graduate School, Kobe, Japan; 2Department of Physical Therapy, Faculty of Rehabilitation, Kobe Gakuin University, Kobe, Japan
Correspondence: Yuto Niwa, Faculty of Rehabilitation, Kobe Gakuin University Graduate School, 518 Arise, Ikawadani-cho, Nishi-ku, Kobe, Hyogo, 651-2180, Japan, Tel +81-90-6587-2828, Email [email protected]
Purpose: Exercise-induced hypoalgesia (EIH) is a reduction in pain sensitivity that occurs following a single bout of exercise. However, little research has compared the EIH effects of exercise at different intensities, including low intensity, in the same participant. It is unclear as to which exercise intensities demonstrate EIH more effectively. The aim of this study was to examine and compare the effect of different intensities of exercise on pain sensitivity in the same participant.
Methods: We included 73 healthy young adult volunteers (35 female and 38 male) in this experimental cross-over study. Each participant completed four experimental sessions of 30 min, consisting of aerobic exercise at 30% heart rate reserve (HRR), aerobic exercise at 50% HRR, aerobic exercise at 70% HRR, and quiet rest. EIH was assessed using the pressure pain threshold (PPT) and temporal summation of pain (TSP) in the quadriceps, biceps, and trapezius.
Results: Low- and moderate-intensity exercise increased the multisegmental PPT and reduced TSP (all P < 0.05). High-intensity exercise increased the multisegmental PPT (all P < 0.05), but decreased TSP in only the quadriceps and biceps (P < 0.05), not the trapezius (P = 0.13). We found no difference in relative PPT and TSP changes between exercise intensities (P > 0.05) except for relative PPT change at the quadriceps (P < 0.05).
Conclusion: Our results show that not only moderate- and high-intensity exercise, but also low-intensity exercise can produce a hypoalgesic response.
Keywords: exercise intensity, exercise-induced hypoalgesia, aerobic exercise, pressure pain threshold, temporal summation of pain
Introduction
Exercise has been shown to have beneficial effects on chronic diseases, including musculoskeletal, neurological, cardiovascular, metabolic, pulmonary, mental and mood disorders, as well as cancer.1 Especially for chronic musculoskeletal pain, exercise is considered one of the first-line treatments.2,3 Exercise has a hypoalgesic effect and even a single bout of exercise can induce hypoalgesia. This analgesic effect of exercise is called exercise-induced hypoalgesia (EIH). EIH is a generalized decrease in pain sensitivity during and after a single exercise session in the exercising as well as non-exercising body parts; the mechanism has been suggested to involve the endogenous pain inhibitory system.4–7
EIH studies have used a variety of exercise protocols in terms of exercise type, time, and intensity. Among exercise types, aerobic exercise is more effective for EIH,8 and the effective exercise time is that lasting more than 30 minutes.9 Hoffman et al9 reported that the EIH effect is greater with high-intensity exercise. However, some studies have demonstrated no change or increased pain sensitivity with high-intensity exercise in patients with chronic pain;10–13 thus, it may be difficult to apply high-intensity exercise in clinical practice. For this reason, Meeus et al14 recommended that patients with chronic pain start with low-intensity exercise, which is defined at oxygen uptake reserve (VO2R), 20–39%; heart rate reserve (HRR), 20–39%; and maximum heart rate (HRmax), 50–63% by the American College of Sports Medicine.15 Low-intensity aerobic exercise is often used in clinical practice as an intervention that is easily applicable to patients with chronic pain.16 Previous studies of EIH have mostly investigated moderate- to high-intensity exercise. Some of the exercises treated as “low-intensity” in previous studies,7,17 involved moderate or higher intensity exercises instead. A few studies have examined the EIH effects of the above-mentioned low-intensity aerobic exercise, but there is still controversy as to whether low-intensity aerobic exercise causes EIH.18,19 Furthermore, there are no studies examining EIH effects in the same participants using different intensities (low, moderate, and high) of exercise. Therefore, it is unclear which exercise intensities have the best EIH effect.
In a study of EIH, pain sensitivity has been quantified using quantitative sensory testing (QST),20,21 which is classified into static and dynamic QST.22 It is thought that exercise affects nociceptors in the muscle more than in the skin, with tenderness more likely to occur from nociceptors deep in the muscle and heat pain from nociceptors on the surface of the skin.23 Therefore, pressure stimulation is considered appropriate for determining the effectiveness of EIH. Pressure pain threshold (PPT), classified as static QST, is used to assess the state of pain sensitivity in the peripheral nervous system.24 Increased PPT in the exercising body part indicates a local EIH response, while increased PPT in the non-exercising body part indicates a systemic EIH response.20 PPT at exercising and non-exercising body parts are the most frequently investigated and may be the most appropriate to examine pain sensitivity. Temporal summation of pain (TSP), a part of dynamic QST, is a phenomenon in which pain increases with repeated nociceptive stimulation above 0.3 Hz,24,25 and is considered to reflect the degree of summation at the spinal dorsal horn (ie, wind-up).26 Therefore, the TSP mainly provides information on the ascending pain transmission system. Previous studies have found that aerobic and isometric exercises increased the pain threshold (ie, pressure, heat) and reduced the temporal summation of pressure and heat pain.4–6,20,21 EIH is expected to improve pain sensitivity, including the ascending pain transmission system. A few studies have examined the differences in the effects of moderate- and high-intensity exercises on pain sensitivity in the same participants.17,27 However, these studies have not examined the effect of low-intensity exercise, as low as 30%. Another study examining the effects of low-intensity exercise on pain was limited due to a small sample size (n = 10).18 Therefore, it is unclear which exercise intensity can improve pain sensitivity more effectively.
The purpose of this study was to examine and compare the effect of different intensities of exercise on PPT and TSP at the exercising and non-exercising body parts in the same participant. We hypothesized that low-intensity exercise causes local and remote EIH responses to the same extent as moderate- and high-intensity exercise.
Materials and Methods
Participants
This was an experimental cross-over study on the effect of a low-intensity exercise on pain sensitivity in healthy young adults. Participants were recruited through advertisements in the local university campus. As per the inclusion criteria, pain-free individuals aged 18 to 25 years, who were able to speak, read, and write Japanese, were enrolled. Exclusion criteria were neurological, cardiovascular, or psychological disorders; pregnancy; acute or chronic pain conditions; and use of any pain medication. All participants were asked to avoid strenuous exercise and alcohol the day before participation and to refrain from exercise, coffee, nicotine, and alcohol before the experiment. If menstruation occurred on the day of the experiment and/or if signs of muscle damage were observed, the experiment was halted and conducted on another day.
This study was carried out according to the Declaration of Helsinki, approved by the Institutional Ethical Committee of Kobe Gakuin University (approval number: So-Rin 19–24; date of approval: November 19, 2019). All participants provided informed written consent before participating.
Sample size calculation was performed using G*Power, version 3.1.9.6.(Dusseldorf, Germany). A priori power analysis determined that with a power of 0.80 and alpha ≤ 0.05 on a paired t-test, 60 participants were required to detect a significant difference in the change in PPT between pre and post exercise values with a small effect size (d = 0.37).28 Thus, a target sample of 70–75 participants was planned to provide more power and precision to the analysis and account for the possibility of participant dropout (approximately 20%).
Procedure
All participants participated in five sessions at approximately the same time of the day, with the sessions separated by a minimum of 48 hours (Figure 1).9,27 For female subjects, measurements were avoided during menstruation. Participants were introduced to the procedures and familiarized with the pressure pain assessments, namely, that of PPT and TSP in the first session, followed by four experimental sessions. The measurement order was PPT followed by TSP. To avoid tissue damage, the maximum stimulation intensities were 1000 kPa for PPT and TSP. During PPT and TSP, participants were seated on a chair. The four experimental sessions included aerobic exercises performed at 30% HRR, 50% HRR, 70% HRR, and a rest session. At the beginning of each session, participants were fitted with a Polar Heart Rate monitor (OH1) (Polar Electro Oy, Kempele, Finland), which monitored and collected heart rate (HR) during exercise and rest. The order of each exercise and rest session was allocated randomly. PPT and TSP at the thigh, arm, and shoulder were assessed before and immediately after exercise and the rest session. A 5-minute rest was given before the first PPT was assessed. Participants maintained the same pain testing order for every session pre-exercise and immediately after exercise and quiet rest. All assessments were performed by one assessor.
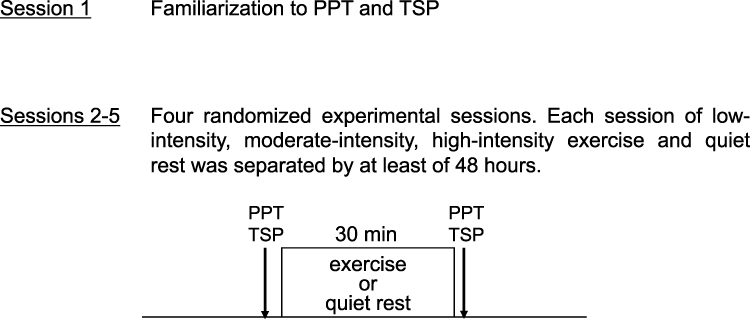 |
Figure 1 Illustration of the experimental procedure in each session. Pressure pain threshold (PPT) and temporal summation of pain (TSP) are assessed in the quadriceps, biceps, and trapezius with a handheld algometer before and immediately after the exercise and rest sessions. |
Pressure Pain Threshold
PPT was assessed using a handheld pressure algometer (Somedic Algometer type II, SBMEDIC Electronics, Solna, Sweden) with a stimulation area of 1 cm2. Measurement of PPT using a handheld pressure algometer has been reported as reliable (intraclass correlation coefficients [ICC]2,3: 0.972; 95% CI: 0.887–0.993).29 Three assessment sites were located and marked on the non-dominant side (ie, the non-writing side) of the body. Location 1 was 15 cm proximal to the base of the patella in the middle of the quadriceps muscle (exercising body part).30 Location 2 was 10 cm proximal to the cubital fossa in the middle of the biceps brachii muscle (non-exercising body part).7 Location 3 was 10 cm from the acromion in direct line with the neck at the upper trapezius muscle (non-exercising body part).7,30 The PPT was assessed for each site by gradually applying pressure (30 kPa/s) until the patient defined the pressure as pain.31,32 PPT was measured twice at each site and the average of the two measurements was used in the statistical analyses.30–32
Temporal Summation of Pressure Pain
TSP used the same measurement equipment as PPT and it was measured in accordance with previous studies.31–33 Measurement of TSP using a handheld pressure algometer has been reported as reliable ([ICC]2,3: 0.710; 95% CI: 0.295–0.930).29 TSP was assessed by pressure stimuli delivered at 0.5 Hz (1 second duration and 1 second interval).31,32 Between stimulations, constant non-painful pressure of 10 kPa was maintained to prevent the probe from moving.33 The intensity of the pressure stimulus for TSP was PPT × 1.25 kPa.34 Ten sequential stimulations were applied once to each site: the quadriceps muscle, biceps brachii muscle, and upper trapezius muscle (Locations 1, 2, and 3, respectively). Participants were instructed to evaluate the pain intensity on the visual analog scale (VAS) for each of the ten stimulations. The VAS defines 0 as “no pain”, whereas 100 indicates “maximal pain.” In order to represent the degree of summation, the normalized VAS score was extracted by subtracting the VAS scores from the first stimulation.35 For TSP analyses, the accumulated normalized VAS score (VAS-sum) of the ten stimulations was used.35
Exercise Sessions
Each of the three aerobic exercise sessions (low-, moderate-, and high-intensity) lasted 30 min. Aerobic exercises were performed using a stationary cycle ergometer (AEROBIKE EZ101, Konami Sports Life, Kanagawa, Japan). The exercise sessions tested for changes in PPT and TSP after 30 min of bicycling. In the low- and moderate-intensity exercise sessions, the participants cycled for 30 min at the intensity of 30% and 50% HRR, respectively. In the high-intensity sessions, the participants cycled for the first 5 min at an intensity of up to 50% HRR (warm-up period), after which the resistance of the cycle ergometer was increased to correspond to an intensity that elicited 70% HRR. The saddle and handlebars were positioned according to the participants’ preferences, and they were instructed to place their hands on the handlebars or grip during aerobic exercise.
A target HR was determined for each participant using the Karvonen method.36 The Karvonen method has been used in studies examining the hypoalgesic effects of many aerobic exercises.23,27,37,38 The Karvonen method is related to the percentage of age-predicted maximal HR, but allows for differences in resting HR with the following method: target HR = (age-predicted maximal HRR) × % intensity plus resting HR. Age-predicted maximal HR is given by 220 minus age. Participants were instructed to maintain a pedal frequency of 60–70 rounds per minute.
Quiet Rest—Control Session
This control session tested for changes in PPT and TSP after quiet rest. The participants were instructed to relax in a seated position in a comfortable chair for 30 min in an undisturbed room with a temperature of 22°C and were not allowed to read or use any devices such as smart phones.
Statistical Analyses
Data are presented in the text as mean and standard deviation for parametric data, median and interquartile range (IQR) for nonparametric data, and box-and-whisker plots for figures. We used nonparametric tests because the distribution of PPT and TSP deviated significantly from normal (Shapiro–Wilk test, P < 0.05). The relative changes of PPT and TSP were calculated by (PPT/TSP values-immediately after - PPT/TSP values-before) ÷ (PPT/TSP values-before) × 100, denoted as relative PPT change and relative TSP change hereafter. Thus, positive values of relative PPT change represent a decrease in pain sensitivity after exercise and negative values of relative TSP change represent higher EIH. PPT and TSP were analyzed using the Friedman test followed by a Bonferroni post hoc correction for multiple comparisons between sessions. Wilcoxon signed-rank test was conducted to examine if PPT and TSP changed between before and immediately after within each session. The correlation between exercise intensity and relative PPT/TSP changes after each exercise was analyzed using Spearman’s rank test. Additionally, we analyzed the differences between males and females within each condition. Data were analyzed using SPSS software, version 24 (IBM Corp., Armonk, NY, USA) and P values of 0.05 or less were considered statistically significant. Effect sizes were calculated as r/rho; < 0.09 was considered no effect, 0.10–0.30 a small effect, 0.30–0.50 a moderate effect, and > 0.50 a large effect.39
Results
Participant Characteristics
Seventy-three healthy and pain-free young adults (38 men and 35 women) volunteered for the study, with no dropouts. Participants had a mean age of 20.6 ± 1.1 years (range: 18–23 years), height of 164.3 ± 8.2 cm (range: 150–181 cm), weight of 56.3 ± 8.8 kg (40–74 kg) and body mass index (BMI) of 20.8 ± 2.1 kg/m2 (range: 15.8–26.0 kg/m2). The baseline HR was 68.1 ± 7.4 beats/min. There was no significant age difference between the sexes (men = 20.5 years, women = 20.7 years, P = 0.42), but there were significant differences in the height, weight, and BMI between the sexes (height: men = 170.9 cm, women = 157.1 cm, P < 0.001; weight: men = 62.9 kg, women = 49.1 kg, P < 0.001; BMI: men = 21.5 kg/m2, women = 19.9 kg/m2, P < 0.001). None of the participants complained about adverse events caused by pain assessment or exercise during and after the experiment.
Intensity of Each Exercise
The HR data of each exercise were as follows: low-intensity exercise indicated an average HR = 107.6 ± 5.1 beats/min; moderate-intensity exercise indicated an average HR = 133.8 ± 3.6 beats/min; and high-intensity exercise indicated an average HR = 160.0 ± 2.2 beats/min.
Pressure Pain Threshold
Figure 2 shows PPT results of the four experimental sessions. PPT before exercise or rest showed no significant differences between sessions at all assessment sites (quadriceps: P = 0.83, biceps: P = 0.26, trapezius: P = 0.91). For low-intensity exercise, large and significant effects of exercise that increased PPT were observed at the quadriceps (pre = 342.0 kPa [266.0–493.5 kPa], post = 376.0 kPa [305.5–533.5 kPa]; z = −5.52, P < 0.001, r = 0.65), biceps (pre = 160.0 kPa [133.0–218.0 kPa], post = 184.0 kPa [150.0–245.5 kPa]; z = −6.33, P < 0.001, r = 0.74), and trapezius (pre = 219.0 kPa [180.5–289.5 kPa], post = 236.0 kPa [198.0–304 kPa]; z = −6.09, P < 0.001 r = 0.71). For moderate-intensity exercise, large and significant effects of exercise increasing PPT were observed at the quadriceps (pre = 339.0 kPa [266.0–470.5 kPa], post = 382.0 kPa [301.0–552.0 kPa]; z = −6.96, P < 0.001, r = 0.82), biceps (pre = 173.0 kPa [124.5–221.0 kPa], post = 193.0 kPa [152.0–252.5 kPa]; z= −6.90, P < 0.001, r = 0.81), and trapezius (pre = 230.0 kPa [177.5–288.0 kPa], post = 252.0 kPa [193.0–311.0 kPa]; z = −6.25, P < 0.001, r = 0.73). For high-intensity exercise, large and significant effects of exercise increasing PPT were observed at the quadriceps (pre = 325.0 kPa [274.5–462.5 kPa], post = 400.0 kPa [315.5–539.5 kPa]; z = −6.80, P < 0.001, r = 0.80), biceps (pre = 167.0 kPa [135.5–212.0 kPa], post = 191.0 kPa [146.0–246.0 kPa]; z = −5.80, P < 0.001, r = 0.68), and trapezius (pre = 215.0 kPa [182.5–262.5 kPa], post = 238.0 kPa [189.0–285.5 kPa]; z = −4.59, P < 0.001, r = 0.54). For the control session, there were no significant effects at the quadriceps (pre = 341.0 kPa [253.0–474.0 kPa], post = 340.0 kPa [260.0–475.5 kPa]; z = 0.31, P = 0.76, r = 0.04), biceps (pre = 170.0 kPa [132.0–221.5 kPa], post = 174.0 kPa [133.5–230.5 kPa]; z = −1.21, P = 0.23, r = 0.14), and trapezius (pre = 217.0 kPa [175.0–266.0 kPa], post = 219.0 kPa [180.5–289.0 kPa]; z = −0.54, P = 0.59, r = 0.06).
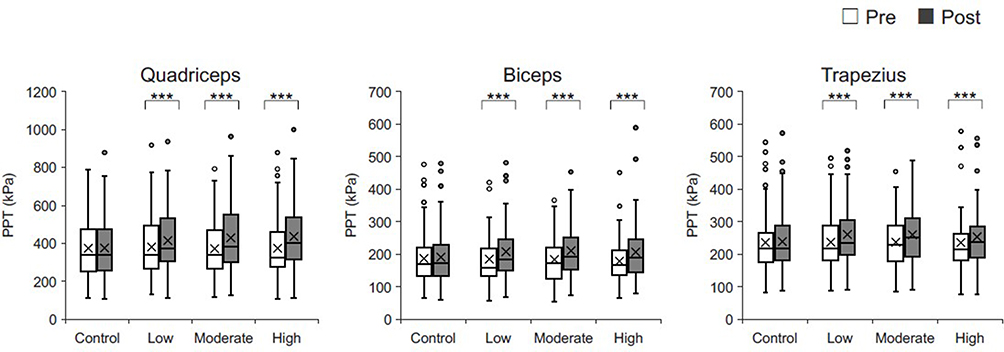 |
Figure 2 Pressure pain threshold at each exercise intensity at three assessment sites (quadriceps, biceps, and trapezius). Box plots indicate 1st and 3rd quartiles; bold lines in the boxes indicate medians, cross indicate means, and whiskers indicate ranges excluding outliers. White bar: pre-test; Black bar: post-test. Abbreviation: PPT, pressure pain threshold. Note: Significant difference between pre- and post-test (***P < 0.001). |
There were significant differences in PPT post-exercise between sessions (quadriceps: P < 0.001, biceps: P < 0.001, trapezius: P < 0.001). After correction for multiple comparison, significant differences were observed between the groups for PPT post exercise at the quadriceps (control vs low: z = −4.69, P < 0.001, r = 0.55, control vs moderate: z = −5.35, P < 0.001, r = 0.63, control vs high: z = −5.94, P < 0.001, r = 0.70), biceps (control vs low: z = −3.05, P = 0.014, r = 0.36, control vs moderate: z = −3.77, P < 0.001, r = 0.44, control vs high: z = −2.78, P = 0.004, r = 0.33), and trapezius (control vs low: z = −3.64, P = 0.001, r = 0.43, control vs moderate: z = −3.62, P < 0.001, r = 0.42, control vs high: z = −2.50, P = 0.035, r = 0.29). The differences between sessions for the relative PPT change after exercise were statistically significant at the quadriceps (control = −0.6% [−4.5–3.4%], low-intensity = 11.3% [2.9–17.7%], moderate-intensity = 14.5% [4.1–22.5%], high-intensity = 15.8% [7.1–24.3%]; P < 0.001), biceps (control = 1.0% [−4.0–9.0%], low-intensity = 10.2% [5.3–17.7%], moderate-intensity = 15.5% [4.7–23.8%], high-intensity = 15.4% [3.7–26.4%]; P < 0.001), and trapezius (control = 0.0% [−5.9–6.4%], low-intensity = 9.2% [0.8–16.3%], moderate-intensity = 8.0% [3.4–16.4%], high-intensity = 5.6% [−2.2–17.4%]; P < 0.001). After correction for multiple comparison, significant differences were observed between the groups for relative PPT change after exercise at the quadriceps (control vs low: z = −5.12, P < 0.001, r = 0.60; control vs moderate: z = −6.35, P < 0.001, r = 0.74; control vs high: z = −6.44, P < 0.001, r = 0.75; and low vs high: z = −3.59, P = 0.035, r = 0.42), biceps (control vs low: z = −4.74, P < 0.001, r = 0.56; control vs moderate: z = −5.46, P < 0.001, r = 0.64; and control vs high: z = −4.92, P < 0.001, r = 0.58), and trapezius (control vs low: z = −4.52, P < 0.001, r = 0.53; control vs moderate: z = −4.85, P < 0.001, r = 0.57; and control vs high: z = −3.66, P = 0.009, r = 0.43). The additional analysis showed that the relative PPT changes in each condition were not significantly different between males and females. There were no significant differences between sessions by gender in relative PPT change for quadriceps (low: P = 0.57, moderate: P = 0.28, high: P = 0.93), biceps (low: P = 0.35, moderate: P = 0.53, high: P = 0.82), and trapezius (low: P = 0.96, moderate: P = 0.91, high: P = 0.49).
Temporal Summation of Pressure Pain
Figure 3 shows the VAS-sum score data of the four experimental sessions. Before exercise and rest, there were no significant differences between the sessions at any of the assessment sites (quadriceps: P = 0.60, biceps: P = 0.06, trapezius: P = 0.55).
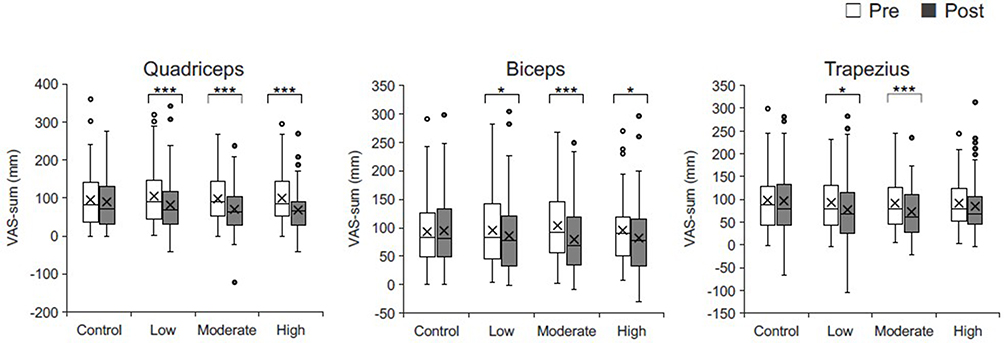 |
Figure 3 Temporal summation of pain at each exercise intensity at three assessment sites (quadriceps, biceps, and trapezius). Box plots indicate 1st and 3rd quartiles; bold lines in the boxes indicate medians, cross indicate means, and whiskers indicate ranges excluding outliers. White bar: pre-test. Black bar: post-test. Abbreviation: VAS-sum, accumulated visual analog scale score. Note: Significant difference between pre- and post-test (*P < 0.05, ***P < 0.001). |
For the control session, there were no significant differences at the quadriceps (pre = 81.0 mm [36.5–140.5 mm], post = 72.0 mm [32.0–130.0 mm]; z = 0.93, P = 0.35, r = 0.11), biceps (pre = 84.0 mm [48.5–126.5 mm], post = 82.0 mm [49.5–134 mm]; z = 0.40, P = 0.69, r = 0.05), and trapezius (pre = 89.0 mm [44.5–128.0 mm], post = 79.0 mm [43.5–132.5 mm]; z = 0.43, P = 0.67, r = 0.05) between pre- and post-session assessments. There were large and significant effects of exercise decreasing TSP for moderate- and high-intensity exercise at the quadriceps (moderate: pre = 90.0 mm [52.5–144.0 mm], post = 63.0 mm [30.0–104.5 mm]; z = 4.62, P < 0.001, r = 0.54; high: pre = 86.0 mm [53.5–142.5 mm], post = 65.0 mm [29.5–91.0 mm]; z = 5.15, P < 0.001, r = 0.60). For low-intensity exercise, moderately significant effects of exercise that decreased TSP were observed at the quadriceps (pre = 91.0 mm [45.5–147.5 mm], post = 69.0 mm [31.0–117.5 mm]; z = 3.72, P < 0.001, r = 0.44). All exercise sessions had significantly decreased TSP at the biceps (low: pre = 84.0 mm [46.0–142.0 mm], post = 77.0 mm [33.5–121.0 mm]; z = 2.0, P = 0.046, r = 0.23; moderate: pre = 93.0 mm [56.5–146.0 mm], post = 69.0 mm [34.5–119.0 mm]; z = 4.29, P < 0.001, r = 0.50; high: pre = 90.0 mm [51.0–119.0 mm], post = 77.0 mm [33.0–116.0 mm], z = 2.07, P = 0.039, r = 0.24). Moreover, the low- and moderate-intensity exercises had significantly decreased TSP at the trapezius (low: pre = 79.0 mm [43.0–129.5 mm], post = 68.0 mm [26–114.5 mm], z = 2.57, P = 0.010, r = 0.30, moderate: pre = 79.0 mm [46.5–126.0 mm], post = 61.0 [28.0–110.5 mm], z = 3.64, P < 0.001, r = 0.43). For high-intensity exercise, there was no significant effect at the trapezius (pre = 79.0 mm [52.5–123.0 mm], post = 68.0 mm [45.0–105.5 mm]; z = 1.51, P = 0.13, r = 0.18). There was a significant difference in the post-exercise TSP between the control and low-, moderate-, and high-intensity exercise sessions at the quadriceps (P = 0.022) but no significant differences at the biceps and trapezius (P = 0.153 and P = 0.088). After correction for multiple comparisons, a significant difference was observed between sessions for TSP post-exercise at the quadriceps (control vs moderate: z = 2.54, P = 0.047, r = 0.30). The differences between sessions for the median relative TSP change for after exercise were statistically significant at the quadriceps (control = 0.0% [−26.5–16.7%], low-intensity = −18.9% [−50.6–5.9%], moderate-intensity = −27.6% [−51.9–4.6%], high-intensity = −29.8% [−54.0– −0.3%]; P < 0.001), biceps (control = 1.6% [−17.7–24.8%], low-intensity = −9.2% [−42.4–15.1%], moderate-intensity = −23.2% [−50.5–11.0%], high-intensity = −8.5% [−51.5–30.3%]; P = 0.073), and trapezius (control = 2.1% [−21.0–20.6%], low-intensity = −12.1% [−44.9–7.4%], moderate-intensity = −19.9% [−50.0–11.8%], high-intensity = −12.3% [−47.3–30.8%]; P = 0.031). After correction for multiple comparison, significant differences were observed between the groups for the median relative TSP change for after exercise at the quadriceps (control vs moderate: z = 3.31, P = 0.002, r = 0.39, control vs high: z = 4.00, P < 0.001, r = 0.47), and trapezius (control vs moderate: z = 2.61, P = 0.040, r = 0.31). The additional analysis showed that the relative TSP changes for TSP in each condition were not significantly different between males and females. There were no significant differences between sessions by gender in relative TSP change for quadriceps (low: P = 0.52, moderate: P = 0.80, high: P = 0.24), biceps (low: P = 0.74, moderate: P = 0.27, high: P = 0.95), and trapezius (low: P = 0.97, moderate: P = 0.79, high: P = 0.28).
Correlation Between Exercise Intensity and EIH Response
The relationship between exercise intensity and relative PPT/TSP changes was analyzed and is shown in Table 1. A significant, poor positive correlation was observed between exercise intensity and relative PPT change at the quadriceps (rs = 0.17, P = 0.010). There was no correlation between exercise intensity and relative PPT change at the biceps (P = 0.31) or between exercise intensity and relative PPT change at the trapezius (P = 0.28) or between exercise intensity and relative TSP change at all assessment sites (quadriceps: P = 0.32, biceps: P = 0.72, trapezius: P = 0.59).
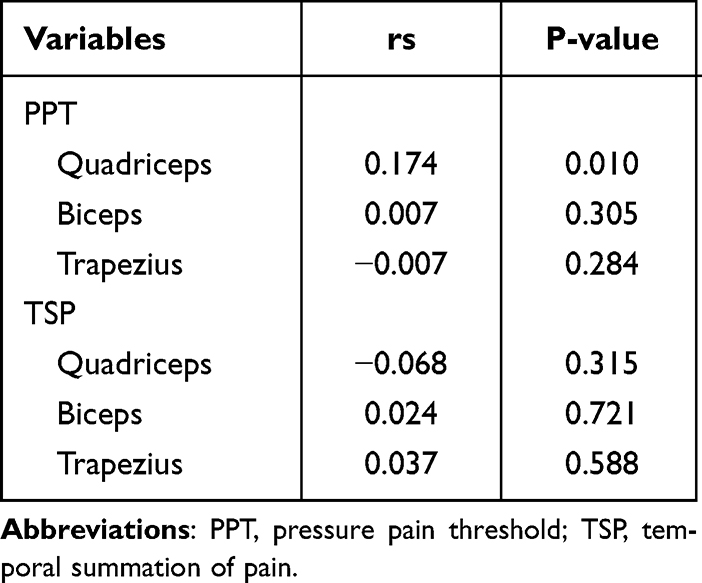 |
Table 1 Correlation Between Exercise Intensity and Relative PPT/TSP Change |
Discussion
This is the first study to examine EIH responses in the same participants in three different exercise intensities (low, moderate, and high). A priori power analysis allowed for a sufficient sample size. PPT increased post-exercise compared to pre-exercise in both exercising and non-exercising body parts at all exercise intensities. The relative PPT changes for all assessment sites were greater at all exercise intensities than those at quiet rest. There was a significant difference in relative PPT change of the exercising body part between low-intensity exercise and high-intensity exercise. TSP decreased at all exercise intensities in the exercising and non-exercising body parts post-exercise compared to pre-exercise. The relative TSP changes of the exercising body parts were greater at moderate- and high-intensity exercise than those at quiet rest. The relative TSP changes of the non-exercising body parts were greater at moderate-intensity exercise than those at quiet rest.
EIH is a generalized decrease in pain sensitivity during and after a single exercise session.4–7 We found that not only moderate- and high-intensity exercise, but also low-intensity exercise decreases pain sensitivity of the local area of the exercising body part. Few studies have examined the EIH of low-intensity aerobic exercise (eg, VO2R: 20–39%, HRR: 20–39%, HRmax: 50–63%).18,19 In the present study, we recruited a sufficient sample size and investigated the effect of low-intensity exercise on EIH. High-intensity exercise resulted in greater changes in PPT than low-intensity exercise. Previous studies have indicated a dose-response relationship between the EIH effect and exercise intensity.7,9,27 Our results are similar to a dose-response relationship. Stimulation of muscles through exercise accelerates phenotypic switching from M1 to M2 macrophages in the muscle tissue, resulting in increased production of anti-inflammatory cytokines.40 It has been reported that anti-inflammatory cytokines are involved in the local mechanism of EIH.41 A similar mechanism might be involved in our results of changes in PPT of the exercising body part.
We have shown that exercise at all intensities, including low intensity, caused a significant EIH response in the PPT of non-exercising body parts and TSP compared to pre-exercise conditions. Our findings suggest that not only moderate- and high-intensity exercise, but also low-intensity exercise have EIH effect on remote sites. However, the relative TSP changes varied based on the intensity of the exercise. Compared to quiet rest, low-intensity exercise was not significantly different between the exercising and non-exercising body parts, and high-intensity exercise was not significantly different in the non-exercising body part. In contrast, there were significant differences between moderate-intensity exercise and quiet rest in the exercising and non-exercising body parts. Thus, moderate-intensity exercise may be more effective for decreasing TSP. These results might indicate that the dose-response effect on TSP decrease is an inverted U-shaped curve. In addition, these results may be similar to the mood-improving effects associated with activation of the endogenous analgesic system.42,43 The endogenous cannabinoid system was observed to change significantly in circulating endocannabinoid-levels depending on the moderate-intensity (average HRmax of 72%), not low- (average HRmax of 45%) or high-intensity (average HRmax of 92%) exercise.44 In general, the neurobiological effects of exercise on the activation of the endogenous system follow an inverse “U-shaped” curve, with the most significant effects occurring at moderate-intensity levels and minimal effects occurring at low- and high-intensity levels.45,46
This study has some limitations. First, pain assessments were performed using handheld algometry. Thus, measurements were performed by a skilled assessor following methods described in previous studies.31–33 Second, our results may not be directly applicable to patients with chronic pain because the participants in this study were healthy young people. Because excessive exercise may increase pain intensity, future studies should investigate whether low-intensity aerobic exercise induces EIH effects in patients with chronic pain. Low-intensity exercise may be an effective treatment when prescribing exercise to patients with chronic pain who have difficulty performing high-intensity exercise.
Conclusion
This study investigated the effectiveness of EIH after low-, moderate-, and high-intensity exercise and revealed that not only moderate- and high-intensity exercise, but also low-intensity exercise can produce a hypoalgesic response.
Abbreviations
EIH, Exercise-induced hypoalgesia; QST, Quantitative sensory testing; VO2R, Oxygen uptake reserve; HRR, Heart rate reserve, HRmax, Maximum heart rate; PPT, Pressure pain threshold; TSP, Temporal summation of pressure pain; HR, Heart rate; ICC, Intraclass correlation coefficients; VAS, Visual analog scale; VAS-sum, Accumulated VAS score.
Data Sharing Statement
The data that support the findings of this study are available from the corresponding author upon reasonable request.
Ethics Approval and Informed Consent
Ethics approval was obtained from the institutional ethics committee of Kobe Gakuin University (number: So-Rin 19-24) and was registered at the University Hospital Medical Information Network Clinical Trials Registry (number: UMIN000038919). Written informed consent was obtained from all subjects before the study. This study was conducted in compliance with the Declaration of Helsinki and its later amendments.
Acknowledgments
The authors would like to thank Editage for English language editing.
Author Contributions
All authors made a significant contribution to the work reported, whether that is in the conception, study design, execution, acquisition of data, analysis and interpretation, or in all these areas; took part in drafting, revising or critically reviewing the article; gave final approval of the version to be published; have agreed on the journal to which the article has been submitted; and agree to be accountable for all aspects of the work.
Funding
No funding was received for this study.
Disclosure
The authors report no conflicts of interest in this work.
References
1. Pedersen BK, Saltin B. Exercise as medicine – evidence for prescribing exercise as therapy in 26 different chronic diseases. Scand J Med Sci Sports. 2015;25:1–72. doi:10.1111/sms.12581
2. Foster NE, Anema JR, Cherkin D, et al. Prevention and treatment of low back pain: evidence, challenges, and promising directions. Lancet. 2018;391:2368–2383. doi:10.1016/S0140-6736(18)30489-6
3. Roos EM, Juhl CB. Osteoarthritis 2012 year in review: rehabilitation and outcomes. Osteoarthritis Cartilage. 2012;20:1477–1483. doi:10.1016/j.joca.2012.08.028
4. Koltyn KF. Analgesia following exercise: a review. Sports Med. 2000;29:85–98. doi:10.2165/00007256-200029020-00002
5. Koltyn KF. Exercise-induced hypoalgesia and intensity of exercise. Sports Med. 2002;32:477–487. doi:10.2165/00007256-200232080-00001
6. Naugle KM, Fillingim RB, Riley JL. A meta-analytic review of the hypoalgesic effects of exercise. J Pain. 2012;13:1139–1150. doi:10.1016/j.jpain.2012.09.006
7. Vaegter HB, Handberg G, Graven-Nielsen T. Similarities between exercise-induced hypoalgesia and conditioned pain modulation in humans. Pain. 2014;155:158–167. doi:10.1016/j.pain.2013.09.023
8. Wewege MA, Jones MD. Exercise-induced hypoalgesia in healthy individuals and people with chronic musculoskeletal pain: a systematic review and meta-analysis. J Pain. 2021;22:21–31. doi:10.1016/j.jpain.2020.04.003
9. Hoffman MD, Shepanski MA, Ruble SB, et al. Intensity and duration threshold for aerobic exercise-induced analgesia to pressure pain. Arch Phys Med Rehabil. 2004;85:1183–1187. doi:10.1016/j.apmr.2003.09.010
10. Ickmans K, Malfliet A, De Kooning M, et al. Lack of gender and age differences in pain measurements following exercise in people with chronic whiplash-associated disorders. Pain Physician. 2017;20:E829–E840. doi:10.36076/ppj.20.5.E829
11. Meeus M, Hermans L, Ickmans K, et al. Endogenous pain modulation in response to exercise in patients with rheumatoid arthritis, patients with chronic fatigue syndrome and comorbid fibromyalgia, and healthy controls: a double-blind randomized controlled trial. Pain Pract. 2015;15:98–106. doi:10.1111/papr.12181
12. Meeus M, Roussel NA, Truijen S, et al. Reduced pressure pain thresholds in response to exercise in chronic fatigue syndrome but not in chronic low back pain: an experimental study. J Rehabil Med. 2010;42:884–890. doi:10.2340/16501977-0595
13. Van Oosterwijck J, Nijs J, Meeus M, et al. Lack of endogenous pain inhibition during exercise in people with chronic whiplash associated disorders: an experimental study. J Pain. 2012;13:242–254. doi:10.1016/j.jpain.2011.11.006
14. Meeus M, Nijs J, Van Wilgen CP, et al. Moving on to movement in patients with chronic joint pain. Pain Clin Update. 2016;24:1–8.
15. Howley ET. Type of activity: resistance, aerobic and leisure versus occupational physical activity. Med Sci Sports Exerc. 2001;33:S364–S369;discussion S419–420. doi:10.1097/00005768-200106001-00005
16. Lawford BJ, Walters J, Ferrar K. Does walking improve disability status, function, or quality of life in adults with chronic low back pain? A systematic review. Clin Rehabil. 2016;30:523–536. doi:10.1177/0269215515590487
17. Vaegter HB, Handberg G, Graven-Nielsen T. Isometric exercises reduce temporal summation of pressure pain in humans. Eur J Pain. 2015;19:973–983. doi:10.1002/ejp.623
18. Micalos PS, Arendt-Nielsen L. Differential pain response at local and remote muscle sites following aerobic cycling exercise at mild and moderate intensity. Springerplus. 2016;5:91. doi:10.1186/s40064-016-1721-8
19. Nguy V, Barry BK, Moloney N, et al. Exercise-induced hypoalgesia is present in people with Parkinson’s disease: two observational cross-sectional studies. Eur J Pain. 2019;23:1329–1339. doi:10.1002/ejp.1400
20. Rice D, Nijs J, Kosek E, et al. Exercise-induced hypoalgesia in pain-free and chronic pain populations: state of the art and future directions. J Pain. 2019;20:1249–1266. doi:10.1016/j.jpain.2019.03.005
21. Vaegter HB, Jones MD. Exercise-induced hypoalgesia after acute and regular exercise: experimental and clinical manifestations and possible mechanisms in individuals with and without pain. Pain Rep. 2020;5:e823. doi:10.1097/PR9.0000000000000823
22. Arendt-Nielsen L, Yarnitsky D. Experimental and clinical applications of quantitative sensory testing applied to skin, muscles and viscera. J Pain. 2009;10:556–572. doi:10.1016/j.jpain.2009.02.002
23. Jones MD, Nuzzo JL, Taylor JL, et al. Aerobic exercise reduces pressure more than heat pain sensitivity in healthy adults. Pain Med. 2019;20:1534–1546. doi:10.1093/pm/pny289
24. Uddin Z, MacDermid JC. Quantitative sensory testing in chronic musculoskeletal pain. Pain Med. 2016;17:1694–1703. doi:10.1093/pm/pnv105
25. Andrew D, Craig AD. Responses of spinothalamic lamina I neurons to maintained noxious mechanical stimulation in the cat. J Neurophysiol. 2002;87:1889–1901. doi:10.1152/jn.00577.2001
26. Staud R, Robinson ME, Price DD. Temporal summation of second pain and its maintenance are useful for characterizing widespread central sensitization of fibromyalgia patients. J Pain. 2007;8:893–901. doi:10.1016/j.jpain.2007.06.006
27. Naugle KM, Naugle KE, Fillingim RB, et al. Intensity thresholds for aerobic exercise-induced hypoalgesia. Med Sci Sports Exerc. 2014;46:817–825. doi:10.1249/MSS.0000000000000143
28. Pacheco-Barrios K, Gianlorenço AC, Machado R, et al. Exercise-induced pain threshold modulation in healthy subjects: a systematic review and meta-analysis. Princ Pract Clin Res. 2020;6:11–28. doi:10.21801/ppcrj.2020.63.2
29. Rampazo ÉP, de Andrade ALM, da Silva VR, et al. Photobiomodulation therapy and transcutaneous electrical nerve stimulation on chronic neck pain patients: study protocol clinical trial (SPIRIT Compliant). Medicine. 2020;99:e19191. doi:10.1097/MD.0000000000019191
30. Vaegter HB, Dørge DB, Schmidt KS, et al. Test-retest reliability of exercise-induced hypoalgesia after aerobic exercise. Pain Med. 2018;19:2212–2222. doi:10.1093/pm/pny009
31. Arendt-Nielsen L, Nie H, Laursen MB, et al. Sensitization in patients with painful knee. osteoarthritis. Pain. 2010;149:573–581. doi:10.1016/j.pain.2010.04.003
32. Hattori T, Shimo K, Niwa Y, et al. Association of chronic pain with radiologic severity and central sensitization in Hip osteoarthritis patients. J Pain Res. 2021;14:1153–1160. doi:10.2147/JPR.S296273
33. Nie H, Graven-Nielsen T, Arendt-Nielsen L. Spatial and temporal summation of pain evoked by mechanical pressure stimulation. Eur J Pain. 2009;13:592–599. doi:10.1016/j.ejpain.2008.07.013
34. Henriksen M, Klokker L, Graven-Nielsen T, et al. Association of exercise therapy and reduction of pain sensitivity in patients with knee osteoarthritis: a randomized controlled trial. Arthritis Care Res. 2014;66:1836–1843. doi:10.1002/acr.22375
35. Izumi M, Petersen KK, Laursen MB, et al. Facilitated temporal summation of pain correlates with clinical pain intensity after Hip arthroplasty. Pain. 2017;158:323–332. doi:10.1097/j.pain.0000000000000764
36. Karvonen MJ, Kentala E, Mustala O. The effects of training on heart rate; a longitudinal study. Ann Med Exp Biol Fenn. 1957;35:307–315.
37. Naugle KM, Naugle KE, Riley JL. Reduced modulation of pain in older adults after isometric and aerobic exercise. J Pain. 2016;17:719–728. doi:10.1016/j.jpain.2016.02.013
38. Kodesh E, Weissman-Fogel I. Exercise-induced hypoalgesia - interval versus continuous. mode. Appl Physiol Nutr Metab. 2014;39:829–834. doi:10.1139/apnm-2013-0481
39. Cohen J. Statistical Power Analysis for the Behavioral Science.
40. Taguchi S, Kami K, Tajima F, et al. Increase of M2 macrophages in injured sciatic nerve by treadmill running may contribute to the relief of neuropathic pain. Pain Res. 2015;30:135–147. Japanese. doi:10.11154/pain.30.135
41. Kami K, Tajima F, Senba E. Exercise-induced hypoalgesia: potential mechanisms in animal models of neuropathic pain. Anat Sci Int. 2017;92:79–90. doi:10.1007/s12565-016-0360-z
42. Da Silva Santos R, Galdino G. Endogenous systems involved in exercise-induced analgesia. J Physiol Pharmacol. 2018;69:3–13. doi:10.26402/jpp.2018.1.01
43. Basso JC, Suzuki WA. The effects of acute exercise on mood, cognition, neurophysiology, and neurochemical pathways: a review. Brain Plast. 2017;2:127–152. doi:10.3233/BPL-160040
44. Raichlen DA, Foster AD, Seillier A, et al. Exercise-induced endocannabinoid signaling is modulated by intensity. Eur J Appl Physiol. 2013;113:869–875. doi:10.1007/s00421-012-2495-5
45. Berger BG, Motl RW. Exercise and mood: a selective review and synthesis of research employing the profile of mood states. J Appl Sport Psychol. 2000;12:69–92. doi:10.1080/10413200008404214
46. Reed J, Ones DS. The effect of acute aerobic exercise on positive activated affect: a meta-analysis. Psychol Sport Exerc. 2006;7:477–514. doi:10.1016/j.psychsport.2005.11.003
 © 2022 The Author(s). This work is published and licensed by Dove Medical Press Limited. The
full terms of this license are available at https://www.dovepress.com/terms
and incorporate the Creative Commons Attribution
- Non Commercial (unported, 3.0) License.
By accessing the work you hereby accept the Terms. Non-commercial uses of the work are permitted
without any further permission from Dove Medical Press Limited, provided the work is properly
attributed. For permission for commercial use of this work, please see paragraphs 4.2 and 5 of our Terms.
© 2022 The Author(s). This work is published and licensed by Dove Medical Press Limited. The
full terms of this license are available at https://www.dovepress.com/terms
and incorporate the Creative Commons Attribution
- Non Commercial (unported, 3.0) License.
By accessing the work you hereby accept the Terms. Non-commercial uses of the work are permitted
without any further permission from Dove Medical Press Limited, provided the work is properly
attributed. For permission for commercial use of this work, please see paragraphs 4.2 and 5 of our Terms.