
Back to Journals » Nature and Science of Sleep » Volume 17


Effect of Preoperative Sleep Disorders on Postoperative Enteral Nutrition Intolerance in Patients with Digestive Tract Tumors: A Prospective Cohort Study
Authors Chen M, Zhong W, Yu T, Cao C, Huang H, Yu J
Received 29 May 2025
Accepted for publication 23 September 2025
Published 17 October 2025 Volume 2025:17 Pages 2699—2713
DOI https://doi.org/10.2147/NSS.S539712
Checked for plagiarism Yes
Review by Single anonymous peer review
Peer reviewer comments 3
Editor who approved publication: Dr Marco Veneruso
Moxi Chen,1,* Wentao Zhong,1,* Tian Yu,2 Can Cao,1 Hongyun Huang,1 Jianchun Yu1
1Department of General Surgery, Peking Union Medical College Hospital, Peking Union Medical College and Chinese Academy of Medical Sciences, Beijing, 100730, People’s Republic of China; 2Department of Gastrointestinal Surgery, Beijing Tsinghua Changgung Hospital, School of Clinical Medicine, Tsinghua University, Beijing, 102218, People’s Republic of China
*These authors contributed equally to this work
Correspondence: Jianchun Yu, Department of General Surgery, Peking Union Medical College Hospital, No. 1 Shuaifuyuan Wangfujing Dongcheng District, Beijing, People’s Republic of China, Email [email protected]
Purpose: To investigate the effect of preoperative sleep disorders (SD) on postoperative enteral nutrition intolerance (ENI) and intestinal barrier, and explore its potential mechanism.
Patients and Methods: This study was a prospective cohort study that included 67 patients (26 in SD group and 41 in non-SD group) undergoing digestive tract tumor surgery. Preoperative sleep status was assessed using the Pittsburgh Sleep Quality Index. Postoperative ENI was evaluated using the Enteral Nutrition Tolerance Scale. Perioperative serum cortisol, intestinal barrier markers (D-lactate, diamine oxidase and human lipopolysaccharide binding protein), ferroptosis markers (ferrous ions, reduced glutathione and lipid peroxide malondialdehyde) and intestinal flora characteristics were measured.
Results: The incidence of ENI in SD group was 53.8%, which was significantly higher than that in non-SD group (26.8%, P=0.038). Perioperative levels of serum intestinal barrier markers in SD group were higher than those in non-SD group (P< 0.05). The preoperative cortisol level was positively correlated with the increase in the intestinal barrier marker human lipopolysaccharide binding protein (r=0.3621, P=0.0170) and ferroptosis marker malondialdehyde (r=0.3660, P=0.0171). In SD group, the relative abundance of opportunistic pathogens (Enterobacteriaceae, Burkholderiaceae, etc) increased, while the relative abundance of probiotics (Bifidobacteriaceae) decreased.
Conclusion: Preoperative sleep disturbances were significantly associated with the occurrence of postoperative enteral nutrition intolerance in patients with gastrointestinal tumors. The intestinal barrier damage of these patients may be related to hypothalamic-pituitary-adrenal axis activation, oxidative stress induction and intestinal flora imbalance.
Plain Language Summary: Why was this study done?
We investigated whether sleep disorders before gastrointestinal cancer surgery affect patients’ ability to tolerate enteral nutrition after surgery and examined the biological reasons behind this.
What did the researchers do?
We followed 67 patients undergoing digestive tract tumor surgery (26 with sleep disorders, 41 without). Using standard medical tools: 1. Assessed sleep quality with the Pittsburgh Sleep Quality Index; 2. Measured enteral nutrition intolerance (ENI) symptoms; 3. Tested blood levels of: stress hormone (cortisol), gut damage markers (D-lactate, DAO, LBP), cell stress indicators (ferrous ions, glutathione, MDA) and gut bacteria.
What did we find?
Patients with preoperative sleep disorders: 1. Had significantly more ENI (54% vs 27%); 2. Showed higher gut barrier damage markers; 3. Had abnormal ferroptosis-related substances (↓glutathione, ↑MDA); 4. Had more harmful bacteria (Enterobacteriaceae) and fewer probiotics (Bifidobacteriaceae).
What do these results mean?
Sleep disorders before surgery may increase postoperative ENI through: 1. Stress system activation (HPA axis → cortisol ↑); 2. Iron-related cell damage (ferroptosis); 3. Gut bacteria imbalance.
Practical implications:
• For patients: Improving sleep quality before surgery may aid recovery
• For doctors: Monitoring cortisol or probiotics could help high-risk patients
Keywords: sleep wake disorders, postoperative gastrointestinal motility disorders, gastrointestinal microbiome, oxidative stress
A Letter to the Editor has been published for this article.
Introduction
Perioperative sleep disorders (SD) refer to sleep problems that occur before and after surgery, such as difficulty falling asleep, sleep interruption, and sleep fragmentation.1 Perioperative SD may last for several days to several months, seriously affecting postoperative recovery and quality of life. Epidemiological investigations2 show that about 60% of patients have significant sleep problems before surgery, which is closely related to poor prognosis such as postoperative nausea and vomiting (PONV)3 and worsening pain.4
The incidence of malnutrition is common in patients with digestive tract tumors.5 The European Society of Parenteral and Enteral Nutrition (ESPEN) clinical practice guidelines6 recommend that patients undergoing surgery for digestive tract tumors should start enteral nutrition within 24 hours after surgery. However, postoperative gastrointestinal dysfunction is an important reason for limited early postoperative application of enteral nutrition.
Postoperative gastrointestinal dysfunction (PGD)7 is a common adverse reaction after surgery, manifested as decreased gastrointestinal mobility, digestive and absorption disorders, and delayed defecation. Mild PGD often manifests as enteral nutrition intolerance (ENI), that is, symptoms such as vomiting, abdominal pain, abdominal distension, and diarrhea occur after oral administration or pumping of nutrient solution.8 Severe PGD can manifest as gastric emptying disorder (postoperative gastroparesis) and postoperative intestinal obstruction (POI).
It is generally believed that the mechanism of ENI in patients with digestive tract tumors includes intestinal and autonomic nervous system dysfunction,9 changes in hormone regulation pathways,10 systemic inflammatory reactions, and imbalance of intestinal flora.11 Age, gender, diabetes, BMI, severity of the disease, and stress response after surgical injury (eg, time, extent, and method of surgery)12–14 are all considered potential risk factors for the development of ENI.
In reports of intestinal diseases such as irritable bowel syndrome (IBS) and inflammatory bowel disease (IBD), sleep disorders are thought to be related to visceral hypersensitivity15 and active inflammation of intestinal tissue.16 The severity of abdominal pain, diarrhea, and constipation symptoms reported by patients were closely related to the degree of sleep disorders and significantly improved after improving sleep conditions.17 Animal experiments have also found18 that sleep deprivation can directly cause DNA damage through oxidative stress, thereby destroying intestinal cell function. This suggests that sleep disorders may affect the occurrence and development of postoperative ENI through mechanisms such as HPA axis activation, systemic inflammatory response, and oxidative stress.
As the main component of the gastrointestinal tract, the intestinal flora has been shown to mediate interactions between the nervous system and the gastrointestinal tract through the microbiota-gut-brain axis (MGB Axis).19 Its metabolites, such as SCFAs, have dual functions as neurotransmitters and endocrine hormones20,21 and can not only participate in the brain’s regulation of sleep but also significantly impact gastrointestinal motility and barrier function.
This study was intended to explore the association between preoperative sleep disorders and postoperative ENI in patients with digestive tract tumors. To explore the mediators linking preoperative sleep disorders to postoperative ENI, we further investigated the function of the HPA axis, systemic inflammation, oxidative stress, and changes in intestinal flora characteristics in these patients.
Materials and Methods
Study Population
The study was approved by the Ethics Committee of Peking Union Medical College Hospital, China Academy of Medical Sciences (HS2021050). Patients who underwent digestive tract tumor surgery at Peking Union Medical College Hospital from August 2022 to December 2023 were prospectively included. Inclusion criteria: (1) Age between 18 and 75 years; (2) Gastrointestinal tumor diagnosed histologically or radiologically and planned laparoscopic resection; (3) Risk of malnutrition: Nutrition Risk Screening 2002 (NRS-2002) score ≥3 points; and received perioperative standardized parenteral and enteral nutrition treatment. (4) Patients voluntarily participated in the study and signed informed consent. Exclusion criteria: (1) The patient has contraindications for enteral nutrition (eg, active gastrointestinal bleeding, intestinal obstruction, decompensated short bowel syndrome, etc).; (2) Current use of drugs known to substantially alter metabolic or inflammatory pathways (eg, systemic corticosteroids); (3) Active treatment with immunotherapeutic agents for cancer or other immunomodulators (eg, biologics targeting cytokine signaling); (4) Recent use (within 30 days before admission) of antibiotics or microecological regulators (eg, probiotic and prebiotic preparations). The patients recruitment process was shown in Figure 1.
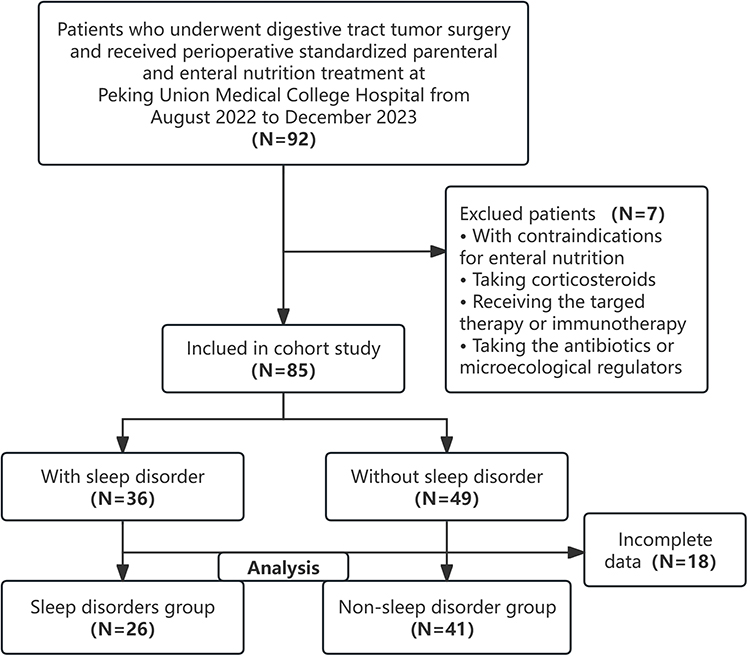 |
Figure 1 The study recruitment flow chart. |
Sleep Status Assessment
Before surgery, Pittsburgh Sleep Quality Index (PSQI) was used to evaluate the patients’ sleep quality for nearly one month. PSQI consists of seven parts (sleep quality, fall asleep time, sleep time, sleep efficiency, sleep disorder, hypnotics and daytime dysfunction), and each part is scored according to 0~3 grades, with the cumulative score ranging from 0 to 21.22 The higher the score, the worse the sleep quality. In this study, when PSQI ≤5, the patient is considered to be non-sleep disorders (NSD), while when PSQI >5, the patient is considered to have preoperative sleep disorders (SD).
Preoperative Nutritional Assessment
The application of perioperative nutritional assessment and support are standard procedures for patients in our department. All patients need to undergo nutritional risk assessment after admission, and patients with nutritional risks need to receive nutritional support. Nutritional risk screening was conducted with NRS-2002. The nutritional status (weight, BMI and dietary intake changes), disease severity (which will lead to increased nutritional requirements) and age of patients were comprehensively evaluated. A total score of ≥3 indicates that there are nutritional risks and nutritional support is needed.23
The patient-generated subjective global assessment scale (PG-SGA) was used for malnutrition diagnosis. The scale consists of the following two parts: patient self-assessment and clinical assessment of medical staff. The contents of patients’ self-assessment include weight change, dietary intake change, symptoms affecting dietary intake, activity and functional status. The clinical evaluation of medical staff includes the severity of weight loss, the severity of disease and its relationship with nutritional needs, the metabolic needs of patients, and a comprehensive physical examination to evaluate the loss of body fat and muscle and the degree of edema.
According to PG-SGA score,24 patients can be divided into three categories: SGA-A (PG-SGA score within 0~1, good nutrition), SGA-B (PG-SGA score within 2~8, mild/suspected malnutrition) and SGA-C (PG-SGA score ≥9, severe malnutrition). SGA-B can be further divided into SGA-B+ (PG-SGA score within 2~3, suspected malnutrition) and SGA-B− (PG-SGA score within 4~8, mild malnutrition). SGA-A does not need nutritional support. SGA-B can provide medication and nutritional support guidance to patients and their families according to the results of symptom investigation and laboratory examination. SGA-C patients urgently need to improve symptom management and provide nutritional support programs.
Perioperative Nutrition Support
All patients with nutritional risks will receive tumor-type Food for Special Medical Purposes (FSMP) as energy and nutrition sources. The target energy is 20~30 kcal/kg per day, while the ideal weight (kg) = height (cm) −105. The specific embodiments are as follows: (1) Take FSMP orally every day from 4±1 days before operation to provide enteral nutrition reaching the target energy. (2) FSMP was ingested by oral/tube feeding from the 1st to 2nd day after operation, and gradually increased according to individual tolerance, reaching 20% of the daily target energy required by patients on the 2nd day after operation; (3) Day 3~5 after operation: According to individual tolerance, the intake of FSMP was gradually increased every day to provide 30~80% of the daily target energy required by patients; (4) Day 6~9 after operation: FSMP provided the patients with daily target energy.
Clinical Data Collection
The demographic characteristics and clinical data of patients were extracted from the electronic medical record system for statistical analysis, including the following data types: (1) Demographic characteristics: age, gender and body mass index (BMI); comorbidity (including diabetes, hypertension, etc.); and family history of tumor. (2) Disease characteristics: including tumor types and pathological stages (according to the 8th edition of TNM staging system of American Joint Cancer Committee25); previous history of radiotherapy and chemotherapy, previous history of surgery. (3) Surgical features: the location and scope of resection, the type of digestive tract reconstruction, the presence or absence of feeding tube and the way of insertion, the operation time, the amount of access during operation, etc. (4) Cost-benefit evaluation: hospitalization time and hospitalization expenses.
Postoperative Gastrointestinal Function Evaluation
Postoperative gastrointestinal function was evaluated by enteral nutrition tolerance scale,26 which consisted of the following three clinical parameters: (1) Abdominal distension/pain, graded from 0 (asymptomatic) to 3 (severe distension or intra-abdominal pressure >20 mmHg), with intermediate scores for mild symptoms (1 point) and clinically significant distension/pain resolving spontaneously or with intra-abdominal pressures of 15~20 mmHg (2 points); (2) Nausea/vomiting, scoring 0 for asymptomatic patients (including those on maintenance decompression), 1 for nausea without emesis, 2 for non-decompression-requiring vomiting or gastric residuals of 250~500 mL, and 3 for decompression-requiring emesis or residuals exceeding 500 mL; (3) Diarrhea severity, ranging from 0 (no bowel symptoms) to 3 (≥5 loose stools daily with ≥1,500 mL output), where 1 point denotes 3–5 loose stools with <500 mL output, and 2 points requires both ≥5 loose stools and 500~1500 mL output. A cumulative score of 0 indicates normal gastrointestinal function, a score of 1~2 indicates mild gastrointestinal function damage, a score of 3~4 indicates moderate gastrointestinal function damage, and a score of 5 or more indicates severe gastrointestinal function damage. In this study, if the patient’s enteral nutrition tolerance score is greater than 0 after oral administration or pumping nutrient solution, it is considered that there is enteral nutrition intolerance.
In addition, the time of first exhaust and defecation after operation was recorded. Complications such as intestinal obstruction and gastric emptying disorder, the occurrence of anastomotic leakage, bleeding and infection were diagnosed by clinical symptoms and imaging examination, and graded according to Clavien-Dindo classification of surgical complications.
Hematological Parameters Evaluation
The patients were taken cubital vein blood in a supine position in the morning 1 day before surgery, 1 day and 7 days after surgery. After standing at room temperature for 2 hours, the blood was centrifuged with a 4°C low-temperature centrifuge (3000 rpm/min) for 10 minutes, and the serum supernatant was taken and dispensed for testing. According to the reagent manufacturer’s instructions, serum cortisol and lipopolysaccharide binding protein (LBP) levels were measured using an enzyme-linked immunosorbent kit (Elabscience, Houston, Texas, USA). Serum D-lactic acid (D-LA), diamine oxidase (DAO), ferrous ion (Fe2+), reduced glutathione (GSH) and lipid peroxide malondialdehyde (Beyotime, Nantong, Jiangsu, China) levels were measured by colorimetric method.
Fecal Sample Collection and DNA Extraction
The patient was instructed to drain urine in the morning one day before surgery and collect fecal samples. Immediately after collection, they were placed in sterile cryopreserved tubes and stored in a refrigerator at −80°C pending centralized inspection. Fecal microbial DNA was extracted using the OMEGA Soil DNA Kit (Omega Bio-Tek, Norcross, GA, USA) kit according to the manufacturer’s instructions. DNA molecule size was determined using 1.2% agarose gel electrophoresis, and DNA quantification was performed using Nanodrop (Thermo Scientific, Waltham, Massachusetts, USA). PCR amplification uses specific primers for the V3-V4 region of the bacterial 16S rRNA gene, 338F (5′-barcode+ CCTAYGGGRBGCASCAG-3′) and 806R (5′-GGACTACNNGGGTATCTAAT-3′). PCR products were quantified using the Quant-iT PicoGreen dsDNA Assay Kit (Invitrogen, Carlsbad, California, USA). Illumina’s TruSeq Nano DNA LT Library Prep Kit was used to build the library, and the Agilent High Sensitivity DNA Kit was used to conduct library quality inspection. Paired-end sequencing was performed on an Illlumina MiSeq (PE300 Paired-end Sequencing) instrument.
Bioinformatics Analysis
Use QIIME 2 2022.11 to conduct bioinformatics analysis of the microbiome according to the official tutorial. In short, the original sequence data is decoded using the demux plug-in, the cutadapt plug-in performs primer excision, and then the DADA2 plug-in performs data processing on the sequence such as quality filtering, noise removal, splicing, and mosaic removal to generate characteristic sequence ASVs and abundance data tables. Samples with sequencing depths <10,000 reads were excluded based on rarefaction curve analysis.
By using the Greengenes database, the ASV feature sequences are compared with the reference sequences in the database to obtain the taxonomic information corresponding to each ASV. Alpha diversity analysis was performed using Chao1 index on rarefied data (subsampled to 20,000 reads per sample) and Wilcoxon rank-sum test was used for inter-group comparisons. The Bray-Curtis distance measure was used for Beta diversity analysis on CSS-normalized data, and inter-group differences were assessed through Principal coordinate analysis (PCoA) and Permutational multivariate analysis of variance (PERMANOVA) analysis.
Linear discriminant analysis effect size (LefSe) was used to evaluate the differences in bacterial communities between groups, and marker species with significant differences were shown, ie, linear discriminant analysis (LDA) >2.0 and FDR-adjusted q < 0.1. Using the absolute abundance table of taxa at the family level generated based on the unflattened ASV/OTU table, the “classify_samples_ncv” function in QIME2 was called for random forest analysis. The results of random forest analysis were combined with the LefSe analysis to find potential differences in bacteria between groups. Phylogenetic Investigation of Communities by Reconstructions of Unobserved States (PICRUST2) analysis is used to explore potential differential microbial metabolic pathways, including KEGG, MetaCyc database.
Statistical Analysis
Based on prior literature and clinical observations, we assumed an enteral nutrition intolerance (ENI) incidence of 50% in the SD group and 20% in the NSD group,9 yielding a clinically relevant risk difference of 30%. With a two-sided alpha of 0.05 and 80% power, the required sample size was 39 per group. The sample size was calculated using the standard formula for comparing two independent proportions. Calculations were cross-verified using PASS 21.0 (NCSS LLC, Kaysville, UT, USA), and accounting for potential confounders (eg, age, disease severity) via post-hoc adjustment.
Data analysis was performed using SPSS 26.0 software and RStudio 4.3.0, and GraphPad Prism 9.0.0 was used for mapping. Kolmogorov–Smirnov was used to determine the distribution of the data (normal or skewed). Continuous variables for a normal distribution were expressed as mean ± standard deviation (mean±SD), and continuous variables for a skewed distribution were expressed as median (interquartile range). Classification variable data were expressed as frequencies (percentages). As for one-way analysis, continuous variables were tested by t-test or Mann–Whitney U-test, and categorical variables were tested by Chi-square test or Fisher’s exact probability method. Pearson correlation analysis was used to explore the relationship between various variables. A two-sided test P<0.05 was considered to be statistically significant.
Results
Sleep Characteristics
According to the inclusion and exclusion criteria, 85 patients with digestive tract tumors were enrolled and 67 patients with complete clinical data were analysed, including 41 patients in non-SD group and 26 patients in sleep disorder group. The falling asleep time of patients with sleep disorder was significantly longer than that of non-SD group (60.91±51.08 min vs 14.02±9.17 min, P<0.001), and 80.7% of patients had frequent or persistent difficulty in falling asleep. The average sleep time reported by patients in the sleep disorder group was 5.94±1.05 hours, which was significantly lower than the 7.48±0.83 hours reported by patients in the non-SD group (P<0.001), and a total of 85.6% of patients reported sleeping less than 7 hours throughout the night. There was no significant difference in reported bed rest time between the two groups (7.77±1.82 hours in the sleep disorder group versus 8.16±1.12 hours in the non-SD group, P=0.326), but sleep efficiency was significantly reduced in the sleep disorder group (75%±23% vs 93%±9%, P=0.001). None of the patients in the non-SD group had a history of using hypnotics during the investigation period, while the proportion of patients in the sleep disorder group using hypnotics was as high as 34.6%(P<0.001). The frequency of hypnotics administration was typically once daily, with the types of medications used including alprazolam, zopiclone, and melatonin. 38.5% of patients in the sleep disorder group had frequent or persistent daytime dysfunction, which was significantly higher than that in the non-SD group (38.5% vs 2.4%, P<0.001).
Clinical Characteristics
Table 1 shows the basic demographic characteristics of the two groups of patients. There were no significant differences between the two groups in terms of age, gender, nutritional status (BMI, NRS-2002 score, PG-SGA score and classification), comorbidities (diabetes, hypertension) and family history of tumors. In the sleep disorder group, there were 16 patients (61.5%) with upper gastrointestinal tract tumors (stomach and small intestine) and 10 patients (38.4%) with lower gastrointestinal tract tumors. In the non-SD group, there were 26 patients (63.4%) with upper gastrointestinal tract tumors (stomach and small intestine) and 15 patients (36.6%) with lower gastrointestinal tract tumors. There was no significant difference in lesion location, pathological type and stage between the two groups. In addition, no significant differences were found between the two groups in intraoperative infusion volume, bleeding volume, nutrition tube placement and operation time.
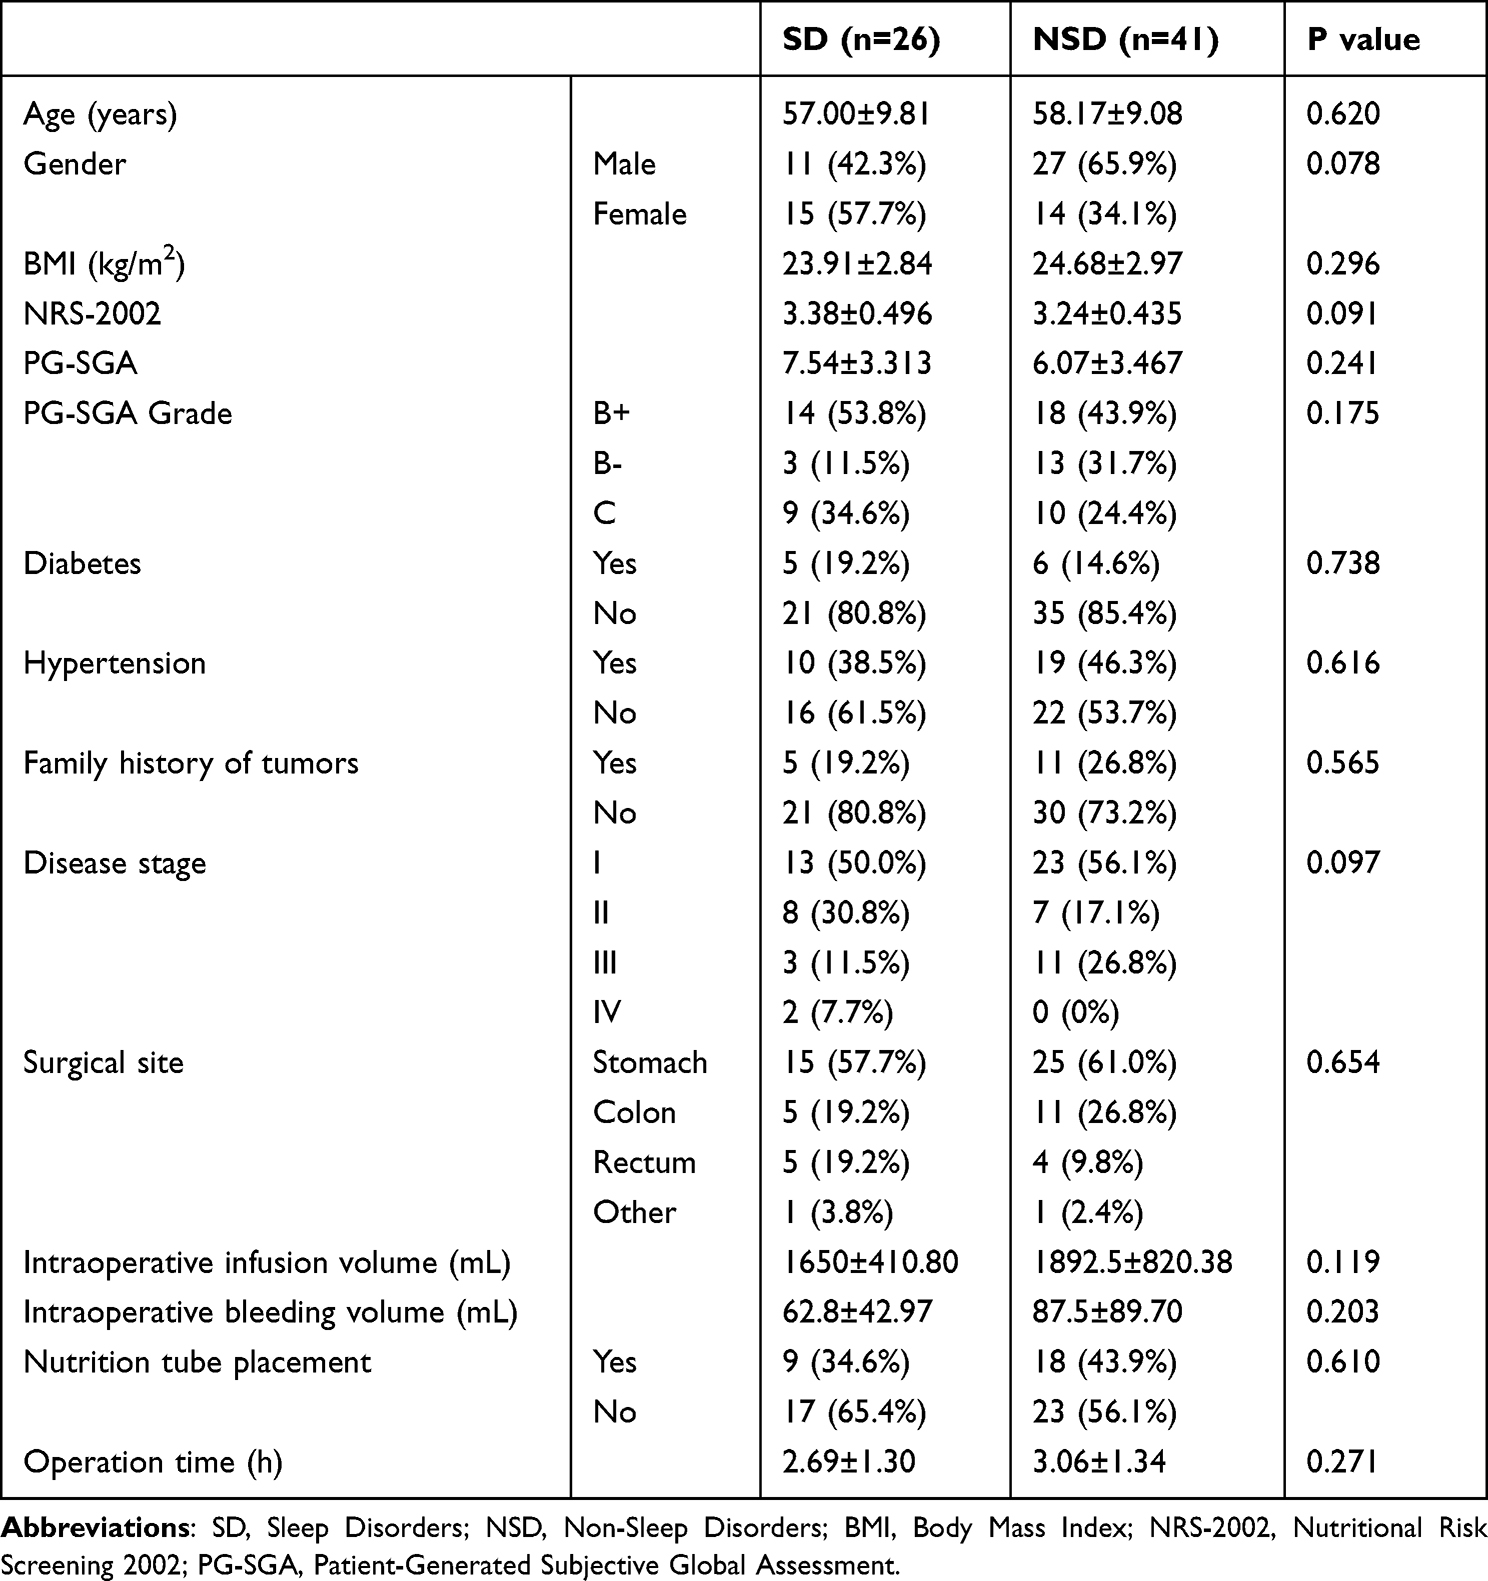 |
Table 1 Clinical Characteristics of the Patients |
Postoperative Recovery
A total of 25 patients developed postoperative enteral nutrition intolerance, among which the incidence in the sleep disorder group was 53.8% (14/26), which was significantly higher than that in the non-SD group (26.8%, 11/41) (P=0.038). The main manifestations were the increased incidence of abdominal pain, abdominal distension, and diarrhea after oral administration or pumping of nutrient solution. Patients in the sleep disorder group had more postoperative bleeding (11.5% vs 7.3%), infection (15.4% vs 7.3%), anastomotic leakage (7.7% vs 4.9%) and gastrointestinal dysfunction (11.5% vs 4.9%) than those in the non-SD group. Exhaust time (2.77±0.99 days vs 2.41±1.00 days) and hospital stay time (17.35±14.25 days vs 16.02±9.86 days) were longer than those in the non-SD group, but the difference was not statistically significant (Table 2).
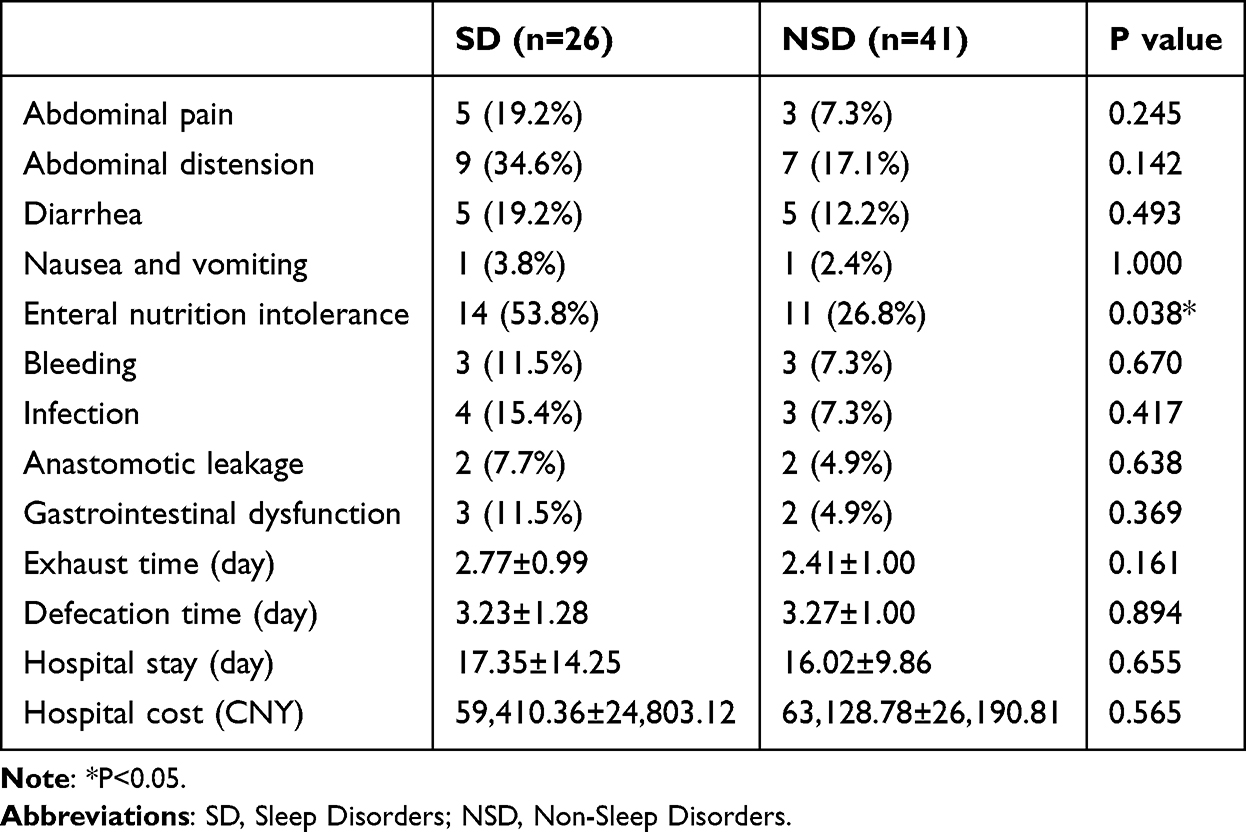 |
Table 2 Postoperative Recovery of the Patients |
Intestinal Barrier Markers
The serum intestinal barrier marker levels measured at three time points at 1 day before surgery, 1 day after surgery and 7 days after surgery showed that the serum D-lactate (D-LA, Figure 2A) levels, diamine oxidase (DAO, Figure 2B) levels and human lipopolysaccharide binding protein (LBP, Figure 2C) levels in patients with sleep disorders were all higher than those in non-SD group, and there was a statistically significant difference between the groups between the increase in preoperative DAO levels and postoperative LBP levels (P<0.05). In addition, the serum cortisol level on the day before surgery was significantly higher than that in the non-SD group (189.75±67.64 vs 136.98±45.8 ng/mL, P<0.001). Pearson correlation analysis showed that the increase in preoperative cortisol levels in patients was correlated with the increase in intestinal barrier markers D-LA (Figure 2D, r=0.4874, P=0.0012), DAO (Figure 2E, r=0.2333, P=0.1616) and LBP (Figure 2F, r=0.3233, P=0.0367), and the correlation with D-LA and LBP was statistically significant.
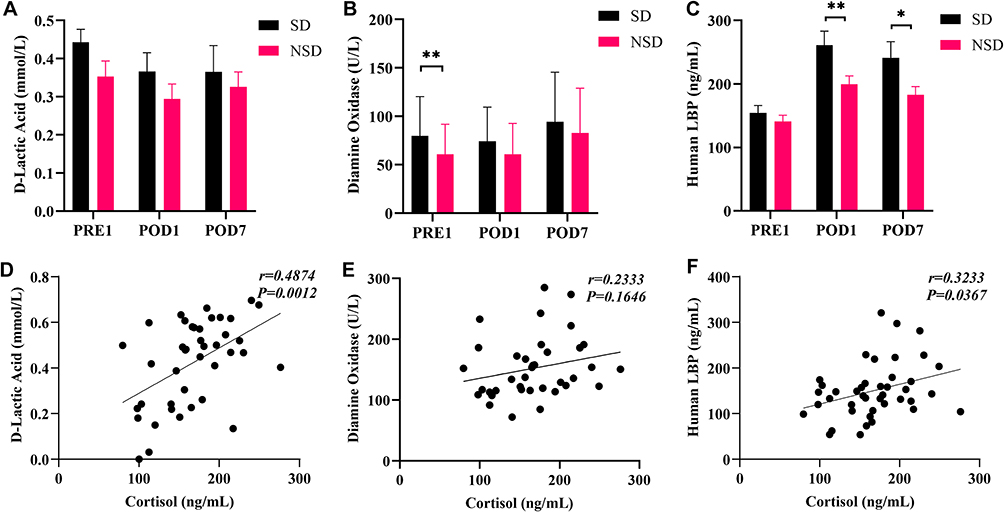 |
Figure 2 Perioperative serum intestinal barrier markers and preoperative cortisol levels. (A). Perioperative serum D-lactate levels; (B) Perioperative serum diamine oxidase levels; (C) Perioperative serum human lipopolysaccharide binding protein levels; (D) Correlation between preoperative serum cortisol levels and D-lactate levels; (E). Correlation between preoperative serum cortisol levels and diamine oxidase levels; (F). Correlation between preoperative serum cortisol levels and human lipopolysaccharide binding protein levels. Notes: LBP, lipopolysaccharide binding protein; SD, sleep disorder group (n=26); NSD, non-SD group (n=41); PRE1, 1 day before surgery; POD1, 1 day after surgery; POD, 7 days after surgery; *P<0.05; **P<0.01; r, Pearson correlation coefficient. |
Ferroptosis Markers
The level of serum ferroptosis markers measured during the perioperative period showed that the level of serum ferrous ion (Fe2+, Figure 3A) on the day after surgery in patients with sleep disorder was lower than that in the non-SD group (23.30±17.60 vs 32.49±36.36 μmol/L), with no statistical significance. The serum glutathione (GSH, Figure 3B) levels in patients with sleep disorder were significantly lower on the day before and 1 day after surgery than those in the non-SD group (P<0.01). The serum lipid peroxide malondialdehyde (MDA, Figure 3C) levels in patients with sleep disorder 1 day before surgery, 1 day after surgery and 7 days after surgery were all higher than those in the non-SD group, and the difference between groups 1 day before surgery was statistically significant (P<0.001). Pearson correlation analysis showed that the increase in preoperative serum cortisol levels was significantly correlated with the increase in lipid peroxide malondialdehyde levels (Figure 3D, r=0.3660, P=0.0171), and the increase in serum intestinal barrier marker LBP levels was also significantly correlated with the increase in MDA levels (Figure 3E, r=0.3621, P=0.0170).
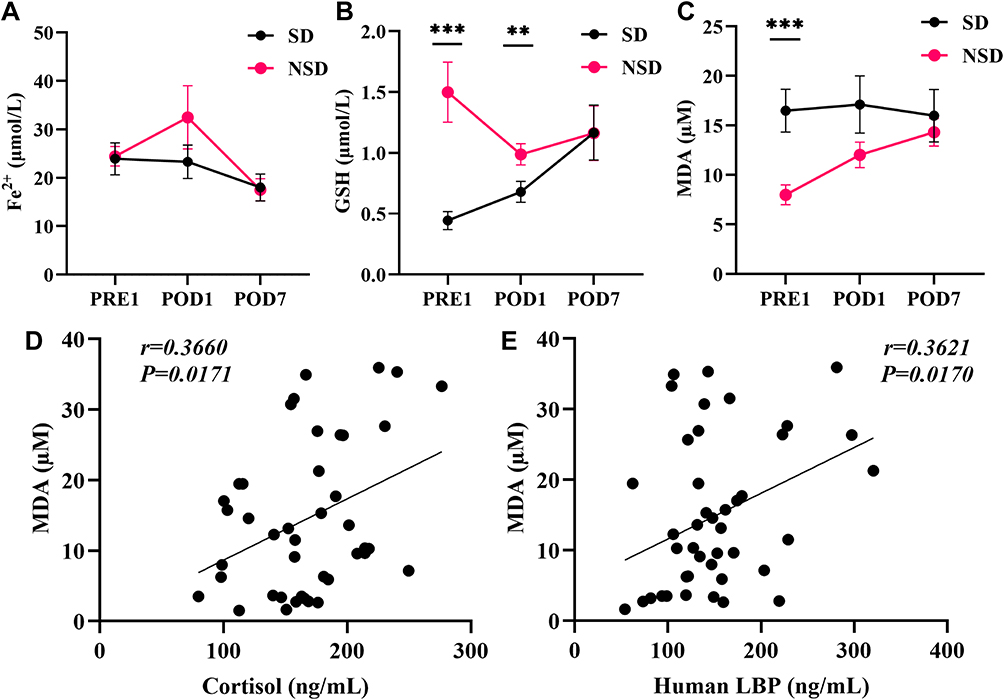 |
Figure 3 Perioperative serum ferroptosis and related markers levels. (A) Perioperative serum Fe2+ change curve; (B) Perioperative serum GSH change curve; (C) Perioperative serum MDA change curve; (D) Correlation between preoperative serum cortisol level and lipid peroxide MDA level; (E) Correlation between preoperative serum LBP level and lipid peroxide MDA level. Notes: Fe2+, ferrous ion; GSH, glutathione; MDA, malondialdehyde; SD, sleep disorder group (n=26); NSD, non-SD group (n=41); PRE1, 1 day before surgery; POD1, 1 day after surgery; POD, 7 days after surgery; LBP, lipopolysaccharide binding protein; **P<0.01; ***P<0.001; r, Pearson correlation coefficient. |
Characteristics of Intestinal Flora
Preoperative feces were collected from 45 patients, including 16 patients in the sleep disorder group and 29 patients in the non-SD group. After sequencing and data quality control, a total of 2696525 available high-quality sequences were obtained from all samples. The number of sequencing for a single sample fluctuated between 40,713 and 97,100, with an average of 59923 high-quality sequences obtained per sample. In terms of alpha diversity, the species richness of intestinal flora in patients with sleep disorders (Chao1 index, Figure 4A) was slightly lower than that in non-SD group, but the difference was not statistically significant. In terms of beta diversity, the results of PCoA analysis of the Bray-Curtis distance matrix showed (Figure 4B) that the 95% confidence ellipse overlap between the samples from the sleep disorder group and the samples from the non-SD group, suggesting that there is no significant difference in the beta diversity of intestinal flora species between the two groups of patients. PERMANOVA analysis of Bray-Curtis distances also showed that there was no statistical difference between the distances within the sleep disorder group and the distances between the sample groups of patients with normal sleep (F=0.889827, P=0.707, q=0.707).
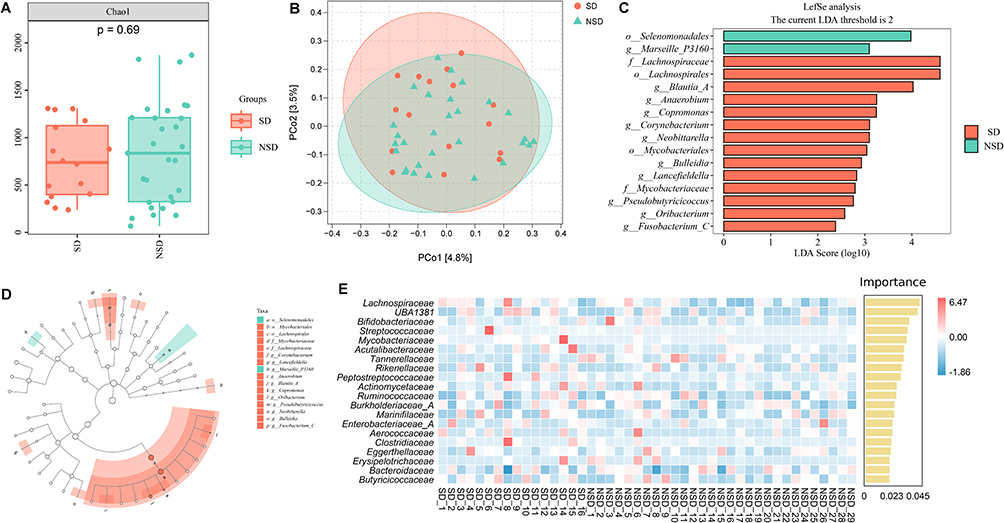 |
Figure 4 Differences between groups in preoperative intestinal flora characteristics. (A) Alpha diversity (Chao1 index); (B) Beta diversity (PCoA analysis of the Bray-Curtis distance matrix); (C) LDA scores of marker species; (D) Cladogram of marker species; the cladogram shows the taxonomic hierarchical relationships of major marker species from phylum to genus (from inner circle to outer circle). The node size corresponds to the average relative abundance of the species; open nodes represent no significant differences between groups, and red/blue nodes indicate significant differences between groups and their enrichment groups. (E) Random forest analysis (family level); the abscissa of the histogram is the importance score of species to the classifier model. From top to bottom, the importance of species to the model decreases in order. The ordinate is the names of species at the family level, and the heat map shows the abundance of these species in each sample. Notes: SD, sleep disorder group (n=16); NSD, non-SD group (n=29). |
Through LEfSe analysis, a total of 16 landmark species were identified between the sleep disorder group and the non-SD group. Among them, a total of 14 species were enriched in the sleep disorder group, namely Fusobacterium_C, Oribacterium, Pseudobutyriciccoccus, Mycobacteriaceae, Lancefieldella, Bulleidia, Mycobacteria, Neobittarella, Corynebacterium, Copromonas, Anaerobium, Blatia_A, Lachnospirales and Lachnospiraceae, and 2 species were enriched in the non-SD group which are Marseille_P3160 and Selenomonadales. Figure 4C shows the contribution (LDA values) of marker species within each group to the differences between groups, and the taxonomic branch diagram (Figure 4D) shows the taxonomic level and distribution of marker species in each group of samples.
Species with high importance in random forest classifiers can also be considered as landmark species of differences between groups. At the family level (Figure 4E), the abundance of Bifidobacteriaceae, Tannerellaceae, Eggerthellaceae, Erysipelotrichaceae and Bacteroidaceae was significantly reduced in the sleep disorder group, while the abundance of Lachnospiraceae, UBA1381, Streptococcaceae, Mycobacteriaceae, Acutalibacteriaceae, Rikenellaceae, Peptostreptococcaceae, Actinomyces, Ruminococcaceae, Burkholderiaceae_A, Marinifilaceae, Enterobacteriaceae_A, Aerococcaceae, Clostridiaceae and Butyricicoccaceae were significantly increased compared with the non-SD group.
Differences in Metabolic Pathways
Metabolic pathway abundance data obtained from PICRUSt2 analysis was used to calculate metabolic pathways with significant differences between groups. The metabolic pathways that may differ between sleep impaired and non-SD group in the KEGG database are Chagas disease (American Trypanosomiasis), Limonene and pinene degradation, Vasopressin-regulated waterresorption. The metabolic pathways that may differ in the MetaCyc database are protein N-glycosylation (bacterial), glycolyssis V (Pyrococcus), mycolyl-arabinogalactan-peptidoglycan complex biosynthesis, 3-hydroxypropanoic acid cycle and glyoxylate assimilation.
Discussion
This study found that the incidence of postoperative enteral nutrition intolerance in patients with preoperative sleep disorders was significantly higher than that in the non-SD group. The intestinal barrier markers in patients with preoperative sleep disorders were significantly higher than those in non-SD group and were closely related to the increase in serum cortisol levels. The level of serum antioxidant factor GSH in patients with preoperative sleep disorders was significantly lower than that in non-SD group, while the level of lipid peroxide MDA was significantly higher, which was closely related to the increase of serum cortisol levels and intestinal barrier markers levels. The relative abundance of opportunistic pathogens such as Enterobacteriaceae, Burkholderiaceae and Streptococcaceae in the intestines of patients with preoperative sleep disorders increased, and the decrease in the relative abundance of probiotics Bifidobacaceae may be an important factor in the destruction of intestinal motility and barrier function.
In this study, most patients in the preoperative sleep disorder group had frequent or persistent difficulty falling asleep, accompanied by varying degrees of “sleep maintenance insomnia” and “early morning awakening” symptoms, which may be related to the disease-related anxiety depression.27 Persistent mood and sleep disorders will lead to disorders of HPA axis function,28 which is manifested by a persistent increase in serum cortisol levels. This will affect the gastrointestinal function by destroying the mucosal barrier,29 reducing local immune responses30 and regulating the enteric nervous system.31 These mechanisms can explain the continuous increase in serum cortisol and intestinal barrier marker levels in patients with preoperative sleep disorders found in this study, and the delayed recovery of postoperative gastrointestinal function.
The delay in postoperative exhaust time and the increased incidence of gastrointestinal dysfunction (postoperative gastroparesis, intestinal obstruction) found in this study in patients with preoperative sleep disorders also suggest that sleep disorders may cause delayed gastrointestinal transportation, which is consistent with the results found in previous studies.32
In order to explore the impact of sleep disorders on ferroptosis in patients with digestive tract tumors, we measured serum ferrous ion levels, but no iron overload was found, which may be related to the decrease in total red blood cell count and hemoglobin levels in patients with sleep disorders. However, the decrease in serum antioxidant GSH levels and the increase in lipid peroxide MDA levels suggest changes in oxidative stress status in patients with sleep disorders, which is consistent with the oxidative stress damage effect of intestinal cells found in previous studies.33 Our study also found that the increase in serum lipid peroxide levels in patients is closely related to the disorder of HPA axis function and the destruction of intestinal barrier function in the body, which is consistent with the previous findings of the HPA axis (including corticotropin releasing hormone, adrenocorticotropin hormone and cortisol levels) mediate oxidative stress damage induced by chronic radiation exposure,34 and intestinal barrier function [intestinal permeability (lactulose/mannitol ratio), endotoxin exposure levels] mediate drug-induced oxidative stress damage.35
The diversity of intestinal flora is affected by multiple factors such as diet, lifestyle, and disease status.36 This may be the reason why this study did not find any differences in intestinal flora diversity between patients with preoperative sleep disorders and patients with normal sleep. However, in terms of species composition, we found that preoperative sleep disorders led to an increase in the relative abundance of opportunistic pathogens such as Enterobacteriaceae,37 Burkholderiaceae,38 and Streptococcaceae,39 and a decrease in the relative abundance of beneficial bacteria such as Bifidobacteriaceae.40 However, an increase in the relative abundance of Butyricogenes Lachnospiraceae41 and Ruminococcaceae42 was also found in the intestinal flora of patients with sleep disorders, which is consistent with the results found in previous studies.43 Among them, the abundance of Blautia44 was found to be positively correlated with the severity of diarrhea symptoms in patients with irritable bowel syndrome, which may also be one of the potential mechanisms for the occurrence of enteral nutrition intolerance. In addition, the landmark species of Corynebacterium,45 Bulleidia46 and Fusobacterium47 in the sleep disorders group are believed to be closely related to intestinal inflammation in clinical and experimental models of IBD, which also suggests the intestinal inflammation status of patients in the sleep disorders group.
In this study, the increased relative abundance of Rikenellaceae in the intestinal flora of patients with sleep disorders was found. Within this family, Alistipes is a widely studied tryptophan metabolizing bacteria that metabolizes tryptophan into indole and its derivatives.48 And these metabolites are believed to be associated with chronic inflammation and even tumor formation in colon cells.49 The consumption of tryptophan by Alistipes also affects the function of the gut-brain axis by competitively inhibiting the production of 5-HT. It is considered to be closely related to the occurrence and development of neuropsychiatric diseases such as anxiety, depression and chronic fatigue syndrome.50 These findings indicate that intestinal flora disorders and their tryptophan metabolic potential play an important role in the relationship between sleep disorders and chronic intestinal inflammation.
In addition, up-regulation of potentially differentiated metabolic pathways in the intestinal flora of patients in the preoperative sleep disorder group, “Chagas disease” and “protein N-glycosylation (bacteria)” suggests that patients have an increased risk of intestinal pathogenicity. “Protein N-glycosylation” can improve the adhesion and colonization capabilities of pathogenic bacteria and help bacteria escape immune recognition from their host.51 IL-22-mediated N-glycosylation of the protein is believed to play a key role in Clostridium difficile infection in a mouse model of ulcerative colitis.52 Limonene and pinene are terpenoids and are natural bioactive substances widely found in citrus, lemon, ginger and other plants.53 The neuroprotective, neurotransmitter regulatory and antioxidant effects of terpenoids are often used to treat emotional disorders such as anxiety and depression.54 Terpenoids can also serve as prebiotics to reduce colonization of Helicobacter pylori, regulate the inflammation state of gastrointestinal cells, and promote gastric mucosa repair.55 Therefore, the up-regulation of the “degradation of limonene and pinene” pathway in potentially differentiated metabolic pathways suggests that biologically active substances can be potential intervention pathways for sleep problems. These substances can alter the structure of the intestinal flora by regulating the metabolic activity of intestinal microorganisms, thereby improving gastrointestinal function and sleep disorders.
As far as we know, this study is the first to investigate the impact of preoperative sleep disturbance (SD) on postoperative gastrointestinal function recovery in patients with gastrointestinal tumors. It revealed that patients with sleep disorders exhibited a higher incidence of enteral nutrition intolerance after surgery. The underlying mechanisms may involve SD-induced activation of the hypothalamic-pituitary-adrenal (HPA) axis, oxidative stress damage to intestinal cells, and intestinal dysbiosis. The interplay of these mechanisms, coupled with postoperative intestinal barrier impairment in gastrointestinal tumor patients, collectively contributes to the observed clinical phenomenon. Our findings highlight the adverse effects of preoperative sleep disturbance on postoperative gastrointestinal recovery and provide a theoretical basis for perioperative sleep management and gut microbiota intervention in these patients.
However, this study has several limitations, including a relatively small sample size (n=67) and high heterogeneity in tumor types, which may affect the generalizability of the conclusions. Additionally, the lack of dynamic monitoring of postoperative microbiota changes and insufficient validation of causal mechanisms involving specific pathogenic bacteria warrant further investigation. Future research should involve multicenter, large-scale studies with dynamic monitoring at multiple postoperative timepoints to elucidate the role of microbial metabolites (eg, short-chain fatty acids) in intestinal barrier dysfunction. Animal models should also be employed to validate key mechanisms and develop microbiota-targeted intervention strategies, thereby optimizing perioperative management protocols.
Conclusion
Preoperative sleep disturbances were significantly associated with the occurrence of postoperative enteral nutrition intolerance in patients with gastrointestinal tumors. Patients with preoperative sleep disorders have significant intestinal barrier function destruction, which may be closely related to the excessive activation of HPA axis function, oxidative stress imbalance in intestinal cells and the disorder of intestinal flora. Among them, the relative abundance of opportunistic pathogens such as Enterobacteriaceae, Burkholderiaceae and Streptococcaceae increases, and the relative abundance of probiotics such as Bifidobacteriaceae decreases, which may be an important factor in the destruction of gastrointestinal function.
Data Sharing Statement
The datasets generated during and/or analysed during the current study are available from the corresponding author on reasonable request.
Ethical Approval and Consent to Participate
The study was approved by the Ethics Committee of Peking Union Medical College Hospital, China Academy of Medical Sciences (HS2021050) and was conducted in accordance with the Declaration of Helsinki. Informed consent was obtained from all patients.
Acknowledgments
The authors wanted to thank all the patients for their participation in this study.
Author Contributions
Moxi Chen contributed to Investigation, Data curation and Writing – Original draft; Wentao Zhong contributed to Formal analysis, Visualization and Writing – Original draft; Tian Yu contributed to Methodology, Writing – Reviewing and Editing; Can Cao contributed to Methodology, Writing – Reviewing and Editing; Hongyun Huang contributed to Resources, Writing – Reviewing and Editing; Jianchun Yu contributed to Conceptualization, Supervision, Writing- Reviewing and Editing. All authors have agreed on the journal to which the article has been submitted; reviewed and agreed on all versions of the article before submission, during revision, the final version accepted for publication, and any significant changes introduced at the proofing stage; and agree to take responsibility and be accountable for the contents of the article.
Funding
This study was supported by grants from the National Key R&D Program of China (Grant number: 2022YFF1100400).
Disclosure
The authors report no conflicts of interest in this work.
References
1. Holder SM, Narula NS. Common Sleep Disorders in Adults: diagnosis and Management. Am Fam Physician. 2022;105(4):397–405.
2. Butris N, Tang E, Pivetta B, et al. The prevalence and risk factors of sleep disturbances in surgical patients: a systematic review and meta-analysis. Sleep Med Rev. 2023;69:101786. doi:10.1016/j.smrv.2023.101786
3. Wang JP, Lu SF, Guo LN, Ren CG, Zhang ZW. Poor preoperative sleep quality is a risk factor for severe postoperative pain after breast cancer surgery: a prospective cohort study. Medicine. 2019;98(44):e17708. doi:10.1097/MD.0000000000017708
4. Li Q, Zhu ZY, Lu J, et al. Sleep deprivation of rats increases postsurgical expression and activity of L-type calcium channel in the dorsal root ganglion and slows recovery from postsurgical pain. Acta Neuropathol Commun. 2019;7(1):217. doi:10.1186/s40478-019-0868-2
5. Matsui R, Rifu K, Watanabe J, Inaki N, Fukunaga T. Current status of the association between malnutrition defined by the GLIM criteria and postoperative outcomes in gastrointestinal surgery for cancer: a narrative review. J Cancer Res Clin Oncol. 2023;149(4):1635–1643. doi:10.1007/s00432-022-04175-y
6. Weimann A, Braga M, Carli F, et al. ESPEN guideline: clinical nutrition in surgery. Clin Nutr. 2017;36(3):623–650. doi:10.1016/j.clnu.2017.02.013
7. Hedrick TL, McEvoy MD, Mythen MMG, et al. American Society for Enhanced Recovery and Perioperative Quality Initiative Joint Consensus Statement on Postoperative Gastrointestinal Dysfunction Within an Enhanced Recovery Pathway for Elective Colorectal Surgery. Anesth Analg. 2018;126(6):1896–1907. doi:10.1213/ANE.0000000000002742
8. Liauchonak S, Hamilton S, Franks JD, et al. Impact of implementing an evidence-based definition of enteral nutrition intolerance on nutrition delivery: a prospective, cross-sectional cohort study. Nutr Clin Pract. 2023;38(2):376–385. doi:10.1002/ncp.10941
9. Reintam Blaser A, Deane AM, Preiser JC, Arabi YM, Jakob SM. Enteral feeding intolerance: updates in definitions and pathophysiology. Nutr Clin Pract. 2021;36(1):40–49. doi:10.1002/ncp.10599
10. Ait-Belgnaoui A, Durand H, Cartier C, et al. Prevention of gut leakiness by a probiotic treatment leads to attenuated HPA response to an acute psychological stress in rats. Psychoneuroendocrinology. 2012;37(11):1885–1895. doi:10.1016/j.psyneuen.2012.03.024
11. Liu L, Liu Y, Guo X, et al. Activation of p38 mitogen-activated protein kinase pathway by lipopolysaccharide aggravates postoperative ileus in colorectal cancer patients. J Gastroenterol Hepatol. 2022;37(3):518–530. doi:10.1111/jgh.15760
12. Rencuzogullari A, Benlice C, Costedio M, Remzi FH, Gorgun E. Nomogram-derived prediction of postoperative ileus after colectomy: an assessment from nationwide procedure-targeted cohort. Am Surg. 2017;83(6):564–572.
13. Liang W, Li J, Zhang W, et al. Prolonged postoperative ileus in gastric surgery: is there any difference between laparoscopic and open surgery? Cancer Med. 2019;8(12):5515–5523. doi:10.1002/cam4.2459
14. Lin Z, Yang C, Wang Y, Yan M, Zheng H. Comparison of prolonged postoperative ileus between laparoscopic right and left colectomy under enhanced recovery after surgery: a propensity score matching analysis. World J Surg Oncol. 2022;20(1):68. doi:10.1186/s12957-022-02504-6
15. Tu Q, Heitkemper MM, Jarrett ME, Buchanan DT. Sleep disturbances in irritable bowel syndrome: a systematic review. Neurogastroenterol Motil. 2017;29(3). doi:10.1111/nmo.12946
16. Khanijow V, Prakash P, Emsellem HA, et al. Sleep dysfunction and gastrointestinal diseases. Gastroenterol Hepatol. 2015;11(12):817–825.
17. Song GH, Leng PH, Gwee KA, Moochhala SM, Ho KY. Melatonin improves abdominal pain in irritable bowel syndrome patients who have sleep disturbances: a randomised, double blind, placebo controlled study. Gut. 2005;54(10):1402–1407. doi:10.1136/gut.2004.062034
18. Everson CA, Henchen CJ, Szabo A, Hogg N. Cell injury and repair resulting from sleep loss and sleep recovery in laboratory rats. Sleep. 2014;37(12):1929–1940. doi:10.5665/sleep.4244
19. Cryan JF, O’Riordan KJ, Cowan CSM, et al. The microbiota-gut-brain axis. Physiol Rev. 2019;99(4):1877–2013. doi:10.1152/physrev.00018.2018
20. Chen Y, Xu J, Chen Y. Regulation of neurotransmitters by the gut microbiota and effects on cognition in neurological disorders. Nutrients. 2021;13(6). doi:10.3390/nu13062099
21. Farré N, Gozal D. Sleep and the microbiome: a two-way relationship. Arch Bronconeumol. 2019;55(1):7–8. doi:10.1016/j.arbres.2018.04.007
22. Buysse DJ, Reynolds CF 3rd, Monk TH, Berman SR, Kupfer DJ. The Pittsburgh Sleep Quality Index: a new instrument for psychiatric practice and research. Psychiatry Res. 1989;28(2):193–213. doi:10.1016/0165-1781(89)90047-4
23. Wang P, Tan Y, Soh KL, et al. Nutrition Risk Screening 2002 for adult cancer patients: a systematic review and meta-analysis. Nutr Cancer. 2024;76(7):573–583. doi:10.1080/01635581.2024.2352901
24. Mendes NP, Barros TA, Rosa COB, Franceschini S. Nutritional screening tools used and validated for cancer patients: a systematic review. Nutr Cancer. 2019;71(6):898–907. doi:10.1080/01635581.2019.1595045
25. Amin MB, Greene FL, Edge SB, et al. The Eighth Edition AJCC Cancer Staging Manual: continuing to build a bridge from a population-based to a more “personalized” approach to cancer staging. CA Cancer J Clin. 2017;67(2):93–99. doi:10.3322/caac.21388
26. Chinese Nursing Association. Adult Enteral Nutrition Support Care: T/CNAS 18-2022 [Standard]. Beijing: China Standards Press; 2022.
27. Wang X, Ma X, Yang M, et al. Proportion and related factors of depression and anxiety for inpatients with lung cancer in China: a hospital-based cross-sectional study. Support Care Cancer. 2022;30(6):5539–5549. doi:10.1007/s00520-022-06961-3
28. Guyon A, Morselli LL, Balbo ML, et al. Effects of insufficient sleep on pituitary-adrenocortical response to CRH stimulation in healthy men. Sleep. 2017;40(6). doi:10.1093/sleep/zsx064
29. Kelly JR, Kennedy PJ, Cryan JF, Dinan TG, Clarke G, Hyland NP. Breaking down the barriers: the gut microbiome, intestinal permeability and stress-related psychiatric disorders. Front Cell Neurosci. 2015;9:392. doi:10.3389/fncel.2015.00392
30. Capellino S, Claus M, Watzl C. Regulation of natural killer cell activity by glucocorticoids, serotonin, dopamine, and epinephrine. Cell Mol Immunol. 2020;17(7):705–711. doi:10.1038/s41423-020-0477-9
31. Kasarello K, Cudnoch-Jedrzejewska A, Czarzasta K. Communication of gut microbiota and brain via immune and neuroendocrine signaling. Front Microbiol. 2023;14:1118529. doi:10.3389/fmicb.2023.1118529
32. Knudsen K, Fedorova TD, Hansen AK, et al. Objective intestinal function in patients with idiopathic REM sleep behavior disorder. Parkinsonism Relat Disord. 2019;58:28–34. doi:10.1016/j.parkreldis.2018.08.011
33. Zha LF, Dong JT, Wang JL, et al. Effects of insomnia on peptic ulcer disease using Mendelian randomization. Oxid Med Cell Longev. 2021;2021:2216314. doi:10.1155/2021/2216314
34. Li Z, Li X, Qian Y, Guo C, Wang Z, Wei Y. The sustaining effects of e-waste-related metal exposure on hypothalamus-pituitary-adrenal axis reactivity and oxidative stress. Sci Total Environ. 2020;739:139964. doi:10.1016/j.scitotenv.2020.139964
35. Spahr L, Bresson-Hadni S, Amann P, et al. Allopurinol, oxidative stress and intestinal permeability in patients with cirrhosis: an open-label pilot study. Liver Int. 2007;27(1):54–60. doi:10.1111/j.1478-3231.2006.01382.x
36. Blackmer-Raynolds L, Sampson TR. Overview of the gut microbiome. Semin Neurol. 2023;43(4):518–529. doi:10.1055/s-0043-1771463
37. Yin Q, da Silva AC, Zorrilla F, Almeida AS, Patil KR, Almeida A. Ecological dynamics of Enterobacteriaceae in the human gut microbiome across global populations. Nat Microbiol. 2025;10(2):541–553. doi:10.1038/s41564-024-01912-6
38. Rhodes KA, Schweizer HP. Antibiotic resistance in Burkholderia species. Drug Resist Updat. 2016;28:82–90. doi:10.1016/j.drup.2016.07.003
39. Haenni M, Lupo A, Madec JY. Antimicrobial resistance in Streptococcus spp. Microbiol Spectr. 2018;6(2). doi:10.1128/microbiolspec.ARBA-0008-2017
40. Filidou E, Kandilogiannakis L, Shrewsbury A, Kolios G, Kotzampassi K. Probiotics: shaping the gut immunological responses. World J Gastroenterol. 2024;30(15):2096–2108. doi:10.3748/wjg.v30.i15.2096
41. Huang S, Chen J, Cui Z, et al. Lachnospiraceae-derived butyrate mediates protection of high fermentable fiber against placental inflammation in gestational diabetes mellitus. Sci Adv. 2023;9(44):eadi7337. doi:10.1126/sciadv.adi7337
42. Xie J, Li LF, Dai TY, et al. Short-chain fatty acids produced by Ruminococcaceae mediate α-linolenic acid promote intestinal stem cells proliferation. Mol Nutr Food Res. 2022;66(1):e2100408. doi:10.1002/mnfr.202100408
43. Lobionda S, Sittipo P, Kwon HY, Lee YK. The role of gut microbiota in intestinal inflammation with respect to diet and extrinsic stressors. Microorganisms. 2019;7(8). doi:10.3390/microorganisms7080271
44. Brunkwall L, Ericson U, Nilsson PM, Orho-Melander M, Ohlsson B. Self-reported bowel symptoms are associated with differences in overall gut microbiota composition and enrichment of Blautia in a population-based cohort. J Gastroenterol Hepatol. 2021;36(1):174–180. doi:10.1111/jgh.15104
45. Wang D, Wang W, Bing X, et al. GPR35-mediated kynurenic acid sensing contributes to maintenance of gut microbiota homeostasis in ulcerative colitis. FEBS Open Bio. 2023;13(8):1415–1433. doi:10.1002/2211-5463.13673
46. Qi Y, Zang SQ, Wei J, et al. High-throughput sequencing provides insights into oral microbiota dysbiosis in association with inflammatory bowel disease. Genomics. 2021;113(1 Pt 2):664–676. doi:10.1016/j.ygeno.2020.09.063
47. Abdel-Rahman LIH, Morgan XC. Searching for a consensus among inflammatory bowel disease studies: a systematic meta-analysis. Inflamm Bowel Dis. 2023;29(1):125–139. doi:10.1093/ibd/izac194
48. Candeliere F, Simone M, Leonardi A, Rossi M, Amaretti A, Raimondi S. Indole and p-cresol in feces of healthy subjects: concentration, kinetics, and correlation with microbiome. Front Mol Med. 2022;2:959189. doi:10.3389/fmmed.2022.959189
49. Moschen AR, Gerner RR, Wang J, et al. Lipocalin 2 protects from inflammation and tumorigenesis associated with gut microbiota alterations. Cell Host Microbe. 2016;19(4):455–469. doi:10.1016/j.chom.2016.03.007
50. Parker BJ, Wearsch PA, Veloo ACM, Rodriguez-Palacios A. The genus Alistipes: gut bacteria with emerging implications to inflammation, cancer, and mental health. Front Immunol. 2020;11:906. doi:10.3389/fimmu.2020.00906
51. Latousakis D, Juge N. How sweet are our gut beneficial bacteria? A focus on protein glycosylation in Lactobacillus. Int J Mol Sci. 2018;19(1). doi:10.3390/ijms19010136
52. Nagao-Kitamoto H, Leslie JL, Kitamoto S, et al. Interleukin-22-mediated host glycosylation prevents Clostridioides difficile infection by modulating the metabolic activity of the gut microbiota. Nat Med. 2020;26(4):608–617. doi:10.1038/s41591-020-0764-0
53. Vespermann KA, Paulino BN, Barcelos MC, Pessôa MG, Pastore GM, Molina G. Biotransformation of α- and β-pinene into flavor compounds. Appl Microbiol Biotechnol. 2017;101(5):1805–1817. doi:10.1007/s00253-016-8066-7
54. Noor AAM. Exploring the therapeutic potential of terpenoids for depression and anxiety. Chem Biodivers. 2024;21(10):e202400788. doi:10.1002/cbdv.202400788
55. Khan MSA, Khundmiri SUK, Khundmiri SR, Al-Sanea MM, Mok PL. Fruit-derived polysaccharides and terpenoids: recent update on the gastroprotective effects and mechanisms. Front Pharmacol. 2018;9:569. doi:10.3389/fphar.2018.00569
 © 2025 The Author(s). This work is published and licensed by Dove Medical Press Limited. The
full terms of this license are available at https://www.dovepress.com/terms
and incorporate the Creative Commons Attribution
- Non Commercial (unported, 4.0) License.
By accessing the work you hereby accept the Terms. Non-commercial uses of the work are permitted
without any further permission from Dove Medical Press Limited, provided the work is properly
attributed. For permission for commercial use of this work, please see paragraphs 4.2 and 5 of our Terms.
© 2025 The Author(s). This work is published and licensed by Dove Medical Press Limited. The
full terms of this license are available at https://www.dovepress.com/terms
and incorporate the Creative Commons Attribution
- Non Commercial (unported, 4.0) License.
By accessing the work you hereby accept the Terms. Non-commercial uses of the work are permitted
without any further permission from Dove Medical Press Limited, provided the work is properly
attributed. For permission for commercial use of this work, please see paragraphs 4.2 and 5 of our Terms.