")
Back to Journals » Diabetes, Metabolic Syndrome and Obesity » Volume 11
Early detection of metabolic dysregulation using water T2 analysis of biobanked samples
Authors Mishra I, Jones C , Patel V, Deodhar S, Cistola DP
Received 23 July 2018
Accepted for publication 12 October 2018
Published 23 November 2018 Volume 2018:11 Pages 807—818
DOI https://doi.org/10.2147/DMSO.S180655
Checked for plagiarism Yes
Review by Single anonymous peer review
Peer reviewer comments 2
Editor who approved publication: Dr Konstantinos Tziomalos
Ina Mishra,1,2 Clinton Jones,1,3 Vipulkumar Patel,1,2 Sneha Deodhar,1 David P Cistola1,2
1Nanoparticle Diagnostics Laboratory, Institute for Cardiovascular and Metabolic Diseases, Department of Physiology & Anatomy, University of North Texas Health Science Center, Fort Worth, TX, 76107, USA; 2Center of Emphasis in Diabetes & Metabolism, Department of Biomedical Sciences, Paul L. Foster School of Medicine, Texas Tech University Health Sciences Center El Paso, El Paso, TX, 79905, USA; 3Texas College of Osteopathic Medicine, University of North Texas Health Science Center, Fort Worth, TX, 76107, USA
Background: The ability to use frozen biobanked samples from cohort studies and clinical trials is critically important for biomarker discovery and validation. Here we investigated whether plasma and serum water transverse relaxation times (T2) from frozen biobanked samples could be used as biomarkers for metabolic syndrome (MetS) and its underlying conditions, specifically insulin resistance, dyslipidemia, and subclinical inflammation.
Methods: Plasma and serum aliquots from 44 asymptomatic, non-diabetic human subjects were biobanked at –80°C for 7–9 months. Water T2 measurements were recorded at 37°C on 50 µL of unmodified plasma or serum using benchtop nuclear magnetic resonance relaxometry. The T2 values for freshly drawn and once-frozen-thawed (“frozen”) samples were compared using Huber M-values (M), Lin concordance correlation coefficients (ρc), and Bland–Altman plots. Water T2 values from frozen plasma and serum samples were compared with >130 metabolic biomarkers and analyzed using multi-variable linear/logistic regression and ROC curves.
Results: Frozen plasma water T2 values were highly correlated with fresh (M=0.94, 95% CI 0.89, 0.97) but showed a lower level of agreement (ρc=0.74, 95% CI 0.62, 0.82) because of an average offset of –5.6% (−7.1% for serum). Despite the offset, frozen plasma water T2 was strongly correlated with markers of hyperinsulinemia, dyslipidemia, and inflammation and detected these conditions with 89% sensitivity and 91% specificity (100%/63% for serum). Using optimized cut points, frozen plasma and serum water T2 detected hyperinsulinemia, dyslipidemia, and inflammation in 23 of 44 subjects, including nine with an early stage of metabolic dysregulation that did not meet the clinical thresholds for prediabetes or MetS.
Conclusion: Plasma and serum water T2 values from once-frozen-thawed biobanked samples detect metabolic dysregulation with high sensitivity and specificity. However, the cut points for frozen biobanked samples must be calibrated independent of those for freshly drawn plasma and serum.
Keywords: metabolic syndrome, insulin resistance, hyperinsulinemia, dyslipidemia, inflammation, nuclear magnetic resonance relaxometry, metabolic health screening, diabetes prevention
Introduction
Metabolic syndrome (MetS) is a cluster of abnormalities that puts individuals at high risk for type 2 diabetes and atherosclerotic cardiovascular disease.1–3 The underlying pathophysiology includes insulin resistance, glucose intolerance, visceral obesity, hypertension, dyslipidemia, and/or a subclinical pro-inflammatory, pro-thrombotic state. The historical development and controversial aspects of MetS were chronicled by Kahn et al in 2005 in a joint statement from the American Diabetes Association and the European Association for the Study of Diabetes.4 Nearly a decade later, the Cardiometabolic Think Tank for MetS was convened by the American College of Cardiology and its partners in the Cardiometabolic Health Alliance.2 The purpose of this “call to action” was to develop a consensus on affirmed and emerging concepts and to define new patient care models for MetS.
One of the Think Tank’s emerging concepts was that MetS should be classified by stage and subtype to direct patient management strategies and improve health outcomes.2 The harmonized clinical criteria for MetS5 encompass a wide pathophysiological spectrum, from asymptomatic individuals, to patients with overt diabetes and/or cardiovascular disease with end-organ damage. A clear, well-calibrated definition of the earliest stage of metabolic dysregulation is needed for screening and prevention efforts to attenuate the worldwide pandemic of diabetes and cardiovascular disease. Early screening and intervention provides the best opportunity to preserve pancreatic β-cell insulin secretion, maintain arterial wall integrity, and prevent overt disease.2,6–11
Recently we reported a new approach for detecting MetS and early metabolic dysregulation based on the transverse relaxation times (T2) for water in plasma and serum.12 Water T2 is measured using benchtop nuclear magnetic resonance (NMR) relaxometry, a simpler, more practical variation of the technology utilized in magnetic resonance imaging (MRI) and spectroscopy.13 Unlike conventional proteomic biomarkers, which monitor changes in individual proteins, water T2 monitors the net effect of changes in many proteins and lipoproteins, providing a global assessment of an individual’s metabolic health.12,13 It is highly sensitive to hyperinsulinemia/insulin resistance, subclinical inflammation, and atherogenic dyslipidemia – each providing an independent and additive contribution to the lowering of plasma and serum water T2 values.12 The initial discovery cohort included 72 asymptomatic, non-diabetic subjects without active acute or chronic disease. The water T2 values were measured within 2 hours of each blood draw using fresh plasma and serum samples.
As the study of water T2 moves from biomarker discovery into validation, a key question is whether plasma and serum samples biobanked at –80°C provide the same ability to detect early metabolic dysregulation as freshly drawn samples. If the answer is yes, then it would be feasible to employ biobanked samples from cohort studies and clinical trials to validate and utilize water T2 as a metabolic biomarker. Water T2 is responsive to changes in the rotational and translational mobility of water molecules. In turn, water mobility is affected by changes in water-protein binding and on/off exchange resulting from metabolic shifts in protein and lipoprotein levels.12,13 It was not clear whether the freeze-thaw process affects these physical properties of plasma and serum, and if so, to what extent.
Here we present results from 44 non-diabetic subjects, Phase II of our discovery cohort, for whom plasma and serum water T2 values had been recorded for both freshly drawn and one-time frozen-thawed samples. The frozen samples had been biobanked for several months at –80°C. The results were compared with over 130 other blood biomarkers to assess the information content of plasma and serum water T2 from frozen biobanked specimens and their ability to detect the earliest metabolic abnormalities associated with MetS.
Ethics approval and consent to participate
The Institutional Review Board (IRB) of the University of North Texas Health Science Center, Fort Worth, Texas, USA approved this study (Protocol Number 2013-205) prior to its initiation. This protocol complied with U.S. Department of Health and Human Services regulations 46 CFR 46 and Food and Drug Administration regulations 21 CFR 50, 56, under a Federal Wide Assurance from the U.S. Office for Human Research Protections. This IRB-approved study adheres to the statement of ethical principles as described in The Belmont Report: Ethical Principles and Guidelines for the Human Subjects of Research found in the Report of the National Commission for the Protection of Human Subjects of Biomedical and Behavioral Research. This study was conducted in accordance with the Declaration of Helsinki. Subjects participated in this study only after prior informed consent was obtained.
Methods
Study design and subject recruitment
This was an observational, cross-sectional study. It was designed to test the hypothesis that plasma and water T2 values, measured using once-frozen-thawed biobanked samples that had been stored at –80°C, yielded the same or similar metabolic health information as fresh samples from the same subjects.
Forty-four human subjects were recruited, with prior written informed consent, into Protocol Number 2013-205 approved by the IRB of the University of North Texas Health Science Center. Prior to the day of the blood draw, each subject provided a complete medical history and was given the opportunity to ask questions about the study during the informed consent process. The inclusion criterion was adults, aged 18 and above. The exclusion criteria were active acute or chronic illness (history/diagnosis or CRP >10), diabetes (prior history/diagnosis or fasting glucose ≥126 mg/dL or HbA1c ≥6.5%), history of bleeding disorders or difficulty donating blood, confirmed or suspected pregnancy, or not fasting for at least 12 hours. A total of 58 subjects were enrolled after initial screening and 44 qualified according to the exclusion criteria. This human subject cohort corresponded to Phase II of the larger study reported previously, with a Phase II power calculation provided in that report.12 That calculation yielded 38 subjects, and the actual number analyzed here was 44. Statistical power depends not only on sample size but also on effect size. A large effect size (eg, large correlation coefficient) compensates for a relatively small sample size.
Blood collection, processing, and analysis
Blood samples were obtained by venipuncture at 7 AM following a 12-hour overnight fast. Experimental details regarding the phlebotomy procedures, blood tubes, and separation methods are provided elsewhere.12 At the time of the blood draw, anthropometric measurements (height, weight, waist circumference, blood pressure, and resting heart rate) were recorded by the study nurse. Urine samples were screened for microalbuminuria using Micral Chemstrips (Roche Diagnostics Corporation, Indianapolis, IN, USA).
The blood samples were processed immediately after the blood draw using a two-step centrifugation protocol to separate plasma and serum from cells.12 Once separated, the fresh plasma and serum samples were analyzed immediately by benchtop NMR relaxometry to measure water T2 values at 37°C.12,13 Additional biomarker measurements were made on each sample as detailed by Robinson et al.12
Relaxometry is a type of NMR technology that focuses on the measurement of spin relaxation times, T1 and T2.13 It is used to characterize a sample’s physical properties rather than chemical structures (NMR spectroscopy) or anatomical images (MRI). Unlike most spectroscopy and imaging applications, NMR relaxometry can be performed with inhomogeneous, low-field magnets housed in small, compact devices. Thus, it is practical for applications outside of the chemistry laboratory or imaging center. The application of compact NMR relaxometry to the analysis of human blood and blood components has been reviewed elsewhere.13 The instrumentation and methods used in the current study have been detailed by Robinson et al.12
For biobanked specimens, aliquots of fresh plasma and serum were stored at 4°C for 2–3 hours after preparation and prior to freezing. The frozen samples were stored for an average of 7–9 months at –80°C. At the time of NMR analysis, individual aliquots of frozen plasma or serum were removed from the freezer, thawed at room temperature for 5 minutes, and incubated at 37°C for 20 minutes prior to NMR analysis.
For each sample, water T2 values were collected in triplicate. The raw multi-exponential decay curves were deconvoluted using a discrete inverse Laplace transform analysis as implemented in XPFit, fixing the number of exponential components to three.13
Statistical analyses
Frozen and fresh water T2 values were compared using bivariate Huber M-values,14 Lin concordance correlation coefficients (ρc),15 and Bland - Altman plots.16–18 Unlike the more widely used Pearson and Spearman correlation coefficients, Huber M-values have the distinct advantage of being robust to outliers.12,14 Hence, correlations can be quantified without the need to select and exclude potential outliers, as some outliers may have biological importance. The Lin concordance correlation coefficient provides a measure of agreement, not to be confused with measures of correlation.17,18
For the comparison of frozen water T2 values with other metabolic biomarkers, bivariate correlations, multi-variable linear and logistic regression models, and ROC curves were generated and analyzed using the tools in JMP Pro 13.2 (SAS Institute Inc., Cary, NC, USA) and GraphPad Prism v. 6.05 (GraphPad Software Inc., La Jolla, CA, USA), as detailed elsewhere.12 The statistical analyses were based on the principles outlined by Motulsky19 and Huber and Ronchetti.14 Multi-variable regression models were considered acceptable only if they met all three of the following criteria: 1) the model avoided overfitting, as determined using k-fold cross validation, 2) all predictor variables were significant at α=0.05, and 3) a maximum possible adjusted R2 was obtained, given the constraints of criteria 1 and 2.12
The diagnostic criteria for MetS were according to the 2009 joint harmonized definition of the International Diabetes Federation, the U.S. National Heart Lung and Blood Institute, the American Heart Association, the World Heart Federation, the International Atherosclerosis Society, and the International Association for the Study of Obesity.5
Results
Characteristics of the study population
The clinical features of the human subject cohort are summarized in Table 1. The study included an approximately equal gender distribution, and the ethnic/racial distribution was as follows: 21 Caucasian, 17 Asian, five Hispanic, and one Black. The mean values for the clinical parameters fell within their normal reference ranges, consistent with the goal to recruit subjects without active acute or chronic disease. However, the ranges for these parameters revealed a variable degree of metabolic health across the cohort. Of the 44 subjects, 29 were normoglycemic according to American Diabetes Association criteria.20 The remaining 15 subjects had glucose and/or HbA1c values consistent with prediabetes. Nine of the 44 subjects met the harmonized clinical criteria for MetS.5
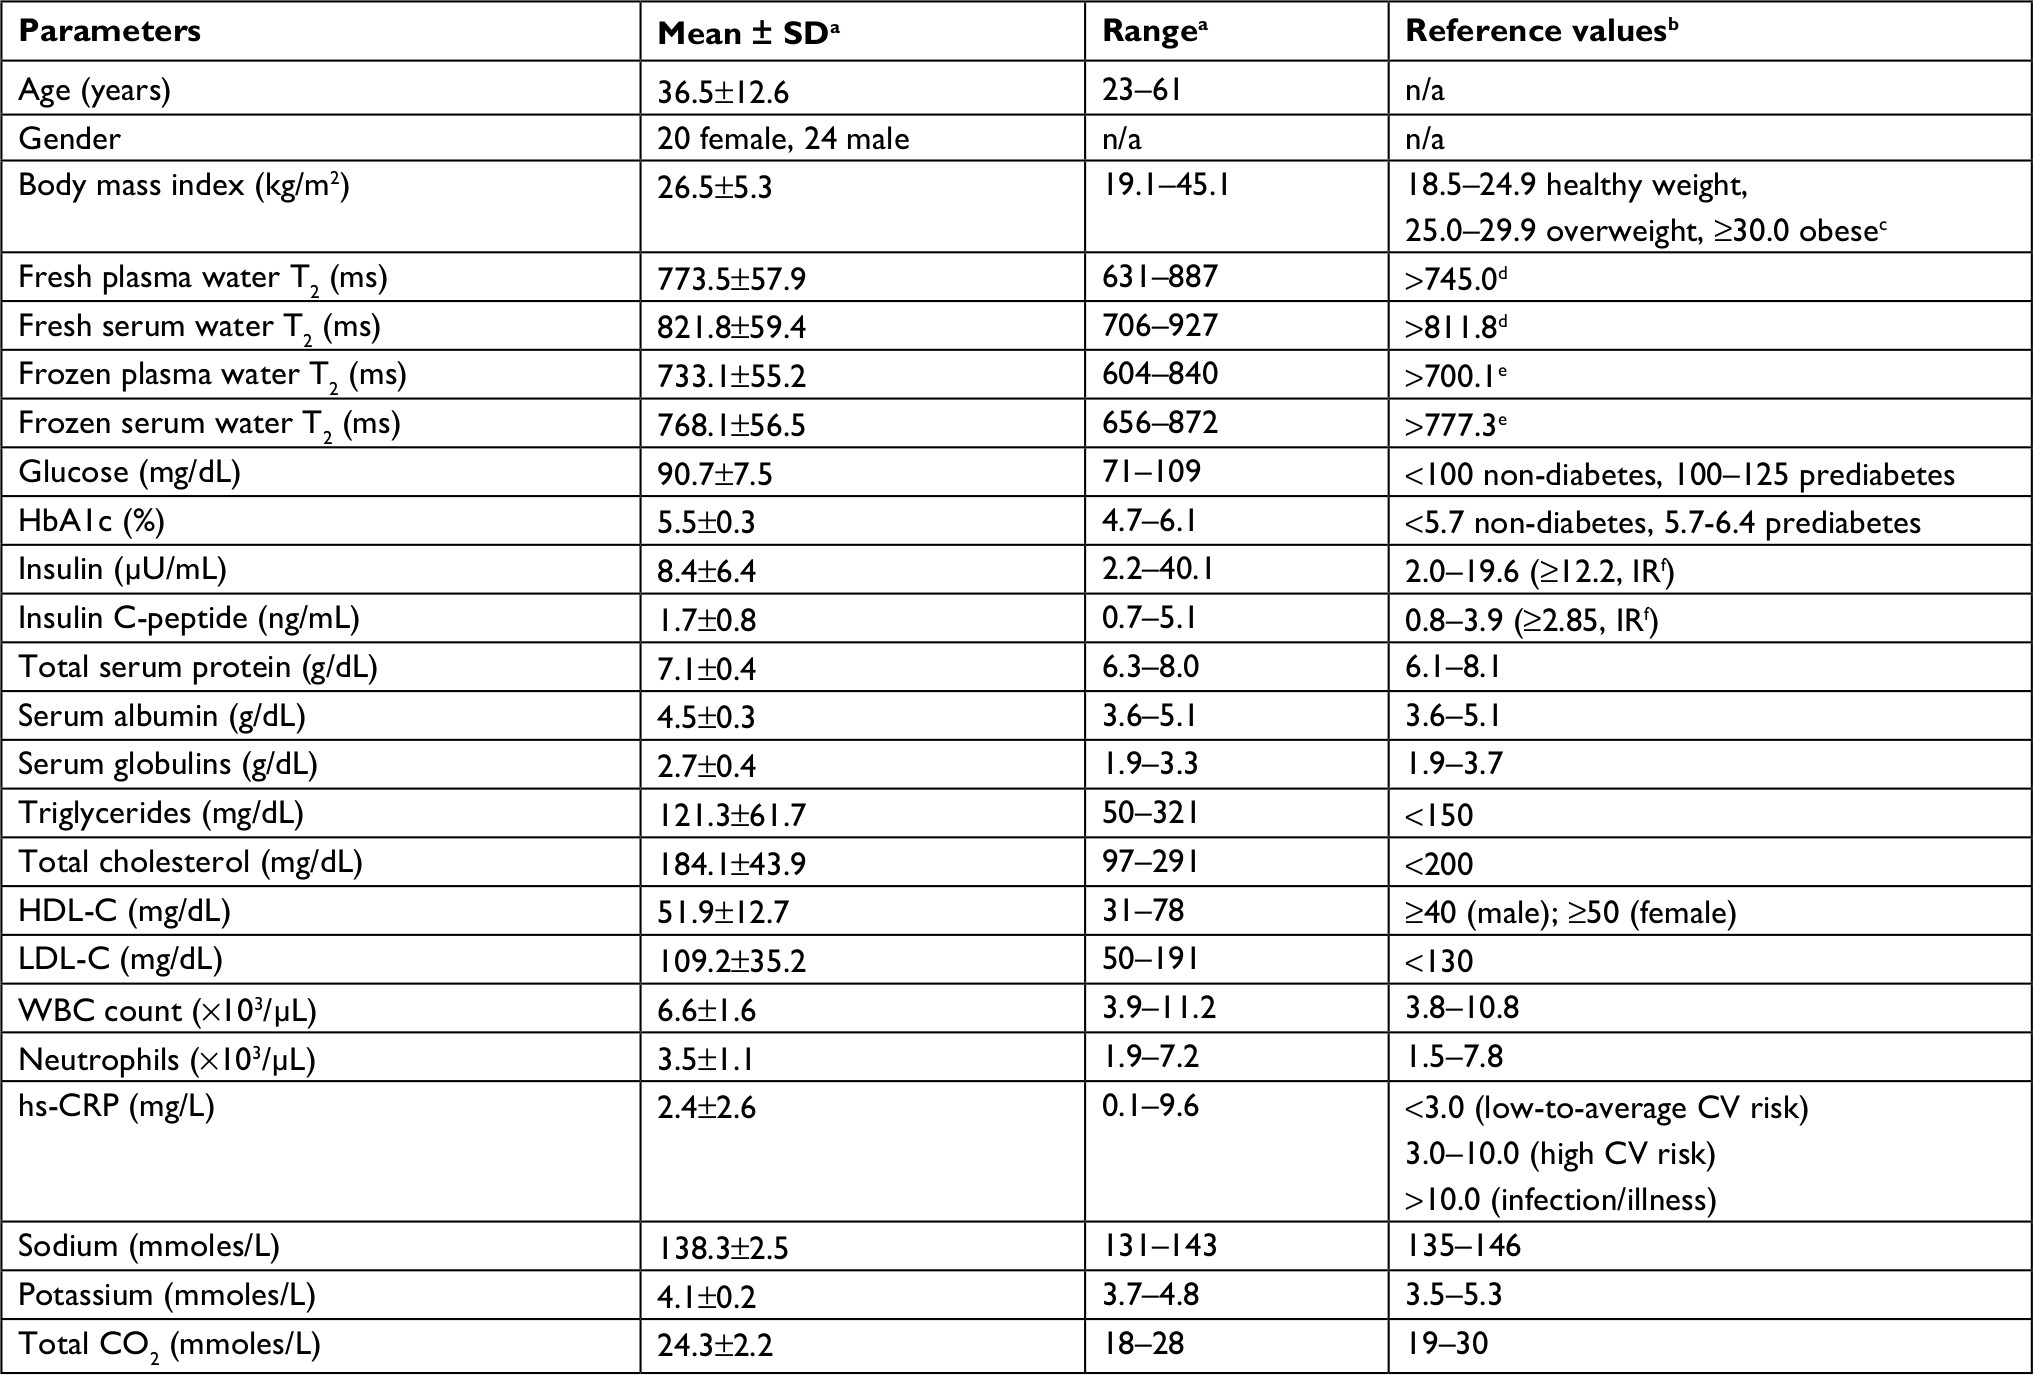 | Table 1 Characteristics of the study population, n=44 Notes: aAll blood samples were collected in the early morning following a 12-hour overnight fast. bReference values from Quest Diagnostics and Atherotech, except where noted. cFrom the U.S. Centers for Disease Control and Prevention.31 dCut point for fresh T2 established by Robinson et al, 2017.12 eFrom this study. fInsulin cut point from McAuley et al;32 insulin C-peptide from Robinson et al, 2017.12 Abbreviations: T2, transverse relaxation times; HDL-C, high-density lipoprotein cholesterol; LDL-C, low density lipoprotein cholesterol; WBC, white blood cell; n n/a, not applicable; IR, insulin resistance; CV, cardiovascular. |
Correlation and agreement between frozen and fresh water T2 values
“Frozen” refers to plasma or serum samples that had been biobanked at –80°C for several months, individually removed from the freezer, thawed for 5 minutes, pre-incubated at 37°C for 20 minutes, and then analyzed by benchtop NMR relaxometry at 37°C. The frozen samples underwent one freeze-thaw cycle. By contrast, “fresh” refers to samples that had never been frozen and were analyzed by NMR within 2 hours following venipuncture.
As shown in Figure 1, the frozen and fresh water T2 values were strongly correlated, as indicated by Huber M-values of 0.94 (95% CI: 0.89, 0.97) for plasma and 0.95 (95% CI: 0.91, 0.97) for serum. In Figure 1, the Huber correlations at the 95% CI are depicted by the red ellipses, and the linear least squares regression fits are indicated by the black lines.
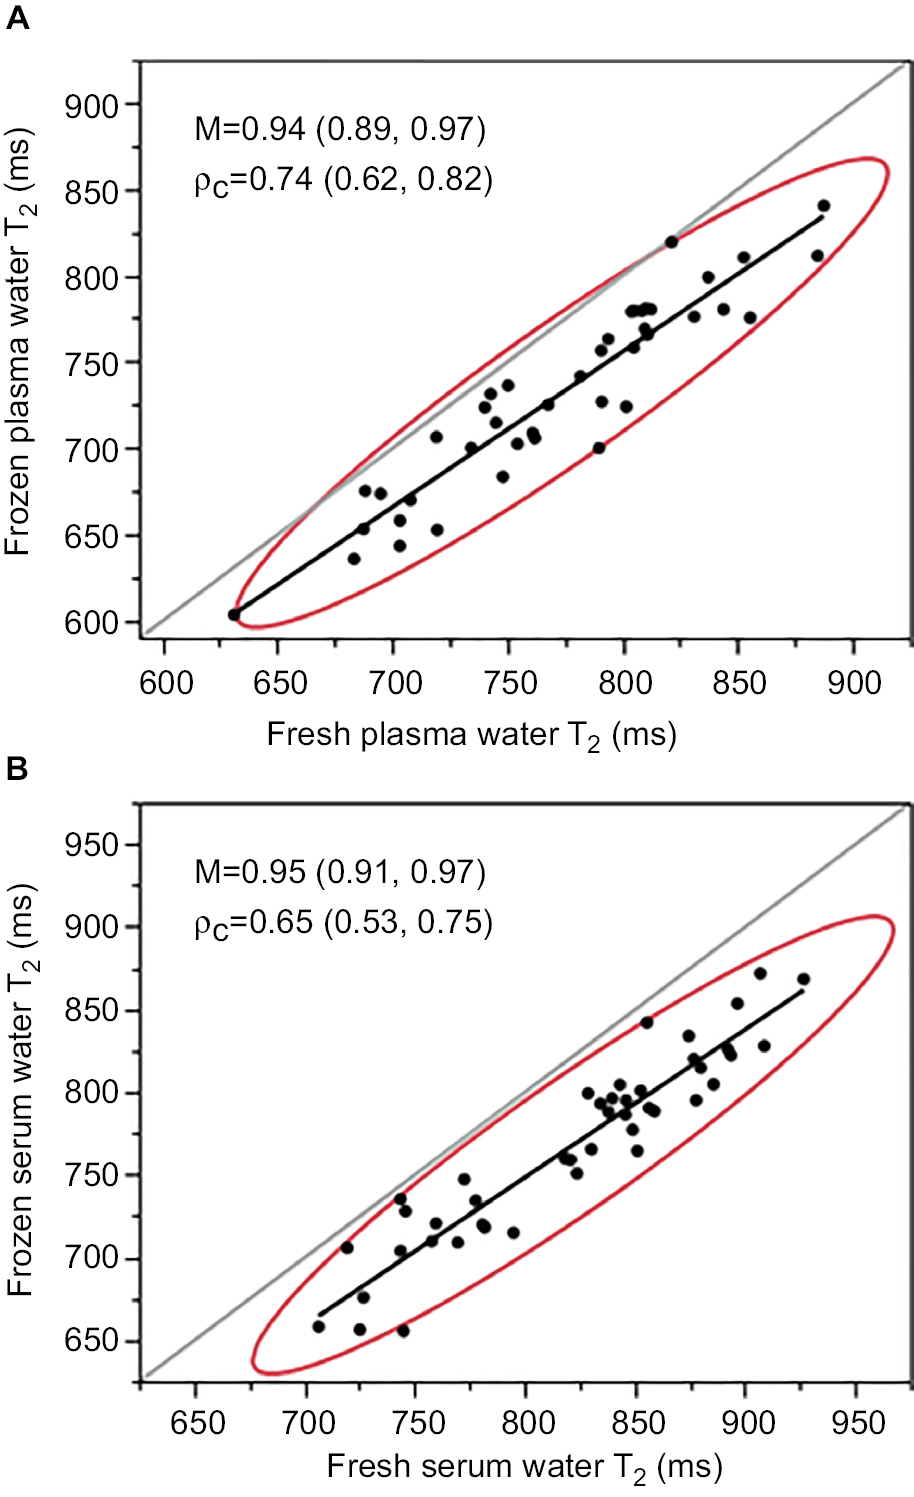 | Figure 1 Correlation plots for frozen vs fresh water T2 values for plasma (A) and serum (B). Notes: Each data point represents an individual human subject. The red ellipse defines the Huber correlation at the 95% CI, with M as the correlation coefficient. The Lin concordance correlation coefficient is designated ρc. The 95% confidence limits for the correlation coefficients are noted in parentheses. The black lines correspond to the linear least squares regression fits, and the gray lines indicate the line of equity, where y=x. Abbreviation: T2, transverse relaxation times. |
Despite the strong association between frozen and fresh, correlation is not the same as agreement.17,18 The absolute values of frozen vs fresh showed a lesser degree of agreement, with Lin concordance correlation coefficients (ρc) of 0.74 (95% CI: 0.62, 0.82) for plasma and 0.65 (95% CI: 0.53, 0.75) for serum. As visualized by the negative offset of the red ellipses below the gray line of equity (y=x), the frozen water T2 values were systematically lower than those for fresh, both for plasma (Figure 1A) and serum (Figure 1B).
The relationships between frozen and fresh water T2 values were analyzed further using Bland - Altman plots,17,18,21 as shown in Figure 2. The primary purpose of a Bland - Altman analysis is to define the limits of agreement between two measurements.22 Each data point represents the difference between frozen minus fresh water T2 (y-axis) plotted against the mean value of frozen and fresh water T2 (x-axis) for each subject. Large, statistically significant average offsets were observed for both frozen plasma water T2 (–5.4%) and serum water T2 (–6.5%) relative to that of fresh. As indicated by the red horizontal lines, the mean offset was –41.4 ms for frozen plasma (Figure 2A) and –53.8 ms for frozen serum (Figure 2B). However, the plots revealed no systematic differences in frozen vs fresh water T2 values across the measurement range, as evidenced by regression lines through the points (not shown). The slopes of the regression lines were essentially zero, ie, not significantly non-zero, for plasma (P=0.4340) and serum (P=0.3445).
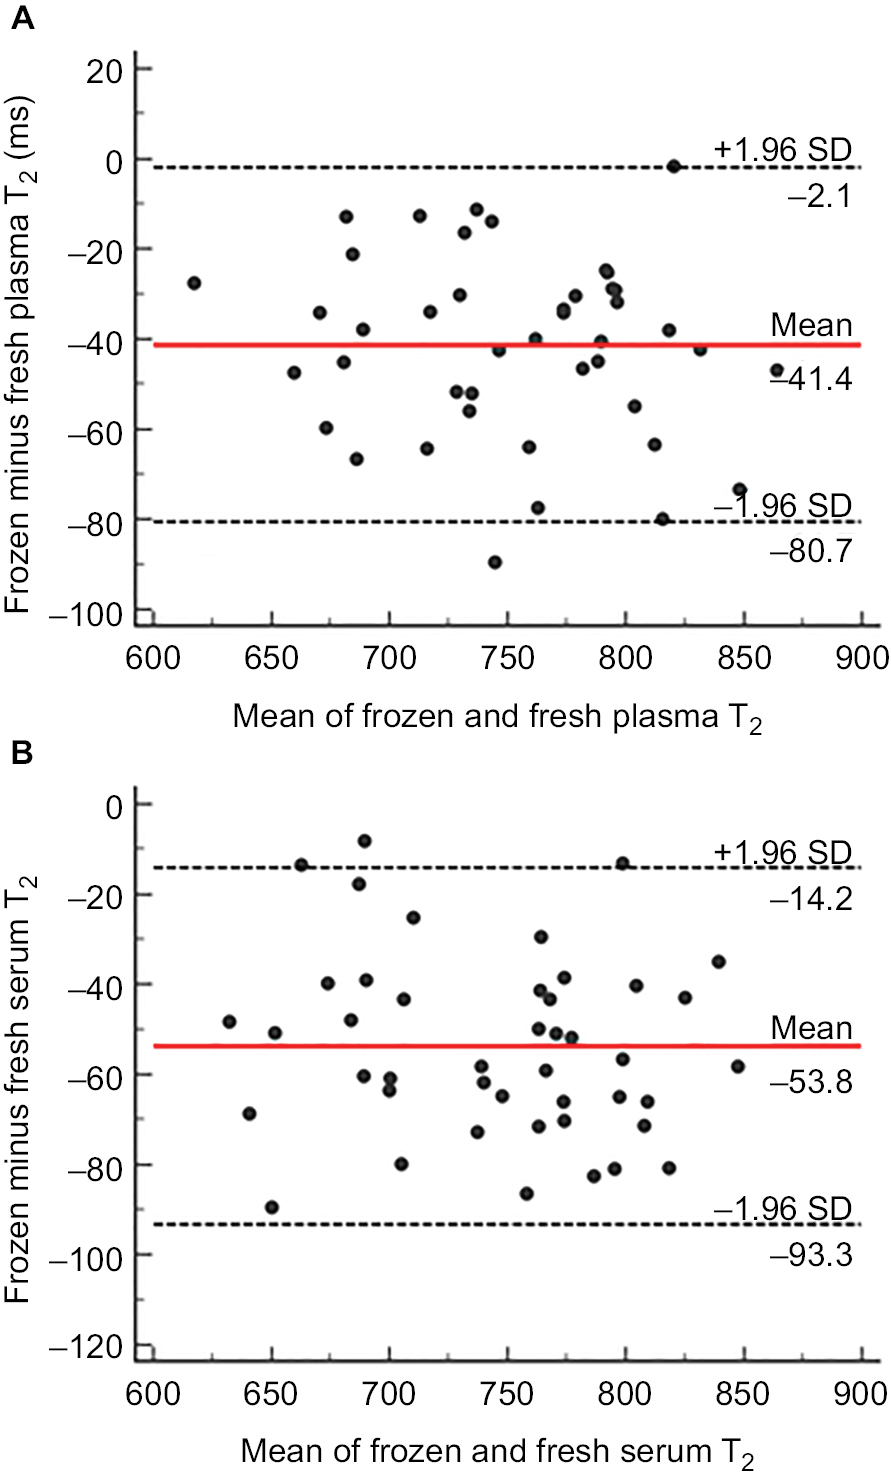 | Figure 2 Bland - Altman plots for the comparison of fresh vs frozen water T2 for plasma (A) and serum (B). Notes: The red horizontal line in the middle of each plot represents the mean offset for frozen plasma (A), and frozen serum (B) compared with fresh plasma and serum, respectively. The dashed lines at the bottom and top of each plot correspond to ±2 SD of the mean differences between frozen and fresh, which define the limits of agreement. Abbreviation: T2, transverse relaxation times. |
To investigate whether the differences in frozen vs fresh water T2 (ΔT2) were related to plasma and/or serum composition, the ΔT2 values were compared with the 130+ blood biomarkers measured for each subject in this study. Most biomarkers did not correlate with ΔT2. However, statistically significant correlations were observed between ΔT2 and triglyceride (TG)-related markers, specifically TG, TG/high-density lipoprotein (TG/HDL) ratio, TG/total cholesterol ratio, very low density lipoprotein cholesterol, and HDL cholesterol. Thus, increased levels of TG-rich lipoproteins were associated with decreased differences between frozen and fresh water T2, both for plasma and serum. A full list of bivariate correlations with ΔT2 is provided in Table S1.
Effect of post-thaw incubation time on frozen water T2 values
Up to 6 hours, the incubation time at 4°C did not cause a significant variation in plasma water T2, either for fresh or frozen samples. Data were not recorded beyond 6 hours, as samples were not incubated at 4°C longer than that prior to freezing. The inter-assay coefficient of variation was only 2.7% for fresh water T2 measurements at 0, 1, 2, 3, 4, and 5 hours from obtaining the plasma, and 2.9% for frozen plasma water T2 at 0, 1, 2, 3, 4, and 5 hours post-thaw.
Correlations between frozen water T2 and markers of metabolic health
The central question addressed in this study was whether water T2 values from once-frozen biobanked samples provided information about metabolic health similar to those obtained from fresh samples.12 Bivariate correlation coefficients were used to estimate the association between frozen water T2 values and a wide range of metabolic biomarkers.
Huber correlation coefficients for all biomarkers that showed statistically significant associations with both frozen plasma and frozen serum water T2 are reported in Table 2. Strong correlations were observed with markers of insulin and glucose metabolism, protein concentration and viscosity, lipids and lipoproteins, inflammation and coagulation, and electrolytes. Overall, the patterns of association with markers of metabolic health and MetS were like those observed for fresh plasma and serum water T2. In most cases, the magnitude of the association was even larger for frozen water T2 as compared with fresh water T2.
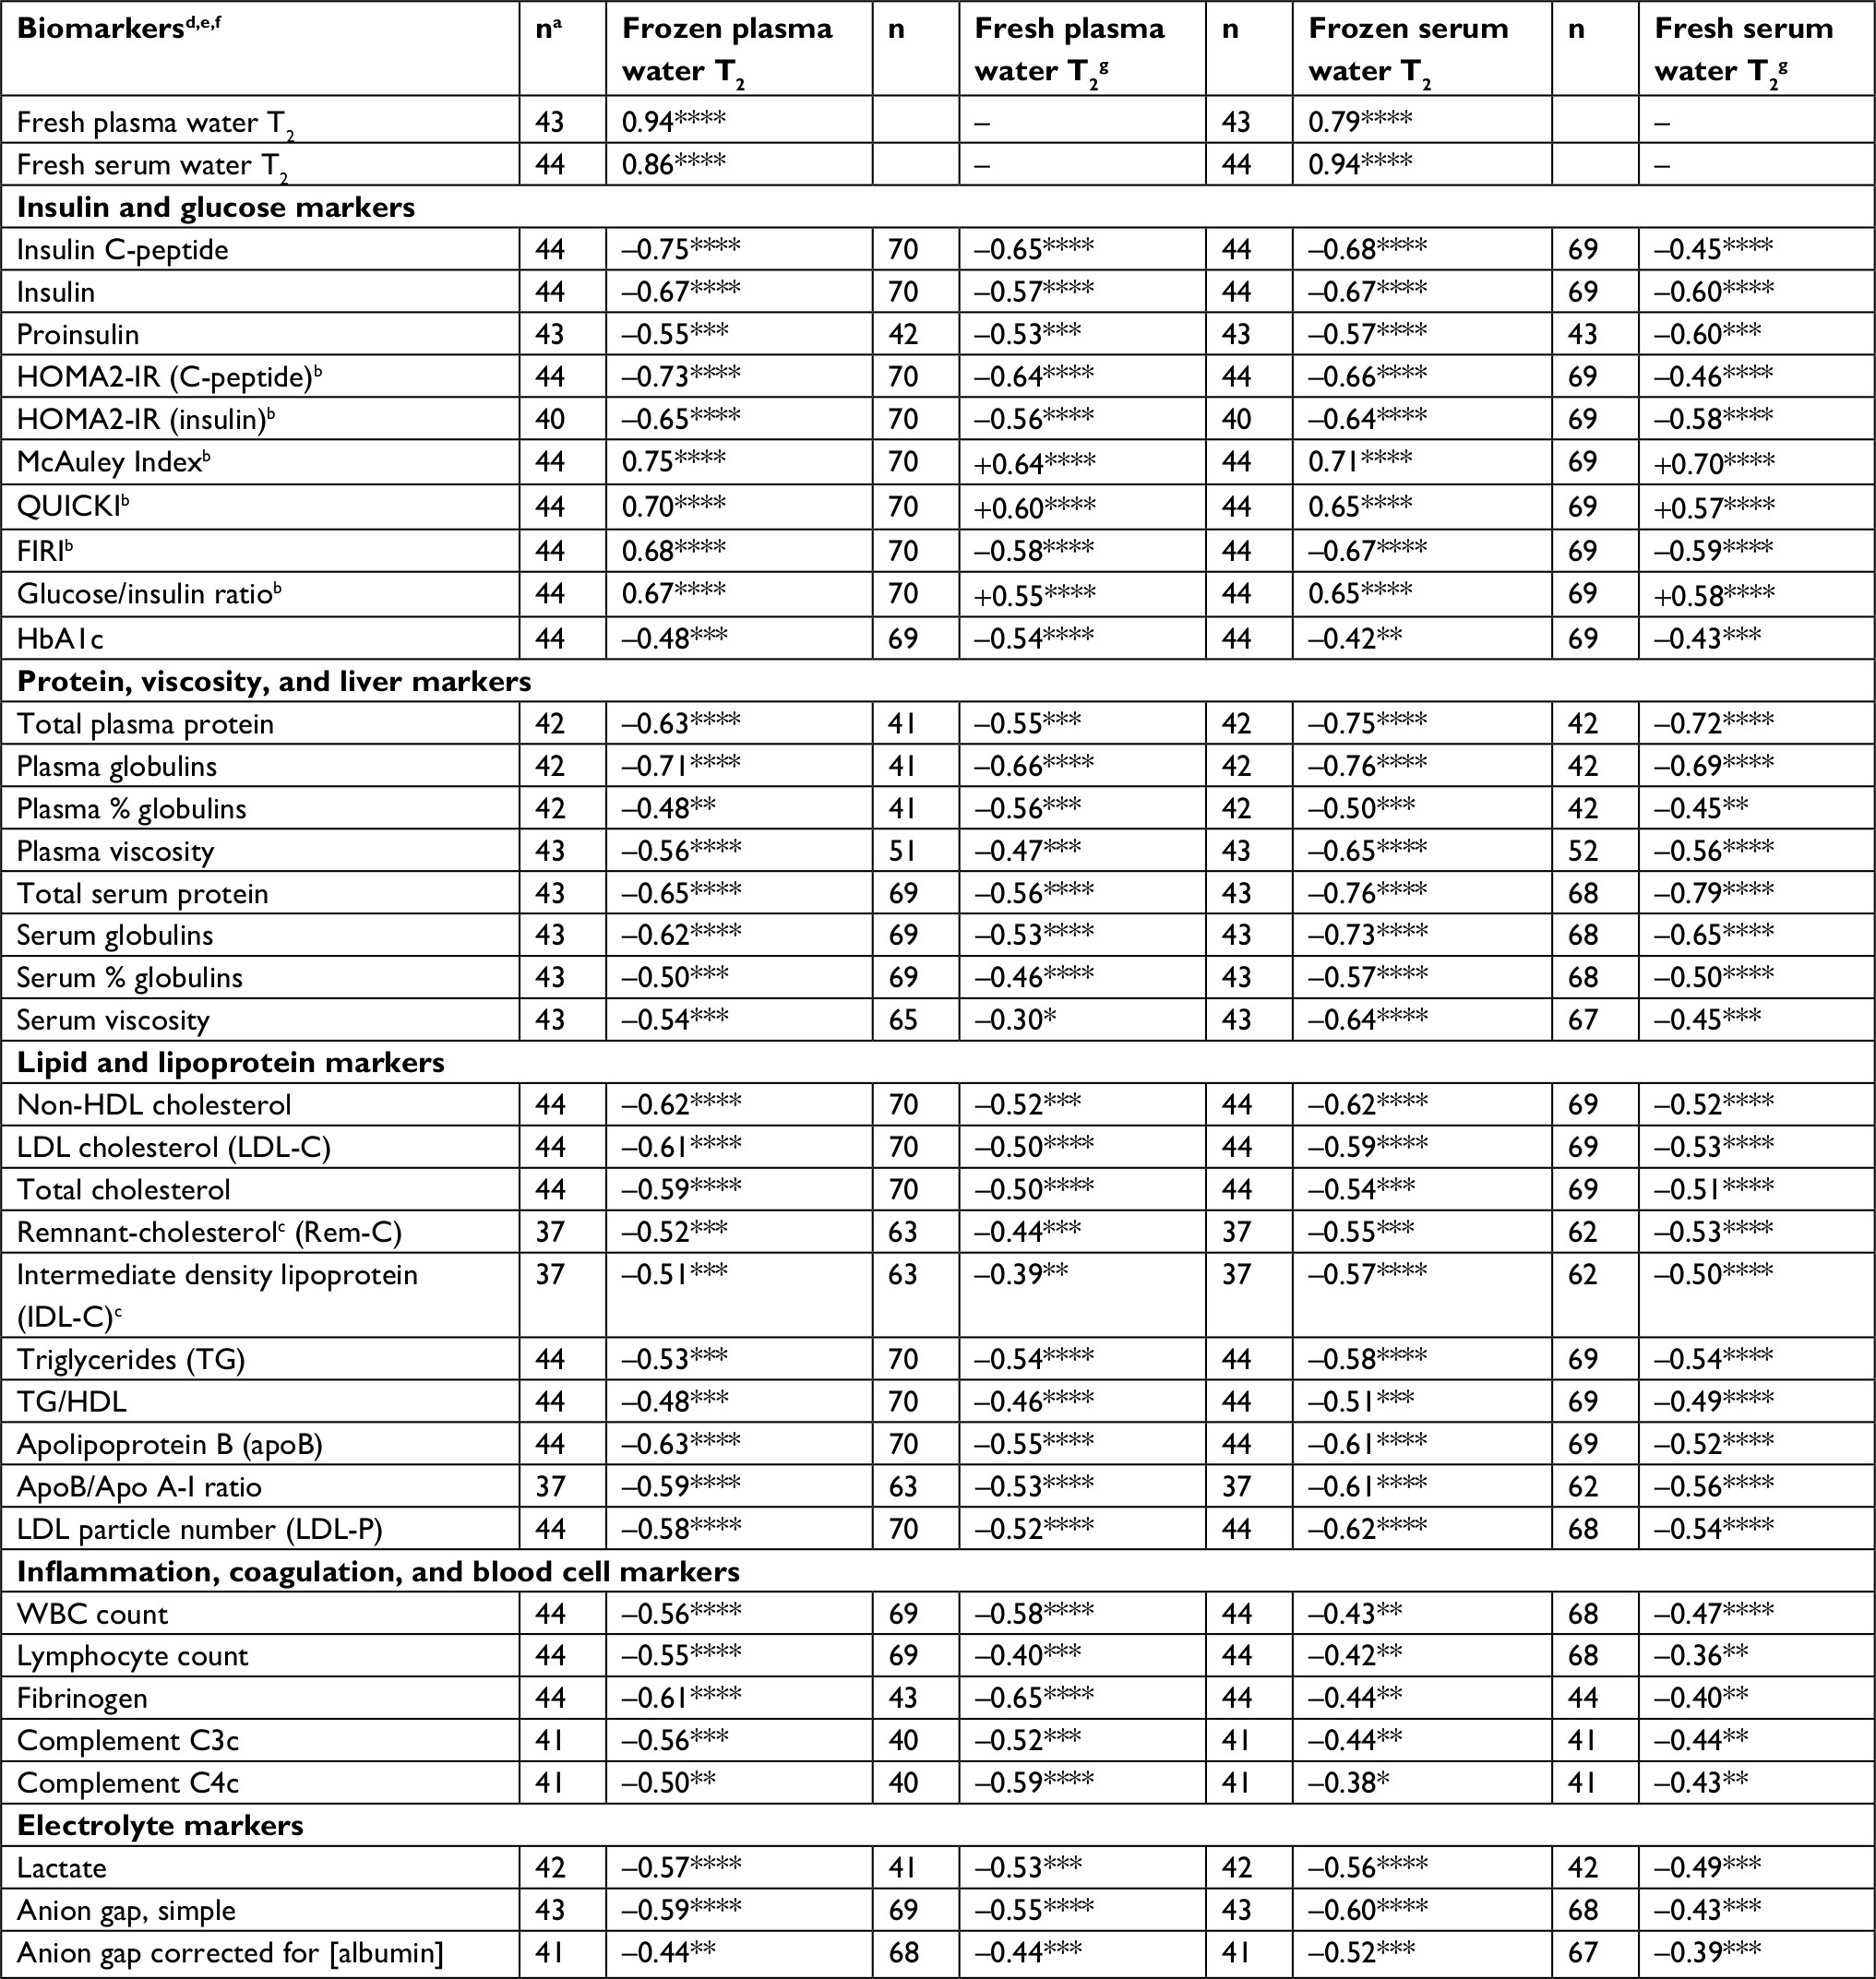 | Table 2 Huber correlation coefficients for frozen and fresh water T2 with metabolic biomarkers Notes: aOf the 44 subjects, 1 had a missing fresh plasma water T2 value due to the accidental overwriting of the data file. Other explanations for the variation in n are provided in reference 12. . Serum data for fresh and frozen data were available for all 44 subjects. bAs defined elsewhere: McAuley Index,32 HOMA-IR,33 FIRI,34 QUICKI,35 and G/I ratio.36 cRemnant cholesterol is defined as IDL plus VLDL3, as determined using the Vertical Autoprofile method.37 dAll blood samples were collected in the early morning following a 12-hour overnight fast. **P<0.01; ***P<0.001; ****P<0.0001. eThis table includes only those biomarkers that were unambiguously correlated with both plasma and serum water T2. Results for markers that correlated with plasma or serum water T2, but not both, are discussed in the text and provided in Tables S2 and S3. fMany of the variables were natural-log transformed in order to generate a normal distribution. The correlation coefficients reported here are for the ln-transformed variables, except the McAuley Index and QUICKI, as these indices are inherently ln-transformed. Other variables that were normally distributed and analyzed without ln transformation were fresh and frozen plasma and serum T2, total serum and plasma protein, serum and plasma globulins and % globulins, serum and plasma viscosity, HbA1c, LDL-C, LDL-P, total cholesterol, apoB, lymphocyte, lactate, complement C3c, and serine. gData in this column was reproduced from Table 3 of Reference 12. Used by permission. Abbreviations: T2, transverse relaxation times; IR, insulin resistance; HOMA-IR, homeostasis model assessment-insulin resistance; QUICKI, quantitative insulin sensitivity check index; G/I, glucose to insulin ratio; HDL, high-density lipoprotein; LDL, low density lipoprotein; WBC, white blood cell; VLDL, very low density lipoprotein. |
Some metabolic biomarkers correlated with frozen plasma water T2, but not frozen serum water T2. These markers included CRP, neutrophil count, α1-acid glycoprotein, ALT, and GGT. Conversely, IgG and glutamate correlated with frozen serum water T2 but not frozen plasma water T2. The correlation coefficients for these markers, along with full datasets of Pearson (r), Spearman (ρ), and Huber M-values are provided in Tables S2 and S3.
Among the markers that showed no correlation with frozen plasma or serum water T2 were albumin and sodium – markers of hydration status. In addition, markers related to paramagnetic ions and their binding proteins, such as transferrin, ceruloplasmin, and ferritin, showed no correlation with frozen plasma or serum water T2. As with fresh water T2, variation in frozen water T2 was not associated with variation in the subject’s hydration state or iron/copper status, at least in this study cohort. Moreover, frozen water T2 was not correlated with erythrocyte sedimentation rate, which becomes elevated in patients with cancer or acute inflammatory diseases. All but one of the subjects in this study had low sedimentation rates, well within the normal reference range. A summary of all 130+ biomarkers measured in this study, indicating those that did not correlate with frozen water T2, is provided in Table S4.
Multivariable linear and logistic regression analysis
Multiple regression models were built to identify independent predictors of frozen water T2 and to control for possible confounding. The best linear regression model for frozen plasma water T2 had an adjusted R2 of 0.77 and included fasting insulin, total plasma protein, apolipoprotein B and CRP as independent, statistically significant predictor variables. As with regression models for fresh water T2,12 one biomarker from each of four categories (insulin, total protein or viscosity, lipids, and inflammation) had independent contributions to frozen water T2. Each of the viable regression models accounted for approximately two-thirds to three-fourths of the variation in frozen plasma water T2. Attempts to add more than four biomarkers to the model resulted in overfitting, as assessed using k-fold cross validation. This observation was consistent with the rule of thumb that models should have no more than about one predictor variable for every ten observables or subjects.
Categorical outcome variables were used in logistic regression analysis to compare means and calculate odds ratios (ORs). The subjects were categorized with respect to having or not having metabolic conditions associated with MetS, as well as MetS itself (Table 3). The four conditions were hyperinsulinemia, dyslipidemia, inflammation, and electrolyte abnormalities. For each of the four conditions and for MetS, the mean frozen plasma water T2 value was 40–70 ms lower in those who had the condition, compared with those who did not. The largest decrease in frozen plasma water T2 (83.3 ms or 11%) was observed for individuals who had a combination of hyperinsulinemia plus dyslipidemia plus inflammation.
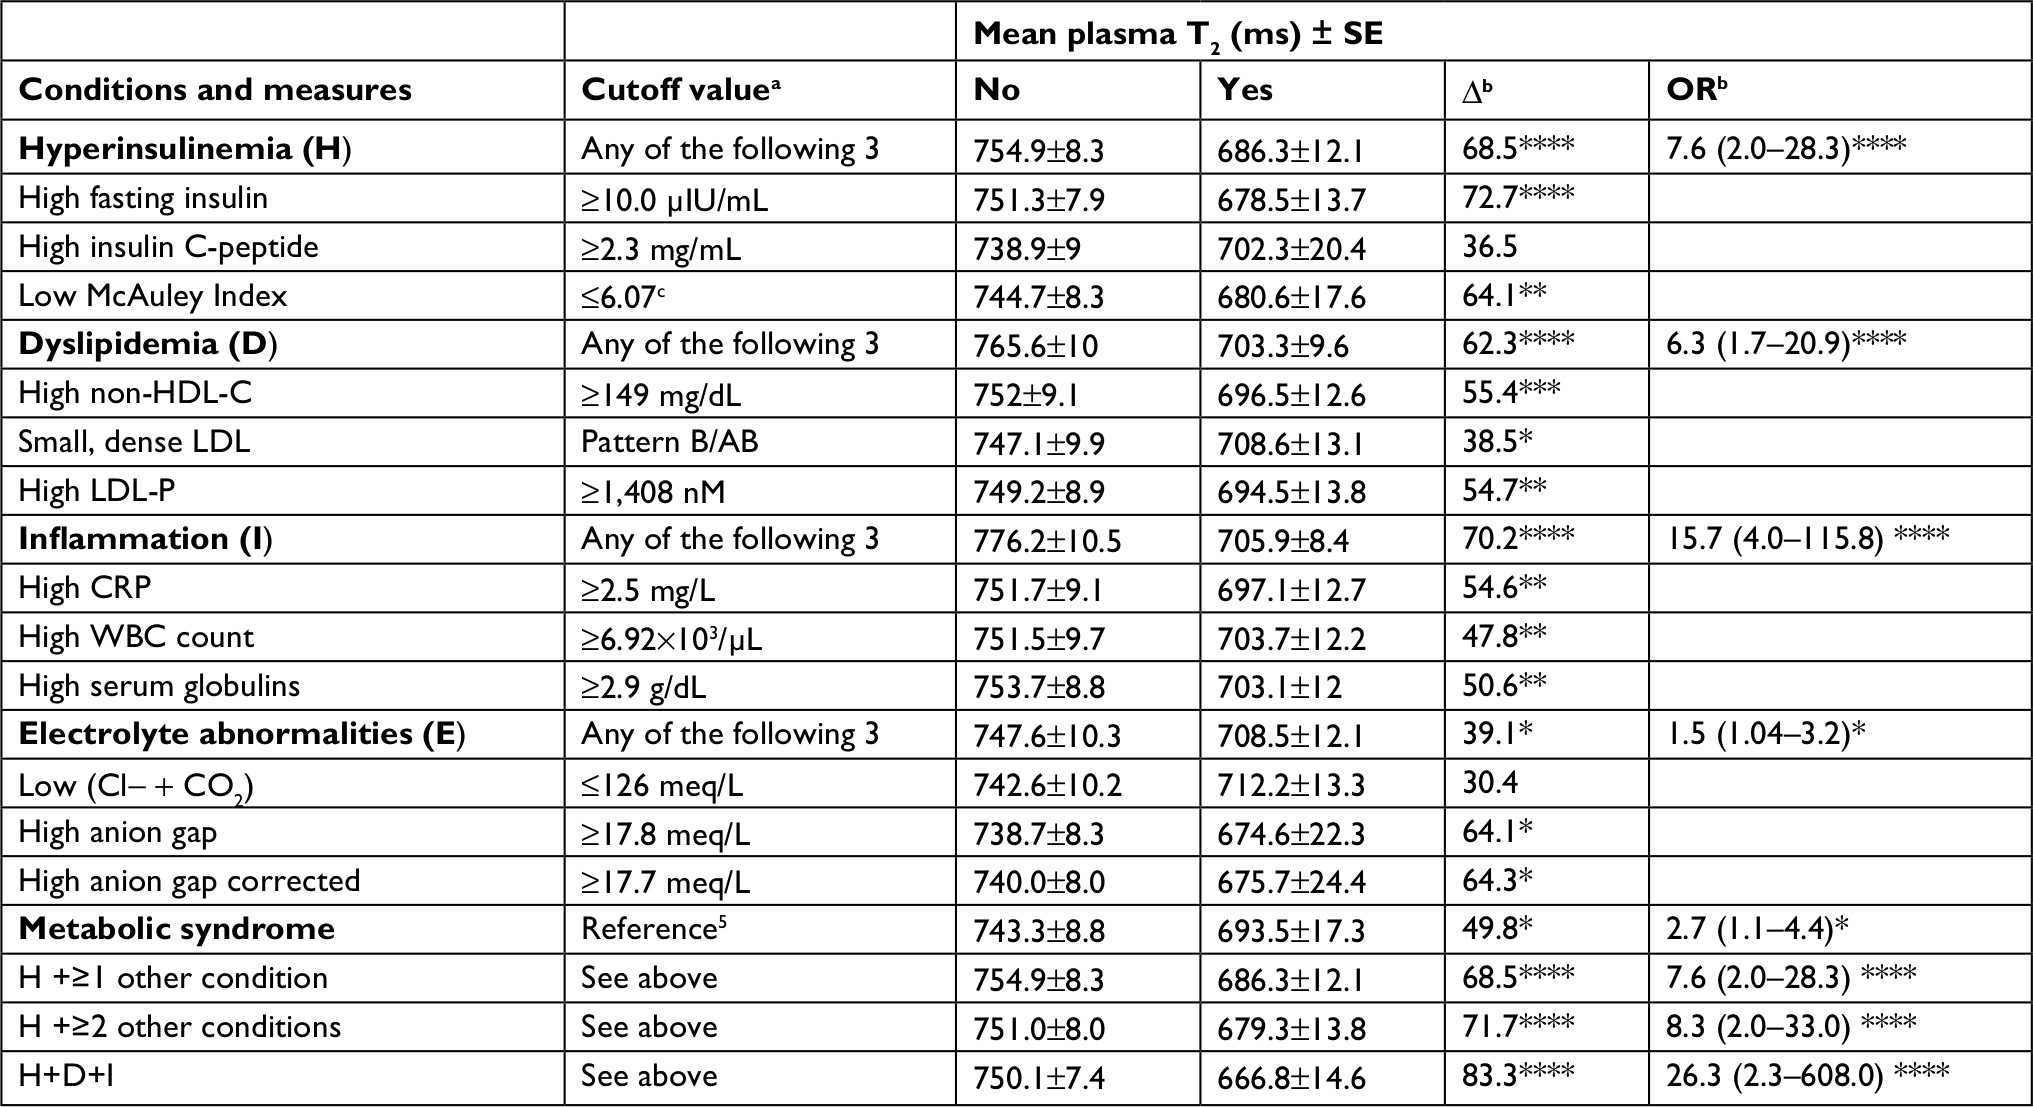 | Table 3 Mean frozen plasma water T2 values for conditions and measures associated with metabolic syndrome Notes: aData from Robinson et al, 2017.12 bMean difference (Δ) and OR (95% confidence limits) for the mean difference shown one column to the left; *P<0.05, **P<0.01, ***P<0.001, ****P<0.0001. cA measure of insulin resistance, obtained using formula in abstract of reference 32 with insulin =12.2 μIU/mL and triglyceride =1.5 mM as input. Abbreviations: T2, transverse relaxation times; HDL-C, high-density lipoprotein cholesterol; LDL, low density lipoprotein; LDL-P, LDL-particle number; OR, odds ratio; WBC, white blood cell; CRP, C-reactive protein. |
The unit and range ORs associated with each condition were determined. For frozen plasma water T2, the unit OR was 1.03 (95% CI range: 1.01–1.05, P<0.0001) for hyperinsulinemia or dyslipidemia, and 1.04 (1.02–1.07, P<0.0001) for inflammation. As shown in Table 3, the observed decrease in mean frozen plasma water T2 value for each condition (68.5 ms for hyperinsulinemia, 62.3 ms for dyslipidemia, and 70.2 ms for inflammation) increased the odds of hyperinsulinemia by 1.0368.5=7.6, the odds of dyslipidemia by 1.0362.3=6.3, and the odds of inflammation by 1.0470.2=15.7. The highest OR (26.3) was observed for the combination of hyperinsulinemia plus dyslipidemia plus inflammation, a set of underlying conditions associated with early metabolic dysregulation and MetS. Thus, a decrease of frozen plasma water T2 by 83.3 ms is associated with 26.3-fold increase in the odds of having this set of conditions.
ROC curve analysis
To assess the sensitivity, specificity, and cut points for detecting metabolic abnormalities, a ROC curve was generated for frozen plasma water T2 (Figure 3A, blue). The AUC was 0.92, close to the theoretical maximum of 1.0. Thus, frozen plasma water T2 can readily distinguish between individuals with good vs poor metabolic health. The optimal cut point to identify metabolic abnormalities, defined by the intersection of the blue curve with the gray tangent line, was ≤700.1 ms. This cut point corresponds to 89% sensitivity and 91% specificity. The positive and negative likelihood ratios are 9.9 and 0.1, respectively. For comparison, the ROC curve for fresh plasma water T2 is shown in green in Figure 3A. The curves for frozen and fresh plasma were nearly superimposable, and the sensitivities and specificities were very similar. However, the optimal T2 cut point for frozen plasma water T2 was 42.6 ms lower than that for fresh.
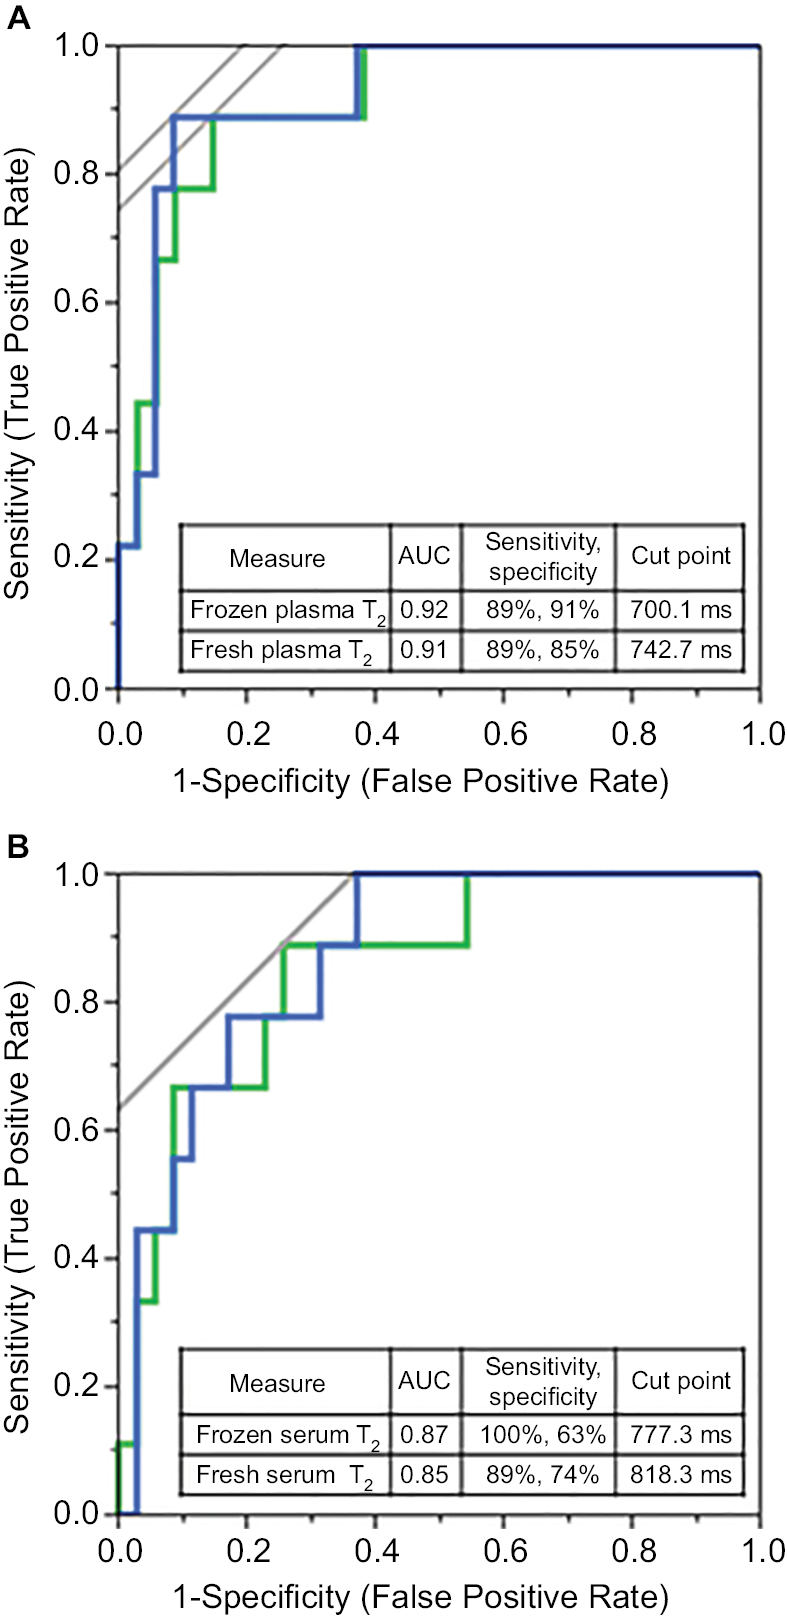 | Figure 3 ROC curves to assess the ability of water T2 measurements from plasma (A) and serum (B) to detect individuals with poor metabolic health. Notes: Here, poor metabolic health is defined as the syndrome including hyperinsulinemia, dyslipidemia, and inflammation (H+D+I from Table 3). The blue curves represent frozen plasma (A) or serum (B), and the green, fresh plasma (A) or serum (B). Abbreviation: T2, transverse relaxation times. |
The ROC curves for serum are shown in Figure 3B. Frozen serum water T2 (blue curve) yielded an AUC of 0.87, indicating that frozen serum – like plasma – can distinguish subjects with good metabolic health from those with metabolic dysregulation. The optimal cut point for frozen serum T2 was 777.3 ms, considerably lower than that for fresh serum water T2 (Figure 3B, green curve).
Detection of early metabolic dysregulation using frozen water T2
Figure 4 illustrates the stages in the progression toward type 2 diabetes and the numbers of subjects in each stage. Of the 44 subjects in this study, 16 individuals had healthy metabolism (green box), while 28 had either early metabolic dysregulation (light yellow) or prediabetes (orange). Of the 15 subjects with prediabetes, five also met the harmonized clinical criteria for MetS.5 Of the 13 subjects with early metabolic dysregulation, only four met the harmonized MetS criteria. The remaining nine subjects were identified by low frozen water T2 values, indicative of hyperinsulinemia, hypercholesterolemia, and subclinical inflammation. Thus, frozen water T2 detected nine subjects with early metabolic dysregulation that would have been undetected using the current clinical criteria for prediabetes and MetS. In other words, the criteria for prediabetes and MetS failed to detect approximately one-third (nine of 28) of subjects with metabolic abnormalities that put them at risk for type 2 diabetes and atherosclerotic cardiovascular disease.
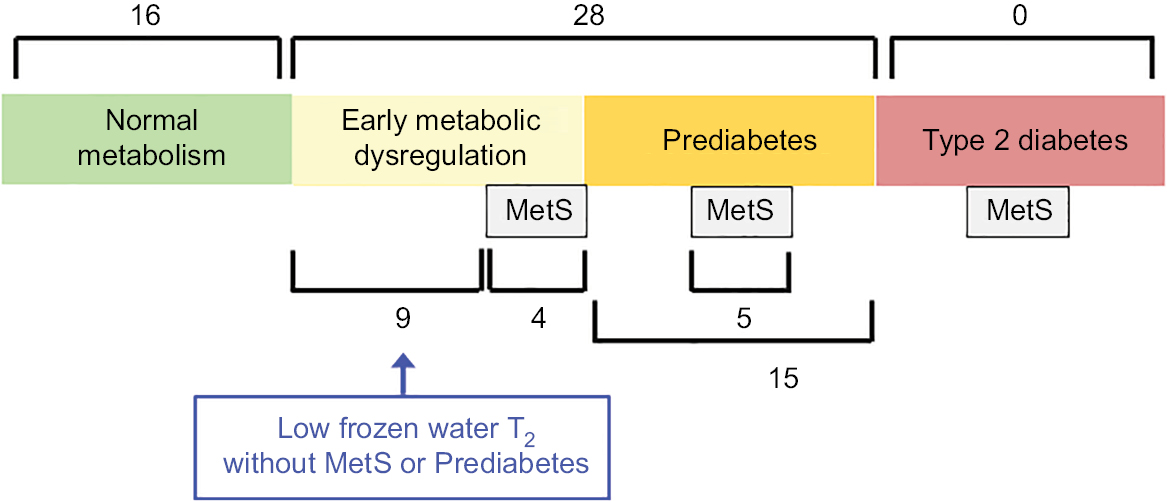 | Figure 4 Stages in the progression toward type 2 diabetes mellitus, indicating the number of subjects in each stage or category. Notes: Prediabetes (orange box) was defined by American Diabetes Association criteria, ie, individuals with either fasting glucose values of 100–125 mg/dL or HbA1c values of 5.7%–6.4%. MetS (gray boxes) was defined using the harmonized clinical criteria of Alberti et al.5 Normal metabolism (green box) refers to individuals without either prediabetes, MetS, or low frozen water T2 values, using the cut points defined in Figure 3. Of the 13 individuals with early abnormalities (yellow box), nine did not meet the criteria for prediabetes or MetS. These nine individuals were identified by low frozen plasma and/or serum water T2 values. ©The Authors. Adapted from Water T2 as an early, global and practical biomarker for metabolic syndrome: an observational cross-sectional study. J Transl Med. 2017;15(1):258.12 Abbreviations: MetS, metabolic syndrome; T2, transverse relaxation times. |
Discussion
The comparison of frozen and fresh water T2 values for 44 non-diabetic subjects revealed a high degree of correlation, but a lower degree of agreement. Water T2 values for plasma and serum samples that had undergone one freeze-thaw cycle were systematically lower than those for plasma or serum that had never been frozen. Despite the negative offsets, frozen water T2 values for both plasma and serum were highly correlated with biomarkers of MetS and its underlying abnormalities, specifically hyperinsulinemia/insulin resistance, dyslipidemia, and subclinical inflammation. Frozen plasma and serum water T2 detected these abnormalities with high sensitivity and specificity. Using ROC-determined cut points, frozen water T2 detected early metabolic dysregulation in nine individuals which would have been undetected using the clinical thresholds for prediabetes or MetS.
The cause(s) of the negative offsets for frozen plasma and serum water T2 values are unknown. One possible explanation was that the samples may have changed during sample handling prior to storage at –80°C. Once the plasma/serum was obtained by two-step centrifugation, aliquots were stored temporarily at 4°C for 2–3 hours prior to freezing. An experiment for one subject comparing plasma water T2 measurements at 1, 2, 3, 4, and 5 hours after storage at 4°C showed no significant differences, either for fresh or once-frozen-thawed samples. These findings are consistent with previous work showing that the levels of 97 chemokines and cytokines did not decrease in samples stored at room temperature for 2 hours, even in whole blood samples.23 Thus, short-term storage of plasma and serum at 4°C prior to freezing is not a likely explanation for the decreased T2 observed for frozen samples. Further research is needed to investigate the relationship between water T2 and possible sample changes that occur as the result of the freeze-thaw process.
Despite the lower T2 values observed in samples that underwent one freeze-thaw cycle, it is remarkable that frozen water T2 fully retained the ability to detect early metabolic dysregulation and MetS. Importantly, this study established the feasibility of conducting water T2 analyses of biobanked specimens from cohort studies and clinical trials. Such studies will facilitate the validation of water T2 as a biomarker for metabolic health and the analysis of water T2 in other study populations. The caveat is that the cut points for water T2 must be calibrated separately for fresh vs frozen samples.
Plasma and serum water T2 as screening tools for diabetes prevention
The world-wide diabetes pandemic has created an unmet need for improved strategies for screening and primary prevention. Plasma and serum water T2 offer unique advantages for identifying at-risk individuals, especially those missed by conventional glucose and lipid screening. Water T2 permits the early detection of hyperinsulinemia/insulin resistance at a stage when pancreatic beta-cell function remains largely intact. By contrast, beta-cell secretory function in individuals with impaired glucose tolerance (prediabetes) is 50%–70% lower compared to those with normal glucose tolerance, after correcting for differences in insulin sensitivity.24 The key to diabetes prevention is to preserve pancreatic beta-cell function,8 rather than waiting for it to decline by 50% or more before initiating therapeutic interventions.
The Inter99 Study was a longitudinal study of the natural history of insulin sensitivity and secretion in subjects who were normoglycemic at baseline.25 The results showed that individuals who developed impaired fasting glucose or impaired glucose tolerance at 5-year follow-up had higher fasting insulin levels at baseline compared with those who maintained normal glucose tolerance throughout the 5 years. Secondary analysis of data from the PREMIER Study showed that compensatory hyperinsulinemia (without MetS or impaired fasting glucose) was prevalent in the study population and responded to the lifestyle interventions.26 Taken together, these results point to an opportunity to screen and intervene at a stage earlier than used in current diabetes prevention strategies.
In addition to its ability to detect early insulin resistance, water T2 also detects key co-morbidities, specifically subclinical inflammation and cholesterol-related dyslipidemias. Thus, plasma and serum water T2 provide a global view of an individual’s metabolic health with just one measurement. The instrumentation is compact and inexpensive, and the method is simple and quick. In summary, water T2 is an early, global, and practical screening tool for cardio metabolic health and diabetes risk.
Limitations of this study
This study did not examine the effect of other biobanking variables on water T2, such as the months or years of storage time at –80°C and the number of freeze-thaw cycles. Future studies need to assess the effect of those variables on water T2.
The cut points determined from ROC analysis in this study are preliminary and should be validated/calibrated in a larger cohort. The main purpose of the current ROC analysis was to compare the sensitivity/specificity/AUC of frozen water T2 for detecting poor metabolic health with those of fresh water T2.
The use of 44 subjects limited the multiple regression analysis to no more than four predictor variables. Although these variables account for two-thirds to three-fourths of the variation in water T2, the study of a larger number of subjects will permit the identification of other predictor variables to account for the remaining variation in frozen water T2.
Given the cross-sectional nature of the study, the frozen water T2 data do not provide a direct measure of the risk for future type 2 diabetes or cardiovascular disease. However, like those for fresh, frozen water T2 values are strongly correlated with markers that have been shown in longitudinal studies to be predictive of incident diabetes and/or cardiovascular disease, specifically complement C3, C4, fibrinogen, haptoglobin, and various cholesterol markers.12,27–30
Analogous to CRP and other inflammatory markers, one must be cautious in the interpretation of water T2 values in subjects with possible acute illness, including subclinical infections. As a screening test for metabolic health, water T2 is best used in subjects without active infectious or inflammatory diseases.
Other limitations of this study design have been discussed elsewhere for fresh water T2.12
Conclusion
Frozen plasma and serum water T2 from benchtop NMR relaxometry detects the abnormalities that underlie MetS, namely insulin resistance, dyslipidemia, and subclinical inflammation, with high sensitivity and specificity. However, the freeze-thaw process causes a lowering of water T2 values for both plasma and serum relative to those of freshly drawn samples. Therefore, care must be taken to calibrate metabolic cut points for frozen samples independent of those for fresh samples. With proper calibration, it is feasible to use plasma and serum water T2 values from frozen, biobanked samples to assess metabolic health in subjects who had participated in cohort studies and clinical trials.
Data sharing statement
The datasets used and/or analyzed during the current study are available from the corresponding author upon reasonable request.
Acknowledgments
The authors thank Kim Brown, RN for performing the phlebotomy and taking anthropometric measurements. This work was supported by institutional start-up funds to DPC from the University of North Texas Health Science Center and the Texas Tech Health University Health Science Center, El Paso, as well as a grant from the U.S. National Heart Lung and Blood Institute/NIH (1 R21 143030-01 to DPC).
Author contributions
All authors contributed to data analysis, drafting and revising the article, gave final approval of the version to be published, and agree to be accountable for all aspects of the work. Specifically, IM performed study design and subject recruitment, collected and/or analyzed the NMR data, performed the statistical analyses, and drafted the manuscript. CJ collected the NMR T2 data on biobanked samples, with assistance from IM and VP, and reviewed the manuscript. VP assisted with data collection and statistical analysis and reviewed the manuscript. SD managed the blood draw protocols and database, performed many of the in-house biomarker assays, and reviewed the manuscript. As Principal Investigator, DPC conceived and supervised the project, oversaw the design and execution of the study, performed some of the statistical analyses, and edited the manuscript.
Disclosure
The University of North Texas Health Science Center, Fort Worth has applied for a patent related to the methods described in this study, with David P Cistola and Michelle D Robinson as co-inventors. The authors report no other conflicts of interest in this work.
References
Kassi E, Pervanidou P, Kaltsas G, Chrousos G. Metabolic syndrome: definitions and controversies. BMC Med. 2011;9:48. | ||
Sperling LS, Mechanick JI, Neeland IJ, et al. The CardioMetabolic health alliance: Working toward a new care model for the metabolic syndrome. J Am Coll Cardiol. 2015;66(9):1050–1067. | ||
Grundy SM. Metabolic syndrome update. Trends Cardiovasc Med. 2016;26(4):364–373. | ||
Kahn R, Buse J, Ferrannini E, Stern M; American Diabetes Association; European Association for the Study of Diabetes. The metabolic syndrome: Time for a critical appraisal: joint statement from the American Diabetes Association and the European Association for the Study of Diabetes. Diabetes Care. 2005;28(9):2289–2304. | ||
Alberti KG, Eckel RH, Grundy SM, et al; International Diabetes Federation Task Force on Epidemiology and Prevention; Hational Heart, Lung, and Blood Institute; American Heart Association; World Heart Federation; International Atherosclerosis Society; International Association for the Study of Obesity. Harmonizing the metabolic syndrome: A joint interim statement of the international diabetes federation task force on epidemiology and prevention; national heart, lung, and blood institute; American heart association; world heart federation; international atherosclerosis society; and international association for the study of obesity. Circulation. 2009;120(16):1640–1645. | ||
Eyre H, Kahn R, Robertson RM; American Cancer Society, the American Diabetes Association, and the American Heart Association; Collaborative Writing Committee.. Preventing cancer, cardiovascular disease, and diabetes. Diabetes Care. 2004;27(7):1812–1824. | ||
Alberti KG, Zimmet P, Shaw J. International Diabetes Federation: a consensus on Type 2 diabetes prevention. Diabet Med. 2007;24(5):451–463. | ||
DeFronzo RA, Abdul-Ghani MA. Preservation of β-cell function: the key to diabetes prevention. J Clin Endocrinol Metab. 2011;96(8):2354–2366. | ||
Napoli C, Crudele V, Soricelli A, et al. Primary prevention of atherosclerosis: a clinical challenge for the reversal of epigenetic mechanisms? Circulation. 2012;125(19):2363–2373. | ||
Diabetes Prevention Program Research Group. Long-term effects of lifestyle intervention or metformin on diabetes development and microvascular complications: The DPP outcomes study. Lancet Diabetes Endocrinol. 2015;3(11):866–875. | ||
Nambi V, Bhatt DL. Primary prevention of atherosclerosis: Time to take a selfie? J Am Coll Cardiol. 2017;70(24):2992–2994. | ||
Robinson MD, Mishra I, Deodhar S, et al. Water T2 as an early, global and practical biomarker for metabolic syndrome: an observational cross-sectional study. J Transl Med. 2017;15(1):258. | ||
Cistola DP, Robinson MD. Compact NMR relaxometry of human blood and blood components. Trends Analyt Chem. 2016;83(A):53–64. | ||
Huber PJ, Ronchetti EM. Robust Statistics. 2nd ed. Chichester: Wiley; 2009. | ||
Lin LI. A concordance correlation coefficient to evaluate reproducibility. Biometrics. 1989;45(1):255–268. | ||
Altman DG, Bland JM. Measurement in medicine: The analysis of method comparison studies. The Statistician. 1983;32(3):307–317. | ||
Bland JM, Altman DG. Statistical methods for assessing agreement between two methods of clinical measurement. Lancet. 1986;1(8476):307–310. | ||
Bland JM, Altman DG. Measuring agreement in method comparison studies. Stat Methods Med Res. 1999;8(2):135–160. | ||
Motulsky H. Intuitive Biostatistics: A Nonmathematical Guide to Statistical Thinking. 3rd ed. Oxford: Oxford University Press; 2014. | ||
American Diabetes Association. Standards of medical care in Diabetes–2017. Diabetes Care. 2017;40(Supplement 1):S11–S24. | ||
Krouwer JS. Why Bland-Altman plots should use X, not (Y+X)/2 when X is a reference method. Stat Med. 2008;27(5):778–780. | ||
Giavarina D. Understanding Bland Altman analysis. Biochem Med (Zagreb). 2015;25(2):141–151. | ||
Ayache S, Panelli M, Marincola FM, Stroncek DF. Effects of storage time and exogenous protease inhibitors on plasma protein levels. Am J Clin Pathol. 2006;126(2):174–184. | ||
Abdul-Ghani MA, Jenkinson CP, Richardson DK, Tripathy D, DeFronzo RA. Insulin secretion and action in subjects with impaired fasting glucose and impaired glucose tolerance: results from the Veterans Administration Genetic Epidemiology Study. Diabetes. 2006;55(5):1430–1435. | ||
Faerch K, Vaag A, Holst JJ, Hansen T, Jørgensen T, Borch-Johnsen K. Natural history of insulin sensitivity and insulin secretion in the progression from normal glucose tolerance to impaired fasting glycemia and impaired glucose tolerance: the Inter99 study. Diabetes Care. 2009;32(3):439–444. | ||
Cistola DP, Dwivedi AK, Ard JD. Metabolic syndrome and prediabetes fail to detect a high prevalence of early insulin Resistance –The PREMIER study. Diabetes. 2018;67(Supplement 1):1534. | ||
Engström G, Hedblad B, Eriksson KF, Janzon L, Lindgärde F. Complement C3 is a risk factor for the development of diabetes: a population-based cohort study. Diabetes. 2005;54(2):570–575. | ||
Wlazlo N, van Greevenbroek MM, Ferreira I, et al. Complement factor 3 is associated with insulin resistance and with incident type 2 diabetes over a 7-year follow-up period: the CODAM Study. Diabetes Care. 2014;37(7):1900–1909. | ||
Festa A, D’Agostino R Jr, Tracy RP, Haffner SM; Insulin Resistance Atherosclerosis Study. Elevated levels of acute-phase proteins and plasminogen activator inhibitor-1 predict the development of type 2 diabetes: the insulin resistance atherosclerosis study. Diabetes. 2002;51(4):1131–1137. | ||
Kannel WB, Wolf PA, Castelli WP, D’Agostino RB. Fibrinogen and risk of cardiovascular disease. The Framingham Study. JAMA. 1987;258(9):1183–1186. | ||
US Centers for Disease Control and Prevention [homepage on the Internet]. Healthy weight. Available from: https://www.cdc.gov/healthyweight/assessing/bmi/adult_bmi/index.html. Accessed April 17, 2018. | ||
McAuley KA, Williams SM, Mann JI, et al. Diagnosing insulin resistance in the general population. Diabetes Care. 2001;24(3):460–464. | ||
Matthews DR, Hosker JP, Rudenski AS, Naylor BA, Treacher DF, Turner RC. Homeostasis model assessment: insulin resistance and beta-cell function from fasting plasma glucose and insulin concentrations in man. Diabetologia. 1985;28(7):412–419. | ||
Duncan MH, Singh BM, Wise PH, Carter G, Alaghband-Zadeh J. A simple measure of insulin resistance. Lancet. 1995;346(8967):120–121. | ||
Katz A, Nambi SS, Mather K, et al. Quantitative insulin sensitivity check index: a simple, accurate method for assessing insulin sensitivity in humans. J Clin Endocrinol Metab. 2000;85(7):2402–2410. | ||
Legro RS, Finegood D, Dunaif A. A fasting glucose to insulin ratio is a useful measure of insulin sensitivity in women with polycystic ovary syndrome. J Clin Endocrinol Metab. 1998;83(8):2694–2698. | ||
Chung BH, Segrest JP, Ray MJ, et al. Single vertical spin density gradient ultracentrifugation. Methods Enzymol. 1986;128:181–209. |
 © 2018 The Author(s). This work is published and licensed by Dove Medical Press Limited. The full terms of this license are available at https://www.dovepress.com/terms.php and incorporate the Creative Commons Attribution - Non Commercial (unported, v3.0) License.
By accessing the work you hereby accept the Terms. Non-commercial uses of the work are permitted without any further permission from Dove Medical Press Limited, provided the work is properly attributed. For permission for commercial use of this work, please see paragraphs 4.2 and 5 of our Terms.
© 2018 The Author(s). This work is published and licensed by Dove Medical Press Limited. The full terms of this license are available at https://www.dovepress.com/terms.php and incorporate the Creative Commons Attribution - Non Commercial (unported, v3.0) License.
By accessing the work you hereby accept the Terms. Non-commercial uses of the work are permitted without any further permission from Dove Medical Press Limited, provided the work is properly attributed. For permission for commercial use of this work, please see paragraphs 4.2 and 5 of our Terms.