")
Back to Journals » Cancer Management and Research » Volume 12
Dynamic Changes in the Neutrophil-to-Lymphocyte Ratio Predict the Prognosis of Patients with Hepatocellular Carcinoma Undergoing Transarterial Chemoembolization
Authors Wang H, Lin C, Fan W, Zhang J, Zhang Y, Yao W, Li J
Received 18 January 2020
Accepted for publication 21 April 2020
Published 14 May 2020 Volume 2020:12 Pages 3433—3444
DOI https://doi.org/10.2147/CMAR.S245396
Checked for plagiarism Yes
Review by Single anonymous peer review
Peer reviewer comments 3
Editor who approved publication: Professor Seema Singh
Hongyu Wang,1,* Chuyang Lin,2,* Wenzhe Fan,1 Jiang Zhang,3 Yingqiang Zhang,4 Wang Yao,1 Jiaping Li1
1Department of Interventional Oncology, The First Affiliated Hospital of Sun Yat-sen University, Guangzhou 510080, People’s Republic of China; 2Department of Cancer Prevention Center, Sun Yat-sen University Cancer Center, Guangzhou 510080, People’s Republic of China; 3Department of Clinical Laboratory, The First Affiliated Hospital of Sun Yat-sen University, Guangzhou 510080, People’s Republic of China; 4Department of Interventional Radiology, The Seventh Affiliated Hospital of Sun Yat-sen University, Shenzhen 518107, People’s Republic of China
*These authors contributed equally to this work
Correspondence: Jiaping Li
Department of Interventional Oncology, The First Affiliated Hospital of Sun Yat-sen University, No. 58 Zhongshan 2 Road, Guangzhou 510080, People’s Republic of China
Tel +86-20-13352890908
Fax +86-20-87755766
Email [email protected]
Purpose: To examine the effect of dynamic changes in neutrophil-to-lymphocyte ratio (NLR) on tumor response and overall survival (OS) in patients with hepatocellular carcinoma (HCC) undergoing transarterial chemoembolization (TACE).
Patients and Methods: Data from 181 patients with HCC were retrospectively collected. White blood cell, neutrophil and lymphocyte counts, and the NLR were obtained 1– 3 days before as well as 3– 6 weeks and 3 months after TACE. Patients were divided into two groups at each time point according to the mean value of NLR, and also divided into continuous decrease, fluctuating increase-decrease (I-D), fluctuating decrease-increase (D-I), and continuous increase groups according to the dynamic changes in the NLR. The dynamic changes in blood counts and NLR were analyzed using repeated-measures ANOVA. The odds ratios (ORs) for tumor response in different NLR groups were examined using a multivariate logistic regression model. Finally, the prognostic value of the dynamic changes in the NLR was examined using Cox regression models.
Results: Continuous decline of white blood cell counts, neutrophil counts and lymphocyte counts were observed at 3– 6 weeks and 3 months after TACE treatment. The NLR increased slightly and then decreased substantially in responders, while it increased slightly and then significantly in non-responders, with a significant interaction effect of Time × Tumor response (P = 0.005). NLR grouping before TACE, 3– 6 weeks and 3 months after TACE was not associated with tumor response, and only 3 months after TACE did, it shows a significant difference in univariate survival analyses (NLR > 2.5 vs NLR ≤ 2.5, hazard ratio [HR] = 2.442, 95% confidence interval (CI): 1.545, 3.860). The changes in the NLR were significantly correlated with tumor response and OS. Non-responders for TACE were more common in the continuous NLR increase group (OR = 6.230, 95% CI: 1.848– 21.001) and in the fluctuating D-I group (OR = 5.702, 95% CI: 1.480– 21.957). Multivariate analyses revealed that these two patient groups also showed poorer OS (HR = 2.351, 95% CI: 1.120– 4.605 and HR = 2.320, 95% CI: 1.187– 4.533, respectively).
Conclusion: Dynamic changes in the NLR may be better predictors of tumor response and OS than static NLR values, but more data are needed.
Keywords: hepatocellular carcinoma, prognosis, neutrophil-to-lymphocyte ratio, transarterial chemoembolization
Introduction
Hepatocellular carcinoma (HCC) is the sixth most common cancer worldwide and the fourth leading cause of cancer-related death in China.1,2 In most cases, tumor size/location and liver dysfunction prevent HCC resection. Transarterial chemoembolization (TACE) has been recommended as the first-line treatment option for Barcelona Clinic Liver Cancer (BCLC) B stage HCC and can even benefit BCLC-C stage HCC patients as long as they have a good liver function.3 Prognostic factors such as baseline tumor size, tumor number, liver function, and tumor response have been found to affect survival after TACE.4,5 However, the accuracy of these prognostic factors is not satisfactory, and it is believed that systemic inflammatory markers may be used to predict prognosis.
Recently, several studies have demonstrated a correlation between the elevated neutrophil-to-lymphocyte ratio (NLR) and poor prognosis in patients with HCC undergoing TACE, radiofrequency ablation (RFA), curative resection, liver transplantation, and chemotherapy with sorafenib.6–10 A predictive model based on the NLR was established for patients with HCC undergoing TACE and was found to have excellent prognostic performance.11 In a previous study that analyzed the tumor microenvironment in liver explants bearing HCC, high NLR was proposed to be linked to the upregulation of inflammatory pathways, which may promote the development of more aggressive tumors.12 Systemic inflammatory responses are thought to contribute to tumor progression via angiogenesis induction, DNA damage repair, promotion of tumor proliferation and metastasis, as well as apoptosis inhibition.13,14 One proposed mechanism suggests that an elevated NLR indicates an increased number of circulating neutrophils, which secrete vascular endothelial growth factor – a promoter of tumor growth, angiogenesis, and tumor cell migration – as the first line of defense during infection and inflammation, thus a high NLR increases the risk of metastasis in many solid tumors.15,16 Conversely, a decreased NLR indicates an elevation of circulating lymphocytes – especially CD8+ T cells – which play a major role in cell-mediated immunity and can inhibit every step of cancer metastasis.17
Although several studies have suggested that the baseline NLR is a potential prognostic factor for HCC, its value as a prognostic factor could not be established in multivariate analyses,18,19 but may be valuable in combination with other inflammatory biomarkers.20 While studies have shown that changes in the NLR are an important prognostic factor in patients with other types of tumors,21–24 the dynamic changes in the NLR in patients with HCC after TACE and the prognostic value of these changes remain unclear. In this study, we attempted to describe the pattern of NLR changes in patients with HCC after TACE and to analyze the effect of the NLR and dynamic changes in its value on tumor response and overall survival (OS).
Patients and Methods
Study Design and Patient Selection
We reviewed the electronic medical records of patients with HCC who had undergone TACE between January 2014 and August 2018 at our hospital. The blood cell counts were recorded at three time points when the patient did not receive another treatment except for TACE: 1–3 days before TACE, as well as 3–6 weeks and 3 months after TACE. For those patients who received secondary treatment within 3 months, the third blood count was the outcome before or at least 2 weeks after treatment, when the mean interval of the third blood test was 3 months after TACE. Patients were stratified into groups according to their NLR and changes in the NLR. The effects of the NLR and dynamic changes in the NLR on tumor response and OS were analyzed. This study was approved by the Ethical Committee of the first Affiliated Hospital of Sun Yat-sen University. All procedures performed in studies involving human participants were in accordance with the Declaration of Helsinki 1964. Due to the retrospective nature of the study, informed consent was not required. Patient data were reviewed and analyzed in accordance with confidentiality requirements.
HCC was diagnosed on the basis of the pathological findings or imaging criteria according to the European Association for the Study of the Liver (EASL) guidelines. All patients with HCC included were categorized as BCLC stage A, B and C in this study. The criteria for patient inclusion were as follows: 1) treatment with TACE as the initial therapy, and as a monotherapy within 3 months; 2) Child-Pugh A or B liver function; and 3) availability of blood counts at the three established time points. Patients were excluded from the study if they (a) had incomplete baseline data or were lost to follow-up within 3 months, (b) underwent hepatectomy or liver transplantation, (c) had coexistent hematologic disorders, bleeding events, other acute illnesses, or known active infection at the time of blood sampling, or (d) had other types of tumor.
TACE and Follow-Up
Uniform TACE was performed by two senior interventional radiologists, with a selective or supra-selective injection of a mixture of 20–60 mg doxorubicin in 5–20 mL lipiodol, followed by embolization with a 300–500-µm gelatin sponge or with polyvinyl alcohol particles. All patients were followed up 3–6 weeks after the first TACE, and every 1–3 months after that for those who did not achieve a complete response.
Follow-up assessments included complete blood cell count, liver function test, measurement of α-fetoprotein levels, and abdominal contrast-enhanced computed tomography (CT) or magnetic resonance imaging (MRI). Tumor response was evaluated according to the modified Response Evaluation Criteria in Solid Tumors (mRECIST). Subsequent treatments, such as TACE, ablation, and systemic treatment, were performed according to a consensus decision made by a multi-disciplinary team.
Data Collection and NLR Groups
Clinical and radiological parameters, including age; sex; white blood cell, neutrophil, and lymphocyte counts; NLR; albumin and total bilirubin levels; albumin-bilirubin (ALBI) grade; the presence of liver cirrhosis, splenomegaly or esophageal and gastric varices; BCLC stage; tumor size and number; and vascular invasion, were extracted from the patients’ medical records. The patients were stratified into two groups on the basis of their tumor response 3 months after TACE: “responders”, which refers to those with a complete or partial response, and “non-responders” that refers to those with stable and progressive disease. The NLR was defined as the ratio of the absolute counts of neutrophils to lymphocytes. ALBI grade was used as a model for objective assessment of liver function; it was defined as a logarithmic ratio of albumin to bilirubin levels.25 Liver cirrhosis, splenomegaly, and esophageal and gastric varices were defined based on the presence of radiologic findings.
The mean of the NLR for all time points was 2.5. On the basis of this value, patients were divided into high and low NLR groups (>2.5 vs ≤2.5) at each time point. Subsequently, they were divided into four groups according to the dynamic changes in the NLR across time points as follows: continuous decrease group (n=43), the three blood tests showed a continuous decrease in the NLR; fluctuating I-D group (n=48), the NLR increased between the first and second time points and decreased between the second and third time points; fluctuating D-I group (n=54), the NLR decreased between the first and second time points and increased between the second and third time points; and continuous increase group (n=36), there was a continuous increase in the NLR across the three tests (Figure 1). Additionally, patients were divided into two groups according to their mean neutrophil and lymphocyte counts at each blood test.
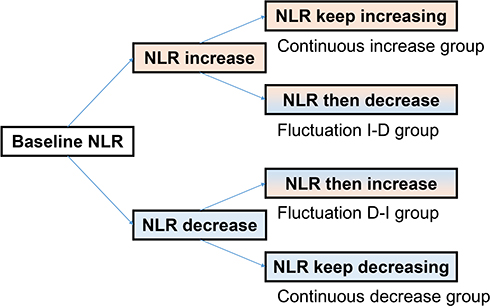 |
Figure 1 Schematic diagram of dynamic changes in neutrophil-to-lymphocyte ratio (NLR). Notes: The dynamic changes in NLR across three time points were divided into four groups, as follows: continuous decrease group, the three blood tests showed a continuous decrease in the NLR; fluctuating I-D group, the NLR increased between the first and second time points and decreased between the second and third time points; fluctuating D-I group, the NLR decreased between the first and second time points and increased between the second and third time points; and continuous increase group, there was a continuous increase in the NLR across the three tests. Changes in NLR were defined as any degree of increase or decrease in the NLR. |
Statistical Analysis
Continuous variables are presented as means ± standard deviations or median with range. Categorical variables are presented as numbers and percentages. Differences between groups were analyzed using independent samples t-tests for continuous variables and Chi-squared tests for categorical variables. Dynamic changes in blood cells and the NLR were compared based on tumor response using repeated-measures ANOVA. We used multivariate unconditional logistic regression to estimate the odds ratios (OR) and 95% confidence intervals (CI) for tumor response.
OS was calculated from initial TACE treatment to death or to the last follow-up. Univariate and multivariate analyses were performed to assess the significance of the differences in the clinical or radiological data. Those variables with P < 0.1 in univariate analyses for OS were included in the multivariate analyses. The multivariate Cox proportional hazards model was used to estimate adjusted hazard ratios (HR) and 95% CIs as well as to detect independent prognostic factors with stepwise variable selection. Survival curves were plotted using the Kaplan–Meier procedure with the Log-rank test to compare survival among groups.
All analyses were performed using SPSS version 25 (IBM Corporation), and two-sided P-values <0.05 were considered statistically significant.
Results
Patient Characteristics
Between January 2014 and August 2018, 181 consecutive HCC patients were enrolled in this study. All preoperative clinical data and blood cell counts at three time points were available. The baseline characteristics of these patients and their distribution according to the NLR at each time point are shown in Table 1. In total, there were 164 men (90.6%) and 17 women (9.4%), with a median age of 53.0 years (range, 27.0–79.0). Thirty-eight patients had previously received TACE treatment at another hospital. There were 40 (22.1%), 94 (51.9%), and 47 (26.0%) patients with ALBI grades 1, 2, and 3, respectively. In terms of BCLC stage, stage B tumors (46.4%) were found most frequently, followed by stage C and A tumors (40.9% and 12.7%, respectively). The patients were divided into two groups according to the baseline NLR (>2.5 vs ≤2.5), with 60 and 121 individuals, respectively. ALBI grades were higher (P = 0.007) and tumor size was larger (P = 0.005) in patients in the >2.5 NLR group as compared to those in the ≤2.5 NLR group.
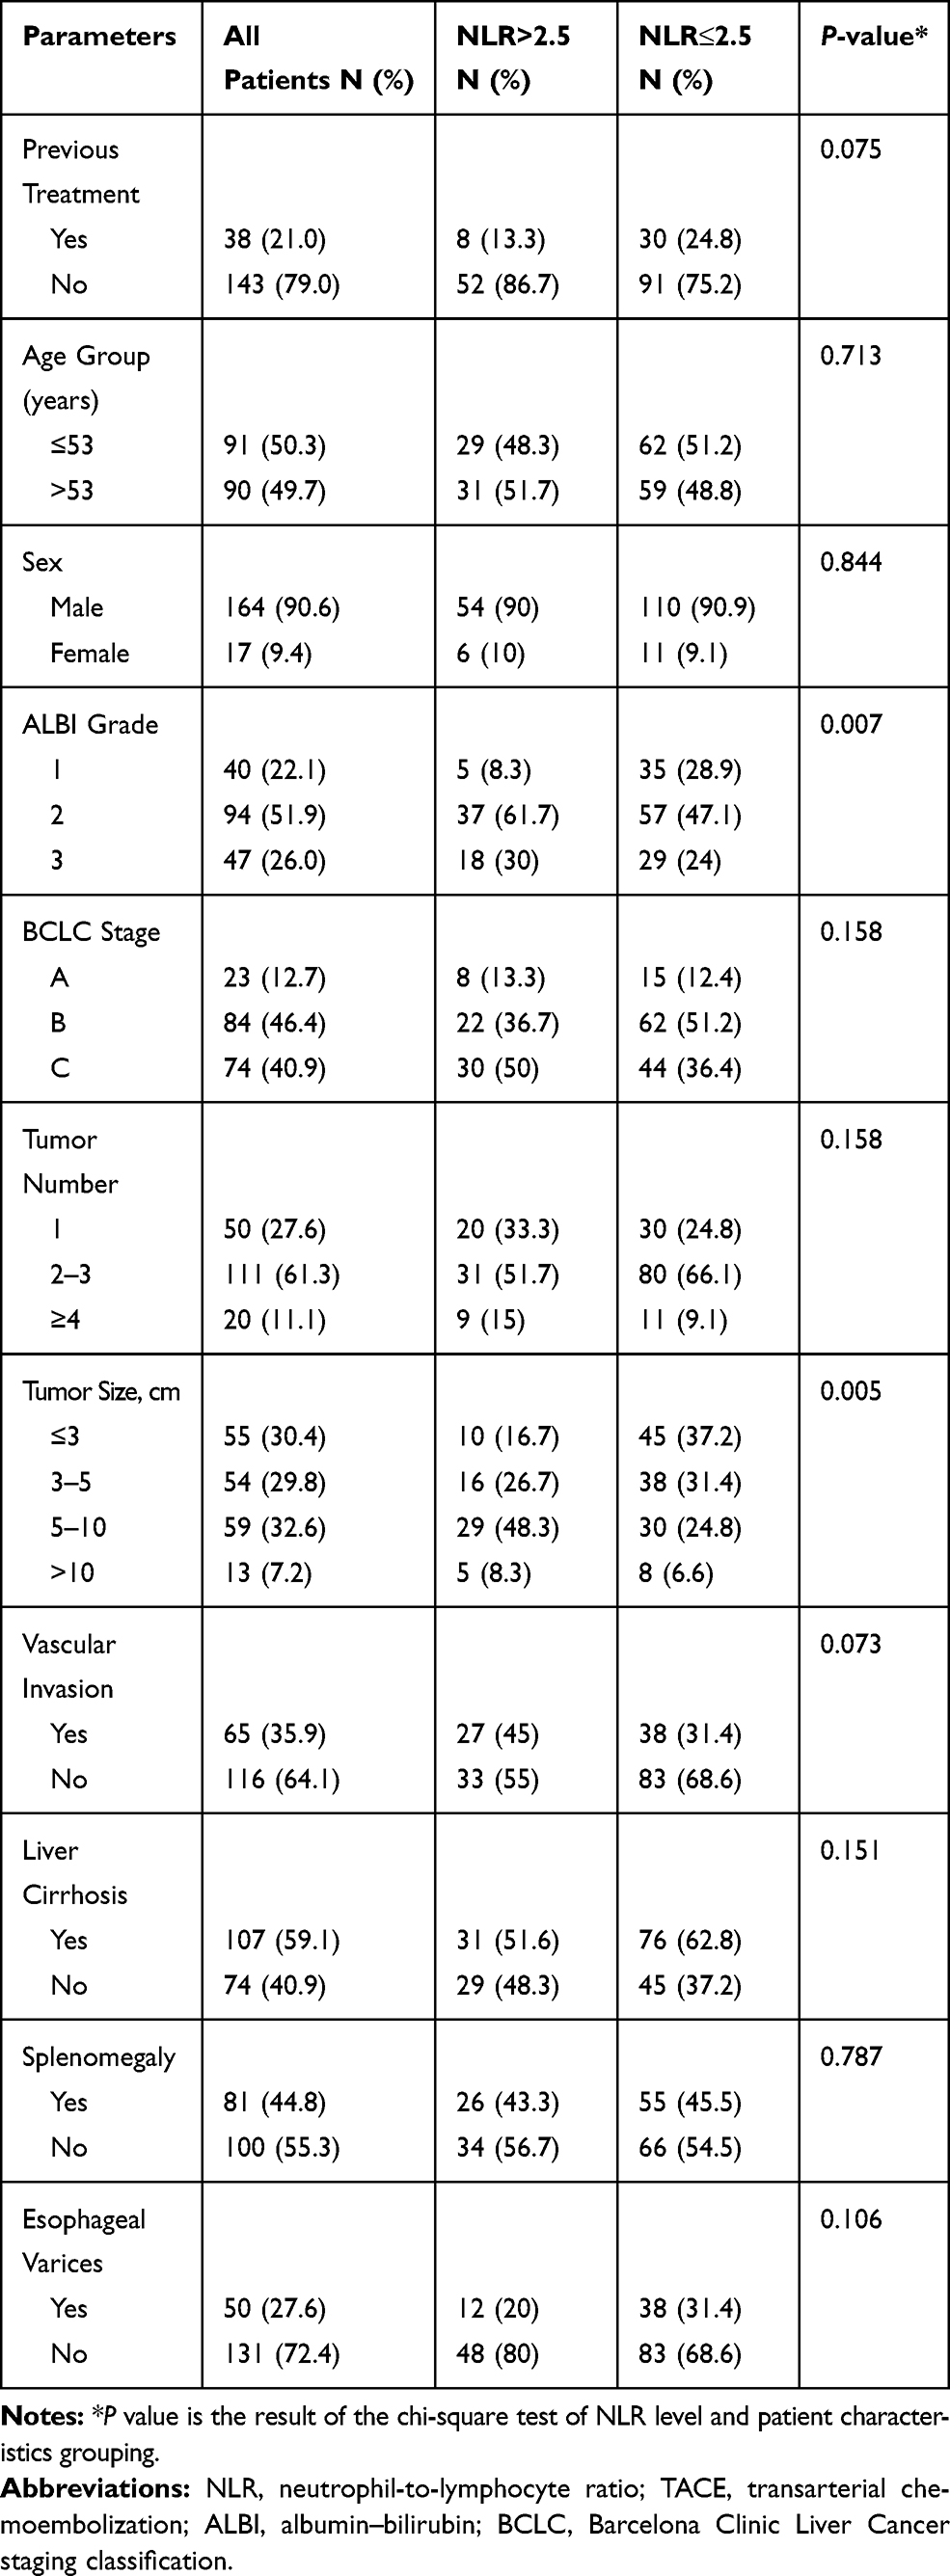 |
Table 1 Patient Characteristics and NLR Groups Before Initial TACE Treatment |
Patients received at least one enhanced CT or MRI examination within 3 months after the initial TACE, and 146 and 52 patients received two or three secondary TACE treatments, respectively. There were 96 tumor responders and 85 tumor non-responders 3 months after TACE.
Dynamic Change in Blood Cell Counts and the NLR
The dynamic changes of blood cell counts and the NLR in responders and non-responders were compared using repeated-measures ANOVA (Table 2 and Figure 2). The counts of white blood cells, neutrophils and lymphocytes decreased gradually from 3–6 weeks to 3 months after TACE (within-subject effect of time, all P values <0.001); however, there was no significant difference in the three blood counts between responders and non-responders (between-subject effect of tumor response, P = 0.682, 0.274, and 0.058, respectively). However, an interaction effect of time and tumor response was observed for the dynamic change in lymphocyte counts (P = 0.015). Additional simple effect analysis showed that lymphocyte counts remained stable in responders before and after TACE treatment (P12 = 0.564 [pre-TACE vs 3–6 weeks post TACE], P13 = 0.710 [pre-TACE vs 3 months post TACE], P23 = 0.999 [3–6 weeks vs 3 months post TACE], respectively), while declining continually in non-responders (P12 = 0.252, P13 < 0.001, P23 = 0.005, respectively) (Supplementary Table 1).
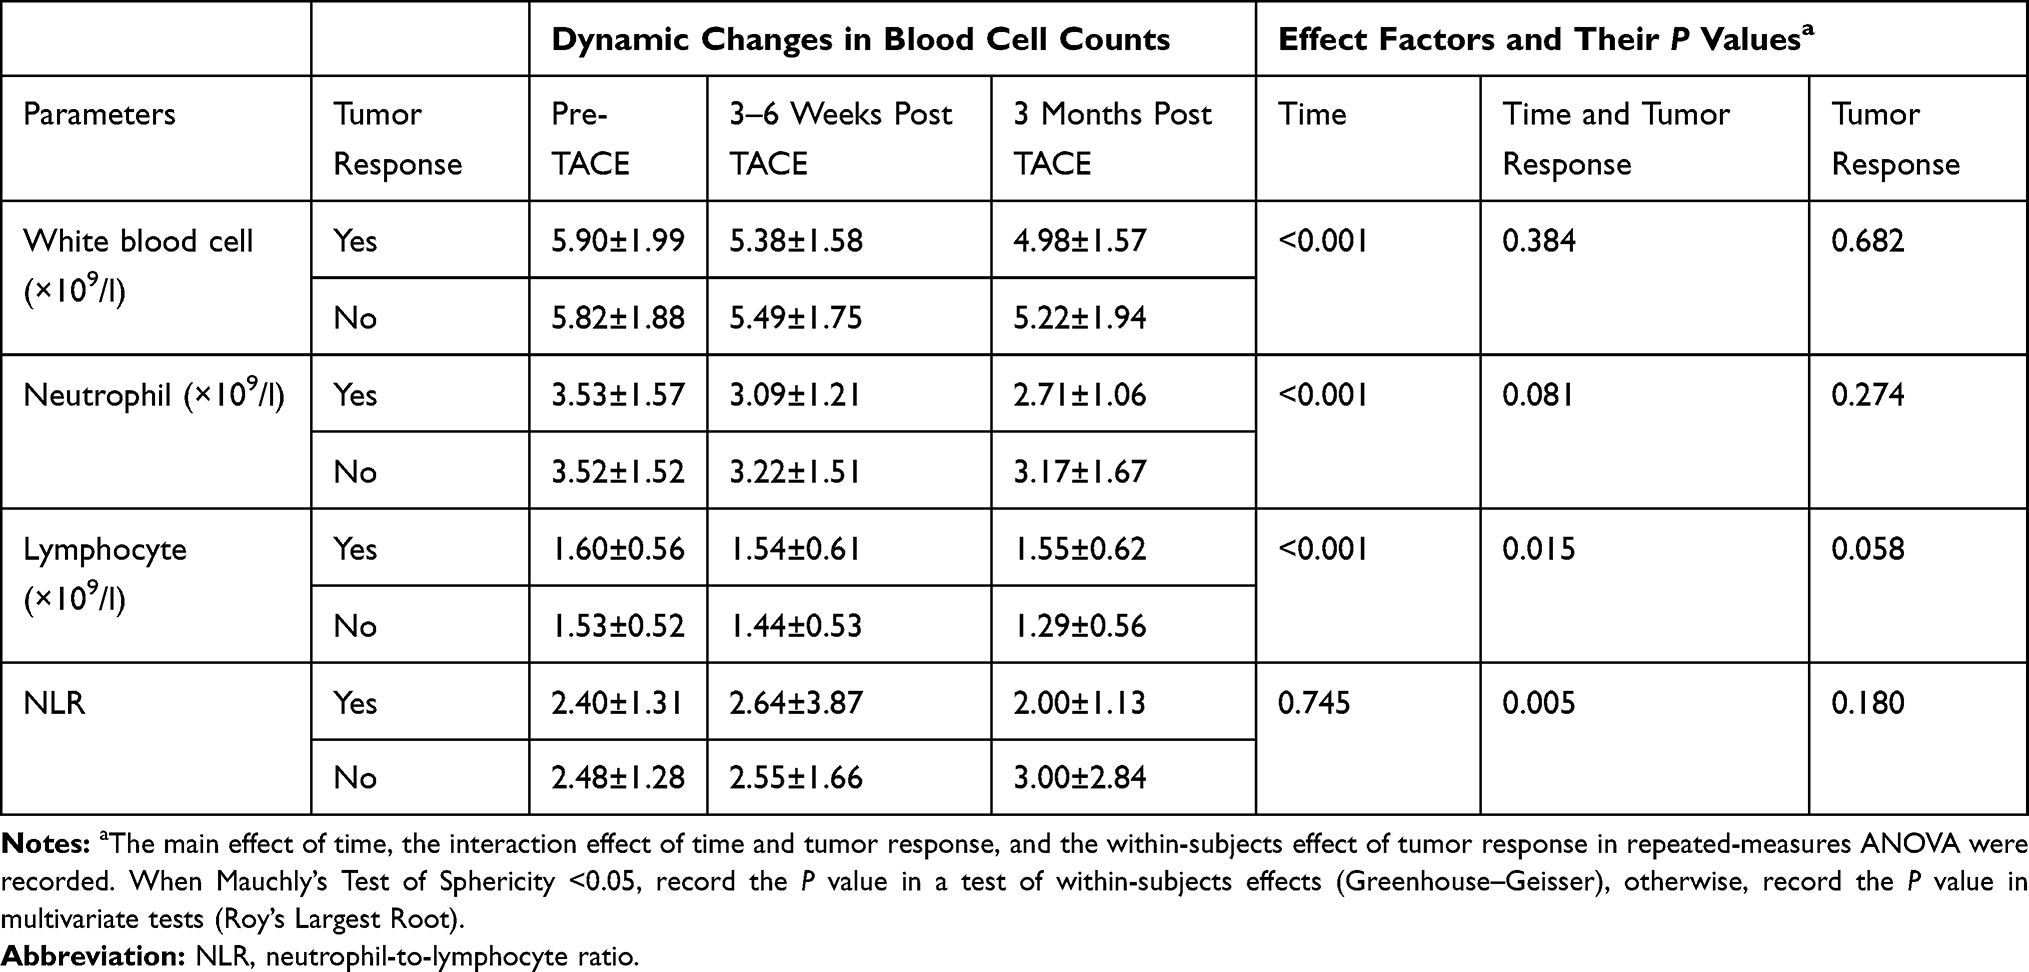 |
Table 2 Dynamic Changes in Blood Cell Counts and NLR Using Repeated-Measures ANOVA |
 |
Figure 2 Dynamic changes in blood cell counts and neutrophil-to-lymphocyte ratio between responders and non-responders. Notes: Continuous decline of white blood cells counts (A), neutrophils counts (B) and lymphocytes counts (C) were observed at 3–6 weeks and 3 months after TACE treatment. Neutrophil-to-lymphocyte ratio (D) increased slightly and then decreased substantially in responders, while it increased slightly and then continued to increase significantly in non-responders. |
The dynamic change of the NLR was not affected by the within- and between-subject main effect of time and tumor response (P = 0.745, 0.180, respectively); however, it was affected by the interaction between time and tumor response (P = 0.005). The NLR in responders tended to increase slightly and then decrease (simple effect of time, P12= 0.800, P13 = 0.165, P23 = 0.123, respectively), whereas the NLR in non-responders increased at later stages of recovery (simple effect of time, P12= 0.995, P13= 0.048, P23= 0.412, respectively) (Figure 2 and Supplementary Table 1). Although there were no significant between-subject effects of tumor response, the simple effect analysis showed statistically significant differences in neutrophil and lymphocyte counts and the NLR between responders and non-responders 3 months after TACE (P = 0.028, 0.004 and 0.002, respectively) (Supplementary Table 2).
Associations of NLR Groups with Tumor Response
Although there was a statistically significant difference between the NLR of responders and non-responders 3 months after TACE, we found no significant association at any time point between NLR (>2.5 vs ≤2.5) and tumor response after adjusting for previous treatment, age, sex, ALBI grade, BCLC stage, tumor number, tumor size, vascular invasion, liver cirrhosis, splenomegaly and esophageal veins: 1–3 days before TACE (OR = 1.278, 95% CI: 0.417–3.272), 3–6 weeks after TACE (OR = 1.110, 95% CI: 0.362–3.406), and 3 months after TACE (OR = 0.828, 95% CI: 0.297–2.308). However, higher ORs were observed in the fluctuating D-I (OR = 5.702, 95% CI: 1.480–21.957) and continuous increase groups (OR = 6.230, 95% CI: 1.848–21.001), indicating that changes in the NLR may be a potential prognostic factor (Table 3).
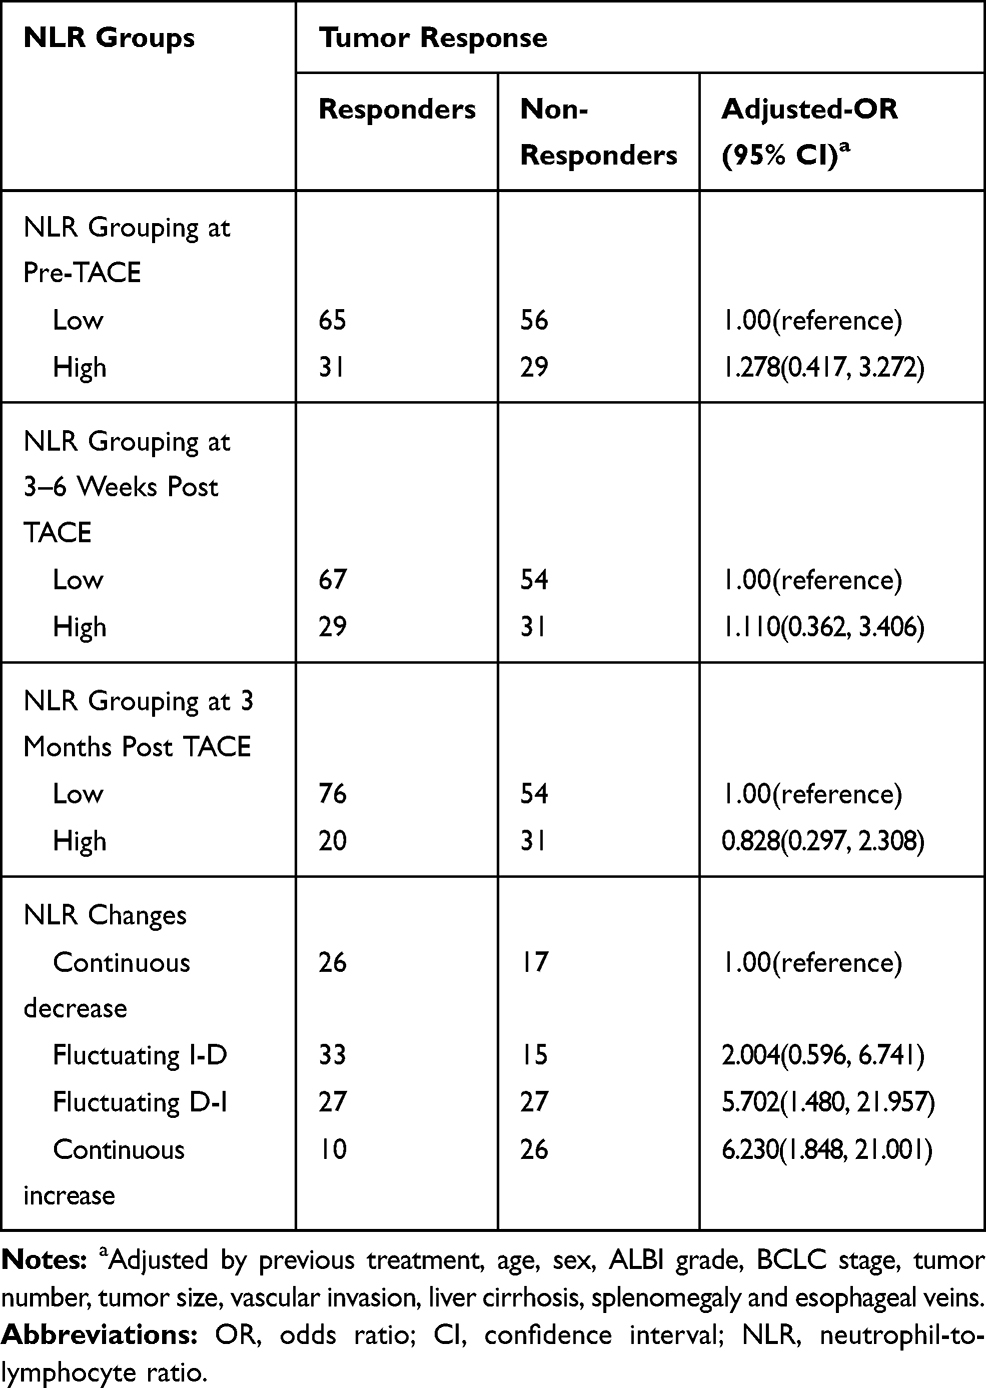 |
Table 3 Correlation Between Different Subgroups of NLR and Tumor Response Using Multivariate Logistic Regression Model |
Associations of NLR Groups with Overall Survival
The median follow-up time was 26.8 months (range: 3.8–65.3 months); however, the follow-up data for 23 patients (12.7%) were missing. During this period, there were 84 patient deaths (any cause; 46.4%). The median OS time was 24.9 months (95% CI: 18.4–31.3). Univariate analyses showed that the BCLC stage, tumor number, tumor size, vascular invasion, splenomegaly, presence of esophageal varices, and NLR grouping 3 months after TACE were significantly associated with OS (all P-values <0.05) (Table 4). The P values of the NLR 1–3 days before TACE, 3–6 weeks, as well as 3 months after TACE were, respectively, 0.792 (HR=1.063, 95% CI: 0.673–1.682), 0.103 (HR=1.452, 95% CI: 0.925–2.279), <0.001 (HR=2.442, 95% CI: 1.545–3.860), indicating that only 3 months after surgery the NLR was a good predictor of OS (Figure 3). There was no statistically significant difference in the NLR changes in the univariate analyses (P = 0.082) (Figure 4A).
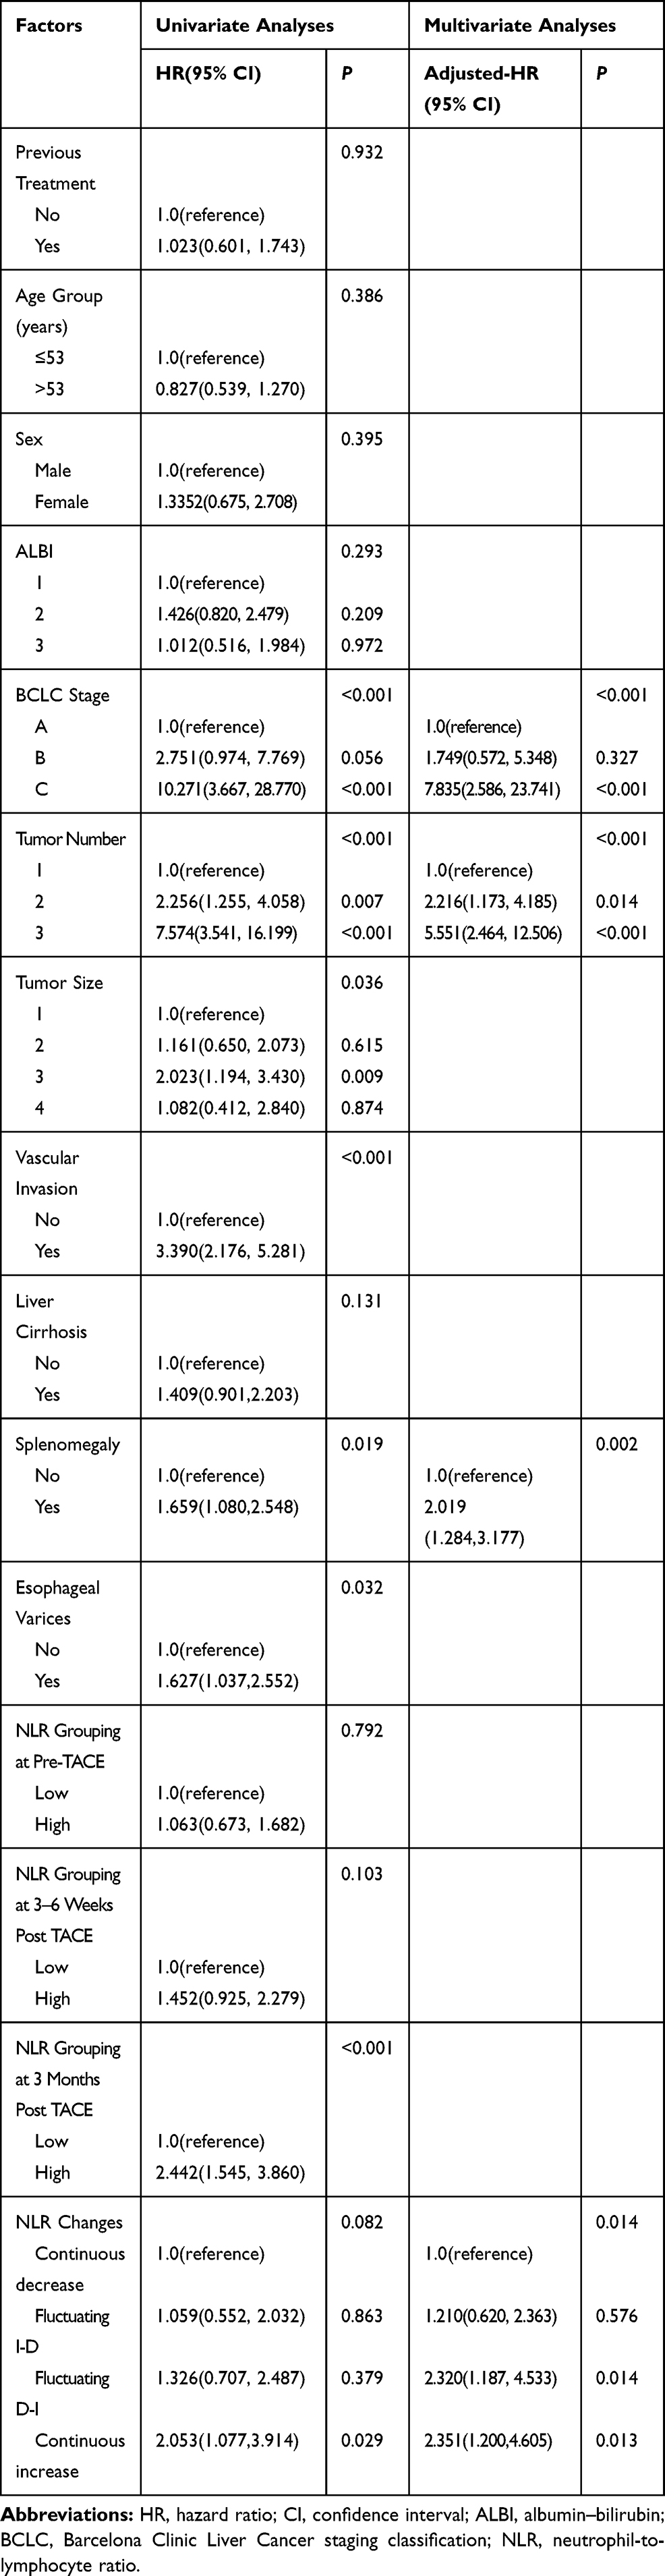 |
Table 4 Factors Associated with Overall Survival After TACE Treatment for HCC According to Univariate and Multivariate Analyses |
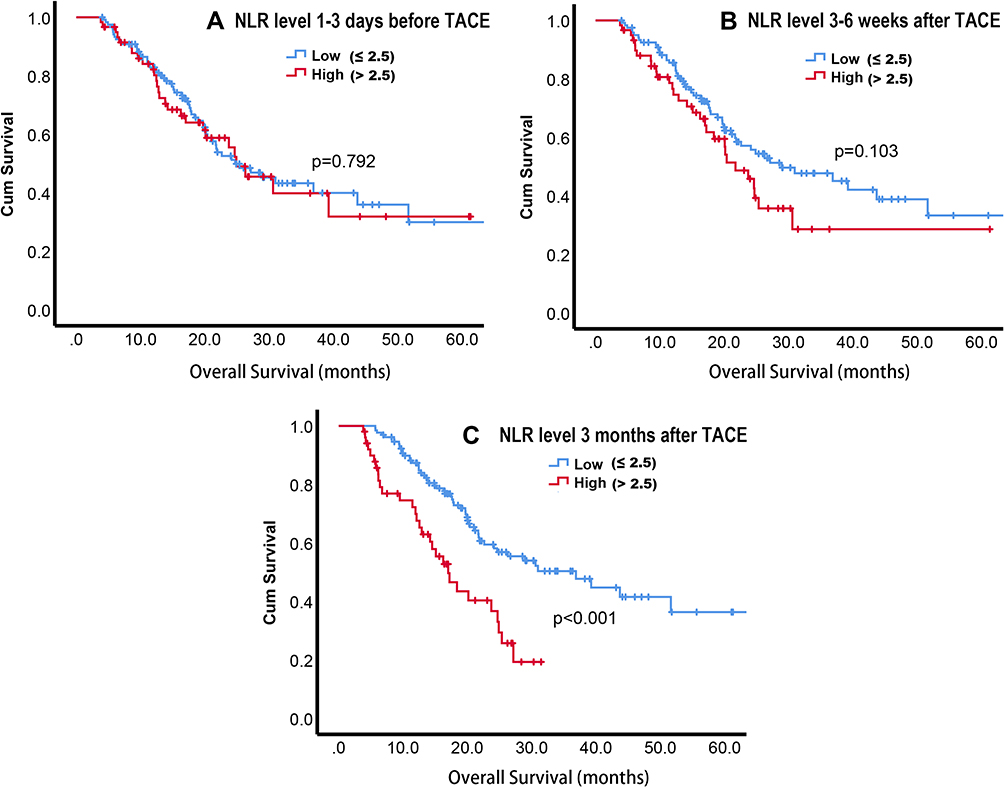 |
Figure 3 Kaplan–Meier curves of neutrophil-to-lymphocyte ratio (NLR) grouping at each time point. Notes: Patients were divided into high and low NLR groups (>2.5 vs ≤2.5) at each time point, as follows: 1–3 days before TACE (A), 3–6 weeks after TACE (B), and 3 months after TACE (C), and only the third NLR grouping was associated with overall survival (Log-rank test, P< 0.001). |
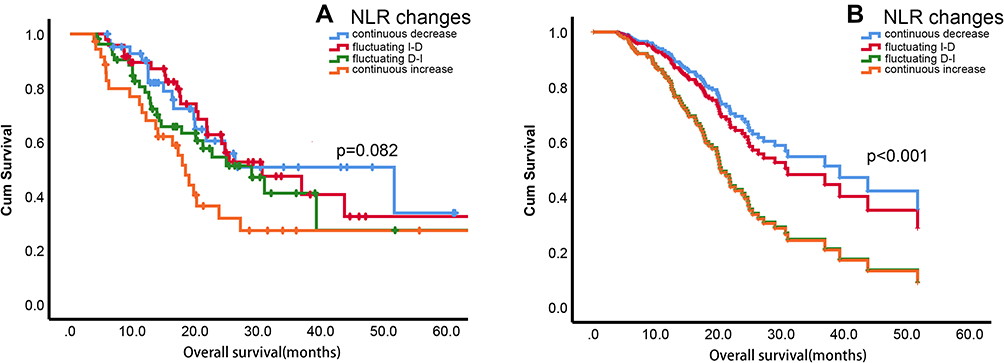 |
Figure 4 Kaplan–Meier curves and multivariate analyses curves of the dynamic changes in neutrophil-to-lymphocyte ratio (NLR). Notes: Univariate Cox regression (A) showed insignificance in the change of NLR (P=0.082); however, multivariate analyses (B) showed that NLR change was associated with overall survival (P< 0.001). |
The variables with P < 0.1 in the univariate analyses for OS were included in the multivariate analyses, which revealed that BCLC stage (P < 0.001), tumor number (P < 0.001), splenomegaly (P = 0.002), and NLR changes (P = 0.014) were significant predictors of OS after TACE in patients with HCC (Table 4). Patients in the fluctuating D-I (adjusted HR = 2.32, 95% CI: 1.19–4.53, P = 0.014) and continuous increase groups (adjusted HR = 2.35, 95% CI: 1.20–4.61, P = 0.013) showed poorer OS (Figure 4B). The median OS was 51.60 months (95% CI: 14.84–88.361) in the continuous decrease group, 30.57 months (95% CI: 16.61–44.54) in the fluctuating I-D group, 28.91 months (95% CI: 19.31–38.50) in the fluctuating D-I group, and 18.38 months (95% CI: 15.62–21.14) in the continuous increase group.
Further Prognostic Analysis of Neutrophil and Lymphocyte Counts
We found that the lymphocyte counts of the responders remained relatively stable, while the neutrophil count gradually decreased, and the trend of the two types of cells in the non-responders was reversed, as shown in Figure 2. Additionally, in the univariate analyses, only NLR grouping 3 months after TACE was a prognostic factor for OS, as shown in Figure 3. Furthermore, Chi-squared tests of the neutrophil and lymphocyte levels showed that the count (high vs low) was associated with tumor response, but only 3 months after TACE (Supplementary Table 3). This finding prompted us to analyze the effects of neutrophil and lymphocyte levels on survival. Patients were divided into two groups (high vs low) according to the mean value of the neutrophil and lymphocyte count at each time. The Kaplan–Meier curves showed that only the lymphocyte grouping at 3 months after TACE was associated with OS (Log-rank test, P < 0.001). The median OS in the low lymphocyte group was 19.7 months (95% CI: 16.8–22.5). The median OS in the high lymphocyte group could not be computed since 67.8% of the patients were still alive at the last follow-up (Figure 5).
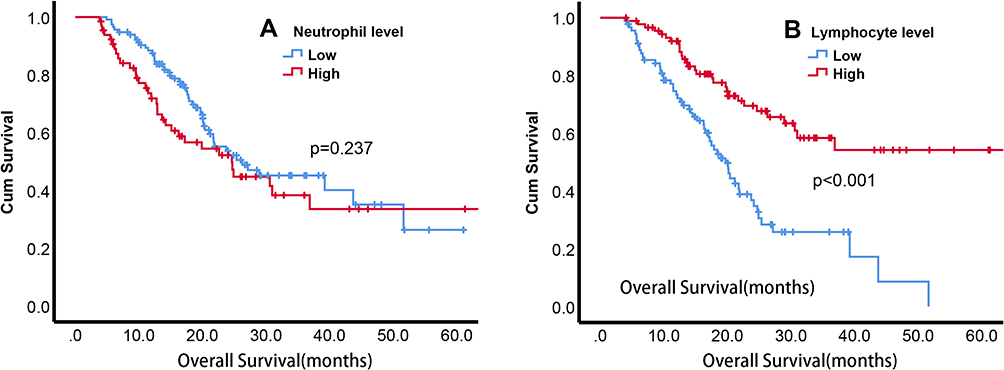 |
Figure 5 Kaplan–Meier curves of neutrophil and lymphocyte groupings 3 months after TACE. Notes: Patients were divided into two groups (high vs low) according to the mean value of neutrophil (A) and lymphocyte (B) at 3 months after TACE. The Kaplan–Meier curves showed that only the lymphocyte grouping was associated with OS (Log-rank test, P<0.001). |
Discussion
In this study, we focused on analyzing changes in blood cell counts and the NLR before and after TACE treatment for HCC. The white blood cell, neutrophil, and lymphocyte counts continually decreased across the three time points during the observation period. The interaction effect between time and tumor response significantly affected the change in lymphocyte levels and the NLR. Moreover, our results suggest that dynamic changes in the NLR, rather than the static NLR, can effectively predict tumor response and OS. Further prognostic analyses of neutrophils and lymphocytes revealed that a high lymphocyte count 3 months after TACE treatment was associated with improved survival.
Many studies have demonstrated that an elevated NLR predicts tumor progression or poor survival in various malignancies, including HCC after TACE.6,26 However, our study demonstrates that the static NLR has a lower prognostic performance in terms of detecting tumor response and OS. It suggests that there may be limitations to predicting tumor prognosis using the static NLR because the inflammatory status of patients is a dynamic process. Therefore, a sustained increase in the NLR, rather than a high NLR, can predict a poor tumor prognosis. Ni et al18 reported that the NLR was a valuable prognostic indicator for HCC patients who had undergone curative resection, but the significance of the NLR disappeared on multivariate analyses. Dan et al19 reported that the postoperative NLR change, but not the preoperative NLR, was an independent prognostic factor for small-HCC patients undergoing RFA. Another study conducted by Pang et al27 demonstrated that dynamic changes in various inflammation scores, including the NLR, were independent prognostic factors of OS in patients with HCC who had undergone liver resection. Together, these studies suggest that the prognostic value of changes in the NLR is superior to that of the static NLR. Interestingly, the repeated-measures ANOVA showed that the blood counts and the NLR of responders and non-responders did not differ until 3 months after TACE. Considering the inflammatory changes caused by TACE, 3–6 weeks after TACE may not be long enough to restore a new balance. A study suggested that the post-NLR and its changes with a relatively long-term interval after HCC resection have better prognostic values.28
The uncertainty in the prognostic value of the baseline NLR may be caused by multiple factors. Currently, no uniform cutoff value of the NLR has been determined in cancer populations. In our study, the cutoff value was different from that of most other studies, where it was mostly calculated based on the receiver operating characteristic curve analysis, which may overestimate the prognostic value of the NLR. In these studies, the cutoff value ranged from 1.505 to 5.0.29 In addition, correlations between the NLR and various clinical characteristics of patients may make the prognostic role of the NLR difficult to explain. In the current study, the baseline NLR was found to be associated with the ALBI grade and tumor size, indicating that the prognostic value of the NLR may be associated with liver function and tumor load. Several studies have shown that a high NLR is associated with BCLC stages and the presence of tumor vascular invasion.29–31 Additionally, the change in the NLR was identified as significant in multivariate analyses, but was not significant in univariate analyses, indicating that some clinical factors may also influence the change in the NLR. The complex interplay of these clinical factors may make the predictive efficacy of the NLR unstable.
Since the NLR is a composite indicator of neutrophils and lymphocytes, we also analyzed the dynamic changes in white blood cell, neutrophil, and lymphocyte counts in advance. These blood cell counts continued to decrease over treatment, which differs from our understanding that patients with an elevated NLR have neutrophilic leukocytosis and lymphocytopenia. It is possible that repeated TACE treatment may aggravate cirrhosis or that chemotherapy may have a myelosuppressive effect, resulting in a decreased blood cell count.32,33 Additionally, it was not until 3 months after TACE treatment that the neutrophil and lymphocyte counts between responders and non-responders showed differences, which may indicate a change in the balance between inflammatory and immune responses after TACE. Several studies have found that circulating CD4+ T cells, the CD4+/CD8+ ratio, and NK cells are markedly increased in HCC patients after TACE, leading to an improvement in immune function.34,35 Recently, a study showed that TACE can induce immunogenic cell death through an increase in high-mobility group box 1 and DNase and a decrease in soluble receptors of advanced glycation end products, which indicate the activation of TAA (tumor-associated antigens)-specific responses.36 It was previously believed that RFA could activate an anti-tumor immune response; specifically, one study reported that RFA can induce not only an increase in TAA-specific T cells but also an increase in memory T cells.37
Lymphocytes are important components of the adaptive immune system, providing a cellular basis for cancer immunosurveillance and immunoediting.26 As shown in our results, the lymphocyte levels 3 months after TACE were significantly associated with tumor response and OS. In addition to HCC, lymphocyte responses to other tumor types and treatments have the same prognostic value. A study involving 509 patients with advanced cancer on immunotherapy reported that the change in the NLR is driven primarily by the decline in neutrophils, and that the lymphocyte count remained relatively constant,38 which is similar to our results. Another study of 36 patients with prostate cancer treated with brachytherapy suggested that an increase in activated T cells might contribute to remission maintenance and relapse rate reduction.39 A multicenter study also found that the increases in absolute lymphocytes and circulating CD4+ and CD8+ T cells were associated with improved survival of melanoma patients treated with Ipilimumab.40 In addition, Choi et al41 found that in a high-NLR group of patients with gastric cancer, CD4+ immune cell density was significantly decreased in the tumor microenvironment. The type and density of infiltrating lymphocyte subsets in tumor tissue have also been linked to anti-tumor immunity and prognosis.42,43 All of these results indicate that lymphocytes, especially the T cell subtype, are the basis of anti-tumor immunity and are highly correlated with prognosis.
However, our results should be interpreted with caution considering the limitations of our study. Firstly, this is a retrospective analysis with data from a single center, which has some potential bias due to the limited number of cases. Further prospective and multicenter studies are needed to determine whether our results are universally applicable. Secondly, because various secondary treatments (TACE, local ablation, and systemic treatment) were performed 3 months after the initial TACE treatment, their effect on the NLR-predicted OS is uncertain. Thirdly, the follow-up period was limited, with less than half of the patients having died, which might also cause some biases. Finally, the changes in the NLR were defined as any degree of increase or decrease in our study. Whether this classification is optimal remains to be verified.
Conclusion
In conclusion, patients with elevated NLR, as compared to pre-treatment levels, 3 months after TACE had poorer OS. These findings increase our level of understanding of inflammatory status conversion after TACE and of the prognostic value of the NLR for patients with HCC. Dynamic changes in the NLR may better predict tumor response and survival time than the static NLR, which may be related to changes in lymphocytes throughout treatment. Longitudinal monitoring of the NLR and lymphocytes should be conducted during follow-up examinations for better stratification and individualized treatment of patients with HCC after TACE.
Acknowledgments
This work was supported by the major scientific and technological project of Guangdong Province (No.2017B030308006), the major program for tackling key problems of Guangzhou City, China (No. 201704020144) and National Natural Science Foundation of China (NSFC) (Nos. 81671797 and 81971719).
Disclosure
The authors report no conflicts of interest in this work.
References
1. Bray F, Ferlay J, Soerjomataram I, Siegel RL, Torre LA, Jemal A. Global cancer statistics 2018: GLOBOCAN estimates of incidence and mortality worldwide for 36 cancers in 185 countries. CA Cancer J Clin. 2018;68(6):394–424. doi:10.3322/caac.21492
2. Chen W, Zheng R, Baade PD, et al. Cancer statistics in China, 2015. CA Cancer J Clin. 2016;66(2):115–132. doi:10.3322/caac.21338
3. Chung GE, Lee J, Kim HY, et al. Transarterial chemoembolization can be safely performed in patients with hepatocellular carcinoma invading the main portal vein and may improve the overall survival. Radiol. 2011;258(2):627–634. doi:10.1148/radiol.10101058
4. Wang E, Wang Q, Wang W, et al. Development of a prognostic score for recommended TACE candidates with hepatocellular carcinoma: a multicentre observational study. J Hepatol. 2019;70(5):893–903. doi:10.1016/j.jhep.2019.01.013
5. Kim BK, Shim JH, Kim SU, et al. Risk prediction for patients with hepatocellular carcinoma undergoing chemoembolization: development of a prediction model. Liver Int. 2016;36(1):92–99. doi:10.1111/liv.12865
6. Zheng J, Cai J, Li H, et al. Neutrophil to lymphocyte ratio and platelet to lymphocyte ratio as prognostic predictors for hepatocellular carcinoma patients with various treatments: a meta-analysis and systematic review. Cell Physiol Biochem. 2017;44(3):967–981. doi:10.1159/000485396
7. Chu MO, Shen C, Chang T, et al. Pretreatment inflammation-based markers predict survival outcomes in patients with early stage hepatocellular carcinoma after radiofrequency ablation. Sci Rep UK. 2018;8(1):16611. doi:10.1038/s41598-018-34543-z
8. Wang Y, Sun K, Shen J, et al. Novel prognostic nomograms based on inflammation-related markers for patients with hepatocellular carcinoma underwent hepatectomy. Cancer Res Treat. 2019;51(4):1464–1478. doi:10.4143/crt.2018.657
9. Xu ZG, Ye CJ, Liu LX, et al. The pretransplant neutrophil-lymphocyte ratio as a new prognostic predictor after liver transplantation for hepatocellular cancer: a systematic review and meta-analysis. Biomark Med. 2018;12(2):189–199. doi:10.2217/bmm-2017-0307
10. Hong YM, Yoon KT, Hwang TH, Heo J, Woo HY, Cho M. Changes in the neutrophil-to-lymphocyte ratio predict the prognosis of patients with advanced hepatocellular carcinoma treated with sorafenib. Eur J Gastroen Hepat. 2019;31(10):1250–1255. doi:10.1097/MEG.0000000000001405
11. Chon YE, Park H, Hyun HK, et al. development of a new nomogram including neutrophil-to-lymphocyte ratio to predict survival in patients with hepatocellular carcinoma undergoing transarterial chemoembolization. Cancers. 2019;11(4):509. doi:10.3390/cancers11040509
12. Motomura T, Shirabe K, Mano Y, et al. Neutrophil-lymphocyte ratio reflects hepatocellular carcinoma recurrence after liver transplantation via inflammatory microenvironment. J Hepatol. 2013;58(1):58–64. doi:10.1016/j.jhep.2012.08.017
13. Singh N, Baby D, Rajguru JP, Patil PB, Thakkannavar SS, Pujari VB. Inflammation and cancer. Ann Afr Med. 2019;18(3):121–126. doi:10.4103/aam.aam_56_18
14. Grivennikov SI, Greten FR, Karin M. Immunity, inflammation, and cancer. Cell. 2010;140(6):883–899. doi:10.1016/j.cell.2010.01.025
15. Li Z, Zhao R, Cui Y, Zhou Y, Wu X. The dynamic change of neutrophil to lymphocyte ratio can predict clinical outcome in stage I-III colon cancer. Sci Rep. 2018;8(1):9453. doi:10.1038/s41598-018-27896-y
16. Templeton AJ, McNamara MG, Seruga B, et al. Prognostic role of neutrophil-to-lymphocyte ratio in solid tumors: a systematic review and meta-analysis. J Natl Cancer Inst. 2014;106(6):u124. doi:10.1093/jnci/dju124
17. Qian B. Inflammation fires up cancer metastasis. Semin Cancer Biol. 2017;47:170–176. doi:10.1016/j.semcancer.2017.08.006
18. Ni X, Xu J, Yi Y, et al. Inflammation–nutrition score predicts prognosis of patients with resectable hepatocellular carcinoma. Int J Clin Oncol. 2019;24(7):825–835. doi:10.1007/s10147-019-01402-4
19. Dan J, Zhang Y, Peng Z, et al. Postoperative neutrophil-to-lymphocyte ratio change predicts survival of patients with small hepatocellular carcinoma undergoing radiofrequency ablation. PLoS One. 2013;8(3):e58184. doi:10.1371/journal.pone.0058184
20. He C, Zhang Y, Cai Z, Lin X. The prognostic and predictive value of the combination of the neutrophil-to-lymphocyte ratio and the platelet-to-lymphocyte ratio in patients with hepatocellular carcinoma who receive transarterial chemoembolization therapy. Cancer Manag Res. 2019;11:1391–1400. doi:10.2147/CMAR.S190545
21. Cho K, Park H, Oh D, et al. Neutrophil-to-lymphocyte ratio, platelet-to-lymphocyte ratio, and their dynamic changes during chemotherapy is useful to predict a more accurate prognosis of advanced biliary tract cancer. Oncotarget. 2017;8(2):2329–2341. doi:10.18632/oncotarget.13731
22. Chen Y, Yan H, Wang Y, Shi Y, Dai G. Significance of baseline and change in neutrophil-to-lymphocyte ratio in predicting prognosis: a retrospective analysis in advanced pancreatic ductal adenocarcinoma. Sci Rep UK. 2017;7(1):753. doi:10.1038/s41598-017-00859-5
23. Min K, Kwon MJ, Kim D, et al. Persistent elevation of postoperative neutrophil-to-lymphocyte ratio: a better predictor of survival in gastric cancer than elevated preoperative neutrophil-to-lymphocyte ratio. Sci Rep UK. 2017;7(1):13967. doi:10.1038/s41598-017-13969-x
24. Lalani AA, Xie W, Martini DJ, et al. Change in neutrophil-to-lymphocyte ratio (NLR) in response to immune checkpoint blockade for metastatic renal cell carcinoma. J Immunother Cancer. 2018;6(1):5. doi:10.1186/s40425-018-0315-0
25. Johnson PJ, Berhane S, Kagebayashi C, et al. Assessment of liver function in patients with hepatocellular carcinoma: a new evidence-based approach-the ALBI grade. J Clin Oncol. 2015;33(6):550–558. doi:10.1200/JCO.2014.57.9151
26. Liu C, Jia B, Zou B, et al. Neutrophil-to-lymphocyte and aspartate-to-alanine aminotransferase ratios predict hepatocellular carcinoma prognosis after transarterial embolization. Medicine. 2017;96(45):e8512. doi:10.1097/MD.0000000000008512
27. Pang S, Zhou Z, Yu X, et al. The predictive value of integrated inflammation scores in the survival of patients with resected hepatocellular carcinoma: a retrospective cohort study. Int J Surg. 2017;42:170–177. doi:10.1016/j.ijsu.2017.04.018
28. Dai T, Lin G, Deng M, et al. The prognostic significance of neutrophil-to-lymphocyte ratio at different time points in patients with hepatocellular carcinoma receiving liver resection. Transl Cancer Res. 2020;9(2):441–457. doi:10.21037/tcr.2019.11.29
29. Wang Y, Peng C, Cheng Z, et al. The prognostic significance of preoperative neutrophil-lymphocyte ratio in patients with hepatocellular carcinoma receiving hepatectomy: a systematic review and meta-analysis. Int J Surg. 2018;55:73–80. doi:10.1016/j.ijsu.2018.05.022
30. Li P, Huang W, Wang F, et al. Nomograms based on inflammatory biomarkers for predicting tumor grade and micro-vascular invasion in stage I/II hepatocellular carcinoma. Biosci Rep. 2018;38(6):BSR20180464. doi:10.1042/BSR20180464
31. Xue TC, Zhang L, Xie XY, et al. Prognostic significance of the neutrophil-to-lymphocyte ratio in primary liver cancer: a meta-analysis. PLoS One. 2014;9(5):e96072. doi:10.1371/journal.pone.0096072
32. Zhang Y, Jia Y, Liu X, Liu L, Wang Q, Wen A. The effect of transcatheter arterial chemoembolization on phase II drug metabolism enzymes in patients with hepatocellular carcinoma. Cancer Chemother Pharmacol. 2010;65(2):347–352. doi:10.1007/s00280-009-1040-7
33. Bouteloup M, Perinel S, Bourmaud A, Azoulay E, Mokart D, Darmon M. Outcomes in adult critically Ill cancer patients with and without neutropenia: a systematic review and meta-analysis of the Groupe de Recherche en Réanimation Respiratoire du patient d’Onco-Hématologie (GRRR-OH). Oncotarget. 2017;8(1):1860–1870. doi:10.18632/oncotarget.12165
34. Liao J, Xiao J, Zhou Y, Liu Z, Wang C. Effect of transcatheter arterial chemoembolization on cellular immune function and regulatory T cells in patients with hepatocellular carcinoma. Mol Med Rep. 2015;12(4):6065–6071. doi:10.3892/mmr.2015.4171
35. Huang M, Wang X, Bin H. Effect of transcatheter arterial chemoembolization combined with argon–helium cryosurgery system on the changes of NK cells and T cell subsets in peripheral blood of hepatocellular carcinoma patients. Cell Biochem Biophys. 2015;73(3):787–792. doi:10.1007/s12013-015-0699-0
36. Kohles N, Nagel D, Jüngst D, Stieber P, Holdenrieder S. Predictive value of immunogenic cell death biomarkers HMGB1, sRAGE, and DNase in liver cancer patients receiving transarterial chemoembolization therapy. Tumor Biol. 2012;33(6):2401–2409. doi:10.1007/s13277-012-0504-2
37. Mizukoshi E, Yamashita T, Arai K, et al. Enhancement of tumor-associated antigen-specific T cell responses by radiofrequency ablation of hepatocellular carcinoma. Hepatol. 2013;57(4):1448–1457. doi:10.1002/hep.26153
38. Li M, Spakowicz D, Burkart J, et al. Change in neutrophil to lymphocyte ratio during immunotherapy treatment is a non-linear predictor of patient outcomes in advanced cancers. J Cancer Res Clin. 2019;145(10):2541–2546. doi:10.1007/s00432-019-02982-4
39. Kubo M, Satoh T, Ishiyama H, et al. Enhanced activated T cell subsets in prostate cancer patients receiving iodine-125 low-dose-rate prostate brachytherapy. Oncol Rep. 2018;39(1):417–424. doi:10.3892/or.2017.6095
40. Martens A, Wistuba-Hamprecht K, Yuan J, et al. Increases in absolute lymphocytes and circulating CD4+ and CD8+ T cells are associated with positive clinical outcome of melanoma patients treated with ipilimumab. Clin Cancer Res. 2016;22(19):4848–4858. doi:10.1158/1078-0432.CCR-16-0249
41. Choi Y, Kim JW, Nam KH, et al. Systemic inflammation is associated with the density of immune cells in the tumor microenvironment of gastric cancer. Gastric Cancer. 2017;20(4):602–611. doi:10.1007/s10120-016-0642-0
42. Petrizzo A, Mauriello A, Tornesello ML, Buonaguro FM, Tagliamonte M, Buonaguro L. Cellular prognostic markers in hepatitis-related hepatocellular carcinoma. Infect Agents Cancer. 2018;13(1):10. doi:10.1186/s13027-018-0183-8
43. Sun C, Xu J, Song J, et al. The predictive value of centre tumour CD8+ T cells in patients with hepatocellular carcinoma: comparison with Immunoscore. Oncotarget. 2015;6(34):35602–35615. doi:10.18632/oncotarget.5801
 © 2020 The Author(s). This work is published and licensed by Dove Medical Press Limited. The full terms of this license are available at https://www.dovepress.com/terms.php and incorporate the Creative Commons Attribution - Non Commercial (unported, v3.0) License.
By accessing the work you hereby accept the Terms. Non-commercial uses of the work are permitted without any further permission from Dove Medical Press Limited, provided the work is properly attributed. For permission for commercial use of this work, please see paragraphs 4.2 and 5 of our Terms.
© 2020 The Author(s). This work is published and licensed by Dove Medical Press Limited. The full terms of this license are available at https://www.dovepress.com/terms.php and incorporate the Creative Commons Attribution - Non Commercial (unported, v3.0) License.
By accessing the work you hereby accept the Terms. Non-commercial uses of the work are permitted without any further permission from Dove Medical Press Limited, provided the work is properly attributed. For permission for commercial use of this work, please see paragraphs 4.2 and 5 of our Terms.