")
Back to Journals » Drug Design, Development and Therapy » Volume 15
Doxazosin Attenuates Liver Fibrosis by Inhibiting Autophagy in Hepatic Stellate Cells via Activation of the PI3K/Akt/mTOR Signaling Pathway
Authors Xiu AY , Ding Q , Li Z , Zhang CQ
Received 27 April 2021
Accepted for publication 3 August 2021
Published 21 August 2021 Volume 2021:15 Pages 3643—3659
DOI https://doi.org/10.2147/DDDT.S317701
Checked for plagiarism Yes
Review by Single anonymous peer review
Peer reviewer comments 2
Editor who approved publication: Dr Tuo Deng
Ai-Yuan Xiu,1 Qian Ding,2 Zhen Li,2 Chun-Qing Zhang1,2
1Department of Gastroenterology, Shandong Provincial Hospital, Cheeloo College of Medicine, Shandong University, Jinan, People’s Republic of China; 2Department of Gastroenterology, Shandong Provincial Hospital Affiliated to Shandong First Medical University, Jinan, People’s Republic of China
Correspondence: Chun-Qing Zhang
Department of Gastroenterology, Shandong Provincial Hospital, Cheeloo College of Medicine, Shandong University, 324 Jingwu Weiqi Road, Jinan, 250021, People’s Republic of China
Tel +86 5 316 877 3293
Fax +86 5 318 790 6348
Email [email protected]
Purpose: To investigate the effect of doxazosin on autophagy and the activation of hepatic stellate cells (HSCs) in vivo and in vitro and determine the underlying mechanism.
Methods: In vivo, a mouse liver fibrosis model was induced by the intraperitoneal injection of carbon tetrachloride (CCl4). Doxazosin was administered at doses of 2.5, 5 and 10 mg/(kg*day) by gavage. After 20 weeks, blood and liver tissues were collected for serological and histological analysis, respectively. Blood analysis, hematoxylin and eosin (HE) staining, Masson’s trichrome staining, immunohistochemistry and immunofluorescence staining were used to measure the extent of liver fibrosis in model and control mice. In vitro, the human HSC cell line LX-2 was cultured and treated with different doses of doxazosin for the indicated times. The effects of doxazosin on LX-2 cell proliferation and migration were examined by Cell Counting Kit-8 (CCK-8) and Transwell assays, respectively. The number of autophagosomes in LX-2 cells was observed by transmission electron microscopy (TEM). Infection with green fluorescent protein (GFP)-LC3B adenovirus, GFP-red fluorescent protein (RFP)-LC3B adenovirus and mCherry-EGFP-LC3 adeno-associated virus was performed to examine changes in autophagic flux in vitro and in vivo. Cell apoptosis was measured by flow cytometry in vitro and by TUNEL assays both in vitro and in vivo. Immunoblotting was performed to evaluate the expression levels of proteins related to fibrosis, autophagy, apoptosis, and phosphatidylinositol 3-kinase (PI3K)/protein kinase B (Akt)/mammalian target of rapamycin (mTOR).
Results: Doxazosin inhibited HSC proliferation and migration. HSC activation was attenuated by doxazosin in a concentration-dependent manner in vivo and in vitro. Doxazosin also blocked autophagic flux and induced apoptosis in HSCs. In addition, the PI3K/Akt/mTOR pathway was activated by doxazosin and regulated fibrosis, autophagy and apoptosis in HSCs.
Conclusion: The study confirmed that doxazosin could inhibit autophagy by activating the PI3K/Akt/mTOR signaling pathway and attenuate liver fibrosis.
Keywords: doxazosin, liver fibrosis, autophagy, apoptosis, mTOR
Introduction
Liver fibrosis is a complicated pathophysiological process that serves as an intermediate stage for various chronic liver diseases, including liver cirrhosis.1 Portal hypertension (PHT) and hepatic failure usually occur in the late stage of liver cirrhosis.2 Although strategies for the diagnosis and treatment of liver cirrhosis have improved, this disease still causes more than one million deaths each year worldwide.3 Thus far, apart from ameliorating the underlying cause or performing liver transplantation, no effective clinical therapies are available to inhibit the pathological progression of liver fibrosis,4 and safe and effective drugs are urgently needed.
The activation of hepatic stellate cells (HSCs) is crucial for liver fibrogenesis because they transdifferentiate into myofibroblasts, which are the primary cells responsible for synthesizing the extracellular matrix (ECM) in the liver.5 Activated HSCs can produce alpha smooth muscle actin (α-SMA) and type I collagen (COL1, formed by two molecules of COL1A1 and one molecule of COL1A2),6,7 ultimately leading to an imbalance in ECM production and degradation.
Autophagy is a crucial intracellular pathway, through which damaged organelles and impaired proteins are degraded to supply eukaryotic cells with energy to maintain homeostasis.8 Previous studies have shown that the phosphatidylinositol 3-kinase (PI3K)/protein kinase B (Akt)/mammalian target of rapamycin (mTOR) pathway plays an important role in regulating cellular autophagy, including that in HSCs.9–11 Autophagy can provide energy for HSC activation by regulating the degradation of lipid droplets stored in cells,12 and the autophagy substrate p62, can inhibit fibrogenic responses in HSCs.13 On the other hand, facilitating autophagy can activate HSCs.14 Thus, we can confirm that HSC activation is strongly associated with autophagy.
Our previous studies confirmed that carvedilol, an inhibitor of β1-, β2- and α1-adrenoreceptors, could attenuate carbon tetrachloride (CCl4)-induced liver fibrosis and ameliorate intrahepatic angiogenesis and portal pressure.15,16 In addition, we found that carvedilol attenuated fibrosis by suppressing autophagy and inducing apoptosis in HSCs.17 Autophagy and apoptosis are two catabolic pathways that are vital for organismal homeostasis, especially in the liver, and their dysregulation contributes to liver fibrosis.18 Thus, the manipulation of autophagy and apoptosis may be a promising strategy for the treatment of liver fibrosis.
Doxazosin is a traditional α1-adrenergic receptor (α1AR) antagonist that can inhibit hypertension. This drug has several potential additional advantages, including a long half-life of 22 h, minimal impacts on renal function, and an outstanding antihypertensive effect due to the reduction of smooth muscle tension in peripheral vascular beds that thereby reduces the total peripheral resistance without significantly affecting the heart rate or cardiac output.19,20 In benign prostatic hyperplasia, doxazosin relieves bladder outflow obstruction by reducing the prostate tone mediated by α1AR blockade.20 Doxazosin can also inhibit prostate cancer by inhibiting protein kinase B (PKB)/Akt activation and thereby inducing cell apoptosis via an α1AR-independent mechanism.21 The antifibrotic effect of doxazosin on hamsters has been reported,22,23 and prazosin, another α1AR antagonist, has been reported to have a hemodynamic effect on the reduction in PHT,24 suggesting that α1AR antagonists play important roles in the treatment of liver fibrosis and PHT.
Given that carvedilol is more effective at reducing PHT than traditional nonselective beta-blockers (NSBBs) because it also blocks α1AR,25 we hypothesize that the improvements in PHT are pronounced because of the significant effect of α1AR antagonists on reducing liver fibrosis. However, the mechanism by which doxazosin attenuates liver fibrosis is still unclear. Published literature indicates that doxazosin can inhibit diseases by regulating autophagy,26 and autophagy plays an important role in HSC activation.5 Thus, we hypothesize that the doxazosin-mediated regulation of autophagy and apoptosis in HSCs is one of the most important mechanisms by which this compound attenuates liver fibrosis and that the PI3K/Akt/mTOR signaling pathway is involved. In the present study, we aimed to investigate the effect of doxazosin on HSC activation and to clarify the underlying mechanism and the main pathway.
Materials and Methods
Reagents and Antibodies
Doxazosin was purchased from Sigma-Aldrich (Missouri, USA), and a 60 mM stock solution was prepared in dimethyl sulfoxide (DMSO, MP Biomedicals, California, USA) and stored at −80 °C. Dulbecco’s modified Eagle’s medium (DMEM) and fetal bovine serum (FBS) were obtained from Gibco (California, USA), rapamycin (RAP) and chloroquine (CQ) were purchased from MedChemExpress (New Jersey, USA), and bafilomycin A1 (Baf-A1) and MHY1485 were obtained from SelleckChem (Texas, USA).
Primary antibodies against LC3B (ab192890), p62 (ab109012), Bcl-2 (ab182858), p-PI3K p85 (Y607) (ab182651), PI3K p85 (ab191606), α-SMA (ab7817), and p-mTOR (Ser2448) (ab109268) were procured from Abcam Technology (Massachusetts, USA). Primary antibodies against ATG5 (#12994), Beclin 1 (#3495), α-SMA (#19245), COL1A1 (#72026), PARP (#9532), Bax (#5023), mTOR (#2983), Akt (#4691) and p-Akt (Ser473) (#4060) were purchased from Cell Signaling Technology (Massachusetts, USA). A primary antibody against beta-actin (β-actin) and HRP-conjugated secondary antibodies were acquired from Proteintech (Illinois, USA). DyLight 488-conjugated, DyLight 549-conjugated and DyLight 649-conjugated secondary antibodies were obtained from Abbkine (Wuhan, China). Green fluorescent protein (GFP)-LC3B adenovirus, GFP-red fluorescent protein (RFP)-LC3B adenovirus and mCherry-EGFP-LC3 adeno-associated virus were obtained from Hanbio (Shanghai, China).
Cell Culture
The human HSC cell line LX-2 (Procell, Wuhan, China) was cultured in DMEM supplemented with 10% FBS at 37 °C and 5% CO2.
Animals
Male C57BL/6 mice (Vital River Company, Beijing, China), weighing 20–22 g, were housed at the Laboratory Animal Center of Shandong Provincial Hospital affiliated with Shandong University under a standard 12 h light/dark cycle with a constant temperature of 22 ± 2 °C and had free access to standard water and food. All mice in this study were healthy and immune-normal. This study was carried out in strict accordance with the National Institute of Health Guidelines for the Care and Use of Laboratory Animals. Animal-related experiments were approved by the Animal Care and Utilization Committee of Shandong Provincial Hospital affiliated with Shandong University (NSFC: no. 2019-251).
Preliminary Experiment
A total of 30 mice were randomly and equally divided into five groups. Doxazosin was suspended in water at varying doses according to the groups. 1) Normal control group mice were given water by gavage every day for 20 weeks. Mice in the 2) doxazosin 2.5 group, 3) doxazosin 5 group, and 4) doxazosin 10 group were given 2.5 mg/kg, 5 mg/kg and 10 mg/kg doxazosin, respectively, every day by gavage for 20 weeks. 5) In the olive oil group, mice were intraperitoneally injected with olive oil twice weekly and concurrently given water by gavage daily for 20 weeks. Survival was recorded, and liver and blood samples were collected for further analysis.
Experimental Design
Seventy-five mice were randomly divided into five groups, with 15 mice in each group. ① Mice in the olive oil group were treated as described above. In the ② CCl4 group, mice were intraperitoneally injected with CCl4 twice weekly and concurrently administered water by gavage daily for 20 weeks. Mice in the ③ CCl4+doxazosin 2.5 group, ④ CCl4+doxazosin 5 group, and ⑤ CCl4+doxazosin 10 group were intraperitoneally injected with CCl4 twice weekly and simultaneously administered 2.5 mg/kg, 5 mg/kg and 10 mg/kg doxazosin, respectively, by gavage daily for 20 weeks. CCl4 was dissolved in olive oil (20%, 0.5 mL/100 g).
Blood Analysis
Blood samples were collected from each mouse, and the serum was then separated and stored at −80 °C until use. The levels of alanine aminotransferase (ALT), aspartate aminotransferase (AST), total bilirubin (TBIL), blood urea nitrogen (BUN), and creatinine (CR) were measured by an automatic biochemical analyzer (Rayto, Chemray 800, Shenzhen, China) according to the manufacturer’s instructions.
Liver Histology
Fresh liver tissues were snap-frozen or fixed in 4% buffered formalin for 24 h at room temperature and then embedded in paraffin blocks for histological evaluation. Tissue slides of serial 5-μm-thick sections were stained with hematoxylin and eosin (HE) and Masson’s trichrome (MT) and then observed by light microscopy. Morphometric quantification of the positive areas was performed using Image-Pro Plus 6.0 software (Baltimore, USA).
Immunohistochemical Staining
Mouse liver tissues were fixed with 4% paraformaldehyde, embedded in paraffin, and sliced into 5-μm-thick sections. After deparaffinization and hydration, the sections were incubated with citrate and blocked with 3% H2O2. The slides were placed in 5% bovine serum albumin (BSA) and then incubated with primary antibodies, including anti-α-SMA (1:200) and anti-COL1A1 (1:100), overnight at 4 °C. The sections were incubated with appropriate biotinylated secondary antibodies (goat anti-rabbit IgG, Origene Technologies, Beijing, China), stained with diaminobenzidine (DAB) and then counterstained with hematoxylin. The positively stained areas in five different fields of view were determined by microscopy (Olympus, Japan) and measured by Image-Pro Plus 6.0 software.
Immunoblotting Analysis
Total protein was extracted using modified RIPA buffer containing a protease and phosphatase inhibitor cocktail (Roche Diagnostics, Mannheim, Germany), and protein concentrations were measured using a bicinchoninic acid (BCA) protein assay kit (Beyotime, China). Proteins (20 μg or 40 μg) were separated by 8–12% sodium dodecyl sulfate-polyacrylamide gel electrophoresis (SDS-PAGE) and then transferred onto polyvinylidene fluoride (PVDF) membranes (Millipore, USA). After being blocked with 5% nonfat dry milk in Tris-buffered saline plus Tween-20 (TBST) for 1 h at room temperature, the PVDF membranes were incubated overnight at 4 °C with the indicated primary antibodies and then with secondary antibodies for 1 h at room temperature. Protein bands were visualized using enhanced chemiluminescence (Millipore, USA) with an Amersham Imager 680 (GE Healthcare, USA). Band intensities were quantified with Image-Pro Plus 6.0 software and normalized to that of β-actin.
Cell Counting Kit-8 (CCK-8) Assay
LX-2 cells (5 × 10³ cells/well) were seeded in 96-well plates and cultured overnight, and the culture medium was then replaced with fresh medium containing different concentrations of doxazosin (1, 5, 10, 20, 30, 40, 50, and 60 μM; DMSO was used as a control). After incubation for 24 h, the cells were washed with phosphate-buffered saline (PBS), and 10 μL of CCK-8 solution (Dojindo Laboratories, Japan) was then added to each well. The optical density (OD) values at 450 nm were measured every 15 min with a spectrophotometer (Thermo Fisher, Finland). The OD values at 1 h were chosen for analysis.
Transwell Migration Assay
For the cell migration assay, LX-2 cells (1×10⁴ cells/well) were cultured together with 10 μM doxazosin in the upper chambers of 24-well Transwell plates (Corning, New York, USA) for 6, 12, and 24 h or with 0.1% DMSO for 24 h as a control, and the lower chambers contained 10% FBS. The cells were cultured at 37 °C and allowed to migrate for the indicated times. Unmigrated cells in the upper chambers were removed using cotton tips, and the migrated cells on the underside of the filters were fixed and stained with hematoxylin. The stained cells were counted in five random fields using a microscope (Olympus, Japan) and analyzed with Image-Pro Plus 6.0 software.
Immunofluorescent Staining
Slides of mouse liver tissues or LX-2 cells were fixed with 4% paraformaldehyde for 15 min and then blocked with 5% BSA for 1 h at room temperature. Afterwards, the slides or cells were incubated with primary antibodies, including anti-α-SMA (1:200), anti-COL1A1 (1:100), anti-LC3B (1:400), and anti-p62 (1:400), at 4 °C overnight and then with fluorescently labeled secondary antibodies for 90 min at 37 °C. Subsequently, the samples were incubated with DAPI for 6 min, and images were obtained by laser confocal microscopy (Leica TCS SP8, Germany). Fluorescence staining was quantified by Image-Pro Plus 6.0 software.
siRNA Transfection
An siRNA targeting ATG5 (siATG5) and a control siRNA (Genomeditech, Shanghai, China) were transfected into LX-2 cells at 100 pmol (six-well plates) using Lipofectamine 3000 (Life Technologies, USA) when the cells reached 60–70% confluence according to the manufacturer’s instructions. The target interfering sequences were as follows: siATG5 (5ʹ-GGG AAG CAG AAC CAU ACU ATT-3′(sense), 5′-UAG UAU GGU UCU GCU UCC CTT-3′(antisense)), and negative control siRNA (5′-UUC UCC GAA CGU GUC ACG UTT-3′(sense), 5′-ACG UGA CAC GUU CGG AGA ATT-3′(antisense)). After 36 h of transfection, the cells were treated with indicated chemicals for 24 h and then subjected to real-time quantitative polymerase chain reaction (qRT-PCR), Western blot and immunofluorescence staining analyses.
qRT-PCR Analysis
Total RNA was isolated from LX-2 cells using TRIzol reagent, and cDNA was then synthesized with a reverse transcription kit (Takara, Japan). qRT-PCR was performed using the SYBR Green PCR kit (Takara, Japan) according to the manufacturer’s protocol. The primer sequences for the amplification of LC3B, p62, ATG5 and β-actin were as follows: LC3B (5ʹ-AGT TGG CAC AAA CGC AGG GTA-3ʹ, forward; 5ʹ-TTA GGA GTC AGG GAC CTT CAG CA-3ʹ, reverse), p62 (5ʹ-AGT CTC TGG CGG AGC AGA TGA-3ʹ, forward; 5ʹ-TCT GGC ATC TGT AGG GAC TGG A-3ʹ, reverse), ATG5 (5ʹ-CCA TCA ATC GGA AAC TCA TGG A-3ʹ, forward; 5ʹ-ATC TGC AGC CAC AGG ACG AA-3ʹ, reverse), and β-actin (5′-TGG CAC CCA GCA CAA TGA A-3′, forward; 5′-CTA AGT CAT AGT CCG CCT AGA AGC A-3′, reverse). The levels of mRNAs were normalized to that of β-actin, and fold changes were calculated by the 2−ΔΔCT method. Each experiment was performed three times independently.
Autophagic Flux Measurement
To analyze the autophagic flux in LX-2 cells, GFP-LC3 and GFP-RFP-LC3 adenoviruses were used according to the manufacturer’s instructions. Briefly, adenoviruses were added to the medium at an MOI of 30 when the cells reached 60% confluence. The cells were incubated at 37 °C for 12 h before being transferred into complete fresh medium. After 24 h of GFP-LC3 or GFP-RFP-LC3 adenoviral infection, the cells were treated with the indicated chemicals or transfected with the indicated siRNAs. The cells were then fixed with 4% formaldehyde for 15 min and stained with DAPI for 6 min at room temperature. Fluorescence images were captured using a laser confocal microscope (Leica TCS SP8, Germany). Autophagic flux measurement was performed as described previously.27 Briefly, GFP degrades in acidic environments, whereas RFP does not. When autophagy is activated, the red puncta, which indicate autophagic lysosomes, are more numerous than yellow puncta (formed by the overlap of red and green), which indicates the presence of autophagosomes, and more yellow puncta than red puncta indicates autophagy suppression. Three regions were selected randomly, and five cells were counted per group.
The mouse was infected with mCherry-EGFP-LC3 adeno-associated virus (100 μL) via the tail vein four weeks before sacrifice. The liver was removed carefully and trimmed immediately after the mouse was sacrificed. Then, the tissue was embedded in optimal cutting temperature (OCT) compound (Sakura, Torrance, USA), serial sections (6 μm) were mounted on slides, and immunofluorescence staining of α-SMA was performed as described above. After staining with DAPI for 6 min, the sections were scanned with a laser confocal microscope (Leica TCS SP8, Germany). The relative fluorescence intensity was recorded in each section and analyzed using Image-Pro Plus 6.0 software.
Transmission Electron Microscopy (TEM)
After treatment with 10 μM doxazosin or DMSO for 24 h, LX-2 cells were fixed with 2% glutaraldehyde and 1% osmium tetroxide and then rinsed with 0.1 M sodium phosphate buffer (pH 7.2). After being dehydrated in a graded alcohol series, the samples were embedded in epon and cut into ultrathin sections, which were then collected on formvar-coated grids and stained with 1% lead citrate and 10% uranyl acetate. All samples were examined with a transmission electron microscope (Hitachi, HT7800, Japan).
Detection of Apoptosis by TUNEL Staining
TUNEL staining was performed using an in situ cell death detection kit (Roche, Mannheim, Germany) according to the manufacturer’s protocol. Briefly, LX-2 cells were fixed with 4% paraformaldehyde for 15 min at room temperature and then incubated with PBS containing 0.3% Triton X-100 for 5 min at room temperature. Liver slices that had been incubated with primary antibodies against α-SMA (1:200) overnight and LX-2 cells processed as described above were then incubated with a terminal deoxynucleotidyl transferase (TdT) buffer solution (in the presence of fluorescence-conjugated secondary antibodies simultaneously for liver slices) for 1 h at 37 °C. After staining with DAPI, fluorescence was examined under a laser confocal microscope (Leica TCS SP8, Germany). The results were analyzed by Image-Pro Plus 6.0 software and are expressed as the apoptosis index, which was calculated as follows: (TUNEL-positive cells)/(total cells)×100%.
Detection of Apoptosis by Flow Cytometry
LX-2 cell apoptosis was examined using the PE Annexin V Apoptosis Detection Kit I (BD Biosciences, USA). First, LX-2 cells were cultured with different concentrations of doxazosin (5, 10, 15, and 20 μM; DMSO was used as a control) for 24 h; with 10 μM doxazosin for 24 or 36 h; or with 0.1% DMSO for 36 h. LX-2 cells were treated with 10 μM doxazosin alone, 10 μM doxazosin together with 100 nM rapamycin, 10 μM MHY1485, or 0.1% DMSO for 24 h. Then, the cells were processed according to the kit instructions and analyzed by flow cytometry (FACSCalibur Flow Cytometer, BD Biosciences, USA) within 15 min.
Statistical Analysis
Statistical analysis was performed using SPSS 22.0 (IBM, Chicago, USA). All data are presented as the means ± standard deviations (SDs). Differences were analyzed with Student’s t-test for the comparison of two groups and by one-way analysis of variance for the comparison of multiple groups. Overall survival (OS) was defined as the time between the initial experiment and all-cause death. The survival rate was observed for 20 weeks after the start of the experiment. Survival curves were determined by the Kaplan-Meier method and compared using the Log rank test. Differences were considered statistically significant when the P-value was less than 0.05.
Results
Doxazosin Has No Adverse Effects on Survival or Liver Function in Mice
After 20 weeks, all of the mice that were administered 2.5 mg/(kg*day), 5 mg/(kg*day), or 10 mg/(kg*day) doxazosin survived, as did mice in the normal control group and olive oil group. HE and Masson staining were performed to analyze histopathological changes and the extent of fibrosis in the livers (Figure 1A). The expression of fibrosis-related proteins, such as α-SMA and COL1A1, was measured by immunohistochemistry (Figure 1A) and immunoblotting (Figure 1B). Serum biochemical indicators, including ALT, AST, TBIL, BUN, and CR, were measured to investigate the effects on mouse liver and kidney functions (Figure 1C). The results showed no significant differences among the five groups in our study, which revealed that doxazosin had no adverse effects on survival or liver function in mice and confirmed the safety of doxazosin in mice even at concentrations as high as 10 mg/(kg*day), guaranteeing the safety of doxazosin use in subsequent mice experiments.
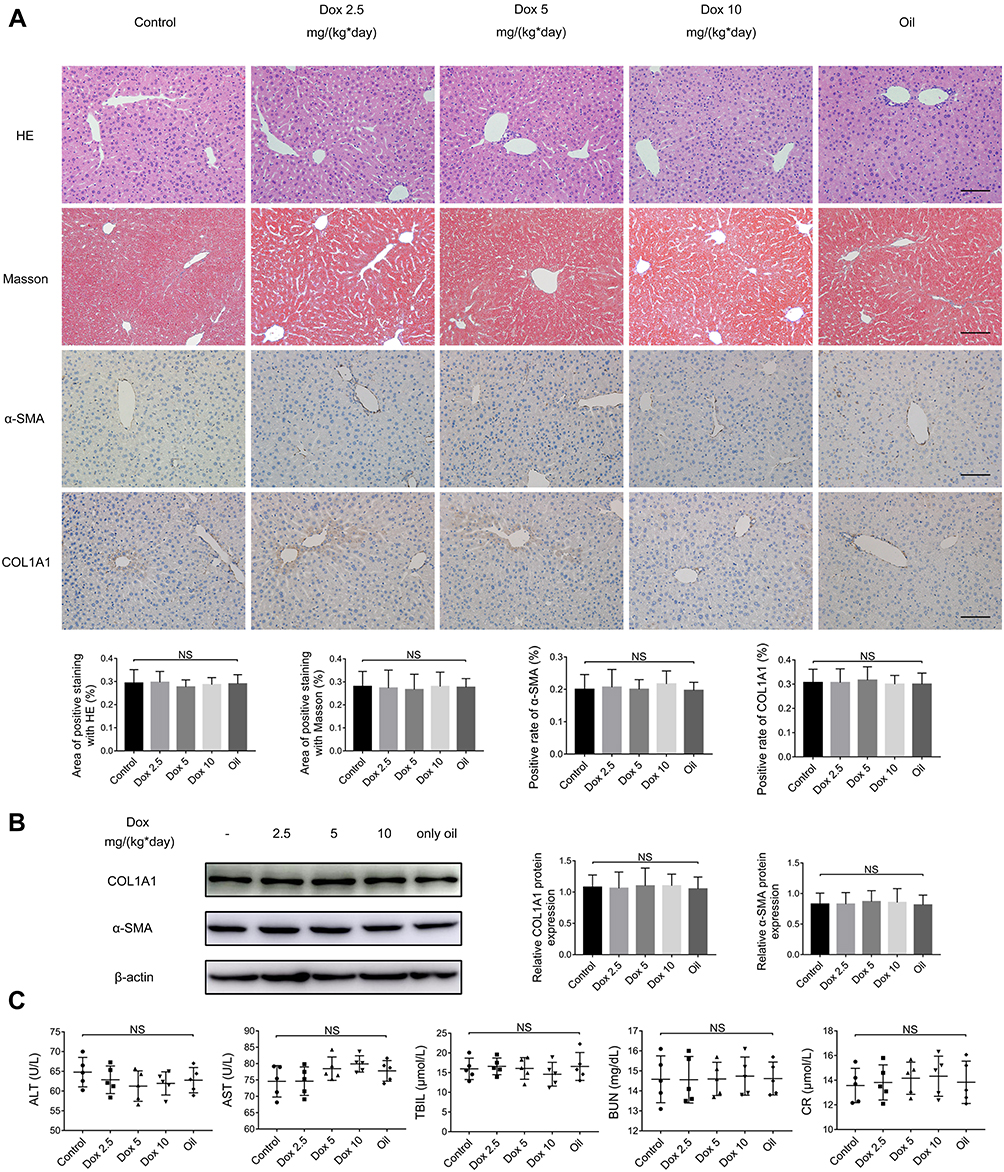 |
Figure 1 Doxazosin has no adverse effects on mouse liver function. (A) HE, Masson, and immunohistochemical staining of α-SMA and COL1A1 in liver tissues. Scale bar, 100 μm. (B) The α-SMA and COL1A1 protein expression levels in liver tissues were measured by immunoblotting. (C) The levels of alanine aminotransferase (ALT), aspartate aminotransferase (AST), total bilirubin (TBIL), blood urea nitrogen (BUN), and creatinine (CR) in the different treatment groups were determined. Abbreviations: Dox, doxazosin; NS, not significant among the groups. |
Doxazosin Inhibits HSC Proliferation, Activation and Migration in vitro
As shown in Figure 2A, LX-2 cell proliferation was markedly inhibited by doxazosin in a concentration-dependent manner, and the IC50 was 30.69 μmol/L. The immunoblotting results indicated that doxazosin significantly inhibited the protein expression of COL1A1 and α-SMA in LX-2 cells (Figure 2B). Remarkably, doxazosin (2–15 μM) counteracted LX-2 cell activation, and the level of α-SMA was not significantly different in cells treated with 10 μM and 15 μM doxazosin. Therefore, we chose the optimum dose (10 μM) of doxazosin for the subsequent experiments with LX-2 cells. After treatment with 10 μM doxazosin for 6, 12, and 24 h or with DMSO for 24 h, LX-2 cell migration was examined. The results showed that HSC migration was significantly decreased by doxazosin treatment (Figure 2C).
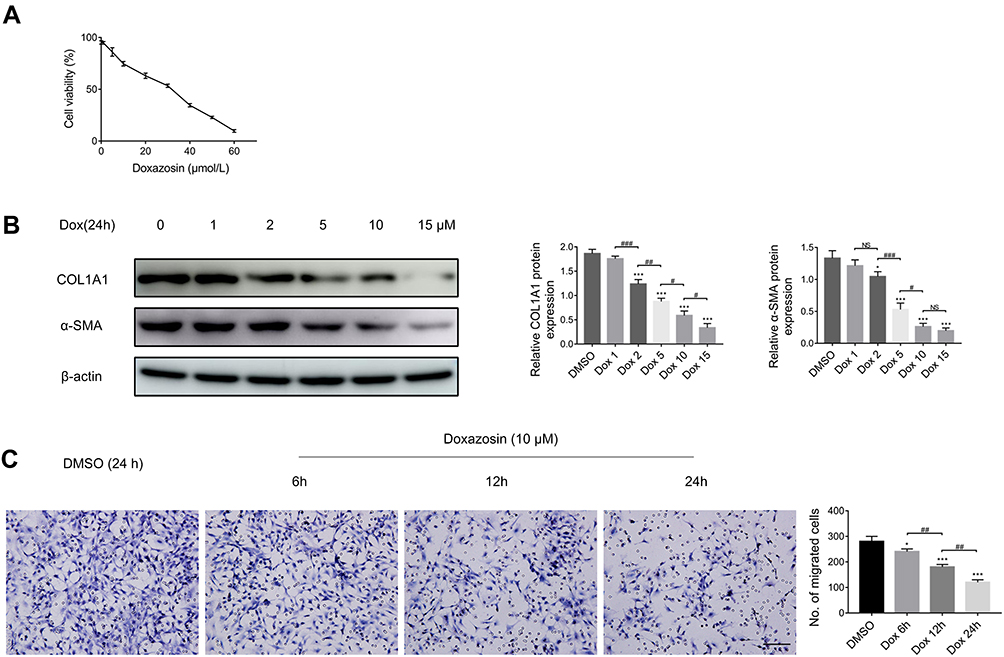 |
Figure 2 Doxazosin inhibits the proliferation, activation and migration of LX-2 cells. (A) Impacts of doxazosin on the viability of LX-2 cells as determined by the CCK-8 assay. (B) The α-SMA and COL1A1 protein expression levels in LX-2 cells were determined by immunoblotting. (C) Assay of the migration of 10 μM doxazosin-treated LX-2 cells for the indicated times. Scale bar, 100 μm. Abbreviation: Dox, doxazosin. Notes: *P<0.05, ***P < 0.001 compared with the DMSO group. #P<0.05, ##P < 0.01, ###P < 0.001, NS (not significant), compared between the two groups. |
Doxazosin Contributes to Improved Survival and Protects Against the Development of Cirrhosis Induced by CCl4
First, a classic mouse model of liver fibrosis induced by the long-term administration of CCl4 was established to identify the effect of doxazosin on liver injury. As expected, CCl4 caused more deaths in the model group than in the olive oil group. Interestingly, doxazosin improved the survival rates of CCl4-induced mice in the CCl4+doxazosin 5 mg/(kg*day) and CCl4+doxazosin 10 mg/(kg*day) groups, but the differences among the three groups were not significant, as estimated by the Kaplan-Meier method (Figure 3A).
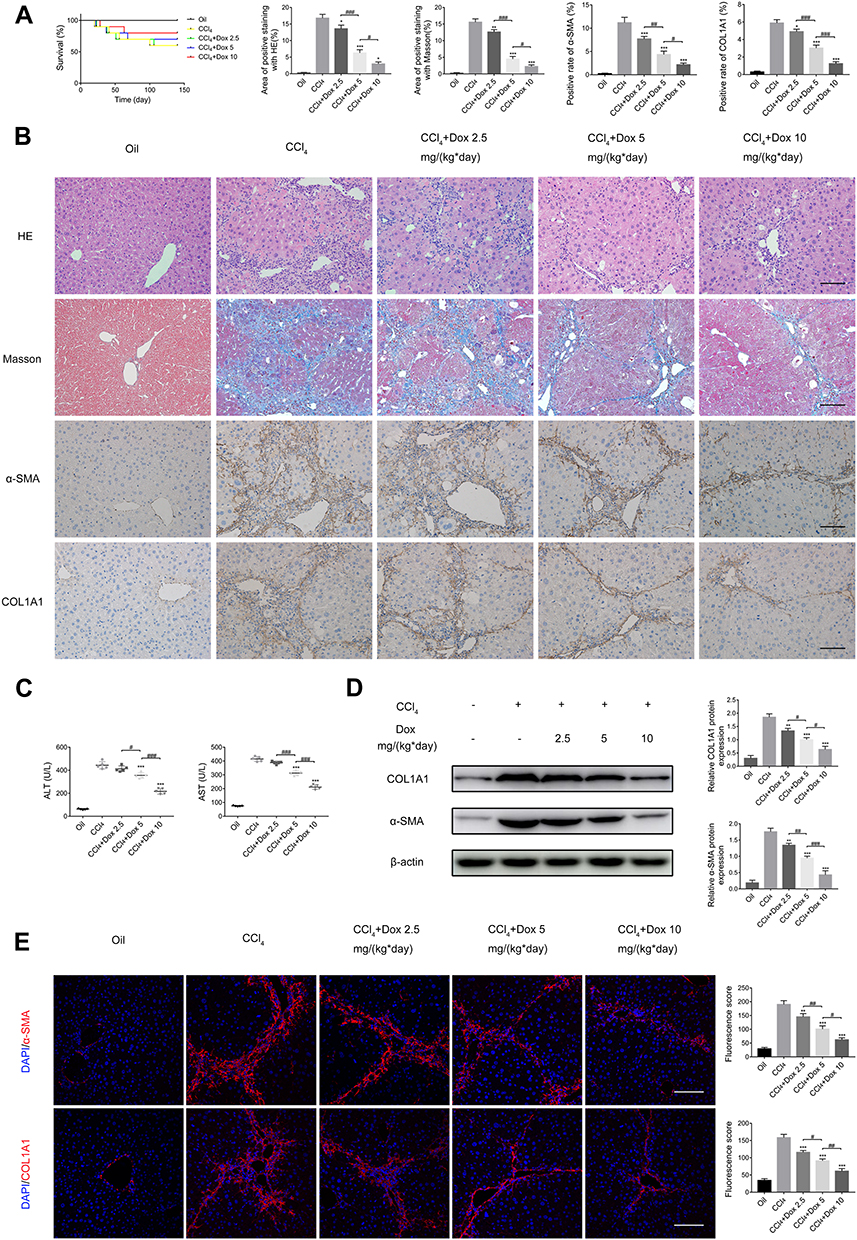 |
Figure 3 Doxazosin decreases liver fibrosis in mice. (A) Cumulative survival rates of mice as determined by Kaplan-Meier analysis. (B) HE, Masson, and immunohistochemical staining of α-SMA and COL1A1 in liver tissues. Scale bar, 100 μm. (C) The levels of alanine aminotransferase (ALT) and aspartate aminotransferase (AST) in the different treatment groups were measured. (D) The α-SMA and COL1A1 protein expression levels in liver tissues were determined by immunoblotting. (E) Immunofluorescence staining of α-SMA and COL1A1 in mice of the five groups. Scale bar, 100 μm. Abbreviation: Dox, doxazosin. Notes: *P<0.05, **P < 0.01, ***P < 0.001 compared with the CCl4 group. #P<0.05, ##P < 0.01, ###P < 0.001 compared between the two groups. |
In addition, the extents of CCl4-induced pathological alterations in HE- and Masson-stained sections of injured liver tissues were reduced by doxazosin, and the protective effect was dose-dependent (Figure 3B). In addition, serological analysis indicated that serum levels of ALT and AST in the CCl4 group were significantly higher than those in the olive oil group, while in the CCl4 plus doxazosin groups, doxazosin significantly reduced the CCl4-induced increase in serum AST and ALT in a dose-dependent manner (Figure 3C). These results indicated that doxazosin could alleviate the pathological damage associated with liver fibrosis in mice.
On the other hand, the immunoblotting results showed that doxazosin significantly inhibited the protein expression of COL1A1 and α-SMA in mice with CCl4-induced liver fibrosis (Figure 3D). The immunohistochemistry (Figure 3A) and immunofluorescence (Figure 3E) results were consistent with the other results.
Doxazosin Blocks Autophagic Flux in Activated HSCs
To determine whether doxazosin treatment impacted autophagy, the formation of autophagosomes and autophagic flux were investigated in LX-2 cells. The immunoblotting results showed that the expression of LC3B-II was significantly increased by doxazosin treatment in a dose- and time-dependent manner (Figure 4A), suggesting that autophagosomes accumulated in the cells. Ultrastructurally, TEM showed that LX-2 cells formed more autophagosomes in response to doxazosin treatment than those in the DMSO group (Figure 4B). Increased formation of autophagosomes and decreased autophagosome turnover due to late suppression of autophagy can increase the number of autophagosomes. Subsequently, we found that increasing the doxazosin concentration did not significantly alter the protein levels of ATG5 and Beclin 1, important markers of autophagosome formation (Figure 4A), suggesting that doxazosin did not impact autophagosome formation. Interestingly, the expression of p62, a selective autophagy substrate receptor, was enhanced as the concentration of doxazosin and the experiment time increased (Figure 4A), suggesting that autophagic flux was blocked by doxazosin in LX-2 cells.
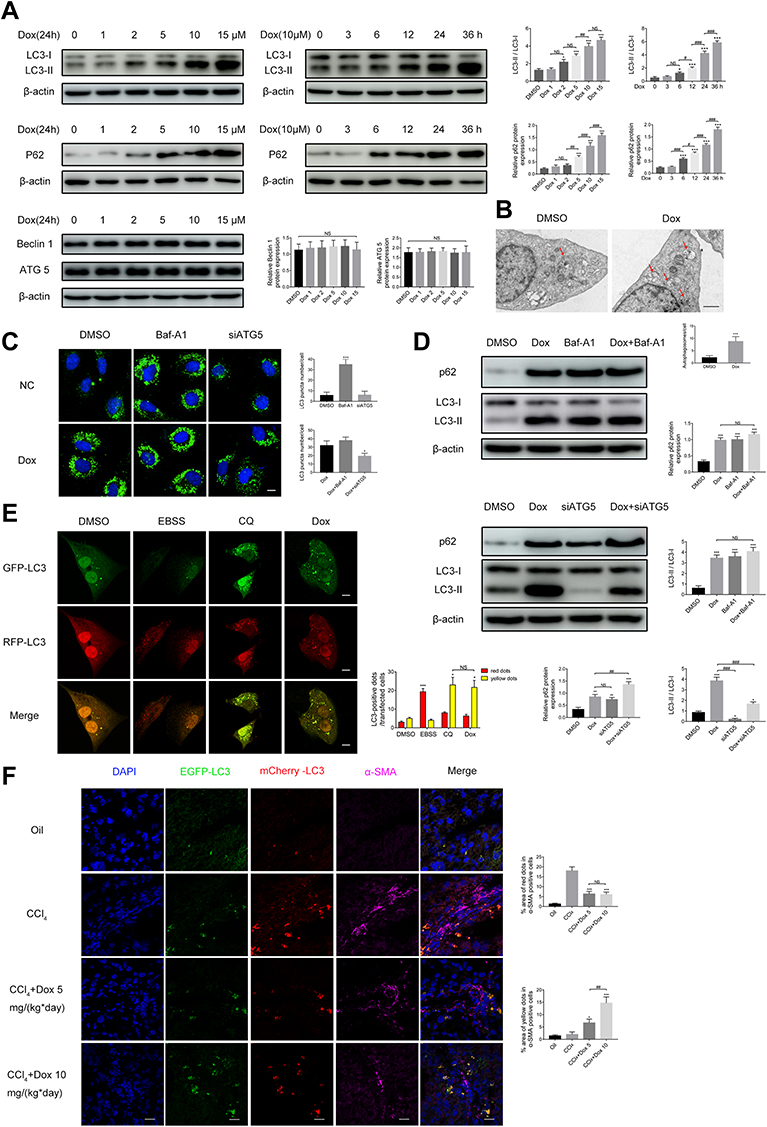 |
Figure 4 Doxazosin inhibits autophagy in hepatic stellate cells. (A) The levels of autophagy-related proteins (LC3B, p62, ATG5 and Beclin 1) in LX-2 cells were determined by immunoblotting. (B) Representative transmission electron microscopy images of autophagosomes (arrow) in LX-2 cells treated with doxazosin (10 μM) or DMSO. Scale bar, 1 μm. (C) LX-2 cells were infected with GFP-LC3 adenovirus and then transfected with the indicated siRNAs or treated with the indicated chemicals. GFP-LC3 puncta were evaluated by confocal microscopy. Scale bar, 20 μm. (D) The protein levels of LC3B and p62 in LX-2 cells were determined by immunoblotting. (E) LX-2 cells were infected with GFP-RFP-LC3 adenovirus and then treated with the indicated chemicals. GFP-LC3 and RFP-LC3 puncta were evaluated by confocal microscopy. Scale bar, 20 μm. (F) Representative images of punctate mCherry-EGFP-LC3 staining in liver tissues. Red: mCherry-LC3; green: EGFP-LC3; purple: α-SMA; blue: nucleus. Scale bar, 20 μm. Abbreviations: Dox, doxazosin; Baf-A1, bafilomycin A1; EBSS, earle’s balanced salt solution; CQ, chloroquine. Notes: For (A, B, D and E): *P<0.05, ***P < 0.001 compared with the DMSO group. For (C): ***P < 0.001 compared with the DMSO group; *P<0.05 compared with the Dox group. For (F): *P<0.05, ***P < 0.001 compared with the CCl4 group. For all: #P<0.05, ##P < 0.01, ###P < 0.001, NS (not significant), compared between the two indicated groups or among the six groups. |
To further investigate the mechanism underlying autophagosome accumulation, we transfected LX-2 cells with GFP-LC3 adenovirus, and punctate staining of GFP-LC3 indicated autophagosomes. As shown in Figure 4C, after infection with control siRNA, doxazosin (10 μM, 24 h) treatment significantly increased the number of GFP-LC3 puncta compared with that in the DMSO (24 h) treatment group in both the absence and presence of Baf-A1 (100 nM, 24 h), a late-stage autophagic inhibitor that primarily impacts intralysosomal degradation by blocking autophagosome acidification and autophagosome-lysosome fusion.27 It is worth noting that the increases in autophagosome accumulation and p62 expression were not significantly different among the doxazosin, Baf-A1, and doxazosin+Baf-A1 treatment groups, which was verified by immunoblotting (Figure 4D) and qRT-PCR (Figure S1A).
However, when ATG5, an E3 ubiquitin-like ligase required for autophagy, was silenced with a small interfering RNA (siATG5) (Figure S1B and C), the doxazosin (10 μM, 24 h)-mediated promotion of autophagosome accumulation was significantly reduced (Figure 4C), and siATG5 significantly increased the doxazosin-induced augmentation of p62, which was confirmed by immunoblotting assays (Figure 4D) and qRT-PCR (Figure S1D). These results indicated that doxazosin did not induce autophagy but rather suppressed autophagic flux in LX-2 cells.
To further investigate the effect of doxazosin treatment on autophagic flux, a GFP-RFP-LC3 adenovirus was transfected into LX-2 cells, and the cells were treated with DMSO, earle’s balanced salt solution (EBSS), CQ (30 μM), and doxazosin (10 μM) for 24 h. Then, immunofluorescence was evaluated by confocal microscopy. The principle of this assay depends on the difference in pH. During the process of autophagy, GFP is degraded, whereas RFP is retained when autophagosomes (pH: neutral) fuse with lysosomes to form autophagolysosomes (pH: acidic). Therefore, yellow puncta represent autophagosomes, and red puncta indicate autophagolysosomes in the merged images.28 Cells treated with DMSO showed the fewest yellow puncta (autophagosomes), while cells treated with EBSS showed the most red puncta (autophagic lysosomes) compared with those in the other three groups. Similar to CQ, a late-stage autophagic inhibitor, doxazosin significantly increased the number of yellow puncta in LX-2 cells compared with those in the DMSO group, and the numbers of yellow puncta were not significantly different in the CQ and doxazosin groups (Figure 4E), demonstrating that the downstream steps of autophagic flux were indeed suppressed by doxazosin in LX-2 cells.
Subsequently, to elucidate the effect of doxazosin treatment on autophagic flux in HSCs in vivo, an mCherry-EGFP-LC3 adeno-associated virus was injected into mice via their tail veins (100 μL) four weeks before sacrifice to act on the liver. Activated HSCs are characterized by positive α-SMA staining, and we specifically discuss the variations in autophagic flux in activated HSCs below. Compared with those in the olive oil group, the number of red puncta in the CCl4 group was significantly increased, while the number of yellow puncta was altered but not significantly different (Figure 4F), which indicated that fibrosis increased the number of autophagolysosomes in mouse HSCs. However, the increase in autophagolysosomes was significantly reversed by doxazosin treatment (Figure 4F), and the significant increase in yellow puncta indicated that autophagy was inhibited. Overall, these results suggested that doxazosin inhibited autophagy in activated HSCs both in vivo and in vitro.
Doxazosin Induces Apoptosis of Activated HSCs
To verify the effect of doxazosin on HSC apoptosis, immunoblotting, TUNEL and flow cytometry assays were performed on LX-2 cells. The protein expression levels of Bax (a proapoptotic protein) and cleaved PARP in the doxazosin-treated groups (5, 10, and 15 μM) were significantly higher than those in the DMSO group, and the expression levels of Bcl-2 (an antiapoptotic protein) were significantly decreased (Figure 5A). In addition, the TUNEL assay showed that the apoptotic ratios (purple nuclei in merged images represented apoptotic cells) in the doxazosin-treated groups (5, 10, and 15 μM) were significantly higher than those in the DMSO group, and the effect of doxazosin on apoptosis was concentration-dependent (Figure 5B). Furthermore, the flow cytometry results indicated that apoptosis was induced by doxazosin in a dose- and time-dependent manner in LX-2 cells (Figure 5C), which was consistent with the experimental results described above. Finally, we performed TUNEL assays and immunofluorescent α-SMA staining in the four groups of mice, revealing that doxazosin (5 and 10 mg/(kg*day)) significantly induced apoptosis of activated HSCs in mice with CCl4-induced fibrosis (Figure 5D). In summary, these results indicated that doxazosin promoted apoptosis of activated HSCs.
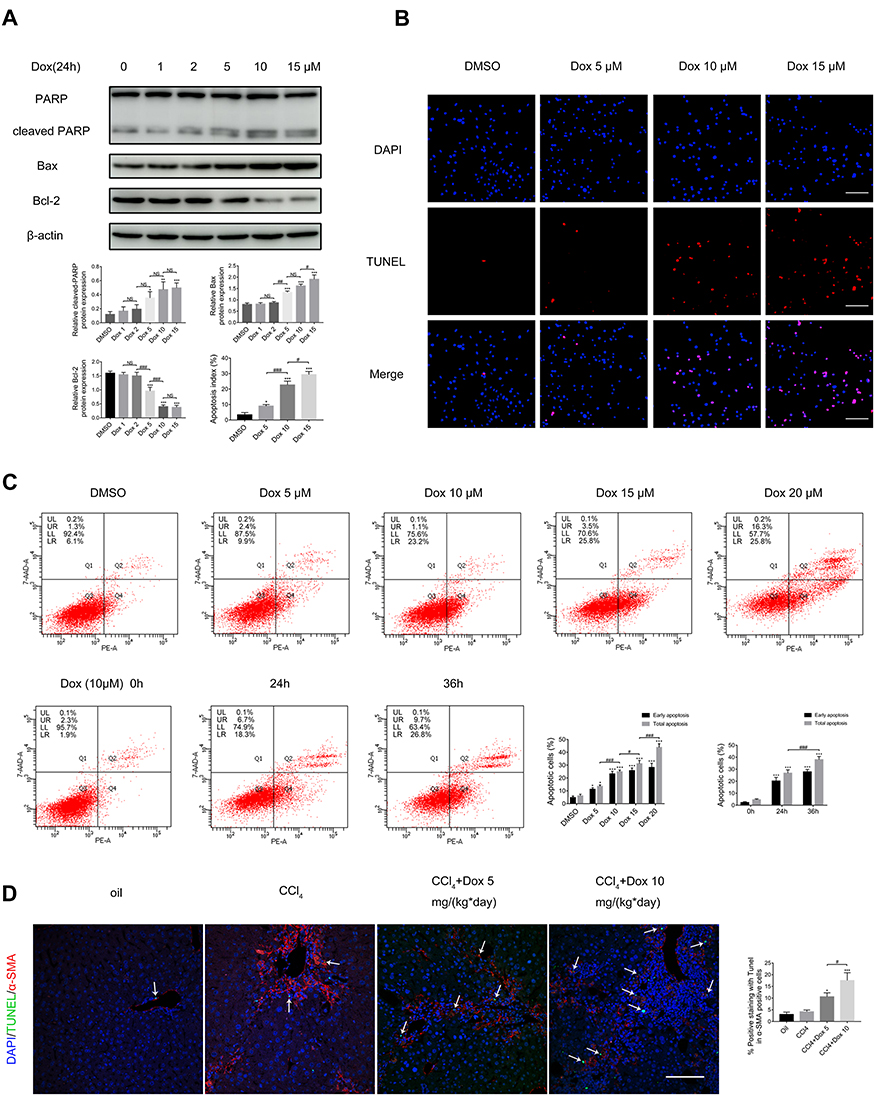 |
Figure 5 Doxazosin promotes the apoptosis of hepatic stellate cells. (A) The levels of apoptosis-related proteins (cleaved PARP, Bax, and Bcl-2) in LX-2 cells were measured by immunoblotting. (B) Representative images of TUNEL staining in LX-2 cells. Scale bar, 100 μm. (C) The apoptosis ratios of LX-2 cells were measured and analyzed by flow cytometry. (D) The TUNEL assay was performed to detect apoptosis in liver tissues, and the arrows indicate positive TUNEL staining in α-SMA-positive cells. Red: α-SMA; green: apoptotic cells; blue: nucleus. Scale bar, 100 μm. Abbreviation: Dox, doxazosin. Notes: For (A–C) *P<0.05, **P < 0.01, ***P < 0.001 compared with the DMSO group. For (D): *P<0.05, ***P < 0.001 compared with the CCl4 group. For all, #P<0.05, ##P < 0.01, ###P < 0.001, NS (not significant), compared between the two indicated groups. |
Doxazosin Inhibits Autophagy by Activating of the PI3K/Akt/mTOR Signaling Pathway in HSCs
Autophagy is a complicated process that is regulated by various signaling pathways, such as PI3K/Akt/mTOR. To clarify whether doxazosin inhibits autophagy in HSCs by activating the PI3K/Akt/mTOR pathway, we first measured the protein levels of p-PI3K, total PI3K, p-Akt, total Akt, p-mTOR, and total mTOR in LX-2 cells treated with doxazosin (5, 10, and 15 µM; DMSO was used as a control) for 24 h, or with 10 μM doxazosin for 6, 12 and 24 h (DMSO for 24 h was used as a control). The immunoblotting results showed significant dose- and time-dependent increases in the levels of p-PI3K, p-Akt, and p-mTOR in doxazosin-treated LX-2 cells compared with the control group (Figure 6A and B). Therefore, we concluded that the PI3K/Akt/mTOR pathway may profoundly participate in doxazosin-induced autophagy inhibition in HSCs.
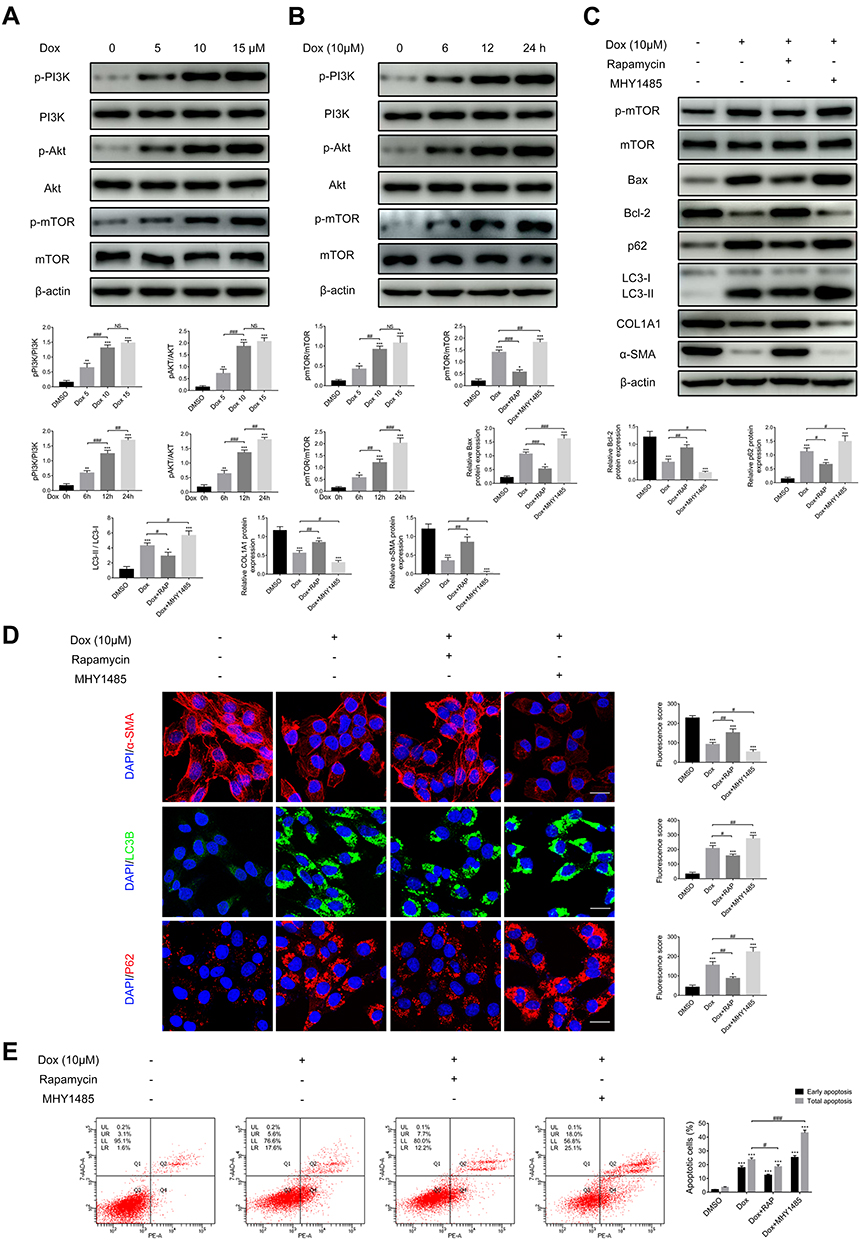 |
Figure 6 Doxazosin inhibits autophagy by activating the PI3K/Akt/mTOR signaling pathway in LX-2 cells. The protein levels of p-PI3K, total PI3K, p-Akt, total Akt, p-mTOR, and total mTOR in LX-2 cells treated with the indicated concentrations of doxazosin (A) for the indicated times (B) were measured by immunoblotting. LX-2 cells were treated with the indicated chemicals. The protein levels of p-mTOR, total mTOR, Bax, Bcl-2, p62, LC3B, COL1A1 and α-SMA were revealed by immunoblotting (C), while those of α-SMA, LC3B and p62 were revealed by immunofluorescence ((D), Scale bar, 50 μm), and apoptosis was evaluated by flow cytometry (E). Abbreviations: Dox, doxazosin; RAP, rapamycin. Notes: *P<0.05, **P < 0.01, ***P < 0.001 compared with the DMSO group. #P<0.05, ##P < 0.01, ###P < 0.001, NS (not significant), compared between the two indicated groups. |
The protein kinase mTOR is a pivotal element in the PI3K/Akt/mTOR signaling pathway. To determine whether doxazosin attenuates liver fibrosis by regulating the expression of p-mTOR and thereby inhibiting autophagy, rapamycin (an inhibitor of mTOR) and MHY1485 (an agonist of mTOR) were used. The increased expression of p-mTOR in doxazosin-treated (10 μM, 24h) cells was significantly suppressed by coincubation with rapamycin (100 nM, 24h) (Figure 6C). In addition, the expression levels of fibrosis-related proteins, including α-SMA and COL1A1, were significantly increased by treatment with both doxazosin and rapamycin compared with doxazosin alone (Figure 6C and D), indicating that doxazosin may inhibit liver fibrosis by upregulating p-mTOR. Next, we measured the levels of autophagy-related proteins (LC3B and p62), revealing that the inhibitory effect of doxazosin on autophagy was significantly reversed by cotreatment with rapamycin (Figure 6C and D). Furthermore, the expression levels of apoptosis-related proteins (Bax and Bcl-2) were measured, and the results indicated that the doxazosin-mediated induction of apoptosis was significantly reversed by coincubation with rapamycin (Figure 6C); this result was also verified by flow cytometry (Figure 6E). MHY1485 (10 μM, 24h) and doxazosin (10 μM, 24h) coadministration was used to confirm the hypothesis in the opposite way (Figure 6C–E).
These data suggested that the PI3K/Akt/mTOR signaling pathway played an important role in mediating doxazosin-induced autophagy inhibition to attenuate fibrosis in HSCs and that apoptosis was involved in this process.
Discussion
Fibrosis can lead to severe liver dysfunction, which is closely associated with high morbidity, but there are currently no effective treatments. PHT is one of the most severe complications in patients with liver cirrhosis. A recent systematic review revealed that carvedilol, an inhibitor of β1-, β2- and α1-adrenoreceptors, was more effective than traditional NSBBs at decreasing portal pressure.25 Another study suggested that carvedilol was superior to propranolol in improving the functional state of the liver in subjects with paracetamol-induced acute toxic hepatitis and at attenuating CCl4-induced hepatic injury and fibrogenesis.29 Unlike traditional NSBBs, carvedilol beneficially inhibits α1AR as well. Because α1AR, which is distributed on the HSC membrane, was reported to help regulate the development of liver fibrosis,30 we hypothesized that the inhibition of α1AR is very important for reducing liver damage in subjects with liver fibrosis and that an α1AR antagonist could be used to test this hypothesis. Doxazosin, a traditional inhibitor of α1AR, has shown antifibrotic effects by reducing the secretion of transforming growth factor β in hamsters,31 which provides insight for antifibrotic treatments. Therefore, doxazosin was used in our study to investigate our hypothesis.
Liver fibrosis is usually characterized by the activation, migration and proliferation of HSCs and by fibrogenesis.32 Activated HSCs usually transform into myofibroblasts, which have profibrogenic properties and secrete α-SMA and COLI (formed by two molecules of COL1A1 and one molecule of COL1A2);6,7 thus, we measured the expression of α-SMA and COL1A1 to estimate the degree of HSC activation. Because α-SMA is almost entirely produced by activated HSCs in the liver, it was used as a marker of activated HSCs in our study.33 LX-2 cells are HSCs that are partly activated during the culture process, and numerous studies have used untreated LX-2 cells as a control model of liver fibrosis for autophagy research.17,34 Few studies have focused on the effect of doxazosin on activated HSCs. Our study showed that doxazosin inhibited not only the proliferation and activation of HSCs but also the migration of activated HSCs in vitro. A CCl4-induced liver fibrosis model was established to determine the antifibrotic effects of doxazosin and its mechanism in our study. The results indicated that doxazosin could reduce HSC activation in vivo and protect against the development of CCl4-induced fibrosis. Consequently, we believe that doxazosin is a promising therapeutic for attenuating liver fibrosis and injury.
Previous studies have indicated that doxazosin induces the apoptosis of prostate cancer cells and that this process is mediated by autophagy.26 Doxazosin can induce autophagy and increase the anticancer effects of osimertinib in cancer cells and cancer stem cells.35 Previous studies have confirmed that autophagy plays an important role in the activation of HSCs.5 HSC activation is accompanied by enhanced autophagic flux, and autophagy inhibition partially suppresses HSC activation.36 Currently, an increasing number of researchers are focusing on autophagy regulation in the liver to elucidate novel strategies for overcoming liver fibrosis,37,38 as these treatments have extensive prospects. We previously reported that carvedilol attenuated liver fibrosis by blocking autophagy in HSCs.17 In the present study, we accidentally found that doxazosin caused autophagosomes to accumulate in HSCs. However, this phenomenon occurred not only when autophagy was activated but also when autophagosomes were not effectively eliminated. To explain our findings, GFP-LC3 and GFP-RFP-LC3 adenoviruses and autophagy regulators were used, and the results suggested that doxazosin blocked autophagy in HSCs in vitro. To further confirm our findings, an mCherry-EGFP-LC3 adeno-associated virus was administered to mice, and the results showed that doxazosin suppressed autophagy in activated HSCs in vivo. Given that doxazosin alone protected against HSC damage, its role in autophagy was demonstrated experimentally. The recent results undoubtedly warrant an investigation of the mechanism by which doxazosin affects autophagy to alleviate liver fibrosis.
As mentioned previously, doxazosin can restrict the proliferation of LX-2 cells and suppress autophagy in HSCs, but the mechanism triggering the death of activated HSCs remains unknown. Cell apoptosis may explain this phenomenon because of its intimate association with autophagy.39 Doxazosin can promote apoptosis in benign and malignant prostate cells through a death receptor-mediated pathway40 and induce the apoptosis of breast cancer cells by inhibiting EGFR and NF-κB signaling,41 suggesting that it protects against disease by promoting apoptosis. Activated HSCs express death receptors, and apoptosis is stimulated when they are bound to their ligands.42 HSC apoptosis during the resolution of liver fibrosis is conducive to reducing the number of activated HSCs, and activated HSCs and excessive ECM accumulation contribute to the progression of fibrosis,5 demonstrating that inducing the apoptosis of activated HSCs plays an essential role in attenuating liver fibrosis. Thus, we measured the expression levels of representative apoptosis-related proteins and the apoptosis rates in HSCs, revealing that doxazosin induced the apoptosis of activated HSCs in vitro and in vivo, suggesting that it combats liver fibrosis by promoting HSC apoptosis.
Previous studies have shown that IL-10 inhibits Ang II-mediated pathological autophagy by activating the PI3K/Akt/mTOR pathway.43 Saikosaponin d attenuates pancreatic fibrosis by suppressing autophagy in pancreatic stellate cells through the PI3K/Akt/mTOR pathway.44 IGFBPrP1 promotes autophagy and HSC activation by mutually regulating H19 and the PI3K/AKT/mTOR pathway.45 The PI3K/Akt/mTOR pathway is crucial for autophagy in activated HSCs,11 and the antiangiogenic effect of doxazosin on experimental choroidal neovascularization has been suggested to be closely associated with the PI3K/Akt/mTOR pathway;46 thus, we hypothesize that this is the dominant signaling pathway by which doxazosin, autophagy, apoptosis, and HSC activation are associated. Therefore, we first measured the levels of p-PI3K, p-Akt, and p-mTOR in doxazosin-treated HSCs, revealing that they were dose- and time-dependently significantly increased and thereby demonstrating that doxazosin activated the PI3K/Akt/mTOR pathway to a certain extent. To further explore whether doxazosin ameliorates liver fibrosis through this classic autophagy-related signaling pathway, a mTOR inhibitor (rapamycin) and agonist (MHY1485) were used in our study. The coadministration of rapamycin and doxazosin reversed the doxazosin-induced antifibrotic effects, autophagy inhibition, and apoptosis acceleration in HSCs, and these effects of doxazosin were enhanced in HSCs treated with both MHY1485 and doxazosin. To our knowledge, this is the first study to clarify the mechanism by which doxazosin inhibits liver fibrosis by suppressing autophagy in activated HSCs. In our study, we found that doxazosin significantly activated the PI3K/Akt/mTOR signaling cascade in HSCs and confirmed that doxazosin exerted an antifibrotic effect through this pathway.
Conclusion
The present study mainly revealed that doxazosin protected against liver fibrosis by activating the PI3K/Akt/mTOR signaling pathway, thereby inhibiting autophagy and inducing the apoptosis of activated HSCs. Moreover, our findings further our understanding of the therapeutic effects of doxazosin on liver fibrosis for clinical applications.
Statement of Ethics
This study was carried out in strict accordance with the National Institute of Health Guidelines for the Care and Use of Laboratory Animals. The protocol was approved by the Animal Care and Utilization Committee of Shandong Provincial Hospital affiliated with Shandong University (NSFC: no. 2019-251).
Acknowledgments
This research was supported by grants from the National Nature Foundation of China (81770606 and 81970533).
Disclosure
The authors have no conflicts of interest to declare in relation to this study.
References
1. Arroyo V, Angeli P, Moreau R, et al. The systemic inflammation hypothesis: towards a new paradigm of acute decompensation and multiorgan failure in cirrhosis. J Hepatol. 2021;74(3):670–685. doi:10.1016/j.jhep.2020.11.048
2. Trautwein C, Friedman SL, Schuppan D, Pinzani M. Hepatic fibrosis: concept to treatment. J Hepatol. 2015;62(1):S15–S24. doi:10.1016/j.jhep.2015.02.039
3. Lozano R, Naghavi M, Foreman K, et al. Global and regional mortality from 235 causes of death for 20 age groups in 1990 and 2010: a systematic analysis for the Global Burden of Disease Study 2010. Lancet. 2012;380(9859):2095–2128. doi:10.1016/S0140-6736(12)61728-0
4. Sun M, Kisseleva T. Reversibility of liver fibrosis. Clin Res Hepatol Gastroenterol. 2015;39(Suppl 1):S60–S63. doi:10.1016/j.clinre.2015.06.015
5. Tsuchida T, Friedman SL. Mechanisms of hepatic stellate cell activation. Nat Rev Gastroenterol Hepatol. 2017;14(7):397–411. doi:10.1038/nrgastro.2017.38
6. Hellerbrand C, Stefanovic B, Giordano F, Burchardt ER, Brenner DA. The role of TGFbeta1 in initiating hepatic stellate cell activation in vivo. J Hepatol. 1999;30(1):77–87. doi:10.1016/s0168-8278(99)80010-5
7. Chang SW, Shefelbine SJ, Buehler MJ. Structural and mechanical differences between collagen homo- and heterotrimers: relevance for the molecular origin of brittle bone disease. Biophys J. 2012;102(3):640–648. doi:10.1016/j.bpj.2011.11.3999
8. Mallat A, Lodder J, Teixeira-Clerc F, Moreau R, Codogno P, Lotersztajn S. Autophagy: a multifaceted partner in liver fibrosis. Biomed Res Int. 2014;2014:869390. doi:10.1155/2014/869390
9. Ba L, Gao J, Chen Y, et al. Allicin attenuates pathological cardiac hypertrophy by inhibiting autophagy via activation of PI3K/Akt/mTOR and MAPK/ERK/mTOR signaling pathways. Phytomedicine. 2019;58:152765. doi:10.1016/j.phymed.2018.11.025
10. Varshney P, Saini N. PI3K/AKT/mTOR activation and autophagy inhibition plays a key role in increased cholesterol during IL-17A mediated inflammatory response in psoriasis. Biochim Biophys Acta Mol Basis Dis. 2018;1864(5):1795–1803. doi:10.1016/j.bbadis.2018.02.003
11. Wang H, Liu Y, Wang D, et al. The upstream pathway of mTOR-mediated autophagy in liver diseases. Cells-Basel. 2019;8(12):1597. doi:10.3390/cells8121597
12. Thoen LF, Guimaraes EL, Dolle L, et al. A role for autophagy during hepatic stellate cell activation. J Hepatol. 2011;55(6):1353–1360. doi:10.1016/j.jhep.2011.07.010
13. Duran A, Hernandez ED, Reina-Campos M, et al. p62/SQSTM1 by binding to vitamin D receptor inhibits hepatic stellate cell activity, fibrosis, and liver cancer. Cancer Cell. 2016;30(4):595–609. doi:10.1016/j.ccell.2016.09.004
14. Kim KM, Han CY, Kim JY, et al. Galpha12 overexpression induced by miR-16 dysregulation contributes to liver fibrosis by promoting autophagy in hepatic stellate cells. J Hepatol. 2018;68(3):493–504. doi:10.1016/j.jhep.2017.10.011
15. Ling L, Li G, Wang G, Meng D, Li Z, Zhang C. Carvedilol improves liver cirrhosis in rats by inhibiting hepatic stellate cell activation, proliferation, invasion and collagen synthesis. Mol Med Rep. 2019;20(2):1605–1612. doi:10.3892/mmr.2019.10401
16. Wu Y, Li Z, Xiu AY, Meng DX, Wang SN, Zhang CQ. Carvedilol attenuates carbon tetrachloride-induced liver fibrosis and hepatic sinusoidal capillarization in mice. Drug Des Devel Ther. 2019;13:2667–2676. doi:10.2147/DDDT.S210797
17. Meng D, Li Z, Wang G, Ling L, Wu Y, Zhang C. Carvedilol attenuates liver fibrosis by suppressing autophagy and promoting apoptosis in hepatic stellate cells. Biomed Pharmacother. 2018;108:1617–1627. doi:10.1016/j.biopha.2018.10.005
18. Allaire M, Rautou PE, Codogno P, Lotersztajn S. Autophagy in liver diseases: time for translation? J Hepatol. 2019;70(5):985–998. doi:10.1016/j.jhep.2019.01.026
19. Chapman N, Chen CY, Fujita T, et al. Time to re-appraise the role of alpha-1 adrenoceptor antagonists in the management of hypertension? J Hypertens. 2010;28(9):1796–1803. doi:10.1097/HJH.0b013e32833b912c
20. Fulton B, Wagstaff AJ, Sorkin EM. Doxazosin. An update of its clinical pharmacology and therapeutic applications in hypertension and benign prostatic hyperplasia. Drugs. 1995;49(2):295–320. doi:10.2165/00003495-199549020-00011
21. Shaw YJ, Yang YT, Garrison JB, Kyprianou N, Chen CS. Pharmacological exploitation of the alpha1-adrenoreceptor antagonist doxazosin to develop a novel class of antitumor agents that block intracellular protein kinase B/Akt activation. J Med Chem. 2004;47(18):4453–4462. doi:10.1021/jm049752k
22. Cervantes-Garcia D, Cuellar-Juarez AG, Borrego-Soto G, et al. Adenoviralbone morphogenetic protein7 and/or doxazosin therapies promote the reversion of fibrosis/cirrhosis in a cirrhotic hamster model. Mol Med Rep. 2017;16(6):9431–9440. doi:10.3892/mmr.2017.7785
23. Serna-Salas SA, Navarro-Gonzalez YD, Martinez-Hernandez SL, et al. Doxazosin and carvedilol treatment improves hepatic regeneration in a hamster model of cirrhosis. Biomed Res Int. 2018;2018:4706976. doi:10.1155/2018/4706976
24. Albillos A, Lledo JL, Banares R, et al. Hemodynamic effects of alpha-adrenergic blockade with prazosin in cirrhotic patients with portal hypertension. Hepatology. 1994;20(3):611–617.
25. Zacharias AP, Jeyaraj R, Hobolth L, Bendtsen F, Gluud LL, Morgan MY. Carvedilol versus traditional, non-selective beta-blockers for adults with cirrhosis and gastroesophageal varices. Cochrane Database Syst Rev. 2018;10:D11510. doi:10.1002/14651858.CD011510.pub2
26. Forbes A, Anoopkumar-Dukie S, Chess-Williams R, McDermott C. Relative cytotoxic potencies and cell death mechanisms of alpha1 -adrenoceptor antagonists in prostate cancer cell lines. Prostate. 2016;76(8):757–766. doi:10.1002/pros.23167
27. Mizushima N, Yoshimori T, Levine B. Methods in mammalian autophagy research. Cell. 2010;140(3):313–326. doi:10.1016/j.cell.2010.01.028
28. Feng D, Wang B, Wang L, et al. Pre-ischemia melatonin treatment alleviated acute neuronal injury after ischemic stroke by inhibiting endoplasmic reticulum stress-dependent autophagy via PERK and IRE1 signalings. J Pineal Res. 2017;62(3):e12395. doi:10.1111/jpi.12395
29. Abdel-Kawy HS. Effect of carvedilol versus propranolol on acute and chronic liver toxicity in rats. Drug Chem Toxicol. 2021;44(1):101–111. doi:10.1080/01480545.2019.1576718
30. Puschel GP. Control of hepatocyte metabolism by sympathetic and parasympathetic hepatic nerves. Anat Rec a Discov Mol Cell Evol Biol. 2004;280(1):854–867. doi:10.1002/ar.a.20091
31. Munoz-Ortega MH, Llamas-Ramirez RW, Romero-Delgadillo NI, et al. Doxazosin treatment attenuates carbon tetrachloride-induced liver fibrosis in hamsters through a decrease in transforming growth factor beta secretion. Gut Liver. 2016;10(1):101–108. doi:10.5009/gnl14459
32. Kostallari E, Hirsova P, Prasnicka A, et al. Hepatic stellate cell-derived platelet-derived growth factor receptor-alpha-enriched extracellular vesicles promote liver fibrosis in mice through SHP2. Hepatology. 2018;68(1):333–348. doi:10.1002/hep.29803
33. Xu M, Xu HH, Lin Y, et al. LECT2, a ligand for Tie1, plays a crucial role in liver fibrogenesis. Cell. 2019;178(6):1478–1492. doi:10.1016/j.cell.2019.07.021
34. Zhang Z, Guo M, Li Y, et al. RNA-binding protein ZFP36/TTP protects against ferroptosis by regulating autophagy signaling pathway in hepatic stellate cells. Autophagy. 2020;16(8):1482–1505. doi:10.1080/15548627.2019.1687985
35. Suzuki S, Yamamoto M, Sanomachi T, et al. Doxazosin, a classic alpha 1-adrenoceptor antagonist, overcomes osimertinib resistance in cancer cells via the upregulation of autophagy as drug repurposing. Biomedicines. 2020;8(8):273. doi:10.3390/biomedicines8080273
36. Thoen LF, Guimaraes EL, Grunsven LA. Autophagy: a new player in hepatic stellate cell activation. Autophagy. 2012;8(1):126–128. doi:10.4161/auto.8.1.18105
37. Gao J, Wei B, de Assuncao TM, et al. Hepatic stellate cell autophagy inhibits extracellular vesicle release to attenuate liver fibrosis. J Hepatol. 2020;73(5):1144–1154. doi:10.1016/j.jhep.2020.04.044
38. Jia D, Wang YY, Wang P, et al. SVIP alleviates CCl4-induced liver fibrosis via activating autophagy and protecting hepatocytes. Cell Death Dis. 2019;10(2):71. doi:10.1038/s41419-019-1311-0
39. Gordy C, He YW. The crosstalk between autophagy and apoptosis: where does this lead? Protein Cell. 2012;3(1):17–27. doi:10.1007/s13238-011-1127-x
40. Garrison JB, Kyprianou N. Doxazosin induces apoptosis of benign and malignant prostate cells via a death receptor-mediated pathway. Cancer Res. 2006;66(1):464–472. doi:10.1158/0008-5472.CAN-05-2039
41. Hui H, Fernando MA, Heaney AP. The alpha1-adrenergic receptor antagonist doxazosin inhibits EGFR and NF-kappaB signalling to induce breast cancer cell apoptosis. Eur J Cancer. 2008;44(1):160–166. doi:10.1016/j.ejca.2007.10.002
42. Pellicoro A, Ramachandran P, Iredale JP, Fallowfield JA. Liver fibrosis and repair: immune regulation of wound healing in a solid organ. Nat Rev Immunol. 2014;14(3):181–194. doi:10.1038/nri3623
43. Kishore R, Krishnamurthy P, Garikipati VN, et al. Interleukin-10 inhibits chronic angiotensin II-induced pathological autophagy. J Mol Cell Cardiol. 2015;89(Pt B):203–213. doi:10.1016/j.yjmcc.2015.11.004
44. Cui LH, Li CX, Zhuo YZ, Yang L, Cui NQ, Zhang SK. Saikosaponin d ameliorates pancreatic fibrosis by inhibiting autophagy of pancreatic stellate cells via PI3K/Akt/mTOR pathway. Chem Biol Interact. 2019;300:18–26. doi:10.1016/j.cbi.2019.01.005
45. Huang TJ, Ren JJ, Zhang QQ, et al. IGFBPrP1 accelerates autophagy and activation of hepatic stellate cells via mutual regulation between H19 and PI3K/AKT/mTOR pathway. Biomed Pharmacother. 2019;116:109034. doi:10.1016/j.biopha.2019.109034
46. Guo J, Luo X, Liang J, Xiao M, Sun X. Antiangiogenic effects of doxazosin on experimental choroidal neovascularization in mice. J Ocul Pharmacol Ther. 2017;33(1):50–56. doi:10.1089/jop.2016.0153
 © 2021 The Author(s). This work is published and licensed by Dove Medical Press Limited. The full terms of this license are available at https://www.dovepress.com/terms.php and incorporate the Creative Commons Attribution - Non Commercial (unported, v3.0) License.
By accessing the work you hereby accept the Terms. Non-commercial uses of the work are permitted without any further permission from Dove Medical Press Limited, provided the work is properly attributed. For permission for commercial use of this work, please see paragraphs 4.2 and 5 of our Terms.
© 2021 The Author(s). This work is published and licensed by Dove Medical Press Limited. The full terms of this license are available at https://www.dovepress.com/terms.php and incorporate the Creative Commons Attribution - Non Commercial (unported, v3.0) License.
By accessing the work you hereby accept the Terms. Non-commercial uses of the work are permitted without any further permission from Dove Medical Press Limited, provided the work is properly attributed. For permission for commercial use of this work, please see paragraphs 4.2 and 5 of our Terms.