Back to Journals » International Journal of General Medicine » Volume 14
Dose–Response Relationship Between BMI and Hyperuricemia
Authors Yang L, He Z, Gu X, Cheng H ![]() , Li L
, Li L
Received 2 October 2021
Accepted for publication 27 October 2021
Published 12 November 2021 Volume 2021:14 Pages 8065—8071
DOI https://doi.org/10.2147/IJGM.S341622
Checked for plagiarism Yes
Review by Single anonymous peer review
Peer reviewer comments 2
Editor who approved publication: Dr Scott Fraser
Lu Yang,1 Zhen’an He,2 Xuan Gu,3 Hao Cheng,4 Lin Li5
1Hepatobiliary and Pancreatic Surgery, Shulan (Hangzhou) Hospital City, Hangzhou, Zhejiang Province, People’s Republic of China; 2Shaanxi Institute of Medical Device Quality Supervision and Inspection, Xi’an City, Shaanxi Province, People’s Republic of China; 3Xi’an Hospital of Civil Aviation, Xi’an City, Shaanxi Province, People’s Republic of China; 4Department of Ultrasonography, Shaanxi Cancer Hospital Affiliated to Xi’an Jiaotong University, Xi’an City, Shaanxi Province, People’s Republic of China; 5Shaanxi Cancer Hospital Affiliated to Xi’an Jiaotong University, Xi’an City, Shaanxi Province, People’s Republic of China
Correspondence: Hao Cheng; Lin Li Email [email protected]; [email protected]
Objective: The purpose of the current study is to explore the demographic characteristics of hyperuricemia in China.
Study Design: The cross-sectional study was conducted, and the CHARLS dataset in 2011 was used.
Methods: Logistic regression model was used to assess the association between BMI and hyperuricemia. We also used restricted cubic spline with three knots to assess the dose–response relationship. To investigate the differences in dose–response relationships in various groups, stratification analysis was conducted.
Results: Of the 9408 middle and older participants, those who were overweight or obese had higher risk for hyperuricemia (OR=1.26, 95% CI=1.01– 1.57; OR=1.90, 95% CI=1.46– 2.47). In the subgroup, the effect of obesity on hyperuricemia was robust in varying gender and age. However, among overweight group, those with being male and aged over 60 years had higher risk for hyperuricemia (male: OR=1.42, 95% CI=1.07– 1.90; over 60 years: OR=1.28, 95% CI=1.03– 1.60). A dose-response relationship was examined between BMI and the risk of hyperuricemia. The result showed that the odds ratio of hyperuricemia and BMI displayed U-shaped nonlinear relationship (Ptrend< 0.001, non-linear P< 0.001).
Conclusion: The association between BMI and hyperuricemia showed positive relationship. Specifically, the group with male and age over 60 years had higher risk of hyperuricemia along with increased weight.
Keywords: body mass index, hyperuricemia, CHARLS, middle and older people
Introduction
Hyperuricemia is an abnormal increase in fasting blood uric acid caused by purine metabolism disorder. The prevalence of hyperuricemia in the United States is 21.2% in males and 21.6% in females,1 and the prevalence of hyperuricemia in Japan is 25.8% (males: 34.5%, females: 11.6%).1 A meta-analysis of 44 studies showed that the prevalence of hyperuricemia in mainland China was 13.3% (19.4% for males and 7.9% for females)2 which is lower than the prevalence in the United States and Japan.1,3 The prevalence rate in different regions of China also varies greatly. The prevalence rate in South China was 18.6%, far higher than the overall prevalence rate in mainland China.2
Hyperuricemia is associated with a variety of chronic diseases.4–6 Elevated serum urine levels increase the risk of cardiovascular disease,6–8 and hyperuricemia subjects tend to have a clustering of these cardiovascular risk factors. Hyperuricemia is also an independent risk factor for chronic kidney disease, which had been proved by large studies like National Health and Nutrition Examination Survey (NHANES) and the German Chronic Kidney Disease (GCKD) study.9,10 As an independent risk factor for type 2 diabetes, serum uric acid increased by 1mg/dL, and the risk of type 2 diabetes increased by 6%.11 Previous studies have shown a positive correlation between serum uric acid and hypertension,12 and elevated serum uric acid levels increase the risk of hypertension.
Many risk factors are associated with hyperuricemia, such as gender, smoking, advanced age, overweight or obesity, and central obesity. Two studies in China showed that the prevalence of hyperuricemia is higher in older adults.13,14 Different studies have confirmed that serum uric acid concentration and prevalence of hyperuricemia in men are higher than in women.1,14 Previous studies have shown that being overweight or obese, centripetal obesity, is associated with an increased risk of hyperuricemia.15
Body mass index (BMI) is associated with hyperuricemia, and previous studies showed that an increase in BMI increases the risk of hyperuricemia.16 However, the dose–response relationship between BMI and hyperuricemia has not been determined. The purpose of the current study is to explore the demographic characteristics of hyperuricemia in China through the data from China Health and Retirement Longitudinal Study (CHARLS), using data from CHARLS to explore the dose–response relationship between body mass index (BMI) and hyperuricemia.
Method
Study Design and Population
China Health and Retirement Longitudinal Study (CHARLS) is a nationally representative study; the sample was of community residents over 45 years of age and their spouses from 28 provinces in China. CHARLS adopted multistage probability sampling to evaluate the economic, social, and health status of community residents. Data collection was completed by personal interviews assisted with face-to-face computers. The design, methods, and other details of the CHARLS have been reported elsewhere.17 Data was downloaded from the official website (http://charls.pku.edu.cn/) of CHARLS.
The present study was based on data from the cross-sectional CHARLS data in 2011. We applied the following exclusion criteria when identifying eligible participants: 1) age less than 45 years; 2) missing or abnormal values of any variables used in the data analysis. Finally, 9408 participants were included in our study.
Outcome Variable
Hyperuricemia
The biomarkers were collected by trained medical staff and stored at the Chinese Center for Disease Control and Prevention (China CDC). Uric acid was composed of hyperuricemia and non-hyperuricemia by a threshold concentration of 7mg/dl for men and 6mg/dl for women. The Jaffe creatinine method was used to measure serum creatinine (SCr). This study used coefficient-modified CKD Epidemiology Collaboration (CKD-EPI) equation from Japanese30 to calculate eGFR (mL/min/1.73 m2) = 0.813 × 141 × min (SCr/κ, 1) α × max (SCr/κ, 1)−1.209 × 0.993 Age × 1.021 [if female] × 1.159 [if black], where κ is 0.7 for females and 0.9 for males, α is −0.329 for females and −0.411 for males, min () indicates the minimum between SCr/κ and 1, and max () indicates the maximum between SCr/κ and 1. According to kidney disease guidelines in 2012, individuals with eGFR < 60mL/min/1.73 m2 can be diagnosed with CKD.31
Body Mass Index
Body mass index (BMI) was calculated as weight in kilograms divided by height in meters squared. According to the overweight and obesity guidelines for Chinese adults,18 participants were grouped into four categories based upon their BMI: 1) underweight (<18.5 kg/m2), 2) normal-weight (18.5–23.9 kg/m2), 3) overweight (24–27.9 kg/m2) and (4) obese (≥28 kg/m2). Waist circumference was measured by trained medical staff placing a tape around the belly button of the participants and reading at the end of exhalation.
Covariates
Demographic characteristics were collected using a questionnaire that included age, gender, income, marital status, education, and hukou. Consistent with prior studies in China, participants were categorized into middle-aged (≥45 years and <60 years) adults and older adults (≥60 years) groups.19 Gender was divided into men and women. Monthly income was divided into <1000 RMB, 1000–3000 RMB, 3001–5000 RMB, and >5000RMB. The marital status was divided into married and unmarried. We classified the level of education into illiterate, primary school, middle/junior school, and university or above. The region was grouped as an urban or rural area by hukou. Chronic diseases included 13 diseases such as diabetes, dyslipidemia, cancer, and Stroke. Lifestyle factors included in the analysis were smoking (no-smoker and smoker) and drinking (non-drinker and drinker). LDL and HbA1c were all divided into normal and high by threshold values of 120 mg/dl and 6%, respectively.20,21 Hypertension in this study was determined based on the final blood pressure (SBP ≥140 mmHg, DBP ≥90 mmHg), a self-reported diagnosis of hypertension, or self-reported use of antihypertensive medications at data collection.
Statistical Analysis
Categorical variables utilize frequency and composition ratio were described. The logistic regression model was applied to assess the association between BMI and hyperuricemia. To test the stability of the logistic regression model, a set of models were used in the current study: Model 1 adjusted age and gender; Model 2 adjusted hukou, marital status, income, and education; Model 3 adjusted chronic disease, drink, smoke, HbA1c, LDL and hypertension. To explore the non-linear relationship, restricted cubic spline (RCS) with three knots coupled with a logistic regression model to assess the dose–response relationship between BMI (continuous variables) and hyperuricemia. To explore the difference in the dose–response relationship between males and females, gender stratification analysis was conducted, and to explore the difference in the dose–response relationship between middle-aged adults and older adults, age-type stratification analysis was conducted. Using STATA 16.1 (Stata Corporation, College Station, USA) to perform all analyses. All statistical tests were 2-sided, and statistical significance was determined at P<0.05.
Results
As shown in Table 1, of the 9408 participants, about 60% of the responses were middle-aged adults; approximately half (45.94%) were women; the majority lived in the rural area (82.75%), were married (83.78%). As for monthly income, participants reported <1000 RMB (14.69%), 1000–3000 RMB (15.05%), 3001–5000 RMB (11.75%), and >5000 RMB (58.51%). About 69.54% of the sample had a chronic disease. A large proportion of people had not the status of smoke (61.11%) and drink (67.55%). In our participants, 5.37% suffered hyperuricemia, 40.81% suffered Hypertension, 42.66% suffered higher low-density lipoprotein and 7.04% suffered higher HbA1c compared to 92.96%. Among healthy indicators, the proportion of abnormal weight among Chinese adults was 6.71%, 29.41%, and 11.65% in underweight, overweight, and obesity. The proportion of taking medicine for chronic disease was 37%. For the indicators of renal function, the mean serum creatinine was 0.77 (0.17) mg/dL, and the average eGFR was 75.88 (12.34) mL/min/ 1.73 m2. About 10% participants were defined as CKD (n=944,10.33%). The adjusted model 1, from Table 2, illustrated that compared to the individuals with normal-weight, overweight and obese were more likely to increase the risk of hyperuricemia (OR=1.42, 95% CI=1.15–1.75; OR=2.34, 95% CI=1.83–3.01) after controlling gender and age. In adjusted model 2, there is a significant risk of having hyperuricemia in overweight (OR=1.45, 95% CI=1.17–1.79) and obese group (OR=2.41, 95% CI= 1.99–3.11) than in the normal group, after further adjusting hukou, marital status, income, and education. In adjusted model 3, participants in the overweight group had still increased risk of having hyperuricemia (OR=1.26, 95% CI=1.01–1.57) and this ratio was 1.90 (95% CI=1.46–2.47) in the obese compared to those in the normal work time group after further restricting chronic disease, drink, smoke, HbA1c, LDL and hyperuricemia. As for the odds ratio of hyperuricemia, there was no difference between the normal-weight and underweight groups.
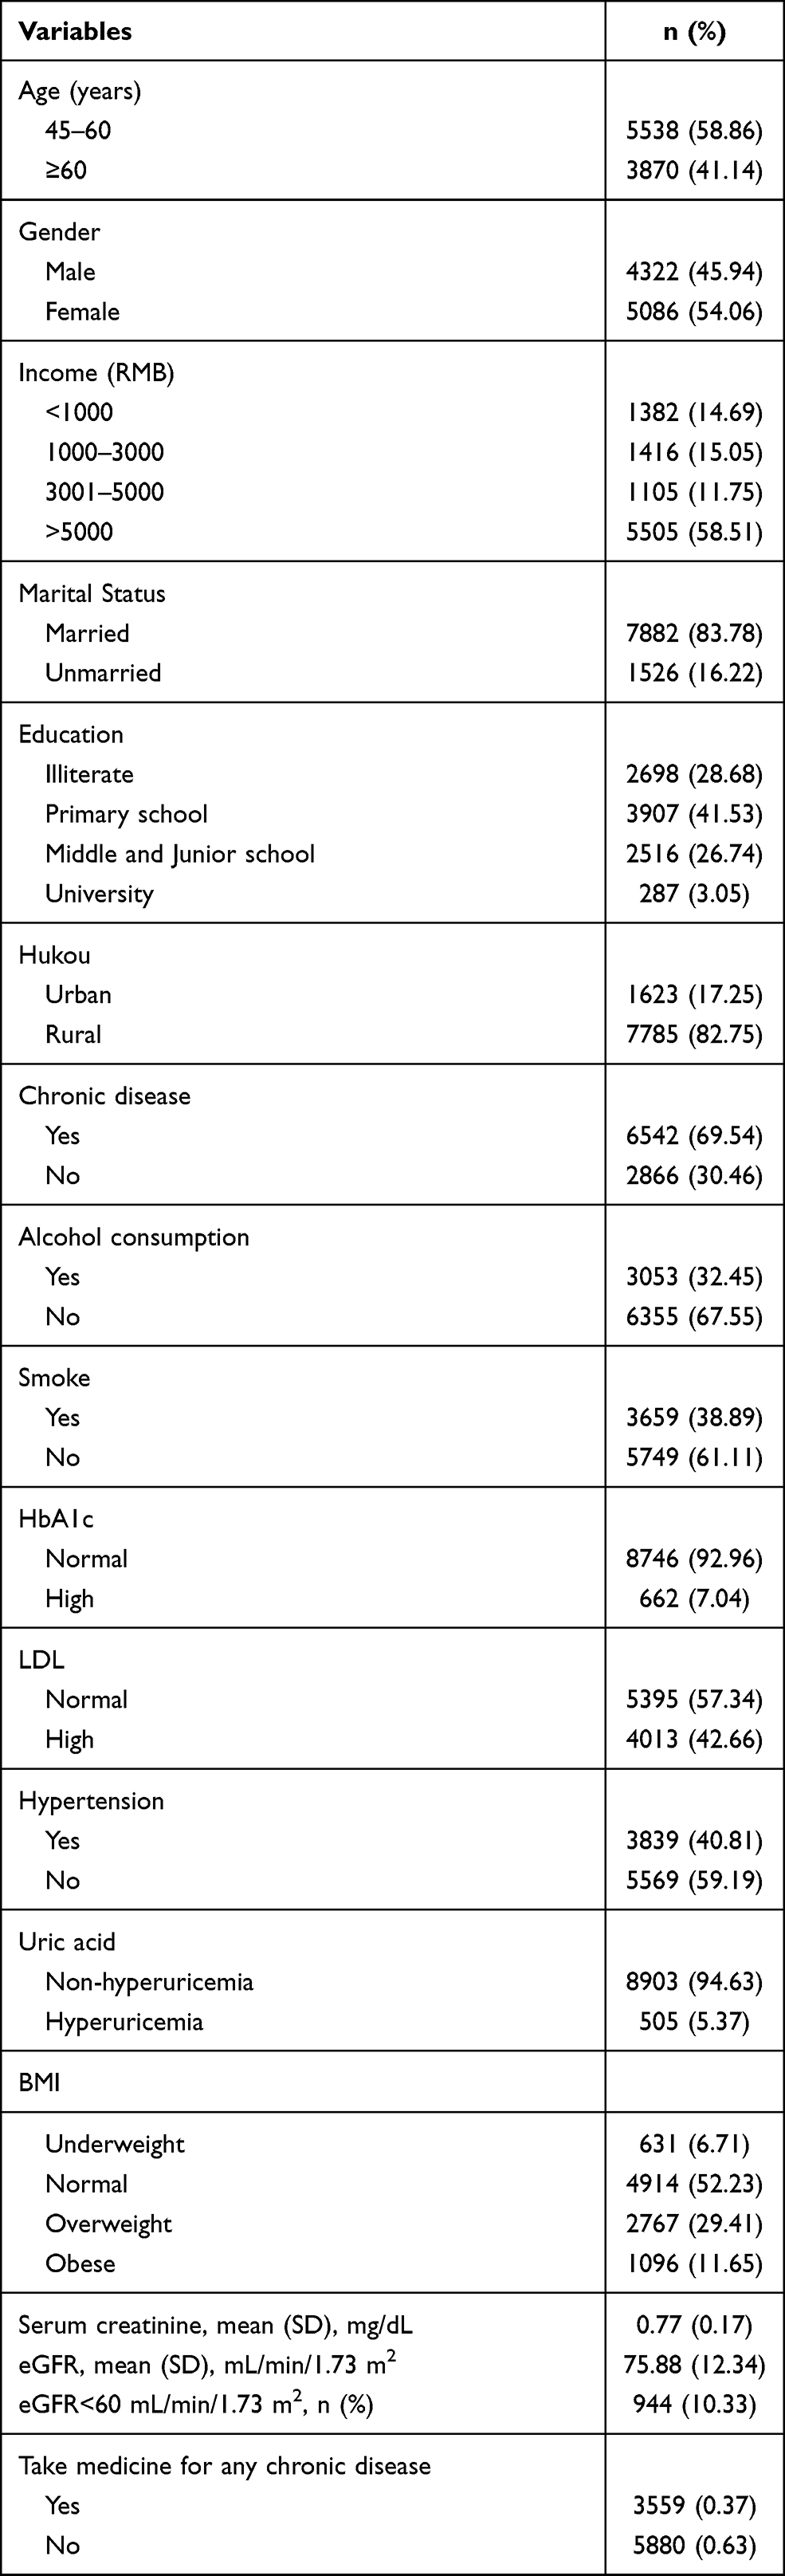 |
Table 1 Sample Characteristics in 2011 |
 |
Table 2 Odds Ratios of Hyperuricemia of Study Subjects Grouped by Different BMI Levels |
In subgroup analysis, multivariate logistic regression models grouped by gender showed that overweight and obese group in males had increased odds ratio of hypertension (OR=1.42, 95% CI=1.07–1.90; OR=1.66, 95% CI=1.10–2.49), while no significant association was found BMI and hyperuricemia in the underweight group among male. Similarly, obesity showed a statistically significant association with hyperuricemia compared with reference among females (OR=2.03, 95% CI=1.42–2.88) (Table 3), while no significant association was found BMI and hyperuricemia in the underweight and overweight group among females.
 |
Table 3 Odds Ratios of Hyperuricemia of Participants Grouped by Different BMI Levels |
Additionally, the hierarchical logistic regression model by age indicated that there are robust OR of hyperuricemia and obesity in middle-aged and older adults, respectively (OR=2.60, 95% CI=1.81–3.74; OR=1.91, 95% CI=1.46–2.51). Moreover, an overweight group in older adults had an adverse effect on the outcome of hyperuricemia compared with the normal group (OR=1.28, 95% CI=1.03–1.60). There was no significant association between BMI and hyperuricemia in the overweight group among middle-aged adults (Table 3).
A dose–response relationship was examined between BMI and the risk of hyperuricemia. The result showed that the odds ratio of hyperuricemia and BMI displayed a nonlinear relationship (Ptrend<0.001, non-linear P<0.001). When BMI was less than 23.5 kg/m2, the risk of hyperuricemia progressively rose with increasing BMI, but when BMI was greater than 23.5 kg/m2, the risk quickly increased, as shown in Figure 1. The dose–response relationship by age and gender is shown in Figures 1S and 2S. The nonlinear response–dose relationships were not found in different ages and gender groups (Ptrend>0.05, non-linear P>0.001).
 |
Figure 1 Dose–response relationship between BMI and hyperuricemia. Abbreviations: OR, Odds ratio; 95% CI, 95% confidence interval; BMI, body mass index. Note: The dose–response relationship was assessed by RCS model with three knots. |
Discussion
Hyperuricemia is an independent risk factor for many chronic diseases, like hypertension, type 2 diabetes, dyslipidemia, and obesity.22,23 The prevalence of hyperuricemia in various research can be attributed to the varied socioeconomic contexts and age makeup of participants. The prevalence of hyperuricemia among Chinese adults (aged 18 and above) was 8.4%, which is based on the China National Survey of Chronic Kidney Disease in 2009–2010.2 Another national study (China Health and Retirement Longitudinal Study) showed that the prevalence of hyperuricemia among aged 45 and above was 6.4%.14 Meanwhile, there are regional differences in the prevalence of hyperuricemia in China, and the prevalence of hyperuricemia in economically developed regions is relatively high.13,14
No significant association between hyperuricemia and BMI (overweight) among females was observed, and a significant association was found among males. Previous studies have found a higher prevalence of hyperuricemia in men than women.1,14 The underlying biological mechanism for this gender difference may be the uric acid effect of estrogen in premenopausal women. After menopause, serum uric acid levels increase in women.24,25
The results showed a linear dose–response relationship between BMI and hyperuricemia. With the increase of BMI, the odds ratio of hyperuricemia increased. From the perspective of gender and age, the same linear relationship has been found. However, this study did not find a nonlinear relationship between BMI and hyperuricemia, nor did it find a positive relationship between BMI (underweight) and hyperuricemia.
The findings of this study are similar to those of previous studies in that BMI is associated with hyperuricemia. This suggests that hyperuricemia is related to the accumulation of fat in the body. Tanaka et al found that BMI was a significant association with serum uric acid levels in Japanese adult twins, after adjusting genetic factors and environmental factors in both genders.26 A positive correlation between BMI and serum uric acid levels was also observed in healthy individuals.27 The relationship between obesity and serum uric acid may be explained by the following two factors: overproduction and poor renal excretion. A study conducted among the participants with visceral fat obesity indicates that increased levels of uric acid are strongly influenced by its overproduction with a decrease in urinary urate excretion and clearance.27,28 Moreover, visceral fat accumulation induces an elevated influx of plasma-free fatty acids into the liver and hepatic portal vein, which stimulates the synthesis of triglycerides followed by an associated surge in uric acid production through the activation of uric acid synthesis pathway.28,29
There are some limitations to this study. Firstly, this study is a cross-sectional study and cannot explore the causal relationship between BMI and hyperuricemia. Secondly, the age of the population included in this study was 45 years old and above, and the young population was not included, which limited the extrapolation of the results of this study. Thirdly, this study was conducted among Chinese individuals, and China has a distinct eating culture, which may restrict the applicability of our findings. Fourthly, we are unable to identify the impact of food in the connection between hyperlipidemia and BMI due to a lack of dietary data. China has a vast food system, all of which are extremely distinct. Future research might focus on the influence of various food patterns in the association between BMI and hyperuricemia. Finally, just a one-time measurement was used to compute the quantity of uric acid in the blood, which might lead to misclassification.
Conclusion
In this study, the association between hyperuricemia and BMI showed a positive relationship. Specifically, males and ages over 60 years were related to a higher odds ratio of hyperuricemia. However, due to the relatively limited sample size, more large sample prospective studies are needed to verify in the future.
Ethical Approval
The China Health and Retirement Longitudinal Study (CHARLS) was a survey approved by the Ethical Review Committee of Beijing University in accordance with the 1964 Helsinki declaration, and all participants signed informed consent at the time of participation. There is no need for additional ethics approval for the approved data users.
Acknowledgments
The authors wish to thank the study participants for their contribution to the research, as well as current and past investigators and staff.
Funding
Shaanxi Provincial Key R & D Plan (2020SF-170). Shaanxi Provincial Key R & D Plan (2020SF-163).
Disclosure
The authors report no conflicts of interest in this work.
References
1. Zhu Y, Pandya BJ, Choi HK. Prevalence of gout and hyperuricemia in the US general population: the national health and nutrition examination survey 2007–2008. Arthritis Rheum. 2011;63(10):3136–3141. doi:10.1002/art.30520
2. Liu R, Han C, Wu D, et al. Prevalence of hyperuricemia and gout in Mainland China from 2000 to 2014: a systematic review and meta-analysis. Biomed Res Int. 2015;2015:762820. doi:10.1155/2015/762820
3. Nagahama K, Iseki K, Inoue T, et al. Hyperuricemia and cardiovascular risk factor clustering in a screened cohort in Okinawa, Japan. Hypertens Res. 2004;27(4):227–233. doi:10.1291/hypres.27.227
4. Bardin T, Richette P. Definition of hyperuricemia and gouty conditions. Curr Opin Rheumatol. 2014;26(2):186–191. doi:10.1097/BOR.0000000000000028
5. Edwards NL. The role of hyperuricemia in vascular disorders. Curr Opin Rheumatol. 2009;21(2):132–137. doi:10.1097/BOR.0b013e3283257b96
6. Kleber ME, Delgado G, Grammer TB, et al. Uric acid and cardiovascular events: a Mendelian randomization study. J Am Soc Nephrol. 2015;26(11):2831–2838. doi:10.1681/ASN.2014070660
7. Feig DI, Kang DH, Johnson RJ. Uric acid and cardiovascular risk. N Engl J Med. 2008;359(17):1811–1821. doi:10.1056/NEJMra0800885
8. Gagliardi AC, Miname MH, Santos RD. Uric acid: a marker of increased cardiovascular risk. Atherosclerosis. 2009;202(1):11–17. doi:10.1016/j.atherosclerosis.2008.05.022
9. Jing J, Kielstein JT, Schultheiss UT, et al. Prevalence and correlates of gout in a large cohort of patients with chronic kidney disease: the German Chronic Kidney Disease (GCKD) study. Nephrol Dial Transplant. 2015;30(4):613–621. doi:10.1093/ndt/gfu352
10. Juraschek SP, Kovell LC, Miller ER, et al. Association of kidney disease with prevalent gout in the United States in 1988–1994 and 2007–2010. Semin Arthritis Rheum. 2013;42(6):551–561. doi:10.1016/j.semarthrit.2012.09.009
11. Lv Q, Meng XF, He FF, et al. High serum uric acid and increased risk of type 2 diabetes: a systemic review and meta-analysis of prospective cohort studies. PLoS One. 2013;8(2):e56864. doi:10.1371/journal.pone.0056864
12. Grayson PC, Kim SY, LaValley M, et al. Hyperuricemia and incident hypertension: a systematic review and meta-analysis. Arthritis Care Res. 2011;63(1):102–110. doi:10.1002/acr.20344
13. Liu H, Zhang XM, Wang YL, et al. Prevalence of hyperuricemia among Chinese adults: a national cross-sectional survey using multistage, stratified sampling. J Nephrol. 2014;27(6):653–658. doi:10.1007/s40620-014-0082-z
14. Song P, Wang H, Xia W, et al. Prevalence and correlates of hyperuricemia in the middle-aged and older adults in China. Sci Rep. 2018;8(1):4314. doi:10.1038/s41598-018-22570-9
15. Ali N, Perveen R, Rahman S, et al. Prevalence of hyperuricemia and the relationship between serum uric acid and obesity: a study on Bangladeshi adults. PLoS One. 2018;13(11):e0206850. doi:10.1371/journal.pone.0206850
16. Kuwabara M, Kuwabara R, Niwa K, et al. Different risk for hypertension, diabetes, dyslipidemia, and hyperuricemia according to level of body mass index in Japanese and American subjects. Nutrients. 2018;10(8):1011. doi:10.3390/nu10081011
17. Zhao Y, Hu Y, Smith JP, et al. Cohort profile: the China Health and Retirement Longitudinal Study (CHARLS). Int J Epidemiol. 2014;43(1):61–68. doi:10.1093/ije/dys203
18. Chen C, Lu FC; P.R.C. Department of Disease Control Ministry of Health. The guidelines for prevention and control of overweight and obesity in Chinese adults. Biomed Environ Sci. 2004;17:1–36.
19. Yan M, Fu Z, Qin T, et al. Associations of sleep duration and prediabetes prevalence in a middle-aged and elderly Chinese population with regard to age and hypertension: the China Health and Retirement Longitudinal Study baseline survey. J Diabetes. 2018;10(11):847–856.
20. Li Q, Li X, Wang J, et al. Diagnosis and treatment for hyperuricemia and gout: a systematic review of clinical practice guidelines and consensus statements. BMJ Open. 2019;9(8):e026677. doi:10.1136/bmjopen-2018-026677
21. Taguchi I, Iimuro S, Iwata H, et al. High-dose versus low-dose pitavastatin in Japanese patients with stable Coronary Artery Disease (REAL-CAD): a randomized superiority trial. Circulation. 2018;137(19):1997–2009. doi:10.1161/CIRCULATIONAHA.117.032615
22. Masuo K, Kawaguchi H, Mikami H, et al. Serum uric acid and plasma norepinephrine concentrations predict subsequent weight gain and blood pressure elevation. Hypertension. 2003;42(4):474–480. doi:10.1161/01.HYP.0000091371.53502.D3
23. Puig JG, Martinez MA. Hyperuricemia, gout and the metabolic syndrome. Curr Opin Rheumatol. 2008;20(2):187–191. doi:10.1097/BOR.0b013e3282f4b1ed
24. Dehlin M, Jacobsson L, Roddy E. Global epidemiology of gout: prevalence, incidence, treatment patterns and risk factors. Nat Rev Rheumatol. 2020;16(7):380–390. doi:10.1038/s41584-020-0441-1
25. Johnson RJ, Bakris GL, Borghi C, et al. Hyperuricemia, acute and chronic kidney disease, hypertension, and cardiovascular disease: report of a scientific workshop organized by the National Kidney Foundation. Am J Kidney Dis. 2018;71(6):851–865. doi:10.1053/j.ajkd.2017.12.009
26. Tanaka K, Ogata S, Tanaka H, et al. The relationship between body mass index and uric acid: a study on Japanese adult twins. Environ Health Prev Med. 2015;20(5):347–353. doi:10.1007/s12199-015-0473-3
27. Wang H, Lizhen WA, Rui XI, et al. Association of serum uric acid with body mass index: a cross-sectional study from Jiangsu Province, China. Iran J Public Health. 2014;43(11):1503–1509.
28. Matsuura F, Yamashita S, Nakamura T, et al. Effect of visceral fat accumulation on uric acid metabolism in male obese subjects: visceral fat obesity is linked more closely to overproduction of uric acid than subcutaneous fat obesity. Metabolism. 1998;47(8):929–933. doi:10.1016/S0026-0495(98)90346-8
29. Fabregat I, Revilla E, Machado A. Short-term control of the pentose phosphate cycle by insulin could be modulated by the NADPH/NADP ratio in rat adipocytes and hepatocytes. Biochem Biophys Res Commun. 1987;146(2):920–925. doi:10.1016/0006-291X(87)90618-8
30. Horio M, Imai E, Yasuda Y, Watanabe T, Matsuo S. Modification of the CKD Epidemiology collaboration (CKD-EPI) equation for Japanese: accuracy and use for population estimates. Am J Kidney Dis. 2010;56:32–38. doi:10.1053/j.ajkd.2010.02.344
31. KDIGO. 2012 Clinical Practice Guideline for the Evaluation and Management of Chronic Kidney Disease. Kidney Int Suppl. 2013;3:1–150.
 © 2021 The Author(s). This work is published and licensed by Dove Medical Press Limited. The
full terms of this license are available at https://www.dovepress.com/terms
and incorporate the Creative Commons Attribution
- Non Commercial (unported, 3.0) License.
By accessing the work you hereby accept the Terms. Non-commercial uses of the work are permitted
without any further permission from Dove Medical Press Limited, provided the work is properly
attributed. For permission for commercial use of this work, please see paragraphs 4.2 and 5 of our Terms.
© 2021 The Author(s). This work is published and licensed by Dove Medical Press Limited. The
full terms of this license are available at https://www.dovepress.com/terms
and incorporate the Creative Commons Attribution
- Non Commercial (unported, 3.0) License.
By accessing the work you hereby accept the Terms. Non-commercial uses of the work are permitted
without any further permission from Dove Medical Press Limited, provided the work is properly
attributed. For permission for commercial use of this work, please see paragraphs 4.2 and 5 of our Terms.