Back to Journals » International Journal of Chronic Obstructive Pulmonary Disease » Volume 17
Does the Efficacy of High Intensity Ventilation in Stable COPD Depend on the Ventilator Model? A Bench-to-Bedside Study
Authors Lalmolda C ![]() , Flórez P, Corral M, Hernández Voth A, Grimau C, Sayas J
, Flórez P, Corral M, Hernández Voth A, Grimau C, Sayas J ![]() , Luján M
, Luján M
Received 23 July 2021
Accepted for publication 6 December 2021
Published 14 January 2022 Volume 2022:17 Pages 155—164
DOI https://doi.org/10.2147/COPD.S327994
Checked for plagiarism Yes
Review by Single anonymous peer review
Peer reviewer comments 2
Editor who approved publication: Prof. Dr. Richard Russell
Cristina Lalmolda,1,2 Pablo Flórez,1 Marta Corral,3 Ana Hernández Voth,3 Carles Grimau,1 Javier Sayas,2 Manel Luján1,2,4
1Pneumology Department, Corporació Sanitària I Universitària Parc Taulí, Sabadell, Barcelona, Spain; 2CIBERES, Centro de Investigación Biomédica en red, Mallorca, Spain; 3Pneumology Department, Hospital 12 de Octubre, Madrid, Spain; 4Universitat Autònoma de Barcelona, Bellaterra, Barcelona, Spain
Correspondence: Manel Luján
Pneumology Department, Corporació Parc Taulí, Universitat Autònoma de Barcelona, Parc Taulí 1, 08208 Sabadell, Campus de la UAB, Plaça Cívica, Bellaterra, 08193, Barcelona, Spain
Tel +34937231010
Email [email protected]
Purpose: The European Task Force for chronic non-invasive ventilation in stable COPD recommends the use of high pressure-support (PS) level to maximize the decrease in PaCO2. It is possible that the ventilator model can influence the need for higher or lower pressure levels.
Research Question: To determine the differences between ventilators in a bench model with an increased inspiratory demand; and to compare the degree of muscular unloading measured by parasternal electromyogram (EMGpara) provided by the different ventilators in real patients with stable COPD.
Patients and Methods: Bench: four levels of increasing progressive effort were programmed. The response of nine ventilators to four levels of PS and EPAP of 5 cm H2O was studied. The pressure-time product was determined at 300 and 500 msec (PTP 300/500).
Clinical Study: The ventilators were divided into two groups, based on the result of the bench test. Severe COPD patients with non-invasive ventilation (NIV) were studied, randomly comparing the performance of one ventilator from each group. Muscle unloading was measured by the decrease in EMGpara from its baseline value.
Results: There were significant differences in PTP 300 and PTP 500 in the bench study. Based on these results, home ventilators were classified into two groups; group 1 included four models with higher PTP 300. Ten COPD patients were recruited for the clinical study. Group 1 ventilators showed greater muscle unloading at the same PS than group 2.
Conclusion: The scale of pressure support in NIV for high intensity ventilation may be influenced by the ventilator model.
Clinical Trials.gov: NCT03373175.
Keywords: chronic obstructive pulmonary disease, parasternal electromyogram, pressure support, pressure-time product, respiratory muscle unloading, rise time
Introduction
Chronic obstructive pulmonary disease (COPD) is a disease with high mortality and morbidity in clinical practice. A high percentage of patients with advanced disease develop chronic respiratory failure and require nocturnal non-invasive ventilation (NIV) treatment. In some European countries, COPD is already the leading cause of prescription of home ventilation.1
The results reported to date in COPD patients undergoing home NIV have been variable. Despite the exponential growth in ventilation prescriptions in stable COPD during the last 15 years, the controlled studies of its use carried out so far have yielded variable results in terms of improved survival, dyspnoea, quality of life or impact on arterial blood gases.2–4 In recent studies, the time to first exacerbation after starting chronic NIV has been used as a surrogate of efficacy.5
One of the special features of recent studies is the systematic use of high pressure support values and high backup frequency (respiratory rate) on the ventilator. The goal is to try and normalize PaCO2 or to obtain a decrease of at least 20% from baseline values. This is known as high intensity ventilation. Initially, high-intensity NIV in COPD was used in short-term studies with the evaluation of physiological parameters6,7 but more recently its use has expanded. In fact, the recent European Task Force recommends its use in COPD patients with stable hypercapnia and in those with persistent hypercapnia at 2–4 weeks after a severe exacerbation and advocates the use of high pressure support levels to try to normalize or significantly decrease PaCO2.8
These pressure levels, however, are higher than the ones used in clinical practice to treat patients with COPD exacerbations and respiratory acidosis,9 in which inspiratory pressure does not usually reach 18 cm H2O. One of the primary goals of NIV in stable COPD is to unload the respiratory muscles.8 One of the factors that might explain these differences is the use of different ventilators in exacerbated patients in hospital and in chronic patients at home. This may mean that the pressure level required for optimal inspiratory muscle unloading in stable COPD patients differs according to the ventilator used. The ventilator performance, including pressurization, is variable between different respirators, even if they have received similar certification.
The main objective of this study was to determine differences in pressurization between different ventilators in a bench model with an increased inspiratory demand.
In the second stage, the aim was to compare the degree of muscular unloading measured by parasternal electromyography (EMGpara) provided exclusively by the different home ventilators, in a group of patients with hypercapnic chronic respiratory failure and home NIV.
Materials and Methods
Bench Study
The study was carried out under simulation conditions at the non-invasive mechanical ventilation laboratory of the Hospital de Sabadell, using an active ventilation simulator (series 1101, Hans Rudolph, Inc., Shawnee, Kansas). The ventilators evaluated were connected to the simulator through a single standard 2 m tube with a controlled leak as the expiratory port (Intersurgical SL, Madrid) placed at its distal end. The leak port was maintained throughout the experiment, simulating the intentional leak used in clinical practice in NIV with a single limb configuration (Figure 1). For each simulated sequence, tested ventilators ran for 5 minutes before collecting data to ensure stability in the measurements.
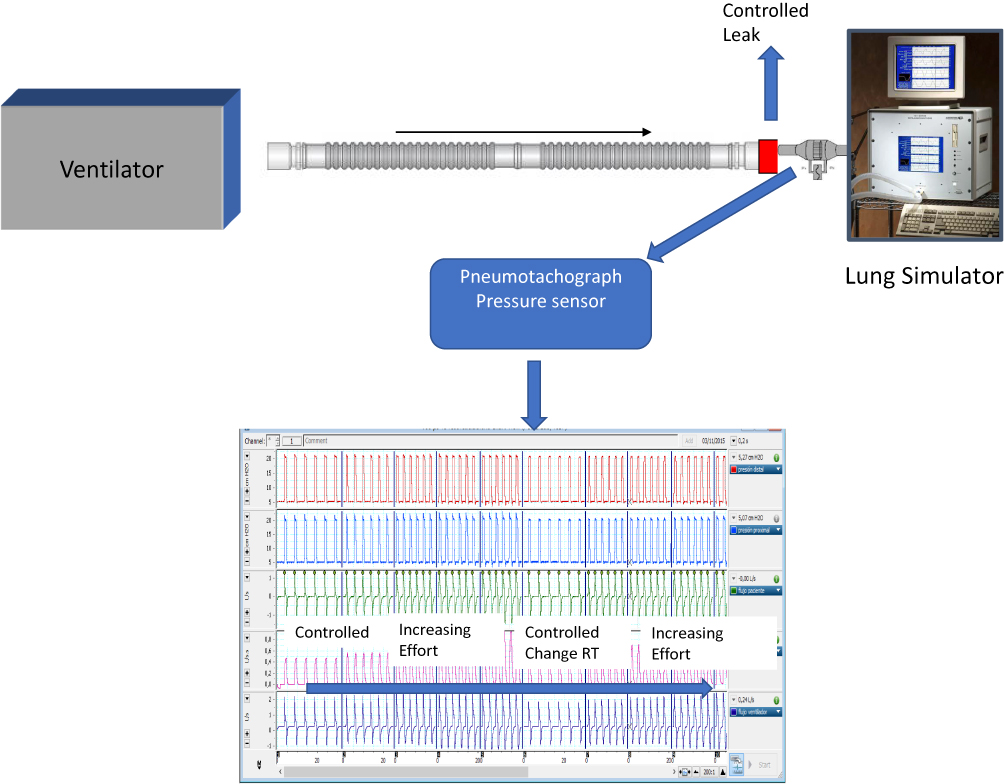 |
Figure 1 Setup of the bench test. |
Parameters in the Simulator
- Lung mechanics: Compliance and resistance were set at 60 mL/cm H2O and 18 cm H2O/L/s respectively.10
- Inspiratory effort: Four levels of effort were determined, progressively increasing to −4, −9, −14 and −20 cm H2O.
- Respiratory rate of 15 cycles per minute.
Parameters in the ventilators:
- Four levels of pressure support: 10, 15, 20 and 25 cm H2O.
- EPAP at 5 cm H2O.
- Three levels of pressurization time (short, medium, long).
- Backup respiratory rate at 12 cycles per minute.
Ventilator Models
A total of nine ventilators were studied, two considered for hospital use (V60, Philips Respironics, Murrysville, Pennsylvania and Carina, Dräger, Lübeck, Germany) and seven ventilators for home use: Vivo 40 and Vivo 50 (General Electric, Mölnlycke, Sweden), Stellar 150 and Astral 150 (ResMed, North Ryde, Australia), (3) Trilogy 202 (Philips Respironics, Murrysville, Pennsylvania), (4) Puritan Bennett (PB) 560 (Covidien, Mansfield, Massachusetts) and Prisma Vent 30 (Weinmann, Hamburg, Germany).
External Signal Acquisition System
An external polygraph (16Sp Powerlab, ADInstruments, Sydney, Australia), equipped with a pressure transducer (model 1050) and pneumotachograph (S300, instrumental dead space = 70 mL, resistance = 0.0018 cm H2O/L/s), both placed at the entrance of the simulator, distal to the intentional leak. The sampling frequency was set at 1 KHz, and the polygraph was connected to a personal computer equipped with LabChart 8.0 software for Windows.
Collection and Calculation of Parameters
A total of six ventilatory cycles at the end of each five-minutes step were collected for each sequence, using Peak analysis software (ADInstruments, Sydney, Australia) for automated data analysis.
The following parameters were recorded for each ventilatory cycle: tidal volume, obtained from the integration of the flow wave, peak flow and time to peak flow, inspiratory time, pressure-time product (PTP) at 300 and 500 milliseconds and percentage of PTP 300 and PTP 500 with respect to the ideal value, defined by a perfect square whose base is the inspiratory time and the height is the programmed pressure support value (see e-Figure 1 for more details). The differences between ideal PTP 300/500 and the values in the assisted cycles were used as a surrogate of the measure of ventilator pressurization capabilities. The greater the difference between both values, the poorer performance of the tested ventilator.
Clinical Study
The study was carried out in patients from the Pneumology Service of the Corporació Sanitària Parc Taulí (Sabadell, Barcelona) and the Hospital 12 de Octubre (Madrid) who met the following criteria:
Inclusion criteria: COPD diagnosis according to the Global Initiative for Obstructive Lung Diseases criteria,11 in a situation of chronic respiratory failure and under treatment with home NIV, with prescribed pressure support values equal to or higher than 15 cm H2O and a period of use longer than six months. The absence of hospital admissions in the last three months (disease stability phase) was also required for inclusion. Patients with another concomitant alteration (restrictive, significant obesity - BMI > 35) and poor adherence to treatment (compliance based on ventilator counter less than 4 h/day) were excluded. The study, including bench and bedside, started in December 2017 and ended in May 2021. It was approved by the ethical committees of the participating hospitals (Ref. 2,017,632 Corporació Parc Taulí and Ref 18/046 Hospital 12 de Octubre Madrid). Written informed consent was required. This study was conducted in accordance with the Declaration of Helsinki.
Clinical Study Protocol
Each patient randomly used two ventilators during the test to avoid the effect of long-term muscle unloading in unnecessarily long tests. Based on the results of the bench study, the four best home ventilators (with the highest PTP300) were assigned to group 1 and the three worst home ventilators were assigned to group 2. One ventilator from each group was selected by means of a table of random numbers.
Procedure: In the supine position, each patient was connected to the oronasal interface used at home. In the first step, they were not connected to the ventilator (the distal end connected to air). Baseline patient effort was recorded by EMGpara, with electrodes placed at the level of the second/third intercostal space.12 After this, five-minute periods in NIV under pressure support mode were recorded at three PS levels (10/15/20) for each ventilator and patient, with five-minute breaks between each phase. The order of the two ventilators alternated randomly in each of the phases to avoid crossed effects. Establishing these short periods of time for NIV and breaks between them was decided to avoid respiratory muscles unloading because of prolonged NIV that could prevent the detection of differences in later stages. An EPAP of 5 cmH2O was used in all patients and the shortest pressurization time was selected, given their status as severe COPD patients. Triggering, cycling and backup rate were not modified with respect to the prescribed values. Similarly, oxygen coupled to the ventilator was used during the test if the patient had it prescribed at home at the same flow rate.
The last six cycles of each phase were analysed, recording the peak flow values, time to peak flow and inspiratory time. From the EMGpara signal, the transformation known as Root mean square (RMS) was performed, recording the maximum peak and the area under the curve of the transformation.13 Full musculature unloading was considered to have been achieved when the RMS peak value fell below 10% of unsupported baseline values14 The protocol was stopped in case of complete muscle unloading, and also in the case of poor patient tolerance.
Statistical Analysis
In all cases, the analysis was performed with SPSS 22 (SPSS, Chicago, Illinois). For the bench study, quantitative data were expressed as means and standard deviation (µ, sd) according to the normality study of the variables using the Shapiro–Wilk test (p < 0.05). The comparison of quantitative variables between ventilators was carried out using the ANOVA test. For the comparison of results between the different pressure levels and ventilators, the general linear model for repeated measures was used. When the sphericity of the model could not be assumed (Mauchly’s test with p < 0.05), the significance of the model was evaluated with the Greenhouse-Geisser correction. For the clinical study, quantitative data were expressed as median and interquartile range (IQR). The comparison of data were carried out by means of Mann–Whitney U-test. The level of significance was established at p < 0.05.
Results
Bench Study
A total of 3150 ventilatory cycles were generated. E-Figures 2–5 show the differences in tidal volume, inspiratory time, peak flow and time to peak flow for all the ventilators studied. One of the ventilators (Prisma Vent 30) reached a maximum pressure of only 25 cmH2O, and so the number of simulations was lower (540 vs 720 in the others).
Figure 2 shows the mean value of PTP 300 in absolute values as a function of the programmed pressure support level. As can be seen, the ventilators present two distinct patterns of performance: a first group, which includes the two acute ventilators and four of the home ventilators, showed a significantly higher PTP 300, while a second group comprising three home ventilators presented a clearly lower PTP 300. Figure 3 shows the percentage from the ideal PTP 300 for each model, and e-Figures 6 and 7 show the same analysis for the PTP 500. As shown in E-Figures 2–5, the ventilators with worse performance in the PTP 300 also presented significantly higher inspiratory time and time to peak flow.
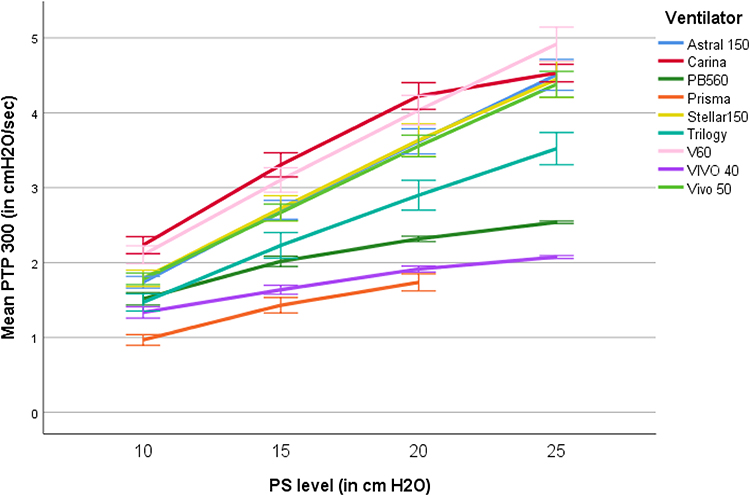 |
Figure 2 Absolute mean value of PTP 300 as a function of the programmed PS level (p <0.01 between ventilator models, general linear model for repeated measures). |
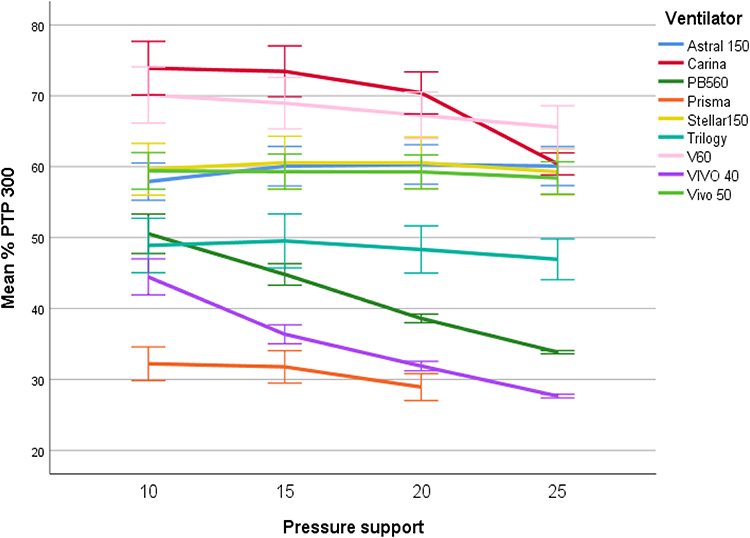 |
Figure 3 Percentage for each ventilator with respect to the ideal PTP 300 (p <0.01 between ventilator models, general linear model for repeated measures). |
Figure 4 shows the mean PTP 300 in absolute values including only the cycles with high demand (−14 and −20 cmH2O), and the shortest ramp in the ventilator, emphasizing the differences between the groups of ventilators (p < 0.01 inter and intra ventilators, general linear model for repeated measures).
 |
Figure 4 Absolute mean value of PTP 300 as a function of the programmed PS level, including only cycles with high demand and fastest ramp (p <0.01 between models, general linear model for repeated measures). |
Clinical Study
Based on the results of the bench study, the ventilators were classified into group 1 (better performance in the bench study) and group 2 (worse performance). As this was a study of home ventilators, acute ventilators that were taken as a reference in the bench test (V60 and Carina) were excluded. Thus, the classification by groups was as follows:
o Group 1: Stellar 150, Astral 150, Vivo 50, Trilogy 202
o Group 2: Vivo 40, PB 560 and Prisma Vent 30.
Ten patients were included in the clinical study. Table 1 shows the anthropometric and lung function data, as well as the ventilator model habitually used, and the two ventilators assessed in the comparison. In eight patients all the phases of the protocol were completed, while in the remaining two the pressure support phase of 20 cm H2O was not analysed due to complete muscle unloading in the EMGpara.
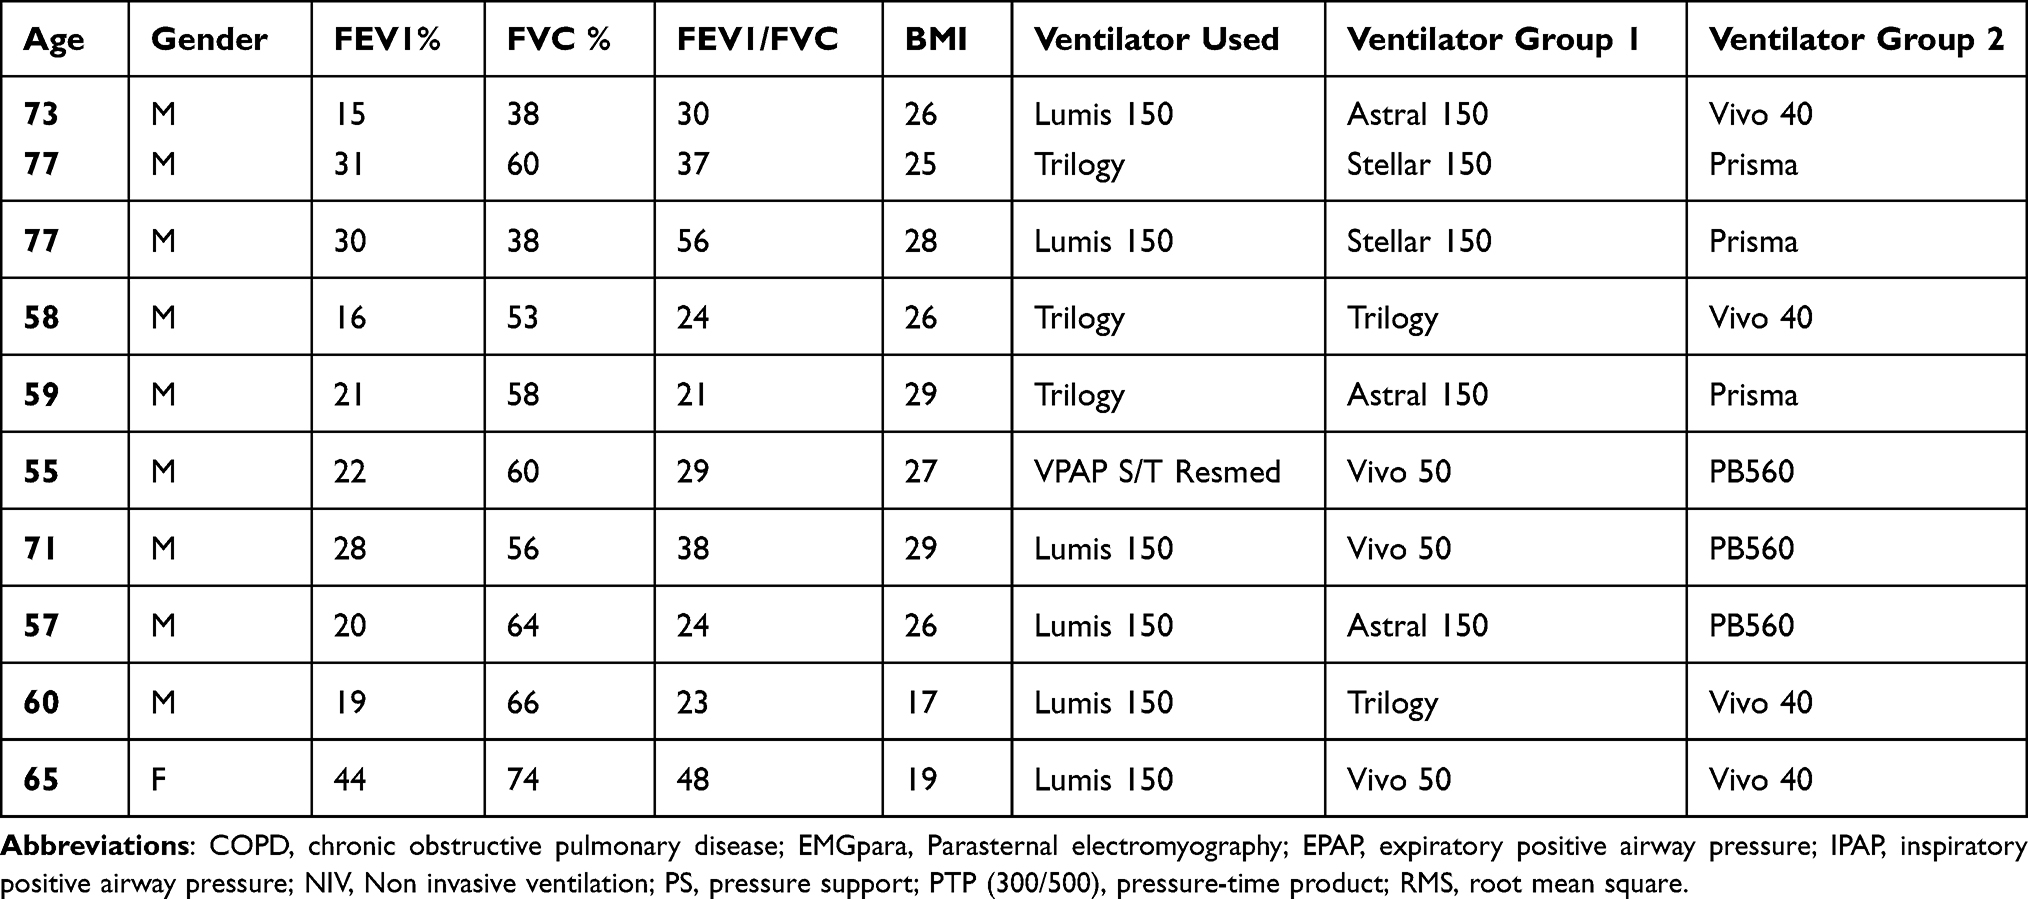 |
Table 1 Anthropometric Data, Respiratory Function, Ventilator Used Regularly, and Ventilators Compared |
Regarding respiratory variables, group 1 ventilators showed significantly lower time to peak flow and inspiratory time than those in group 2 (e-Figures 8 and 9), whereas peak flow and respiratory rate were not different between both groups. Finally, the muscular unloading measured by EMGpara was significantly higher in group 1 ventilators, in terms of both percentage decrease in the RMS peak (Figure 5, p < 0.001, Mann–Whitney U-test) and the area under the RMS curve (Figure 6, p < 0.001, Mann–Whitney U-test). Finally, SpO2 values did not show any differences between groups, being always higher than 94% during the experiment.
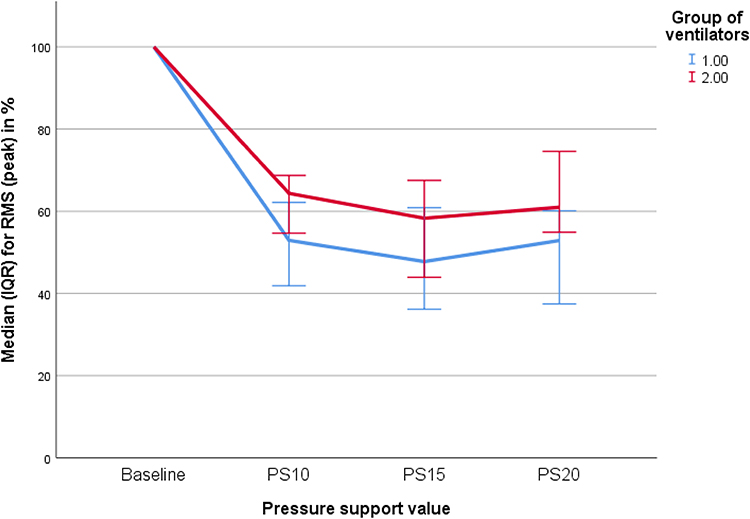 |
Figure 5 Respiratory muscle unloading measured by median maximum value of parasternal EMG (root mean square) for both groups of ventilators (p <0.001 between groups, Mann Whitney U-test). Baseline activity was taken as the reference. |
 |
Figure 6 Respiratory muscle unloading measured by median area under the curve of parasternal EMG (root mean square) for both groups of ventilators (p <0.001 between groups, Mann Whitney U-test). Baseline activity was taken as the reference. |
Discussion
The main findings of this study are the differences in the performance of ventilators in the same clinical situation and with appropriate settings in the devices. Our results suggest that ventilation devices for COPD patients present relevant intrinsic features that they are not modifiable. The clinical study also demonstrates that these features may be linked to different degrees of muscle unloading.
In the test bench study, the pressure-time product at 300 and 500 milliseconds was used to reflect the ventilator response. This parameter has already been used to evaluate the response of ventilators in a laboratory environment. Battisti et al15 studied 10 home ventilators in a bench test setting with two levels of pressure on the ventilator and four levels of inspiratory effort on the active simulator. Significant differences were also found in the response of the ventilator blowers to increasing efforts and leaks, not only at the PTP 300 level but also in trigger delay (as measured by the pressure-time product during the trigger period. Similar results were found in a group of intermediate respiratory care ventilators.16
These differences in pneumatic performance require an in-depth analysis in order to establish how the ventilators deliver pressure and flow. A core concept for analysis is the ramp feature, mistakenly called “rise time” on some ventilators. In pressure-controlled modes, if the pressure/time curve is split into two phases, the section corresponding to the plateau would be limited by pressure, while the section corresponding to pressurization, if limited by time, should be constant despite increasing patient effort, without noting the changes in the PTP 300/500 detected in the present study.11
Also noteworthy are the different values of time to peak flow exhibited by the ventilators, with later peak flow rates in the ones with poorest performance. This finding was also corroborated in the clinical study. Moreover, the only variable with minimal changes due to increased effort in the simulator was the first derivative of the flow (e-Figure 10), which, in physical terms, reflects flow acceleration. This lack of change would suggest at the conceptual level that part of the pressurization is limited by changes in the flow. It is also interesting that each device exhibited different profiles of flow acceleration in terms of duration and intensity of the flow change (data not shown).
These differences observed in the bench test were then corroborated in a clinical setting. In this connection, the biggest challenge was the reliable measurement of the respiratory impulse. Gold standards such as the determination of intrathoracic pressure through a gastric and oesophageal pressure probe are invasive measures. Although the placement of this probe has been used in research settings,17 it causes a certain degree of discomfort to the patients. Therefore, in this study, non-invasive muscle assessment was used, through EMG quantification of the surface of respiratory muscles. Although the diaphragm is the main inspiratory muscle, its anatomical variability hampers the systematic use of this non-invasive approach with surface electrodes.13 However, if the surface diaphragmatic EMG signal is technically acceptable, it correlates well with oesophageal diaphragmatic EMG.18
The parasternal location is the most reliable and best-known approach for surface respiratory muscle EMG assessment. EMG recordings in the second anterior parasternal intercostal space have been used as a reference for the categorization of asynchronies in NIV,19 to identify the true start of inspiratory effort in patients with COPD,20 and as a predictive tool for readmissions in COPD patients.21 In a model similar to the one in the present study, Duiverman et al22 demonstrated a decrease in the EMG signal with increasing levels of pressure support, reflecting inspiratory muscle unloading. Furthermore, it has a good correlation with EMG measured by oesophageal multielectrode probe.23
The results of the clinical study demonstrate a greater reduction in neural drive for group 1 ventilators at equal pressure support in all the patients included (see example in e-Figure 11). The patient-blind design of the ventilator used in each phase and the alternation of sequences between the ventilators compared, including a rest period between phases, make the influence of one ventilation sequence over the next sequence quite unlikely. Furthermore, by comparing each phase of pressure support with the baseline signal as a percentage, the influence on the interindividual variability of the signal is to some extent avoided.
The findings of both studies lead to interesting conclusions regarding the long-term chronic non-invasive ventilation procedure in COPD patients. In recent years, “high intensity ventilation” has become the technique of choice, as it achieves better results than conventional ventilation. High intensity ventilation combines the use of high pressures and high back-up respiratory rate, both aimed at reducing the baseline PaCO2 value by at least 20%.6,7 A meta-analysis published some years ago showed that the use of IPAP values greater than 18 was associated with better results.24 Likewise, most recent studies5,25 and the European ventilation guidelines in stable COPD8 support the use of this “high pressure” approach.
Muscle unloading, as determined by parasternal EMG has been linked with clinical stability in “ready-to discharge” patients.26 In this way, Reilly et al demonstrated in cystic fibrosis patients how neural drive, measured by EMGpara, decrease to a great extent (−39%) after an infectious exacerbation resolves.12 In a similar way, neural drive measured by EMGpara has been proposed as a tool to evaluate the effectiveness of bronchodilators27 or even as marker of hyperinflation. In this latter topic, neural respiratory drive may reflect mechanics impairment in COPD patients, mainly related to expiratory flow limitation and hyperinflation.28 It can be hypothesized that lower capability of a given ventilator in decreasing neural drive (“unloading of inspiratory muscles”) may reflect inability to correct respiratory mechanics impairment of a given COPD patient. Whether this issue may be related with long-term outcomes is yet to be proven. On the other hand, most recent studies on NIV in COPD patients have been focused in PaCO2 reduction. There is also a strong link between PaCO2 levels and neural drive29 with increased neural drive as PaCO2 increases. The short-term nature of our study did not allow to find relevant changes in PaCO2, as there was no time to reach a gasometric steady state, but changes in “muscle discharge” may induced or be induced by changes in PaCO2. Long term studies may be needed to clear the relationship between the performance of the ventilators and the change in PaCO2.
The results of our study suggest that the level of muscle unloading also depends on the type of ventilator used, so that the absolute values of pressure support can provide a greater or lesser degree of muscular unload depending on the ventilator used. Theoretically, the choice of more efficient ventilators would allow the use of lower support pressure values, avoiding the undesirable effects associated with high pressures. In the current world of personalized medicine, these results may also allow the development of specific pressurization algorithms for the different lung mechanics underlying the respiratory failure of different conditions. A warning that can be extrapolated from the results is that home ventilator models may not be the most appropriate choice for acute respiratory failure.
Some limitations in the study should be noted: First of all, the small sample size and the short-term period of analysis in clinical study. Thus, the differences in the PaCO2 reduction remain to be demonstrated, as does the effect over other relevant outcomes such as exacerbations or survival.
Conclusion
In conclusion, there were significant differences at the level of pressurization capacity in a series of ventilators in a bench test environment in the presence of increasing effort. After categorization based on the bench test results, the ventilators with better bench performance achieved greater muscle unloading at equal pressure support in a cohort of COPD patients.
Data Sharing Statement
Data of the clinical and bench study, including database and tracings will be available upon request for six months from the publication date. The authors with access to the data were: Cristina Lalmolda, [email protected]; Javier Sayas, [email protected].
Disclosure
Dr Javier Sayas reports personal fees, non-financial support from Resmed, Philips Respironics, grants from Menarini, non-financial support from Breas, during the conduct of the study. The authors report no other conflicts of interest in this work.
References
1. Crimi C, Noto A, Princi P, et al. Domiciliary non-invasive ventilation in COPD: an international survey of indications and practices. COPD. 2016;13:483–490. doi:10.3109/15412555.2015.1108960.
2. Clini E, Sturani C, Rossi A, et al. The Italian multicentre study on noninvasive ventilation in chronic obstructive pulmonary disease patients. Eur Respir J. 2002;20(3):529–538. doi:10.1183/09031936.02.02162001.
3. McEvoy RD, Pierce RJ, Hillman D, et al. Nocturnal non-invasive nasal ventilation in stable hypercapnic COPD: a randomised controlled trial. Thorax. 2009;64(7):561–566. doi:10.1136/thx.2008.108274.
4. Struik FM, Sprooten RTM, Kerstjens HAM, et al. Nocturnal non-invasive ventilation in COPD patients with prolonged hypercapnia after ventilatory support for acute respiratory failure: a randomised, controlled, parallel-group study. Thorax. 2014;69(9):826–834. doi:10.1136/thoraxjnl-2014-205126
5. Murphy PB, Rehal S, Arbane G, et al. Effect of home noninvasive ventilation with oxygen therapy vs oxygen therapy alone on hospital readmission or death after an acute COPD exacerbation: a randomized clinical trial. JAMA. 2017;317:2177–2186. doi:10.1001/jama.2017.4451.
6. Dreher M, Storre JH, Schmoor C, Windisch W. High-intensity versus low-intensity non-invasive ventilation in patients with stable hypercapnic COPD: a randomised crossover trial. Thorax. 2010;65:303–308. doi:10.1136/thx.2009.124263.
7. Windisch W, Kostić S, Dreher M, Virchow JC, Sorichter S. Outcome of patients with stable COPD receiving controlled noninvasive positive pressure ventilation aimed at a maximal reduction of Pa(CO2). Chest. 2005;128:657–662. doi:10.1378/chest.128.2.657.
8. Ergan B, Oczkowski S, Rochwerg B, et al. European respiratory society guidelines on long-term home non-invasive ventilation for management of COPD. Eur Respir J. 2019;54. doi:10.1183/13993003.01003-2019.
9. Carrillo A, Ferrer M, Gonzalez-Diaz G, et al. Noninvasive ventilation in acute hypercapnic respiratory failure caused by obesity hypoventilation syndrome and chronic obstructive pulmonary disease. Am J Respir Crit Care Med. 2012;186:1279–1285. doi:10.1164/rccm.201206-1101OC.
10. Olivieri C, Costa R, Conti G, Navalesi P. Bench studies evaluating devices for non-invasive ventilation: critical analysis and future perspectives. Intensive Care Med. 2012;38:160–167. doi:10.1007/s00134-011-2416-9.
11. Global Initiative for Chronic Obstructive Lung Disease. Glob initiat chronic obstr lung dis – GOLD; n.d. Available from: https://goldcopd.org/.
12. Reilly CC, Ward K, Jolley CJ, et al. Neural respiratory drive, pulmonary mechanics and breathlessness in patients with cystic fibrosis. Thorax. 2011;66:240–246. doi:10.1136/thx.2010.142646.
13. AbuNurah HY, Russell DW, Lowman JD. The validity of surface EMG of extra-diaphragmatic muscles in assessing respiratory responses during mechanical ventilation: a systematic review. Pulmonology. 2020;26:378–385. doi:10.1016/j.pulmoe.2020.02.008.
14. MacBean V, Jolley CJ, Sutton TG, et al. Parasternal intercostal electromyography: a novel tool to assess respiratory load in children. Pediatr Res. 2016;80:407–414. doi:10.1038/pr.2016.89
15. Battisti A, Tassaux D, Janssens J-P, Michotte J-B, Jaber S, Jolliet P. Performance characteristics of 10 home mechanical ventilators in pressure-support mode: a comparative bench study. Chest. 2005;127:1784–1792. doi:10.1378/chest.127.5.1784.
16. Delgado C, Romero JE, Puig J, et al. Performance of the new turbine mid-level critical care ventilators. Respir Care. 2017;62:34–41. doi:10.4187/respcare.04938.
17. Tonelli R, Fantini R, Tabbì L, et al. Early inspiratory effort assessment by esophageal manometry predicts noninvasive ventilation outcome in de novo respiratory failure. A Pilot Study. Am J Respir Crit Care Med. 2020;202:558–567. doi:10.1164/rccm.201912-2512OC.
18. Lin L, Guan L, Wu W, Chen R. Correlation of surface respiratory electromyography with esophageal diaphragm electromyography. Respir Physiol Neurobiol. 2019;259:45–52. doi:10.1016/j.resp.2018.07.004.
19. Ramsay M, Mandal S, Suh E-S, et al. Parasternal electromyography to determine the relationship between patient-ventilator asynchrony and nocturnal gas exchange during home mechanical ventilation set-up. Thorax. 2015;70(10):946–952. doi:10.1136/thoraxjnl-2015-206944.
20. Sarlabous L, Estrada L, Cerezo-Hernández A, et al. Electromyography-based respiratory onset detection in COPD patients on non-invasive mechanical ventilation. Entropy Basel Switz. 2019;21(3):258. doi:10.3390/e21030258
21. Suh E-S, Mandal S, Harding R, et al. Neural respiratory drive predicts clinical deterioration and safe discharge in exacerbations of COPD. Thorax. 2015;70(12):1123–1130. doi:10.1136/thoraxjnl-2015-207188.
22. Duiverman ML, Huberts AS, van Eykern LA, Bladder G, Wijkstra PJ. Respiratory muscle activity and patient-ventilator asynchrony during different settings of noninvasive ventilation in stable hypercapnic COPD: does high inspiratory pressure lead to respiratory muscle unloading? Int J Chron Obstruct Pulmon Dis. 2017;12:243–257. doi:10.2147/COPD.S119959.
23. Wu W, Guan L, Li X, et al. Correlation and compatibility between surface respiratory electromyography and transesophageal diaphragmatic electromyography measurements during treadmill exercise in stable patients with COPD. Int J Chron Obstruct Pulmon Dis. 2017;12:3273–3280. doi:10.2147/COPD.S148980.
24. Struik FM, Lacasse Y, Goldstein RS, Kerstjens HAM, Wijkstra PJ. Nocturnal noninvasive positive pressure ventilation in stable COPD: a systematic review and individual patient data meta-analysis. Respir Med. 2014;108(2):329–337. doi:10.1016/j.rmed.2013.10.007.
25. Köhnlein T, Windisch W, Köhler D, et al. Non-invasive positive pressure ventilation for the treatment of severe stable chronic obstructive pulmonary disease: a prospective, multicentre, randomised, controlled clinical trial. Lancet Respir Med. 2014;2(9):698–705. doi:10.1016/S2213-2600(14)70153-5.
26. Domnik NJ, Walsted ES, Langer D. Clinical utility of measuring inspiratory neural drive during Cardiopulmonary Exercise Testing (CPET). Front Med. 2020;7:483. doi:10.3389/fmed.2020.00483.
27. Li Y, Li Y-H, Li S, et al. Efficiency of neural respiratory drive for the assessment of bronchodilator responsiveness in patients with chronic obstructive pulmonary disease: an exploratory study. J Thorac Dis. 2016;8(5):958–965. doi:10.21037/jtd.2016.03.70.
28. Jolley CJ, Luo Y-M, Steier J, et al. Neural respiratory drive in healthy subjects and in COPD. Eur Respir J. 2009;33:289–297. doi:10.1183/09031936.00093408.
29. Luo YM, Moxham J. Measurement of neural respiratory drive in patients with COPD. Respir Physiol Neurobiol. 2005;146(2–3):165–174. doi:10.1016/j.resp.2004.12.014.
 © 2022 The Author(s). This work is published and licensed by Dove Medical Press Limited. The
full terms of this license are available at https://www.dovepress.com/terms
and incorporate the Creative Commons Attribution
- Non Commercial (unported, 3.0) License.
By accessing the work you hereby accept the Terms. Non-commercial uses of the work are permitted
without any further permission from Dove Medical Press Limited, provided the work is properly
attributed. For permission for commercial use of this work, please see paragraphs 4.2 and 5 of our Terms.
© 2022 The Author(s). This work is published and licensed by Dove Medical Press Limited. The
full terms of this license are available at https://www.dovepress.com/terms
and incorporate the Creative Commons Attribution
- Non Commercial (unported, 3.0) License.
By accessing the work you hereby accept the Terms. Non-commercial uses of the work are permitted
without any further permission from Dove Medical Press Limited, provided the work is properly
attributed. For permission for commercial use of this work, please see paragraphs 4.2 and 5 of our Terms.