")
Back to Journals » Journal of Hepatocellular Carcinoma » Volume 8
DNA and RNA Sequencing Recapitulated Aberrant Tumor Metabolism in Liver Cancer Cell Lines
Authors Sun Y , Tang X , Ye B , Ding K
Received 8 May 2021
Accepted for publication 6 July 2021
Published 27 July 2021 Volume 2021:8 Pages 823—836
DOI https://doi.org/10.2147/JHC.S318724
Checked for plagiarism Yes
Review by Single anonymous peer review
Peer reviewer comments 3
Editor who approved publication: Dr Ahmed Kaseb
Yihong Sun,1 Xia Tang,1 Bo Ye,1 Keyue Ding1,2
1Department of Bioinformatics, School of Basic Medicine, Chongqing Medical University, Chongqing, 410006, People’s Republic of China; 2Medical Genetic Institute of Henan Province, Henan Provincial People’s Hospital, Henan Key Laboratory of Genetic Diseases and Functional Genomics, National Health Commission Key Laboratory of Birth Defect Prevention, Henan Provincial People’s Hospital of Henan University, People’s Hospital of Zhengzhou University, Zhengzhou, Henan Province, 450003, People’s Republic of China
Correspondence: Keyue Ding
Department of Bioinformatics, School of Basic Medicine, Chongqing Medical University, #1 Road Yixueyuan, Yuzhong District, Chongqing, People’s Republic of China
Tel +86 23 6389 2759
Email [email protected]
Aim: Metabolic reprogramming has recently attracted extensive attention for understanding cancer development. We aimed to demonstrate a genomic and transcriptomic landscape of metabolic reprogramming underlying liver cancer cell lines.
Methods: We investigated metabolic aberrant at both the transcriptome and genome levels using transcriptome and whole-exome sequencing data from 12 human liver cancer cell lines (hLCCLs) and one normal liver cell line.
Results: Three subgroups of hLCCLs characterized from transcriptome sequencing data exhibit significantly different aberrations in various metabolic processes, including amino acid, lipid, energy, and carbohydrate metabolism. Furthermore, whole-exome sequencing revealed distinct mutational signatures among different subgroups of hLCCLs and identified a total of 19 known driver genes implicated in metabolism.
Conclusion: Our findings highlighted differential metabolic mechanisms in the development of liver cancer and provided a resource for further investigating its metabolic mechanisms.
Keywords: human liver cancer cell lines (hLCCLs), transcriptome, whole-exome, sequencing, tumor metabolism
Introduction
Cancer cells may have a high glucose consumption rate and favor glycolysis to produce lactate to promote cell proliferation, even when oxygen is available, as posited in the Warburg effect.1 Accumulating evidence has demonstrated that metabolic reprogramming – the ability of metabolic altered cells – is one of the hallmarks of cancer. Multiple metabolic pathways (eg, energy production, biosynthetic precursor synthesis, and maintenance of redox balance) determine the survival and growth of cancer cells. Reprogrammed metabolic activities promote tumorigenesis by promoting cell proliferation and metastasis and are associated with therapy resistance.2 Alterations in metabolite levels significantly affect cellular signaling, epigenetics, and gene expression through posttranslational modifications, such as acetylation, methylation, and thiol oxidation.3 Understanding metabolic reprogramming provides implications for identifying new therapeutic avenues in cancer.
Liver cancer is one of the most malignant tumors with the fourth most common cancer-related mortality worldwide.4 Risk factors for liver cancer included virus infection (eg, hepatitis B or C virus), toxins (eg, alcohol abuse and aflatoxin exposure), immune factors and metabolic aberrant (eg, nonalcoholic fatty liver disease and diabetes).5 Liver cancer has been described as one of the most transcriptionally altered malignancies6 and demonstrates recurrently dysregulated metabolism.7 DeMatteis et al8 characterized the roles of metabolic aberrations in the development of liver cancer, including increased uptake of glucose and lactate production, alterations in anabolic or catabolic lipid pathways, aberrant amino acid and protein metabolism, imbalance of oxidative metabolism, and metabolic reprogramming of the microenvironment. However, understanding tumor metabolism processes in vivo and identifying metabolic vulnerabilities susceptible to therapeutic targets remains challenging.9
Human cancer-derived cell lines have been widely used to model cancer development and understand underlying molecular mechanisms. Several initiatives, including NCI-60,10 Cancer Cell Line Encyclopedia,11 and Genomics of Drug Sensitivity in Cancer,12 have provided an avenue for determining the molecular environments associated with susceptibility to cancers, discovering cancer biomarkers, and revealing mechanisms of drug action. The liver cancer model repository with 81 human liver cancer cell lines (hLCCLs), representing the heterogeneity of genomic and transcriptomics of liver cancers, has provided a precious resource facilitating drug discovery.13 However, the genomic and transcriptomic characterization of hLCCLs has yet to be fully characterized.
Here, we performed transcriptome and whole-exome sequencing in 12 hLCCLs and one normal hepatic cell line. We aimed to characterize different aberrations in metabolic processes, identify metabolism-associated driver events, and delineate the evolutionary relationship of these hLCCLs.
Materials and Methods
Human Liver Cancer Cell Lines (hLCCLs) and Cell Culture
We collected 12 hLCCLs and a normal hepatic cell line (LO2) (Table 1), including PLC-PRF-5, SK-HEP-1, HCCC9810, Hep3B, and Li-7 (FuHeng Biology Co. Ltd., Shanghai, China), MHCC97-H, MHCC97-L, and HCCLM3 (Labsystech Co. Ltd., Shanghai, China), SMMC-7721 and BEL7404 (Biowing Applied Biotechnology Co., Ltd., Shanghai, China), and HepG2, HuH-7, and LO2 (the Cell Bank of the Chinese Academy of Sciences, Shanghai, China). Information on these cell lines was obtained from the American Type Culture Collection (https://www.atcc.org/) (Table 1). All cell lines were confirmed free of mycoplasma (MycoAlert plus kit; Lonza, Basel, Switzerland), and cell authentication was performed by short tandem repeat profiling. These cell lines were maintained in Dulbecco’s Modified Eagle’s Medium (Hyclone, Logan UT), supplemented with 10% fetal bovine serum (Gibco, Rockville MD) and 5% CO2 at 37°C.
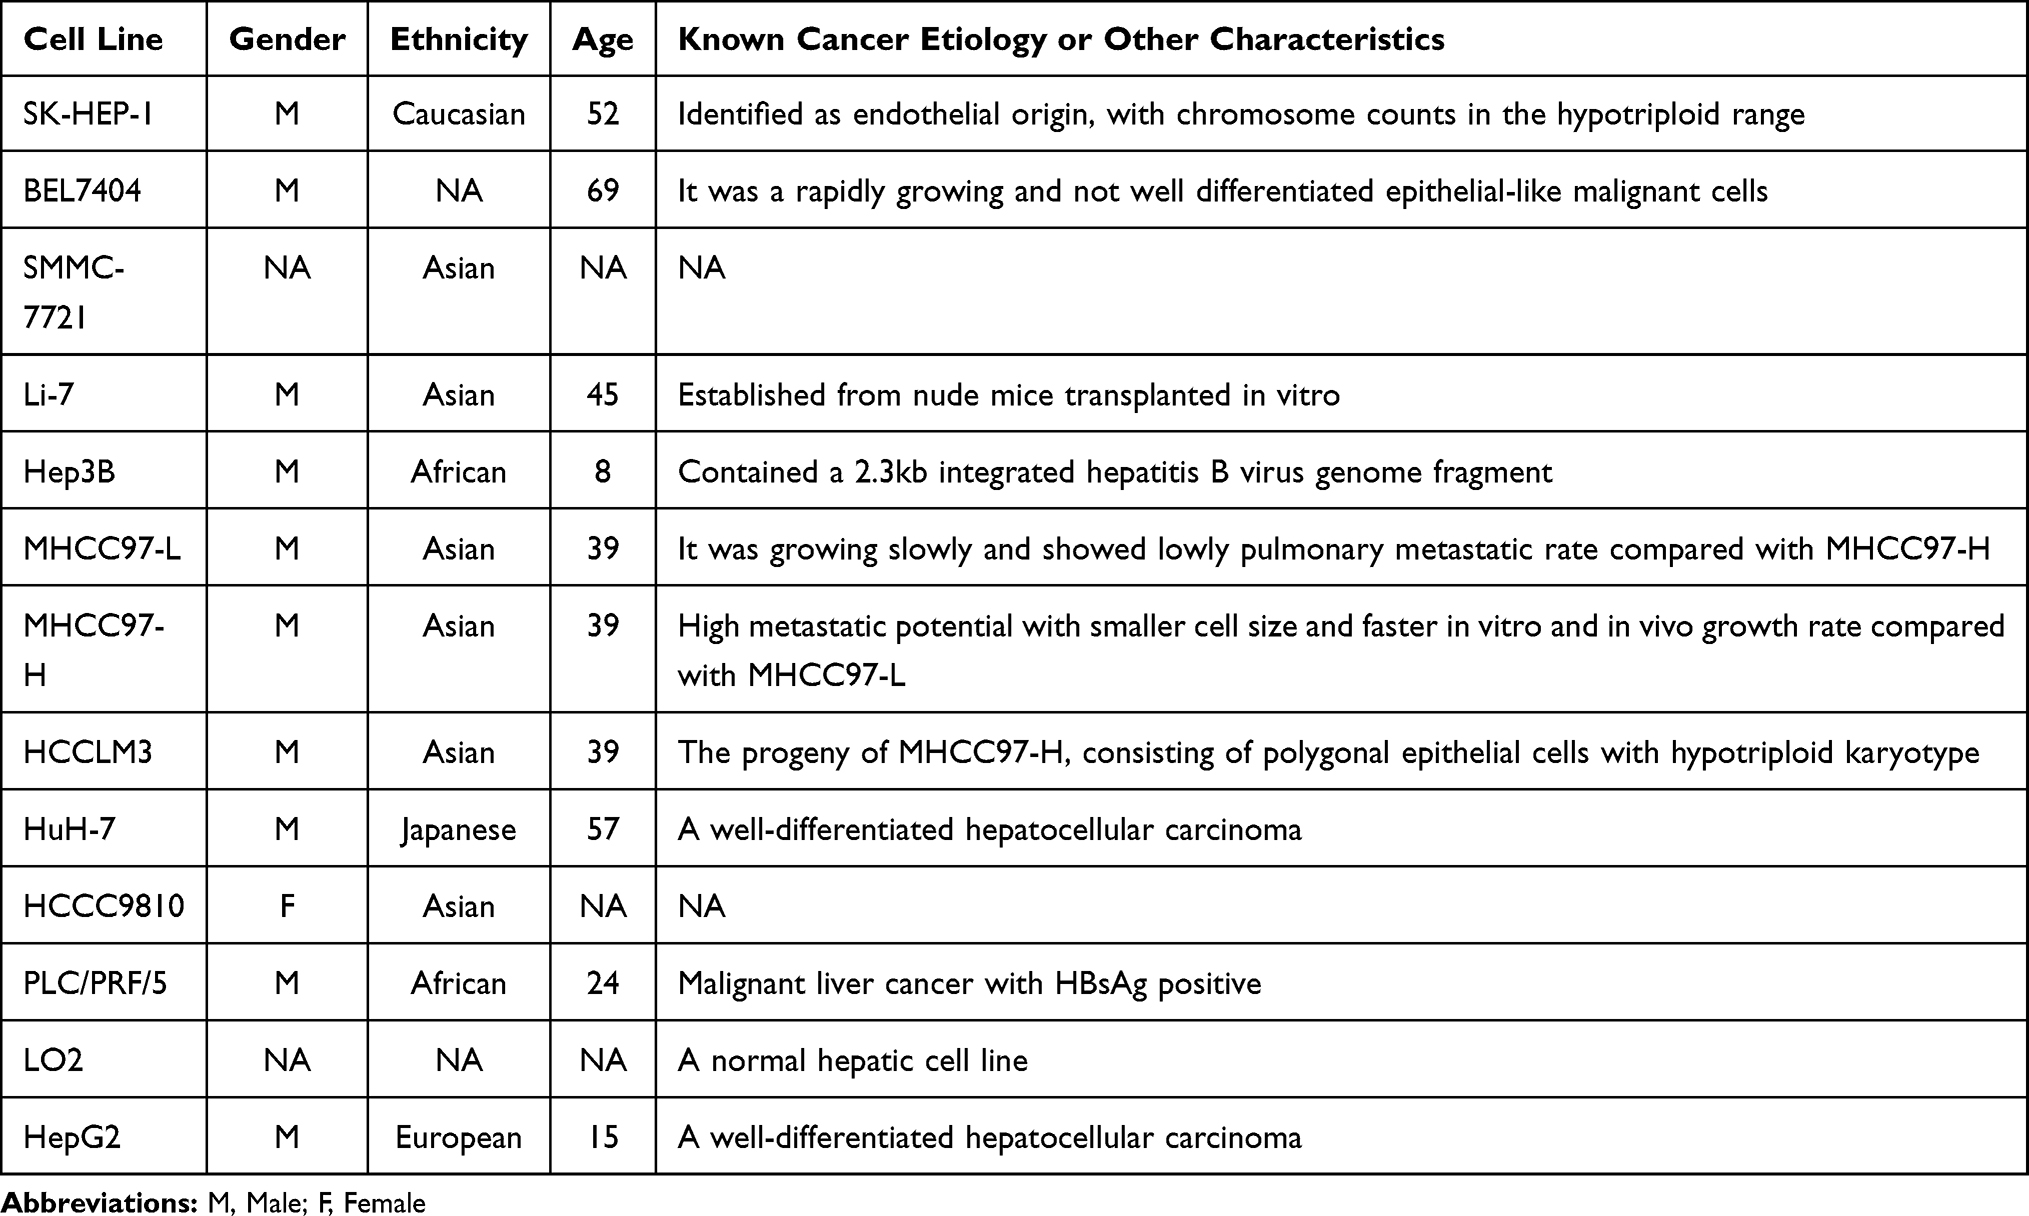 |
Table 1 A List of Human Hepatoma Cell Lines |
RNA-Seq
We assessed the quality of total RNA extracted from 13 cell lines for concentration, RNA purity, and integrity (Bioanalyzer 2100, Agilent Technologies, CA). Strand-specific RNA-seq libraries were constructed using the NEBNext Ultra RNA Library Prep Kit (New England Biolabs Inc., Beverly MA), which was then assessed for the quantification and insert size. Sequencing was conducted on an HiSeq-4000 sequencing platform (Illumina, San Diego, CA) at the Annoroad Gene Technology Corporation (Beijing, China). Each cell line was sequenced in triplicate. A total of 261 GB of data (approximately 6.7 GB per cell line) were generated.
RNA-Seq Data Analysis
Quantification of Transcripts
We used the pipeline used in our previous study to perform RNA-seq data analysis.14 Briefly, sequencing reads were aligned to the human reference genome (hg38), resulting in an average of 99.4% of raw reads that were uniquely mapped to the reference. After removing duplicates, we quantified the expressional level for all transcripts according to gene annotations from Gencode (v22), using the “union” model in HTSeq.
Consensus Clustering and Principal Component Analysis (PCA)
The raw count for transcripts was normalized by the median implemented in DESeq2 package.15 We performed an unsupervised consensus clustering for all hLCCLs using the top 5000 genes with the highest variance of expression levels using the ‘ConsensusClusterPlus’ package in R. The cluster was further confirmed by PCA (the “prcomp” package in R). To identify molecular features characterized in these subgroups, we compiled a list of marker genes for hepatocyte, liver fetal/progenitor, stem cell, epithelial–mesenchymal transition (EMT)/metastasis, and proliferation.16
Gene Set Enrichment and Variation Analysis (GSEA and GSVA)
We identified gene sets associated with metabolic processes using an in-house adaptation of GSEA and MSigDB (v6)17 by utilizing the average of the expression levels in triplicate, which was normalized by DESeq2 from 12 hLCCLs and the normal hepatic cell line. The metabolism-associated gene sets were classified according to the Reactome Pathway Database (false discovery rate < 0.05; abs (normalized enrichment score [NES]) > 1.5).18 We also verified these findings using the “GSVA” package in R, a non-parametric unsupervised method for assessing gene set enrichment.
Weighted Gene Co-Expression Network Analysis (WGCNA)
We performed a WGCNA to identify the metabolism-associated gene network. We selected genes with a weight > 0.15 and identified the top ten genes with the highest degree of connectivity using cytoHubba in Cytoscape.
Validation in TCGA LIHC Cohort
We validated our findings using transcriptome sequencing data from The Cancer Genome Atlas (TCGA) LIHC cohort (https://xenabrowser.net/) and International Cancer Genome Consortium (ICGC) (https://icgc.org/). Differentially expressed genes in the TCGA LIHC cohort were identified using the “limma” package in R (false discovery rate < 0.05). Univariate analysis for the survival with expression levels of metabolism-associated genes was analyzed using the “survival” package in R.
Whole-Exome Sequencing
The quality of DNA extracted from all cell lines was assessed, and sequencing libraries were prepared using the SureSelect Target Enrichment System (Agilent, Santa Clara, CA). We performed whole-exome sequencing on Illumina HiSeq-4000 sequencing platform and generated 30 GB of data (approximately 2.5 GB per cell line) with 150 base paired-end sequences.
Whole-Exome Sequencing Data Analysis
Identification of Somatic Mutations
The somatic mutation calling pipeline was described in detail in our previous study.18 Briefly, sequencing reads were aligned to the human reference genome (hg38). According to the GATK best practice, we removed duplicates, performed realignment around indels, and recalibrated base quality. On average, approximately 99.7% of these sequencing reads were mapped to the reference. We called somatic mutations for each hLCCL using a single tumor mode implemented in Mutect2, where only a single tumor sample was available without a matched normal. We filtered the raw somatic SNVs and small indels using “FilterMutectCalls,” which distinguished somatic mutations from all errors during sample preparation or alignment. We excluded potential germline mutations annotated in the Genome Aggregation Database (gnomAD; http://gnomad.broadinstitute.org/) and annotated somatic mutations using the variant effect predictor (VEP).
Mutational Signature Analysis
We analyzed the somatic mutational signatures to determine their relative contributions according to the known single base substitution (SBS) signatures. First, mutation signatures were calculated based on the 96-trinucleotide mutation count matrix. Then, we characterized the mutational patterns of SBS catalogs using the ‘MutationalPatterns’ package in R. The sigProfiler (ie, the reference SBS signatures) was available from the Catalogue of Somatic Mutations in Cancer (COSMIC) database.19
Statistical Burden Test
We hypothesized that different subgroups of hLCCLs might have different burdens for somatic mutations with high or moderate effects (ie, annotated using VEP) in metabolism-associated genes. We counted these mutations and performed Fisher test to determine if there was a greater burden of qualifying variants in any one of the subgroups as compared to the remaining two subgroups.
Phylogenetic Analysis
We used “treeomics” – a computational tool to reconstruct the phylogeny – to investigate the evolutionary relationships of 12 hLCCLs. Nonsilent mutations were used in the Bayesian inference with a sequencing error rate of 0.01, targeted false-discovery rate was 0.05, and the driver genes list from a previous study.20
Results
RNA-Seq Characterized Three Subgroups of hLCCLs
Of the top 5000 genes with the highest variance in 12 hLCCLs and one normal hepatic cell line (LO2) (Figure 1A), an unsupervised consensus clustering classified these cell lines into three differentiated subgroups (CL1-3) (Figure 1B), confirmed further by PCA (Figure 1C). CL1 included BEL7404, HCCLM3, SMMC-7721, and LO2, showing a mesenchymal-like signature accompanied by more invasive and proliferative behaviors; CL2 included HCCC9810, Li-7, MHCC97-H, MHCC97-L, and SK-HEP-1, demonstrating a mixed “epithelial-mesenchymal” signature; and CL3 contained Hep3B, HepG2, HuH-7, and PLC-PRF-5, exhibiting epithelial feature and hepatoblast-like appearance (Figure 1A and Figure S1). Of note, HCCC9810 and PLC-PRF-5 with cellular origins of intrahepatic cholangiocarcinoma and the hepatoma Alexander cell were clustered into CL2 and CL3, respectively; as well as HCCLM3 and MHCCL97-H with significant metastatic potential were clustered into CL1 and CL2, respectively.
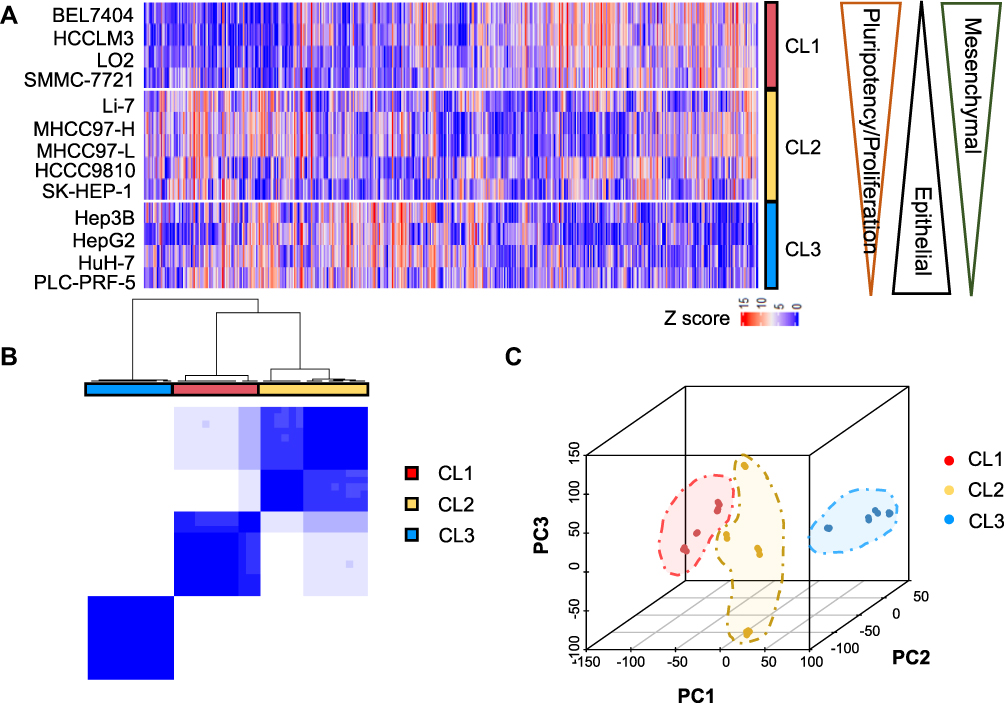 |
Figure 1 The classification of 12 hLCCLs and one normal hepatic cell line using transcriptome sequencing. (A) A heatmap for the top 5000 genes with the highest expression variance in all cell lines. Three subgroups (CL1, CL2, and CL3) were characterized by decreased mesenchymal and pluripotency/proliferation features as well as an increased epithelial feature; (B) The consensus clustering of mRNA expression profiles for the optimal number of clusters at k=3; and (C) Principal component analysis (PCA) confirmed the three subgroups. |
Varied Metabolic Processes Underlying Three Subgroups of hLCCLs
We then investigated whether the expression levels of metabolic gene sets differed significantly among these subgroups. GSEA demonstrated that 42 metabolism-associated gene sets defined in prior differed significantly (false discovery rate, FDR < 0.05). These sets included “cofactors and vitamins,” “energy,” “lipid,” “carbohydrate,” and “amino acid” (Figure 2). Overall, most of these gene sets showed negative normalized enrichment scores (NES) in CL1 and CL2 but positive in CL3, suggesting that different subgroups may have undergone various metabolic aberrations (ie, either promotion or inhibition) in liver cancer development.
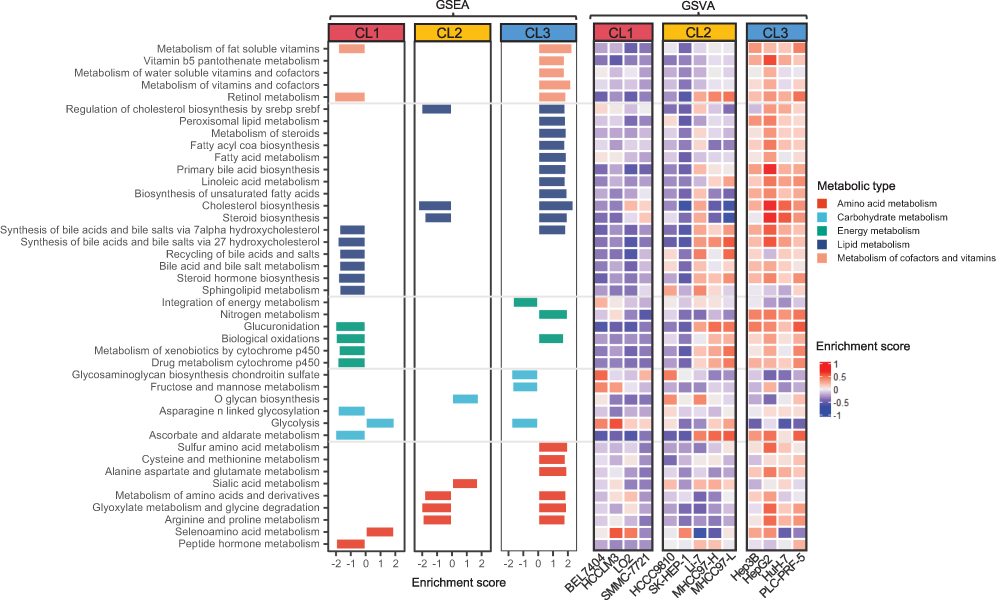 |
Figure 2 Aberrant metabolic pathways in three subgroups of hLCCLs. GSEA showed the metabolic gene sets enriched in each subgroup (FDR < 0.05), further verified using GSVA. Abbreviations: GSEA, gene set enrichment analysis; GSVA, gene set variation analysis. |
The subgroups of CL1 and CL2 showed the majority of down-regulated gene sets, eg, cofactors and vitamins, energy metabolism (CL1), and lipid metabolism (CL1 and CL2). The enrichment of up-regulated genes associated with glycolysis in CL1 was consistent with the Warburg effect. The aberration of lipid metabolism is essential for carcinogenesis that cholesterol biosynthesis maintains cancer cell survival and proliferation.21 The subgroup of CL3 exhibited the most up-regulated gene sets, such as cofactors and vitamins, lipid, and amino acid metabolism, but carbohydrate metabolism was down-regulated partly due to a reduced fructose metabolism. Alanine aspartate and glutamate metabolisms were uniquely enriched in CL3, where glutamine is involved in various biosynthetic steps that make tumor cells proliferate.7 Gene set variation analysis (GSVA) showed that most of the varied metabolism-associated gene sets were consistent with those identified by GSEA (Figure 2). Similarly, most metabolism-associated gene sets were up-regulated in CL3 but reversed in CL1 and CL2.
Metabolism-Associated Hub Genes Associated with Clinical Outcomes
Hub genes are correlated with genes in a given functional module, playing a vital role in biological processes. Using WGCNA, together with metabolic genes from the Reactome Pathway Database,22 we identified the top ten hub genes with the highest degree of connectivity (Figure 3A and Table 2). These genes included three apolipoproteins (APOA1, APOA2, and APOB), two asialoglycoprotein receptors (ASGR1 and ASGR2), one kinase in the rate-limiting step of glycolysis (PKLR), one amnion associated with transmembrane protein (AMN), and three genes related to coagulation (F7, FGG, and CPB2). The vast majority of these genes (except APOA2) were significantly down-regulated in the TCGA LIHC cohort (n=438) (Figure 3B). Three down-regulated genes (F7, CPB2, and APOA1) were significantly associated with poor survival (adjusted p < 0.05) (Figure 3C). However, none of these genes were associated with poor survival in the ICGC LIHC cohort.
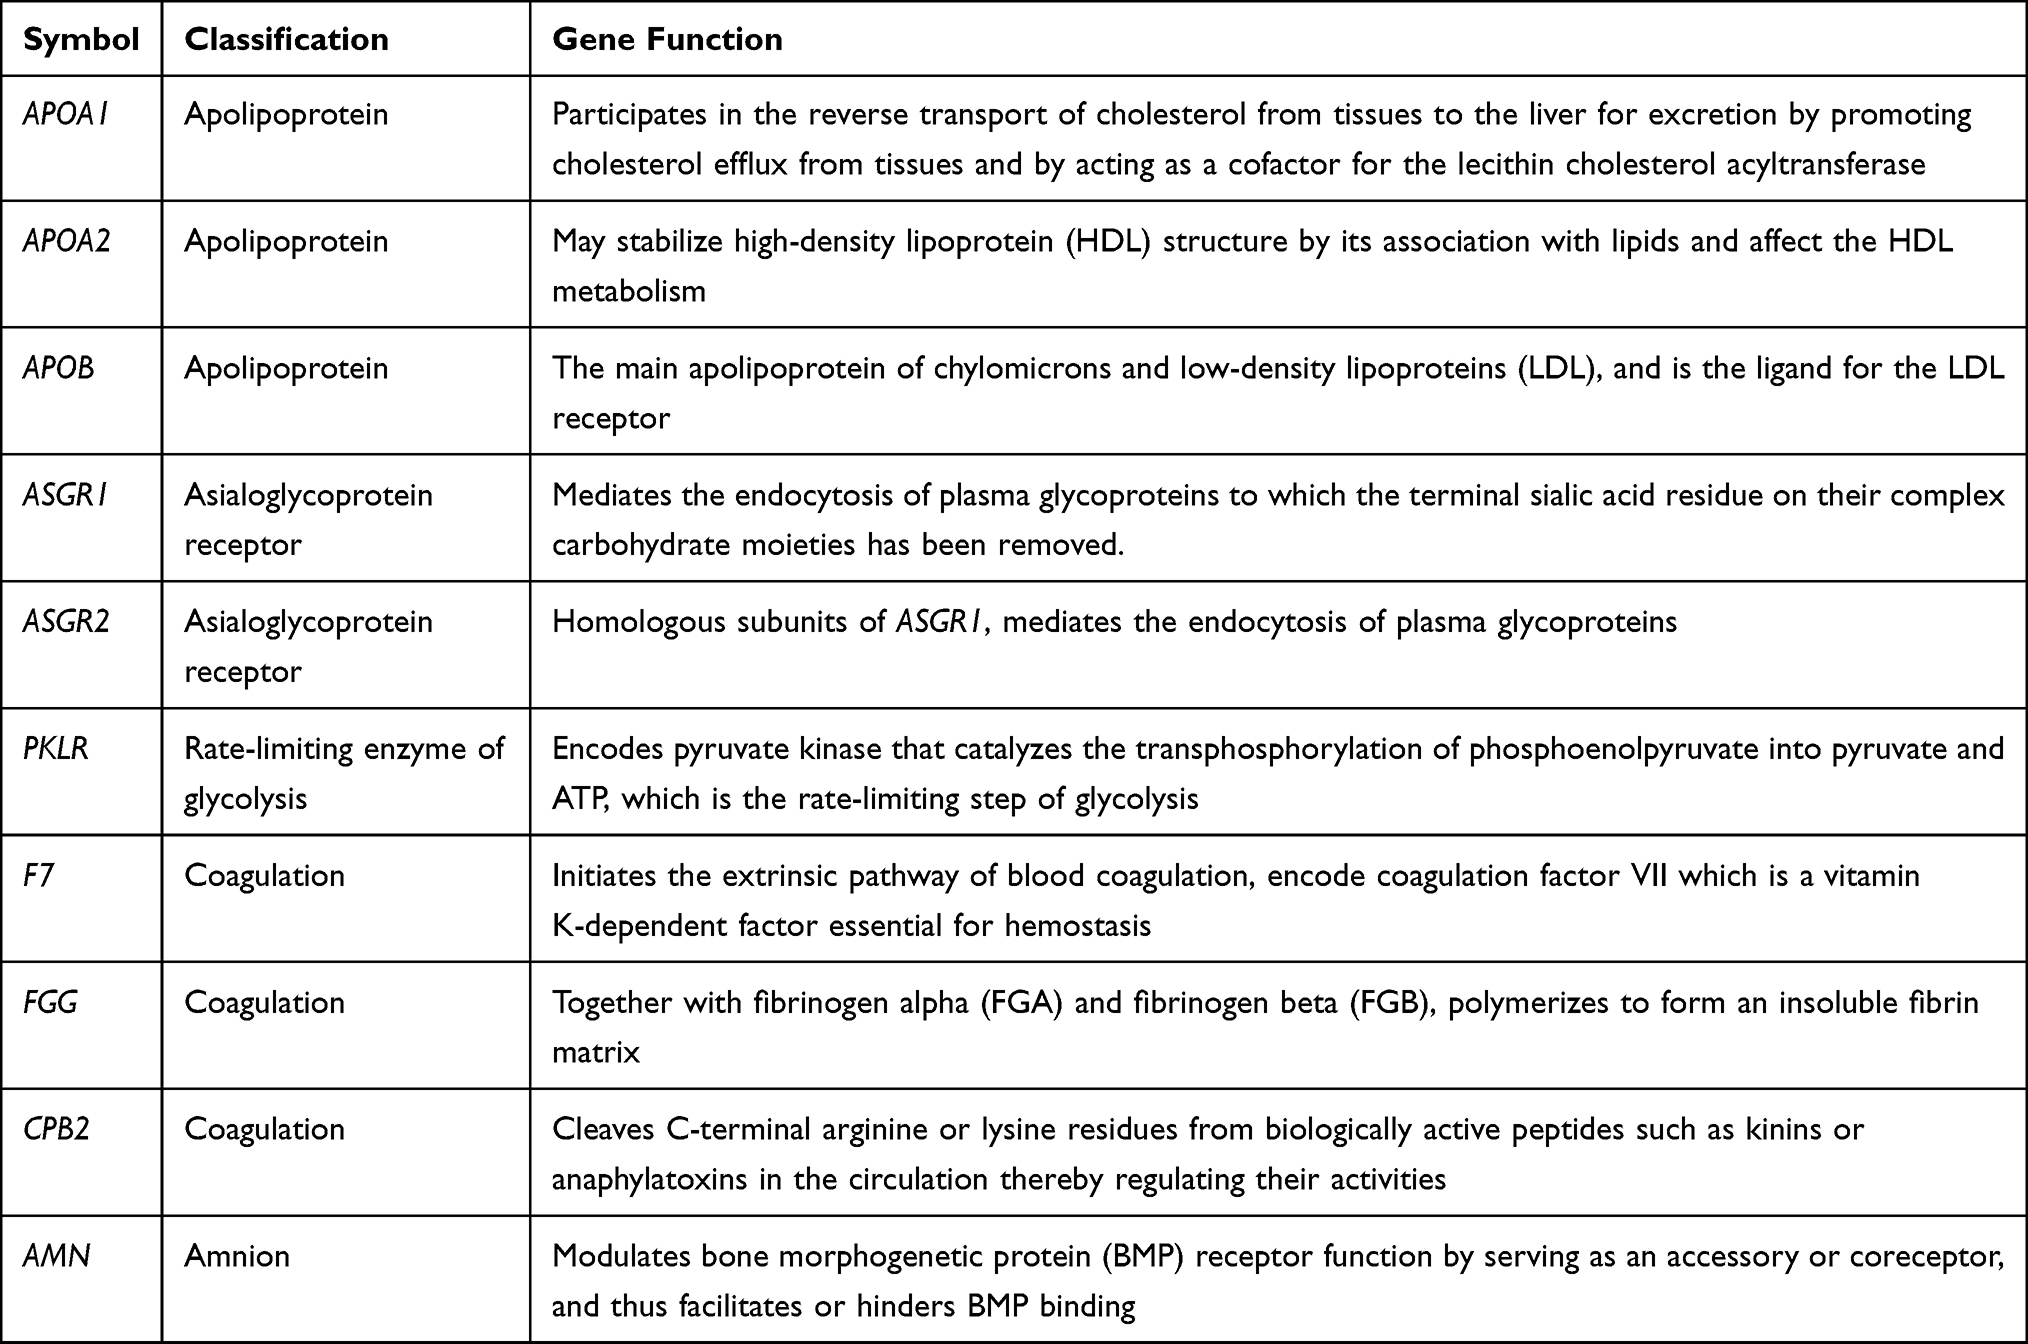 |
Table 2 Information for Metabolic-Related Hub Genes |
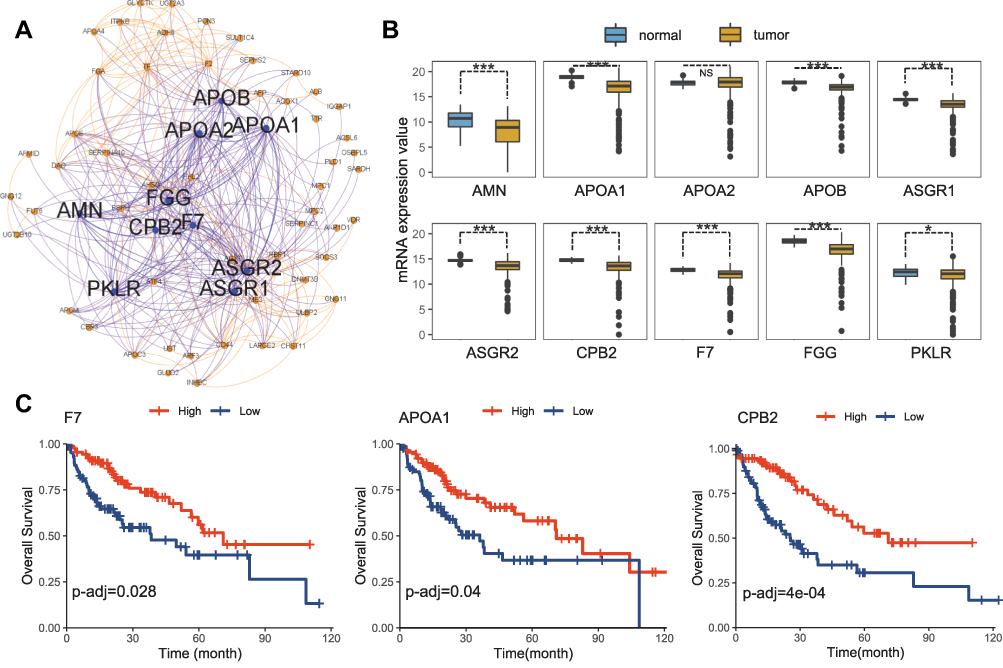 |
Figure 3 Metabolic hub genes identified from hLCCLs. (A) The constructed network based on metabolic genes and the top 10 hub genes was highlighted (https://gephi.org/); (B) difference of the expression levels of the ten hub genes in the TCGA LIHC cohort (n=373) and non-cancerous samples (n=50); and (C) An overall survival analysis for TCGA cohort. *, Adjusted p < 0.05; ***, Adjusted p < 0.001. Abbreviation: NS, not significant. |
The liver is the main organ for the synthesis, storage, transportation, and degradation of apolipoproteins. APOA1 and APOA2 are the major apolipoproteins of the high-density lipoproteins (HDL) and are associated with serum HDL-cholesterol levels. LIHC patients have significantly reduced serum levels of APOA1, and APOA2.23 APOB is a vital glycoprotein that transports very low-density lipoprotein (VLDL) and low-density lipoprotein (LDL) in the liver, which consumes a large amount of cellular energy by promoting VLDL secretion. Inactivating mutations in APOB may promote energy transfer to cancer-related metabolic pathways.24 Asialoglycoprotein receptors (ASGRs) in the liver parenchymal cells participate in the serum protein metabolism. In liver cancer, the decreased number of ASGRs has been considered as an index to evaluate liver function.25 Inhibition of ASGR1 expression promoted the migration and invasion of liver cancer cells in vivo and in vitro, and a lower ASGR1 expression was associated with a higher TNM stage and poor prognosis in liver cancer patients.26 Liver diseases are invariably associated with coagulation disorders. The dysregulation of FGG – one of the three fibrinogen chains – has been identified in many malignant tumors. FGG plays an essential role in enhancing cancer motility and aggressiveness cells via EMT.27 CPB2 is known as a thrombin-activatable fibrinolysis inhibitor, and its inhibition is related to liver fibrosis.28 F7 – the initiator of the extrinsic coagulation pathway – was reported to be associated with cancer and liver diseases, which reflected the metabolic, detoxification, and synthetic capacities of the liver.29 The protein encoded by AMN is a type I transmembrane protein, and the protein complex formed by AMN and CUBN (cubilin) is required for efficient absorption of vitamin B1.30 However, no evidence has reported the association of AMN with liver cancer. PKLR is a driver gene on the cancer development, playing a pivotal role in glycolysis by converting phosphoenolpyruvate to pyruvate.31 PKLR is also related to biological functions in lipid metabolism (eg, steroid biosynthesis, PPAR signaling pathway, fatty acid synthesis, and oxidation) and cell proliferation (eg, DNA replication, cell cycle, and p53 signaling), where the modulation of PKLR may affect the total fat content and cell viability.32
The Prevalence and Mutational Signatures of Nonsilent Somatic Mutations in hLCCLs
The prevalence of somatic mutations ranged from 356 to 1393 (5.48 to 21.43 per MB) across 12 hLCCLs (Figure 4A), consistent with a prevalence of 251 to 3203 in 13 primary hLCCLs.33 Nonnegative matrix factorization (NMF) identified three dominant mutation signatures (Figure 4B), including signature A (characterized by T>C substitution), signature B (T>A), and signature C (C>A). Different subgroups of hLCCLs demonstrated significantly different signatures, eg, signature B was more associated with CL1, whereas signature A frequently contributed to CL2 and CL3. Of note, signature C occurred explicitly in the PLC-PRF-5 cell line (Figure 4C). Single base substitution (SBS) signatures from COSMIC (Figure 4D) showed that several signatures were related to exogenous environment exposures, including SBS7a-d and SBS38, caused by ultraviolet light in all hLCCLs; SBS4 and SBS29, caused by tobacco smoking in HCCC9810, SMMC-7721, and PLC-PRF-5; and SBS24, caused by aflatoxin exposure in PLC-PRF-5. The majority of hLCCLs demonstrated SBSs of endogenous origin, including SBS3, because of defective homologous recombination-based double-strand break DNA repair due to BRCA1 or BRCA2 inactivation34 in eight hLCCLs (excluding BEL7404, SK-HEP-1, Hep3B, and PLC-PRF-5); SBS13, caused by APOBEC cytidine deaminase DNA-editing activity34 (excluding SK-HEP-1, Hep3B, and PLC-PRF-5); SBS30, due to deficiency in base excision repair due to inactivating mutations in NTHL1 in most of the cell lines except SMMC-7721, SK-HEP-1, HuH-7, and PLC-PRF-5, as well as SBS18, due to reactive oxygen species, in SMMC-7721, Li-7, Hep3B, and HuH-7. We also noted that several SBSs with an unknown origin were dominant, eg, a ubiquitous SBS39 in all hLCCLs, SBS40 in 11 hLCCLs, and SBS5 in three hLCCLs, indicating that there may remain uncharacterized mutational etiologies underlying hepatocarcinogenesis.
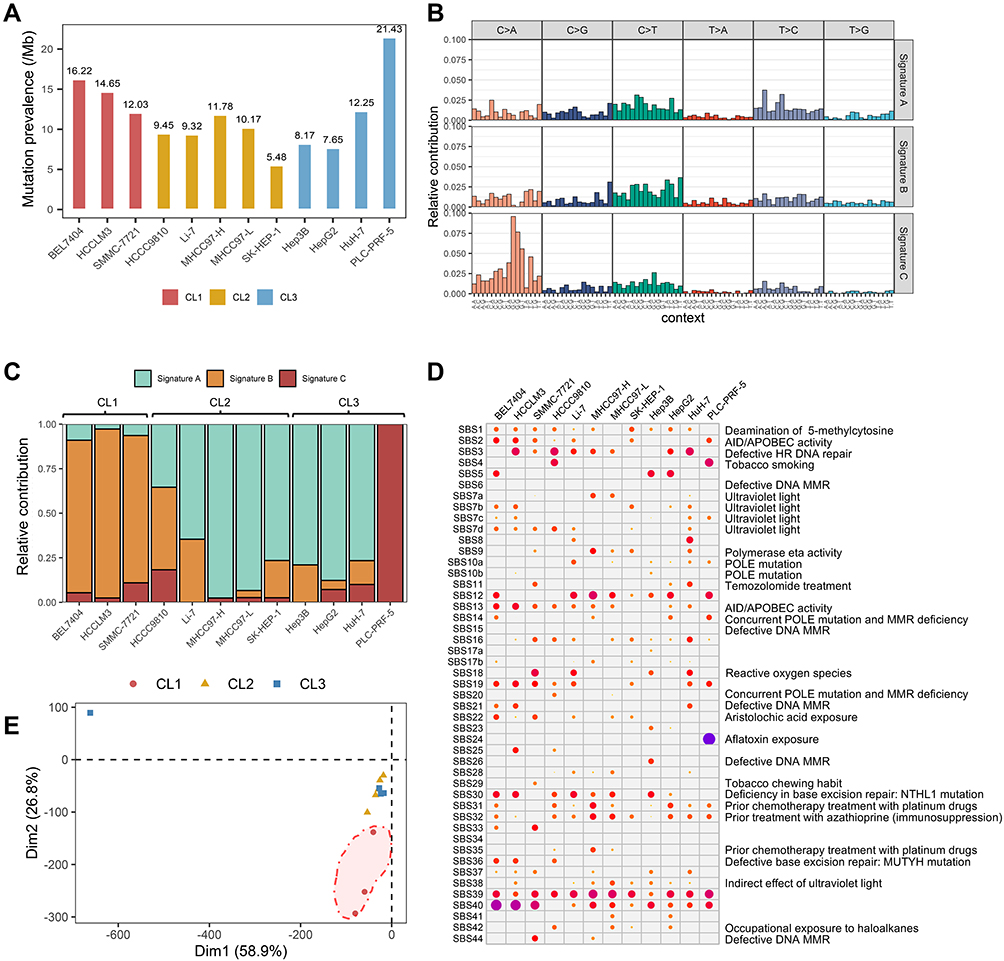 |
Figure 4 The mutational prevalence and signatures in 12 hLCCLs. (A) The prevalence of somatic mutations in 12 LCCLs; (B) the mutational signatures in the hLCCLs genome were shown according to the frequencies of 96 substitution types; (C) contribution of the three mutational signatures; (D) the single base substitution (SBS) signatures in 12 hLCCLs; and (E) PCA for the mutational signatures. |
PCA enabled the classification of these hLCCLs according to SBS signatures (Figure 4E). Overall, CL2 and CL3 were more similar compared with CL1. The PLC-PRF-5 – a hepatoma Alexander cell line producing hepatitis B antigen – indicated a different etiology.
We did not note that the burden of somatic mutations in metabolic genes with high or moderate effects differed significantly in any subgroup compared to the remaining two subgroups under the dominant model.
Mutations in Driver Genes and Metabolic Genes Underlying Different Subgroups
We identified nonsilent somatic mutations in 60 out of 330 driver genes characterized in the PanCancer study (Figure 5A).20 The three most significantly mutated genes were TP53, NOTCH1, and KMT2C. Of driver genes implicated in LIHC,33 mutations in TP53 were present in three hLCCLs (MHCC97-H, MHCC97-L, and PLC-PRF-5) but not in Li-7, HuH-7, and Hep3B, which was characterized previously.16 The vast majority of hLCCLs harbored mutations in multiple genes (eg, APOB, EYS, AXIN1, ARID1A, ARID2, TSC2, and TERT), highlighting that different drivers may underlie liver cancer development. The PLC-PRF-5 presented the most significant number of nonsilent mutations in driver genes.
Of the 19 metabolism-associated driver genes, we noted nonsilent somatic mutations in IDH1 and IDH2 in HCCC9810 and SMMC-7721, respectively. Oncometabolite of D-2-hydroxyglutarate – a reduced form of the TCA cycle intermediate a-ketoglutarate – was generated by these two enzymes in several cancers.35 In PLC-PRF-5, nonsilent mutations in STK11 – encoding a member of the serine/threonine kinase family – may regulate cell polarity. The down-regulated APOB, as noted previously, harbored nonsilent mutations in HCCLM3. AXIN1 – mutated in CL3 – was a critical downstream target for WNT signaling.
Nonsilent mutations were identified in 71 metabolic genes in at least two hLCCLs (Figure S2), including the four most significantly mutated genes of ISCU, SSPO, MUC12, and TP53. A nonsense mutation in ISCU was identified in all hLCCLs, which plays a role in the de novo synthesis of iron-sulfur clusters within mitochondria.36 A frameshift indel in SSPO, which is involved in neuronal aggregation modulation,37 was identified in nine hLCCLs, MUC12 harbored a nonsense mutation in eight hLCCLs, involved in epithelial cell protection, adhesion modulation, and signaling.38 Nonsilent mutations in ADAMTS16, ASB11, and MPDU1 were uniquely identified in CL1.
Phylogenetic Analysis
The phylogenetic analysis allowed us to reconstruct the evolutionary relationship of these hLCCLs (Figure 5B). Three distinct clades were identified, one clade consisting of HCCLM3, SMMC-7721, and BEL7404, consistent with CL1 characterized using RNA-seq data; the clade of MHCC97-H, MHCC97-L, SK-HEP-1, Li-7, and HepG2, similar with CL2; and the clade of HCCC9810, HuH-7, Hep3B, and PLC-PRF-5 were more consistent with CL3. It should be noted that HCCC9810 was classified in CL2 and HepG2 in CL3 in transcriptome-based analysis. Our results suggested that evolutionary relationships among these hLCCLs were mainly associated with the groups characterized by transcriptome sequencing data.
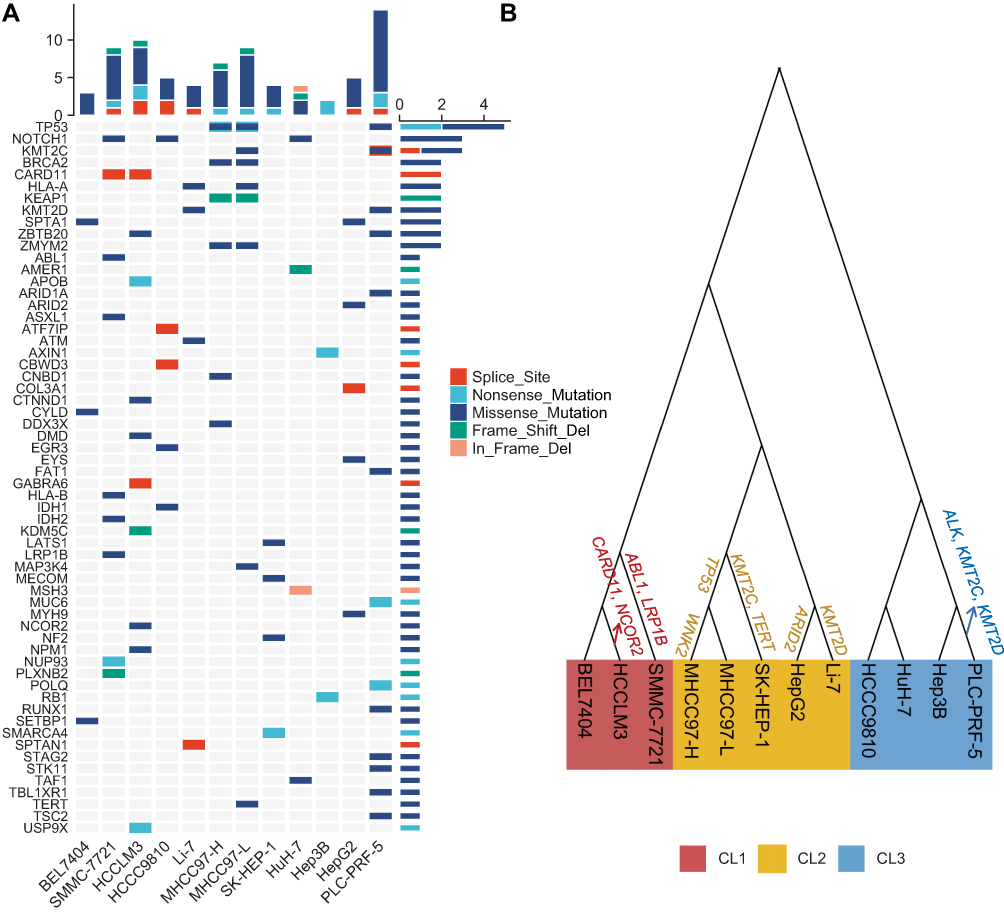 |
Figure 5 Somatic mutations in the known driver genes and the reconstruction of a phylogenetic tree. (A) Mutational landscape of the known driver genes in 12 hLCCLs; and (B) the phylogenetic tree for 12 hLCCLs. Driver genes were shown above the branch. |
Discussion
We characterized the metabolic aberrations for 12 hLCCLs at the genomic and transcriptomic levels in the present study. The 12 hLCCLs were classified into three subgroups according to metabolic features. Our results provide implications for the classifications of LIHC in the context of metabolic aberrations.
An elegant review has summarized the alterations of glucose, nucleotide, urea cycle, amino acid, and lipid metabolism in liver cancer.7 We classified 12 hLCCLs based on their expressional profiles (Figure 1) and further investigated their differences in metabolic characterization (Figure 2). Metabolic heterogeneity in distinct subgroups was evident, for example, subgroup CL3 with a hepatoblast-like appearance demonstrated significantly aberrant metabolic pathways. Increased glucose uptake and enhanced glycolysis rate represent the growth advantages of tumor cells in many cancers, as shown in CL1 with a mesenchymal-like signature that exhibited enhanced glycolysis, but opposite in CL3 with hepatoblast-like features. Another example is PKLR – encoding rate-limiting enzyme, pyruvate kinase, which plays key roles in several critical biological pathways, such as glycolysis and lipid metabolism.39 The reprogramming lipid metabolism plays a vital role in energy consumption, macromolecules for membrane synthesis, and lipid-mediated signaling during cancer progression.21 Glutamine metabolism that was up-regulated in CL3 and down-regulated in CL1 has been widely demonstrated in cancer proliferation and invasion.40
We prioritized ten metabolic-associated hub genes (Figure 3), which have been shown to play significant roles in liver cancer. APOB is a key mediator of hepatocyte function in the secretion of VLDL and blood factors albumin, these functions require a large number of liver cell transcription, translation, and energy resources. Thus, malignant hepatocytes may inhibit this process by enhancing cell division,41 and mutated APOB would transfer energy to cancer-related metabolic pathways.24 APOA1 down-regulated in TCGA LIHC cohort may suggest its potential roles in LIHC. ASGR1 was associated with a poor prognosis in liver cancer patients;26 F7 reflected the metabolic capacities of the liver29 and CPB2 was associated with liver fibrosis. AMN was not reported to be associated with liver cancer, and further research is needed to investigate its roles in liver cancer. Three hub genes (F7, APOA1, and CPB2) were significantly associated with poor survival, which may be taken as potential metabolic-associated biomarkers for liver cancer.
We characterized three mutational signatures underlying these hLCCLs (Figure 4). One signature C (characterized C>A mutations) was predominant in CL3, whereas signature A was predominant in CL2 and signature B in CL1. These correlations may highlight the mutation diversity among subgroups, which significantly affect the composition and behavior of the tumor genome. Mutational signatures can provide substantial resources for exploring the mutational process during cancer development. For example, the unknown origins of SBS39 and SBS40 were evident but not characterized previously in liver cancer.42 The mutational signature associated with uncharacterized mutational etiologies may have implications for our understanding of the mutation process in liver cancer.
Metabolism-associated genes drove liver cancer development (Figure 5A). Satriano et al7 reported that genomic alterations such as mutations in TP53 (31% of patients), APOB (10%), and MYC (15%), as well as amplification in ALB (13%), could alter glycolysis, which further altered pentose phosphate pathway, lipid, and serine metabolism in liver cancer. Our study confirmed that nonsilent mutations in TP53 (25%) and APOB (8%) contributed to glucose and glutamine metabolism changes. AXIN1 – a key factor for Wnt signaling – is likely to function as a tumor suppressor, and its mutation (8%) was involved in hepatocarcinogenesis.43 Mutations in TSC2 could negatively regulate mTORC1 signaling,44 contributing to carcinogenesis and metastasis,45 as noted that mutations in TSC2 (8%) occurred in CL3. We showed an increased mutational prevalence in NOTCH1 (25%) and KMT2C (17%). NOTCH1 was reported to induce pathways involved in proliferation, cell apoptosis and invasiveness of liver cancer.46 In mice, the expression of NOTCH1 was regulated by ABL1, and the loss or inhibition of ABL1 (eg, mutated) reduced the proliferation of liver cancer cells and delayed the tumor growth.47 KMT2C, epigenetic regulators, which mutated more than 50% of LIHC, also mutated in liver metastases.48 Nonsilent mutations in the most significant metabolic genes (ISCU, SSPO, MUC12, and TP53) (Figure S2) suggested that these genes may be associated with liver cancer development.
A metabolic model illustrated the transcriptomic alterations and somatic mutations that may underlie the liver cancer development based on the sequenced hLCCLs (Figure 6). The mutated metabolism-associated driver genes (eg, TP53, IDH1, and IDH2) may dramatically change the metabolic pathways. Glucose can provide carbon units for each significant building block by accelerating glycolysis, tricarboxylic acid cycle, and pentose phosphate pathway.49 Pyruvate – the production of fructose metabolism and glycolysis – can promote the invasion and migration of breast cancer cells.50 Similarly, the fructose metabolism and glycolysis were down-regulated in CL3 but up-regulated in CL1, indicating that the pyruvate may also promote the tumor invasion and proliferation in different ways. Cholesterol biosynthesis was down-regulated in CL2 but opposite in CL3, which was regulated by SREBP, and its conversion to steroid hormones, vitamin D, bile acid and bile salt was down-regulated in CL1. The alteration of metabolism of amino acids was also demonstrated, eg, an increased cysteine belongs to sulfur and selenium amino acid in liver cancer. The sulfur amino acid and selenoamino acid metabolisms were up-regulated in CL3 and CL1, respectively. These findings highlighted that aberrant metabolic pathways in different subgroups may better understand the mechanisms that underlie cancer maintenance and progression.
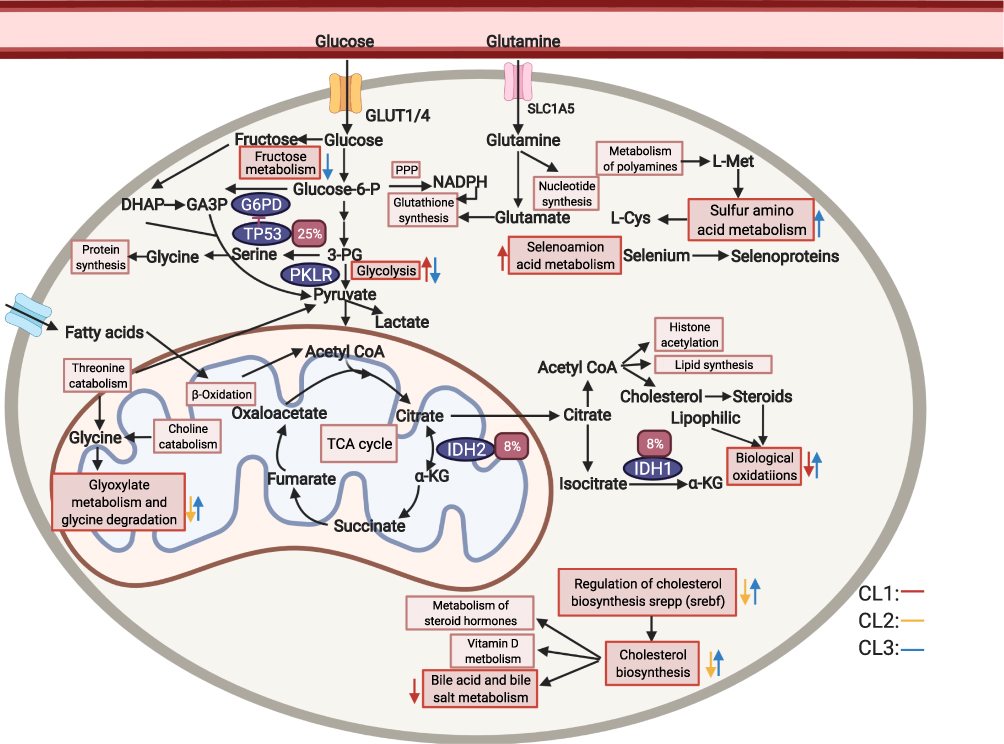 |
Figure 6 A model of LIHC metabolism in 12 hLCCLs based on RNA and genomic mutations. Glucose and glutamine are utilized in different pathways to generate cofactors and intermediates that the cell then utilizes for biosynthesis 49. Different colors for arrows represent three subgroups. The direction of a colored arrow represents up-regulated or down-regulated in one subgroup, compared with the remaining two subgroups. The red rectangle represents somatic mutation frequency. The rectangle represents different pathways, and the oval represents the driver genes. The figure was created with the support of https://biorender.com under the paid subscription. Abbreviations: PPP, pentose phosphate pathway; TCA cycle, tricarboxylic acid cycle. |
There remained several limitations in the present study. First, only 12 hLCCLs were sequenced, and more hLCCLs should be included. However, most of these cell lines were generated decades ago, lacking proper control or clinical annotations, and new mutations were generated spontaneously in the passage.13 Second, identifying somatic mutations in cell lines remains challenging due to the lack of a paired normal sample, and filtering germline mutations may not be enough to guarantee the accuracy of the identified somatic mutations. Finally, more genetic features (eg, copy number variation, and metabonomic analysis) should be incorporated further.
Conclusion
We combined transcriptome and whole-exome sequencing to characterize the metabolic aberrant and identify somatic mutations in metabolism-associated driver genes in hLCCLs. We present a powerful resource for understanding the metabolism of liver cancer and provide potential avenue for future therapeutic efforts.
Abbreviations
LIHC, hepatocellular carcinoma; hLCCLs, human liver cancer cell lines; PCA, principal component analysis; EMT, epithelial–mesenchymal transition; GSEA, Gene Set Enrichment Analysis; GSVA, Gene Set Variation Analysis; WGCNA, Weighted correlation network analysis; TCGA, The Cancer Genome Atlas; ICGC, International Cancer Genome Consortium; VEP, variant effect predictor; SBS, single base substitution; COSMIC, Catalogue of Somatic Mutations in Cancer; FDR, false discovery rate; NES, normalized enrichment scores; HDL, high-density lipoproteins; VLDL, very low-density lipoprotein; LDL, low-density lipoprotein; ASGRs, Asialoglycoprotein receptors; TNM, tumor-node-metastasis; NMF, Nonnegative matrix factorization.
Data Sharing Statement
Data is available upon reasonable request.
Ethics Approval and Informed Consent
Not applicable.
Consent for Publication
All authors approved the final manuscript.
Funding
This work was funded by the program of Artificial Intelligence in Medicine of CQ CSTC (ZHYX2019004, KD).
Disclosure
All authors declare no conflicts of interest.
References
1. Warburg O. On the origin of cancer cells. Science (New York, NY). 1956;123(3191):309–314. doi:10.1126/science.123.3191.309
2. Phan LM, Yeung SCJ, Lee MH. Cancer metabolic reprogramming: importance, main features, and potentials for precise targeted anti-cancer therapies. Cancer Biol Med. 2014;11:1–19.
3. De Berardinis RJ, Chandel NS. Fundamentals of cancer metabolism. Sci Advan. 2016;2:e1600200.
4. Bray F, Ferlay J, Soerjomataram I, Siegel RL, Torre LA, Jemal A. Global cancer statistics 2018: GLOBOCAN estimates of incidence and mortality worldwide for 36 cancers in 185 countries. CA Cancer J Clin. 2018;68:394–424.
5. Villanueva A. Hepatocellular carcinoma. N Engl J Med. 2019;380:1450–1462. doi:10.1056/NEJMra1713263
6. Uhlen M, Zhang C, Lee S, et al. A pathology atlas of the human cancer transcriptome. Science. 2017;18:357.
7. Satriano L, Lewinska M, Rodrigues PM, Banales JM, Andersen JB. Metabolic rearrangements in primary liver cancers: cause and consequences. Nat Rev Gastroenterol Hepatol. 2019;16:748–766. doi:10.1038/s41575-019-0217-8
8. De Matteis S, Ragusa A, Marisi G, et al. Aberrant metabolism in hepatocellular carcinoma provides diagnostic and therapeutic opportunities. Oxid Med Cell Longev. 2018;2018. doi:10.1155/2018/7512159
9. Kim J, DeBerardinis RJ. Mechanisms and implications of metabolic heterogeneity in cancer. Cell Metab. 2019;30:434–446. doi:10.1016/j.cmet.2019.08.013
10. Shoemaker R, Robert HS. The NCI60 human tumour cell line anticancer drug screen. Nat Rev Cancer. 2006;6:813–823. doi:10.1038/nrc1951
11. Barretina J, Caponigro G, Stransky N, et al. The cancer cell line encyclopedia enables predictive modelling of anticancer drug sensitivity. Nature. 2012;483:603–607. doi:10.1038/nature11003
12. Garnett MJ, Edelman EJ, Heidorn SJ, et al. Systematic identification of genomic markers of drug sensitivity in cancer cells. Nature. 2012;483:570–575. doi:10.1038/nature11005
13. Qiu Z, Li H, Zhang Z, et al. A pharmacogenomic landscape in human liver cancers. Cancer Cell. 2019;36:179–193.e11. doi:10.1016/j.ccell.2019.07.001
14. Tang X, Feng D, Li M, et al. Transcriptomic analysis of mRNA-lncRNA-miRNA interactions in hepatocellular carcinoma. Sci Rep. 2019;9:1–12. doi:10.1038/s41598-019-52559-x
15. Love MI, Huber W, Anders S. Moderated estimation of fold change and dispersion for RNA-seq data with DESeq2. Genome Biol. 2014;15:1–21.
16. Caruso S, Calatayud AL, Pilet J, et al. Analysis of liver cancer cell lines identifies agents with likely efficacy against hepatocellular carcinoma and markers of response. Gastroenterology. 2019;157:760–776. doi:10.1053/j.gastro.2019.05.001
17. Liberzon A, Subramanian A, Pinchback R, Thorvaldsdóttir H, Tamayo P, Mesirov JP. Molecular signatures database (MSigDB) 3.0. Bioinformatics. 2011;27:1739–1740. doi:10.1093/bioinformatics/btr260
18. Zhang G, Tang X, Liang L, et al. DNA and RNA sequencing identified a novel oncogene VPS35 in liver hepatocellular carcinoma. Oncogene. 2020;39:3229–3244. doi:10.1038/s41388-020-1215-6
19. Tate JG, Bamford S, Jubb HC, et al. COSMIC: the catalogue of somatic mutations in cancer. Nucleic Acids Res. 2019;47:D941–D947. doi:10.1093/nar/gky1015
20. Bailey MH, Tokheim C, Porta-Pardo E, et al. Comprehensive characterization of cancer driver genes and mutations. Cell. 2018;173:371–385.
21. Riscal R, Skuli N, Simon MC. Even cancer cells watch their cholesterol! Mol Cell. 2019;76:220–231.
22. Fabregat A, Jupe S, Matthews L, et al. The reactome pathway knowledgebase. Nucleic Acids Res. 2018;46:D649–D655. doi:10.1093/nar/gkx1132
23. Sadato F, Shunichi K, Tetsuro S, Kyosuke Y, Hiroshi I. Serum apoprotein A-I and A-II levels in liver diseases and cholestasis. Clinica Chimica Acta. 1981;115:321–331. doi:10.1016/0009-8981(81)90245-X
24. Fernandez-Banet J, Lee NP, Chan KT, et al. Decoding complex patterns of genomic rearrangement in hepatocellular carcinoma. Genomics. 2014;103:189–203. doi:10.1016/j.ygeno.2014.01.003
25. Yang W, Zhang X, Liu Y. Asialoglycoprotein receptor-targeted radiopharmaceuticals for measurement of liver function. Curr Med Chem. 2013;21:4–23. doi:10.2174/09298673113209990213
26. Gu D, Jin H, Jin G, et al. The asialoglycoprotein receptor suppresses the metastasis of hepatocellular carcinoma via LASS2-mediated inhibition of V-ATPase activity. Cancer Lett. 2016;379:107–116. doi:10.1016/j.canlet.2016.05.030
27. Zhang X, Wang F, Huang Y, et al. FGG promotes migration and invasion in hepatocellular carcinoma cells through activating epithelial to mesenchymal transition. Cancer Manag Res. 2019;11:1653–1665.
28. Dai YN, Tu YX, Meng D, et al. Serum proteomic changes as candidate biomarkers of intermediate liver fibrosis in chronic Hepatitis B infection. OMICS a J Integrative Biol. 2019;23:167–179. doi:10.1089/omi.2018.0179
29. Guzman‐Lepe J, Cervantes‐Alvarez E, Collin de l’Hortet A, et al. Liver‐enriched transcription factor expression relates to chronic hepatic failure in humans. Hepatol Commun. 2018;2:582–594. doi:10.1002/hep4.1172
30. Pannérec A, Migliavacca E, De Castro A, et al. Vitamin B12 deficiency and impaired expression of amnionless during aging. J Cachexia Sarcopenia Muscle. 2018;9:41–52. doi:10.1002/jcsm.12260
31. Lee S, Zhang C, Liu Z, et al. Network analyses identify liver‐specific targets for treating liver diseases. Mol Syst Biol. 2017;13:938. doi:10.15252/msb.20177703
32. Liu Z, Zhang C, Lee S, et al. Pyruvate kinase L/R is a regulator of lipid metabolism and mitochondrial function. Metab Eng. 2019;52:263–272. doi:10.1016/j.ymben.2019.01.001
33. Akiba J, Ogasawara S, Fukushima H, Oie S, Yano H. Whole-exome sequencing: 13 primary liver cancer cell lines established in our laboratory. Ann Oncol. 2019;30:iv11. doi:10.1093/annonc/mdz155.037
34. Nik-Zainal S, Alexandrov LB, Wedge DC, et al. Mutational processes molding the genomes of 21 breast cancers. Cell. 2012;149:979–993. doi:10.1016/j.cell.2012.04.024
35. Visvader JE. Cells of origin in cancer. Nature. 2011;469:314–322. doi:10.1038/nature09781
36. Tong WH, Rouault T. Distinct iron-sulfur cluster assembly complexes exist in the cytosol and mitochondria of human cells. EMBO J. 2000;19:5692–5700. doi:10.1093/emboj/19.21.5692
37. Gobron S, Creveaux I, Meiniel R, et al. Subcommissural organ/Reissner’s fiber complex: characterization of SCO-spondin, a glycoprotein with potent activity on neurite outgrowth. Glia. 2000;32:177–191. doi:10.1002/1098-1136(200011)32:2<177::AID-GLIA70>3.0.CO;2-V
38. Moehle C, Ackermann N, Langmann T, et al. Aberrant intestinal expression and allelic variants of mucin genes associated with inflammatory bowel disease. J Mol Med. 2006;84:1055–1066. doi:10.1007/s00109-006-0100-2
39. Lewis GF, Rader DJ. New insights into the regulation of HDL metabolism and reverse cholesterol transport. Circ Res. 2005;96:1221–1232. doi:10.1161/01.RES.0000170946.56981.5c
40. Bergers G, Fendt S-M. The metabolism of cancer cells during metastasis. Nat Rev Cancer. 2021;1–19:162–80.
41. Ally A, Balasundaram M, Carlsen R, et al. Comprehensive and integrative genomic characterization of hepatocellular carcinoma. Cell. 2017;169:1327–1341.e23. doi:10.1016/j.cell.2017.05.046
42. Petljak M, Alexandrov LB, Brammeld JS, et al. Characterizing mutational signatures in human cancer cell lines reveals episodic APOBEC mutagenesis. Cell. 2019;176:1282–1294.e20. doi:10.1016/j.cell.2019.02.012
43. Satoh S, Daigo Y, Furukawa Y, et al. AXIN1 mutations in hepatocellular carcinomas, and growth suppression in cancer cells by virus-mediated transfer of AXIN1. Nat Genet. 2000;24:245–250. doi:10.1038/73448
44. Tee AR, Fingar DC, Manning BD, Kwiatkowski DJ, Cantley LC, Blenis J. Tuberous sclerosis complex-1 and −2 gene products function together to inhibit mammalian target of rapamycin (mTOR)-mediated downstream signaling. Proc Natl Acad Sci U S A. 2002;99:13571–13576. doi:10.1073/pnas.202476899
45. Dong P, Wang X, Liu L, et al. Dampened VEPH1 activates mTORC1 signaling by weakening the TSC1/TSC2 association in hepatocellular carcinoma. J Hepatol. 2020;73:1446–1459. doi:10.1016/j.jhep.2020.06.027
46. Sui C, Zhuang C, Sun D, Yang L, Zhang L, Song L. Notch1 regulates the JNK signaling pathway and increases apoptosis in hepatocellular carcinoma. Oncotarget. 2017;8:45837–45847. doi:10.18632/oncotarget.17434
47. Wang F, Hou W, Chitsike L, et al. ABL1, overexpressed in hepatocellular carcinomas, regulates expression of NOTCH1 and promotes development of liver tumors in mice. Gastroenterology. 2020;159:289–305.e16. doi:10.1053/j.gastro.2020.03.013
48. Anjanappa M, Hao Y, Simpson ER, et al. A system for detecting high impact-low frequency mutations in primary tumors and metastases. Oncogene. 2018;37:185–196. doi:10.1038/onc.2017.322
49. Benzarti M, Delbrouck C, Neises L, Kiweler N, Meiser J. Metabolic potential of cancer cells in context of the metastatic cascade. Cells. 2020;9:1–25. doi:10.3390/cells9092035
50. Christen S, Lorendeau D, Schmieder R, et al. Breast cancer-derived lung metastases show increased pyruvate carboxylase-dependent anaplerosis. Cell Rep. 2016;17:837–848. doi:10.1016/j.celrep.2016.09.042
 © 2021 The Author(s). This work is published and licensed by Dove Medical Press Limited. The full terms of this license are available at https://www.dovepress.com/terms.php and incorporate the Creative Commons Attribution - Non Commercial (unported, v3.0) License.
By accessing the work you hereby accept the Terms. Non-commercial uses of the work are permitted without any further permission from Dove Medical Press Limited, provided the work is properly attributed. For permission for commercial use of this work, please see paragraphs 4.2 and 5 of our Terms.
© 2021 The Author(s). This work is published and licensed by Dove Medical Press Limited. The full terms of this license are available at https://www.dovepress.com/terms.php and incorporate the Creative Commons Attribution - Non Commercial (unported, v3.0) License.
By accessing the work you hereby accept the Terms. Non-commercial uses of the work are permitted without any further permission from Dove Medical Press Limited, provided the work is properly attributed. For permission for commercial use of this work, please see paragraphs 4.2 and 5 of our Terms.